
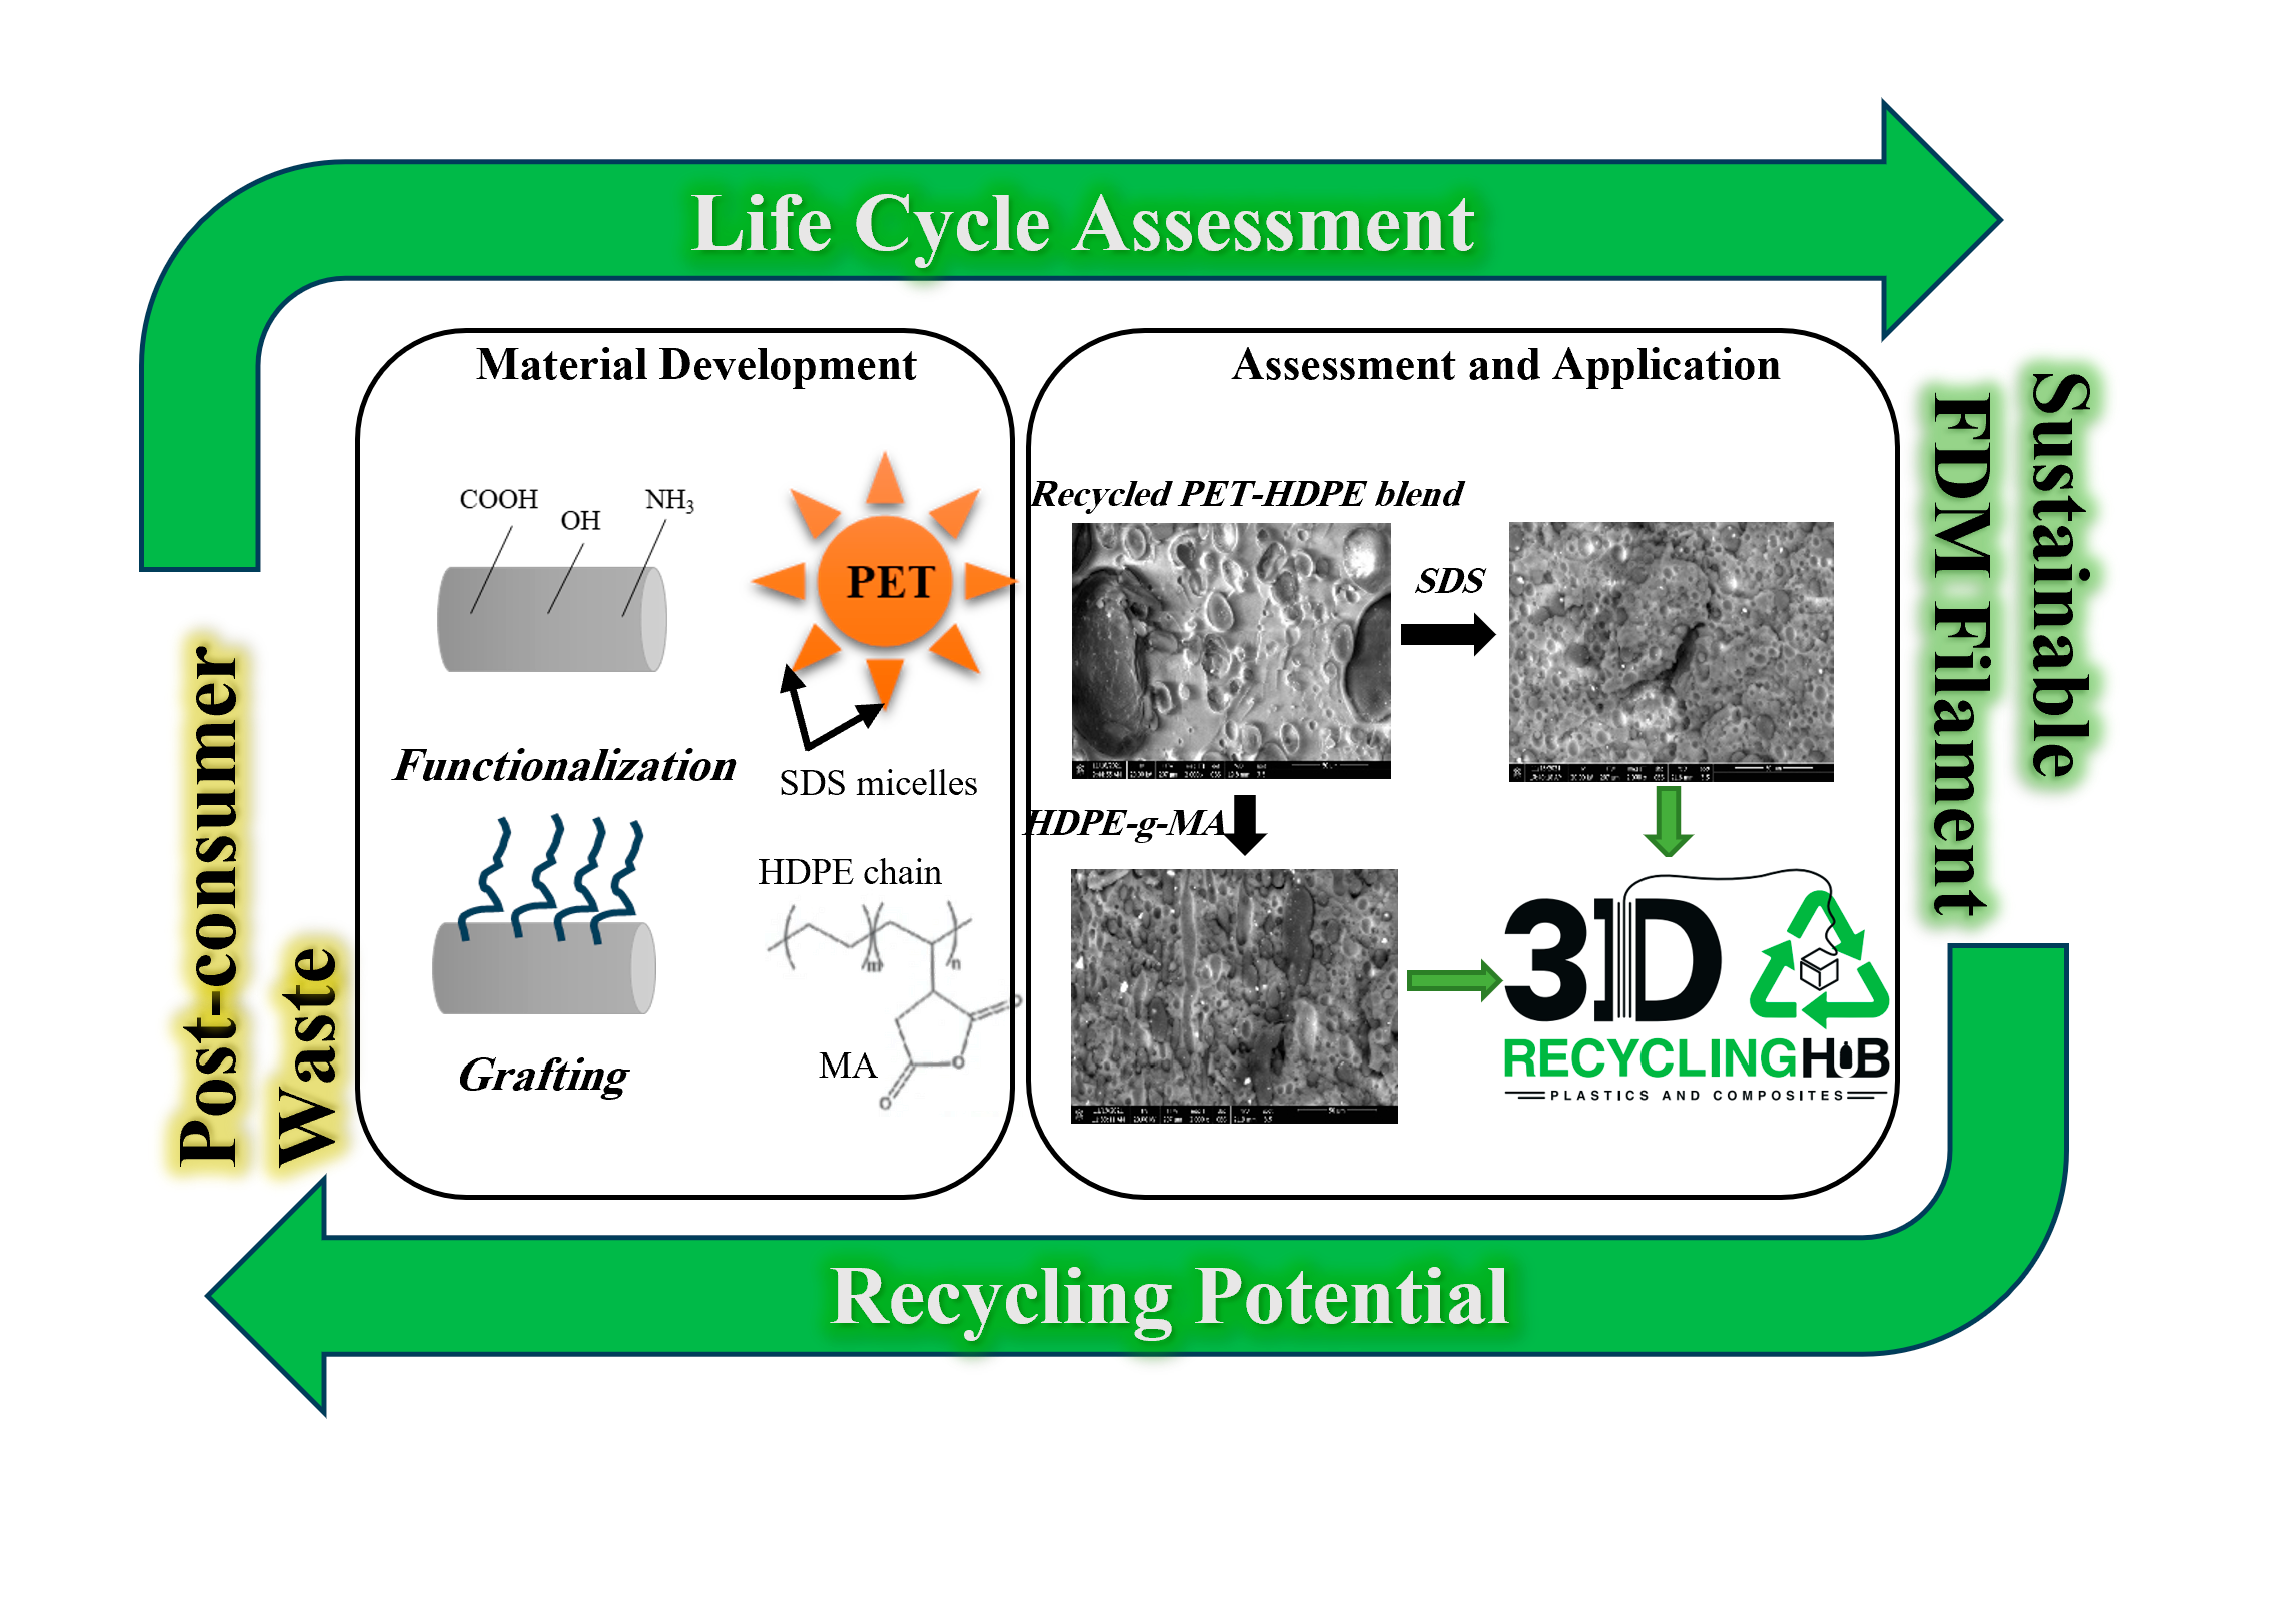
Plastic Waste Valorization for Fused Deposition Modeling Feedstock: A Case Study on Recycled Polyethylene Terephthalate/High-Density Polyethylene Sustainability


Abstract
:
1. Introduction
2. Materials and Methods
2.1. Material Development
2.1.1. Materials
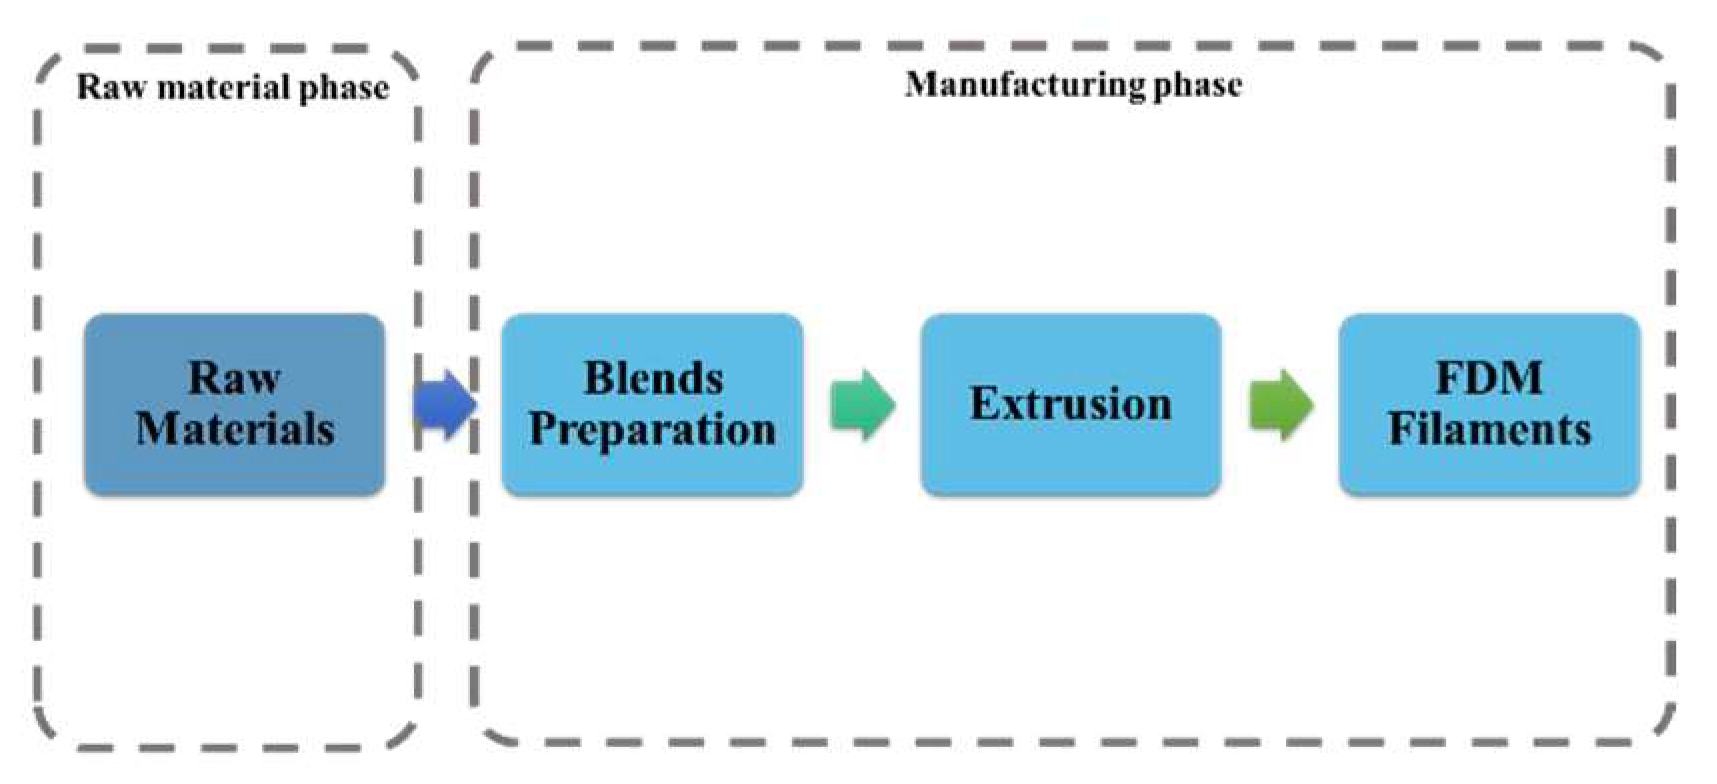
2.1.2. Blends Preparation
- Compatibilization Track
- Surface Functionalization Track
- Hybridization Track
- Reinforced Blends
2.1.3. Characterization
- Thermal Characterization
- Morphological Examination
- Mechanical Characterization
- Tensile Test
- Impact Test
2.1.4. Filament Extrusion and Assessment
- 3D Printing and Printability Assessment
- Cost Comparison of Materials
2.2. Life Cycle Assessment (LCA)
2.2.1. Goal and Scope Definition
2.2.2. Functional Unit and System Boundary
2.2.3. Life Cycle Inventory (LCI)
2.2.4. Life Cycle Impact Assessment (LCIA)
3. Results
3.1. Material Development
3.1.1. Thermal Characterization
- DSC

| HDPE | PET | ||||||||||
|---|---|---|---|---|---|---|---|---|---|---|---|
| Blend | Tm (°C) | ΔHm (J/g) | Tc (°C) | ΔHc (J/g) | %Xc | Tm (°C) | ΔHm (J/g) | Tc (°C) | ΔHc (J/g) | %Xc | Tg (°C) |
| R–control | 132.24 | 37.96 | 117.97 | 50.22 | 64.8 | 251.46 | 17.21 | 203.15 | 24.64 | 18.0 | 79.45 |
| SDS | 132.08 | 23.87 | 118.35 | 25.22 | 40.7 | 251.03 | 27.09 | 212.35 | 38.81 | 28.3 | 77.96 |
| GMA | 133.82 | 14.47 | 117.27 | 15.05 | 24.7 | 252.47 | 21.98 | 198.8 | 26.26 | 22.9 | 81.58 |
| GMA—SDS | 132.8 | 15.49 | 117.42 | 14.28 | 26.4 | 251.58 | 26.45 | 200.37 | 31.54 | 27.6 | 78.26 |
| GMA–GF | 132.49 | 12.84 | 118.34 | 13.16 | 21.9 | 251.08 | 22.97 | 194.14 | 28.48 | 24.0 | 79.64 |
| SDS–GF | 132.78 | 21.04 | 118.1 | 20.92 | 35.9 | 251.17 | 21.94 | 198.54 | 25.62 | 22.9 | 81.51 |
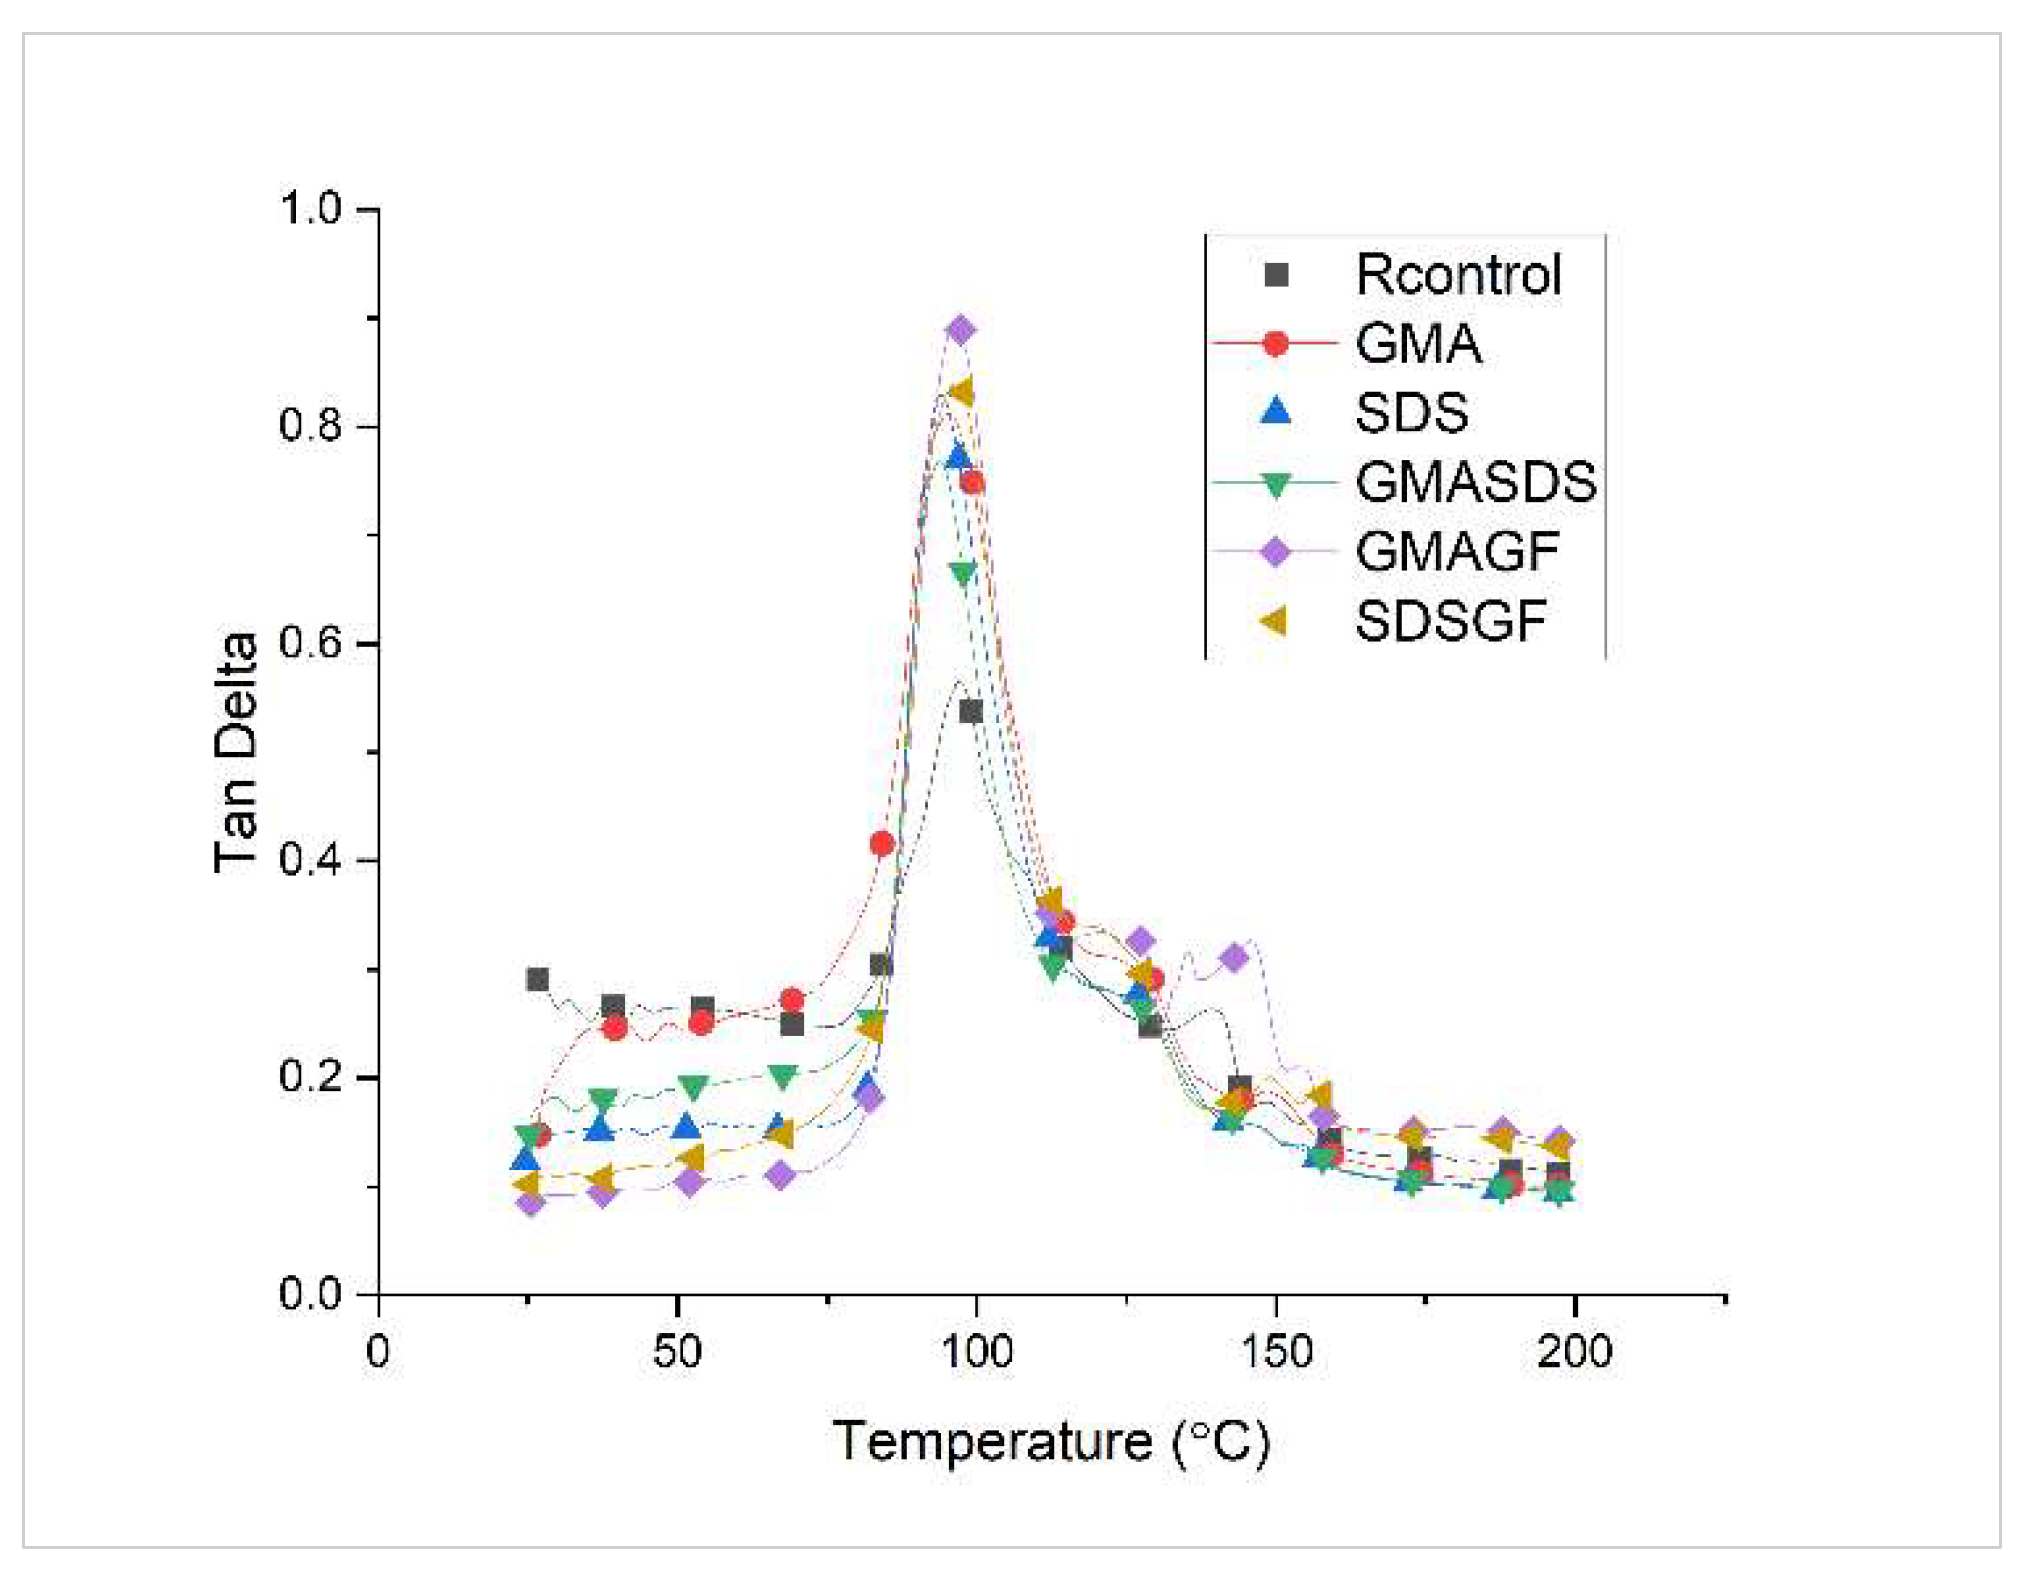
- DMA
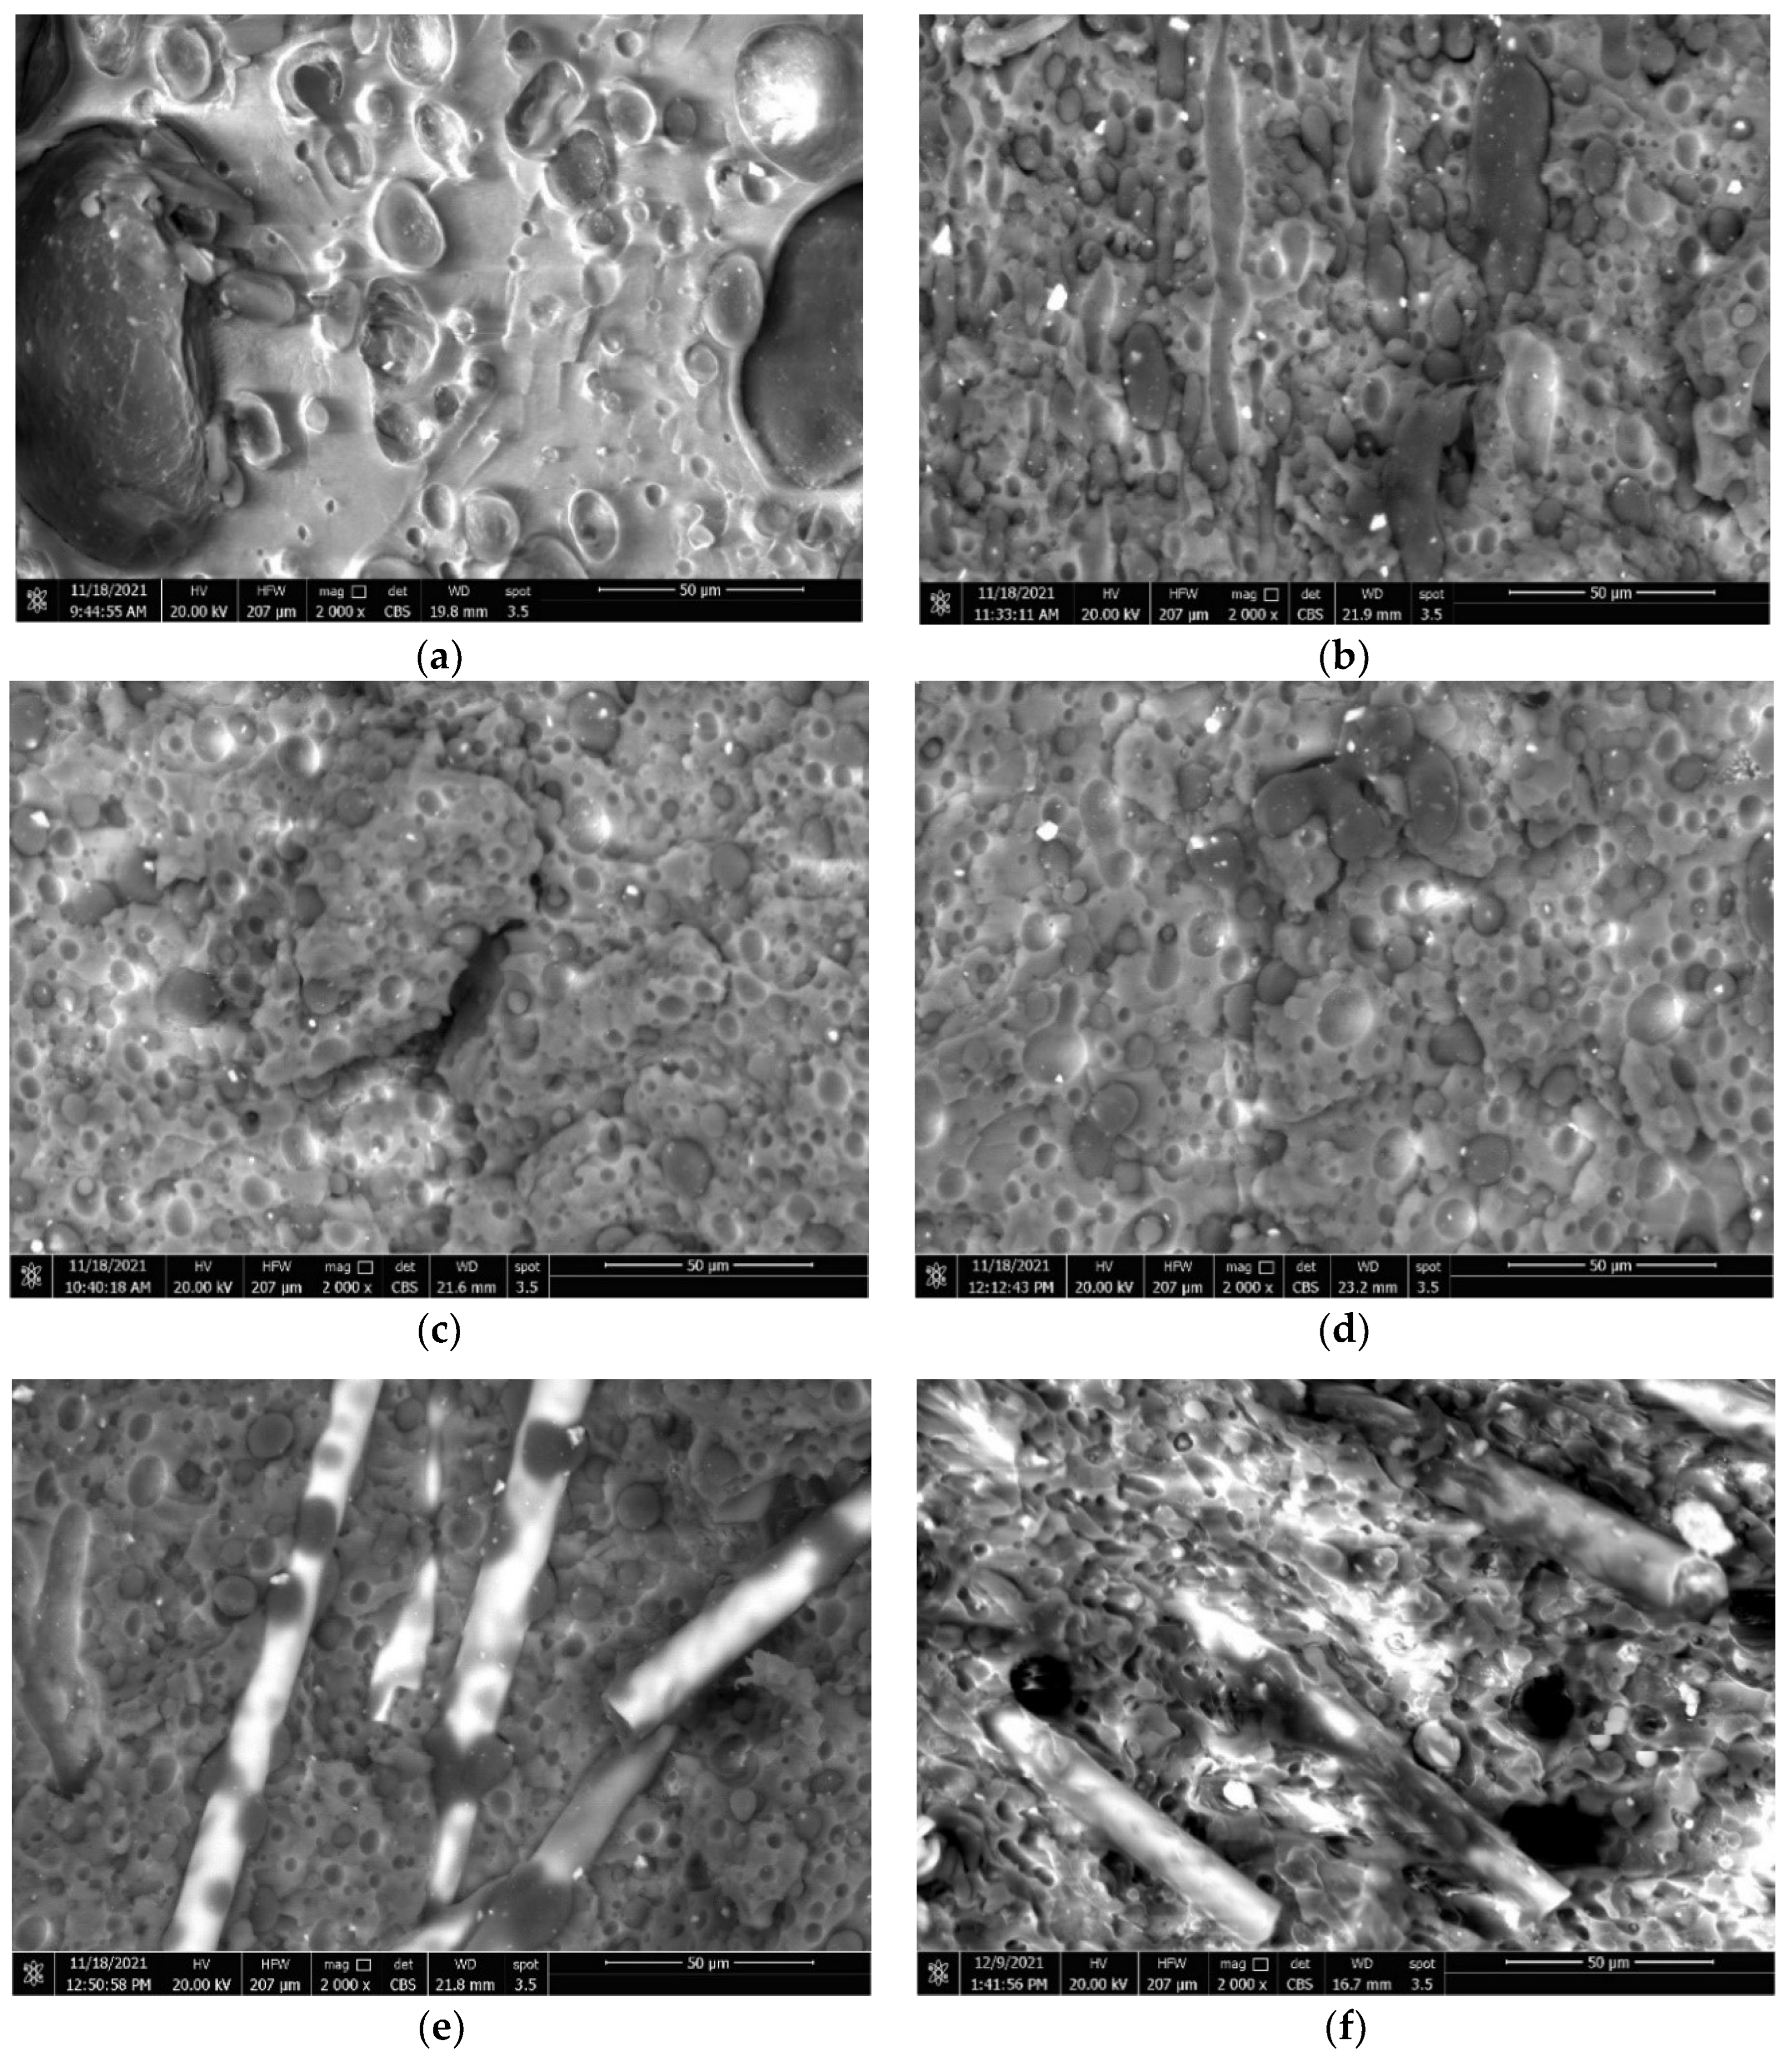
3.1.2. Morphology Examination
3.1.3. Mechanical Properties
- Tensile Test
- Impact Test
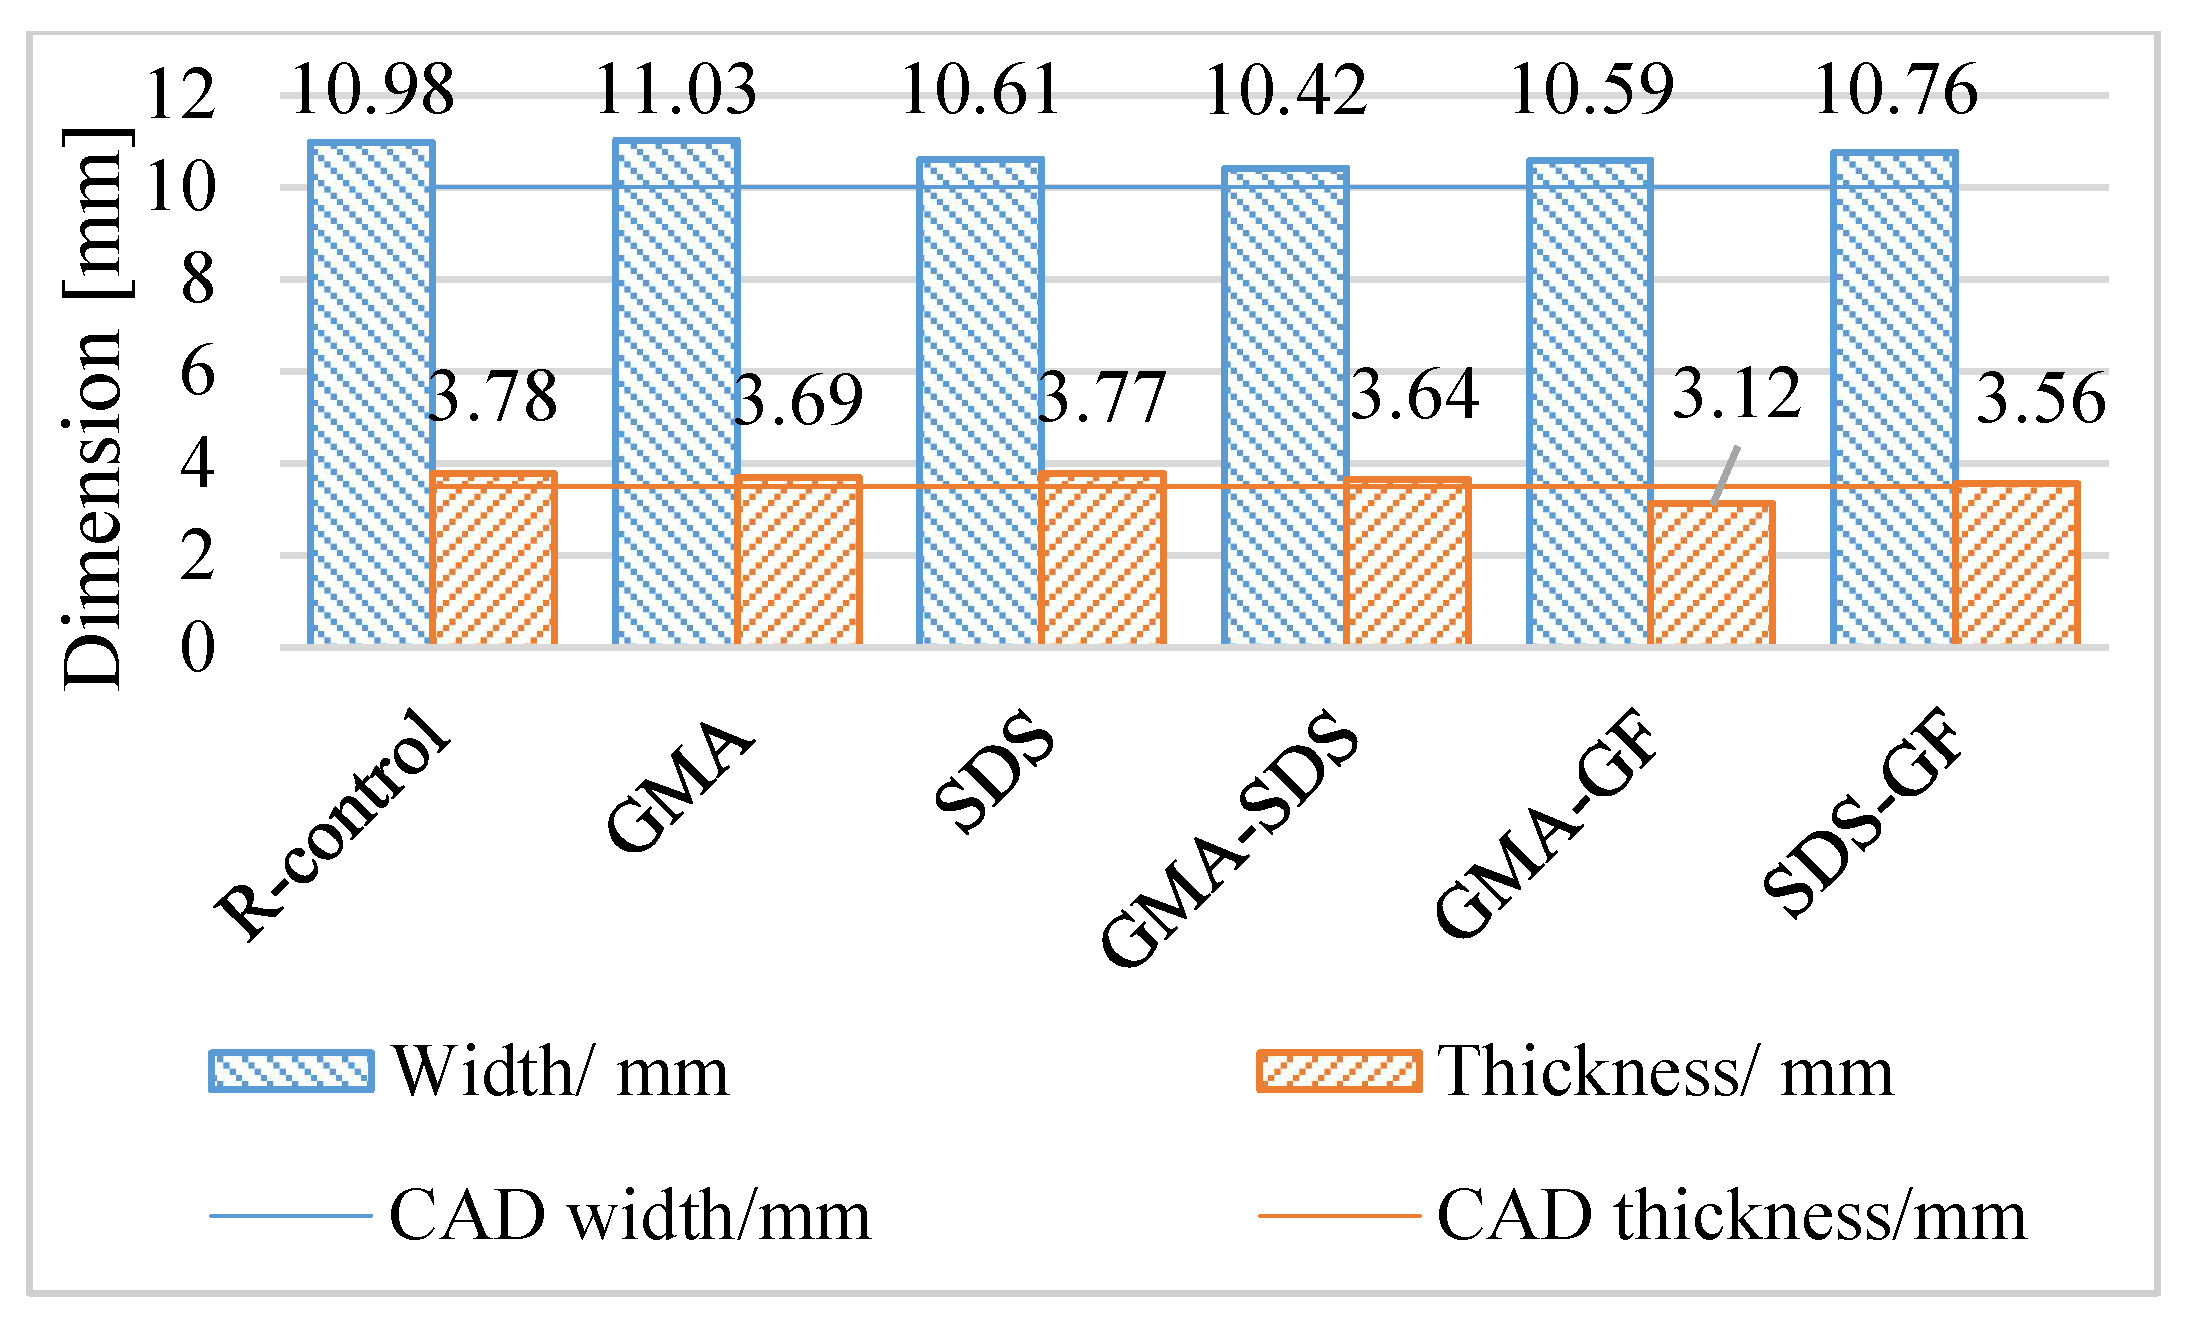
3.1.4. Printability Assessment of Fractured 3D Printed Specimens
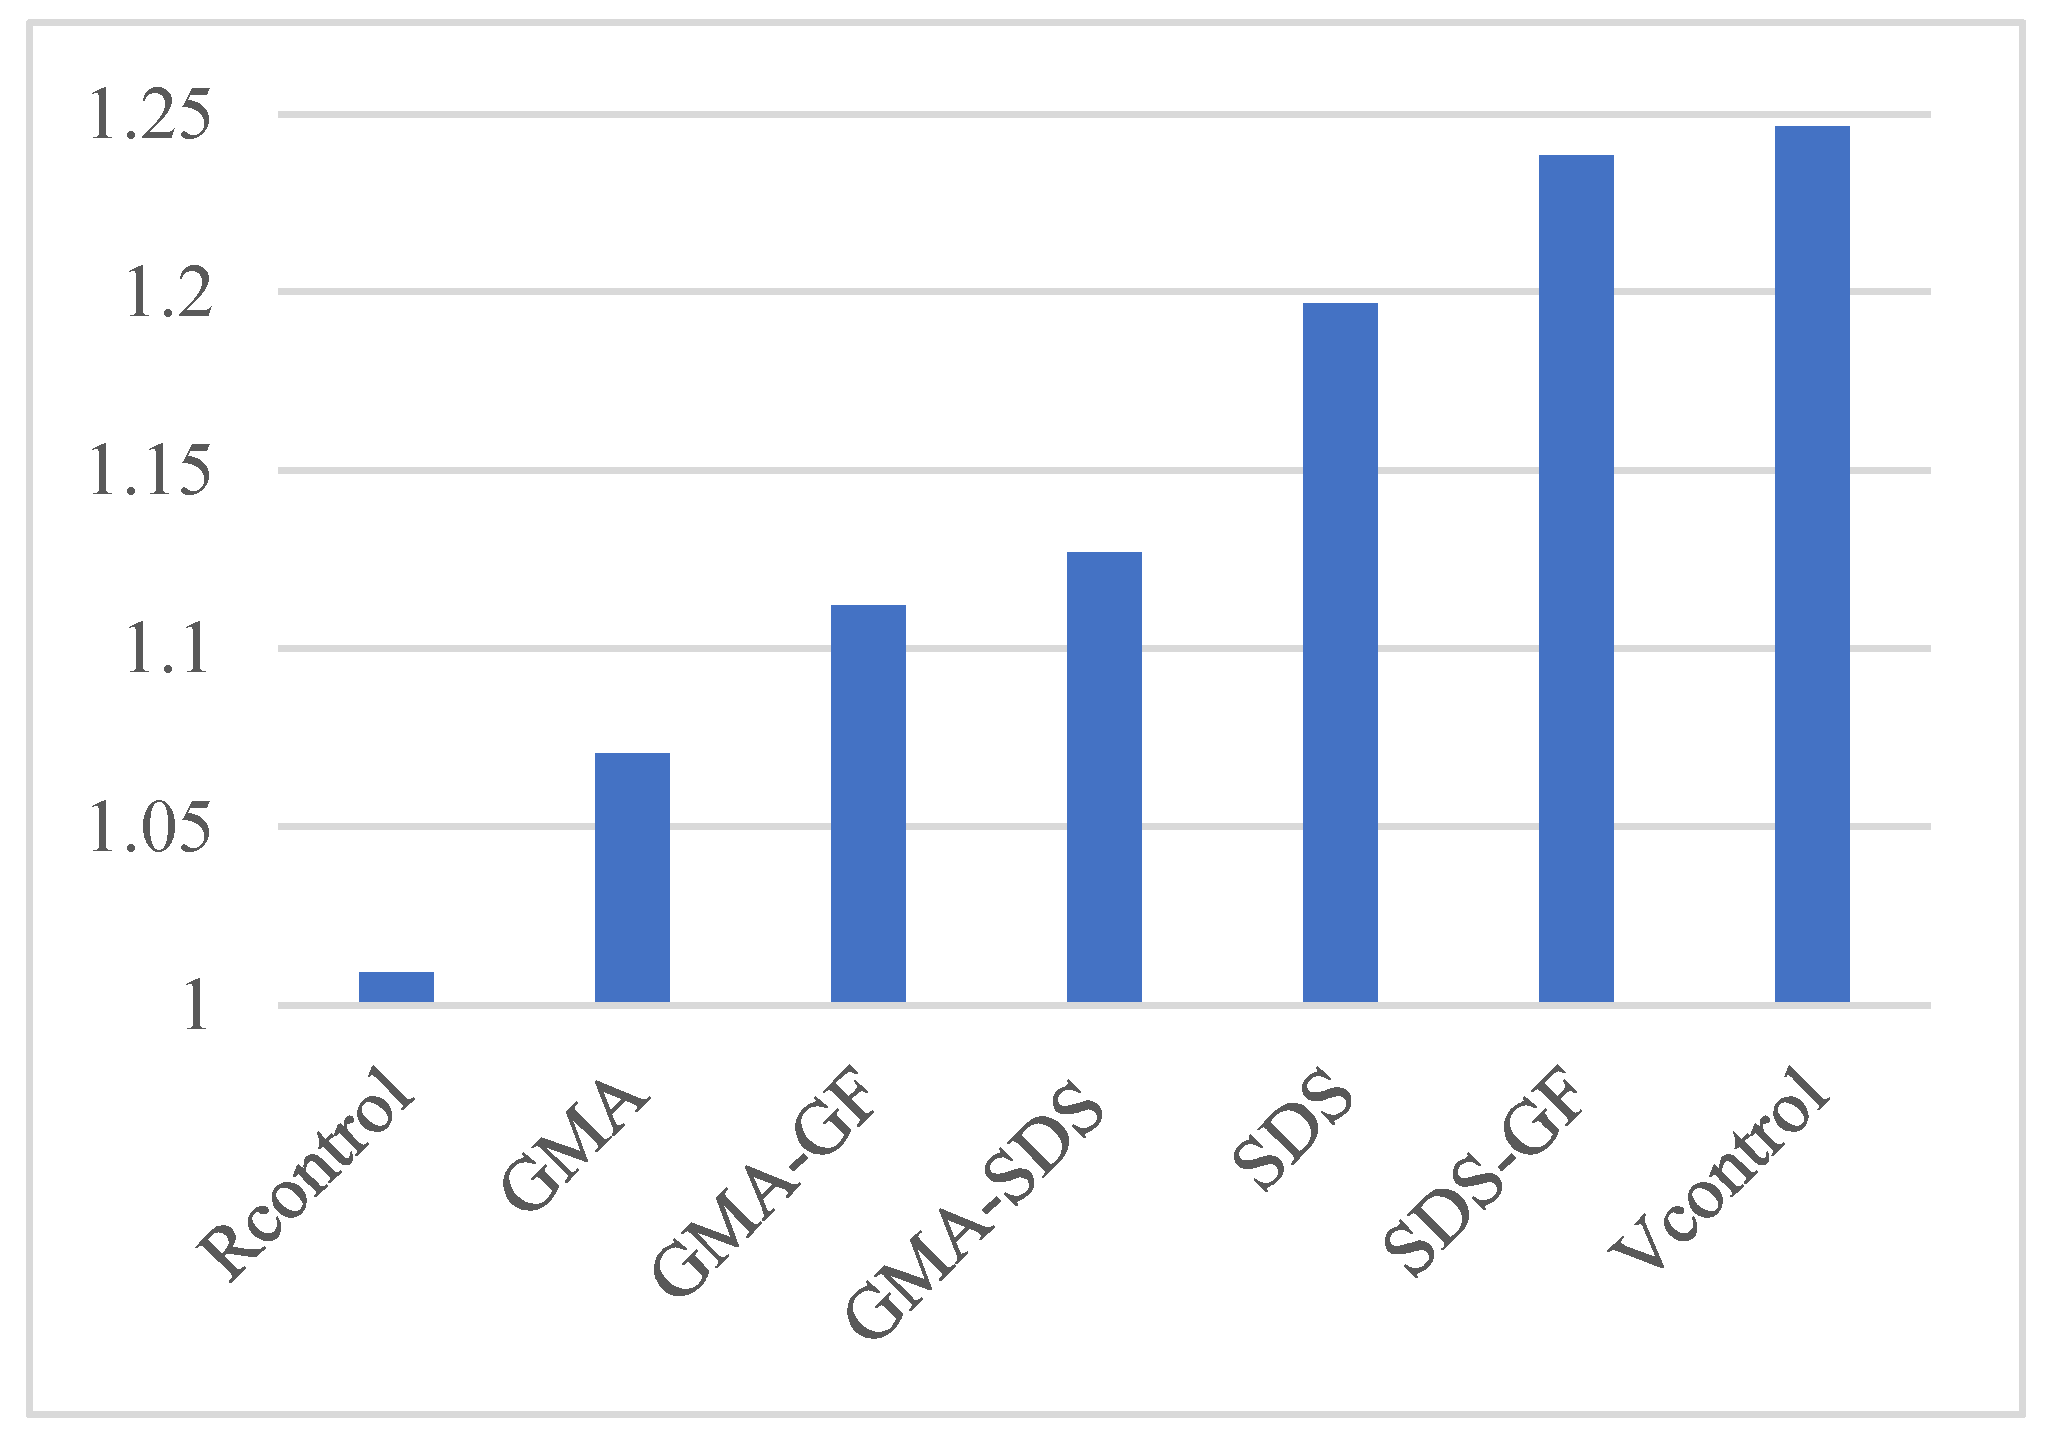
3.1.5. Cost Estimation of Materials
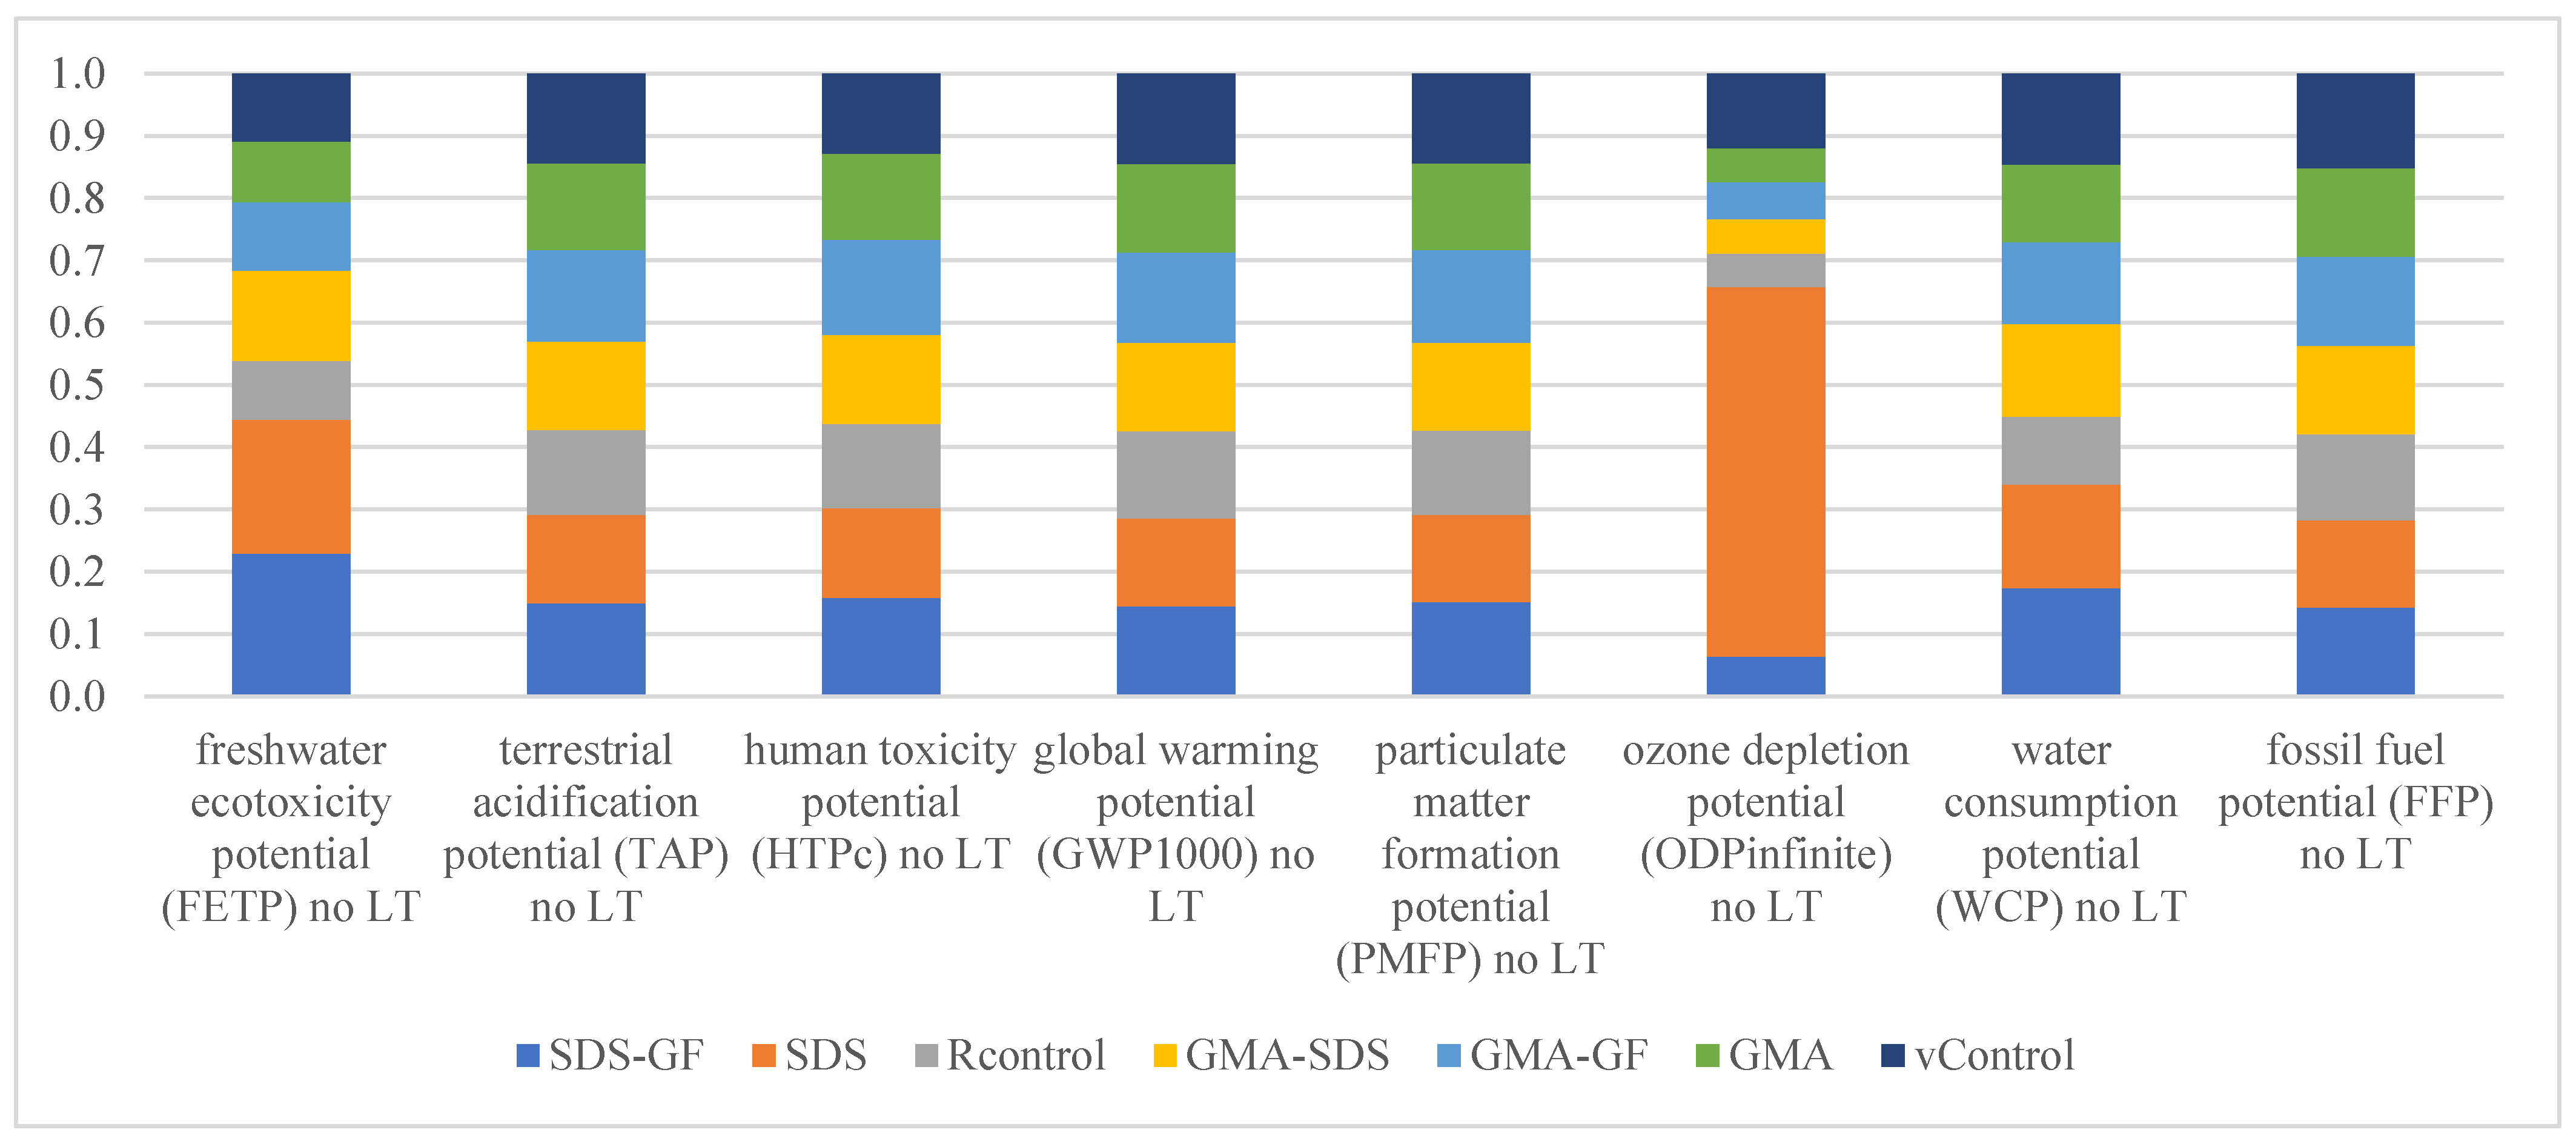
3.2. Life Cycle Assessment (LCA)
4. Summary
5. Discussion
6. Future Prospects
Author Contributions
Funding
Institutional Review Board Statement
Data Availability Statement
Acknowledgments
Conflicts of Interest
References
- Kumar, R.; Sharma, H.; Saran, C.; Tripathy, T.S.; Sangwan, K.S.; Herrmann, C. A Comparative Study on the Life Cycle Assessment of a 3D Printed Product with PLA, ABS & PETG Materials. Procedia CIRP 2022, 107, 15–20. [Google Scholar] [CrossRef]
- Kreiger, M.A.; Mulder, M.L.; Glover, A.G.; Pearce, J.M. Life cycle analysis of distributed recycling of post-consumer high density polyethylene for 3-D printing filament. J. Clean. Prod. 2014, 70, 90–96. [Google Scholar] [CrossRef]
- Ding, G.K.C. Life cycle assessment (LCA) of sustainable building materials: An overview. In Eco-Efficient Construction and Building Materials; Elsevier: Amsterdam, The Netherlands, 2014; pp. 38–62. [Google Scholar]
- Ragaert, K.; Delva, L.; Van Geem, K. Mechanical and chemical recycling of solid plastic waste. Waste Manag. 2017, 69, 24–58. [Google Scholar] [CrossRef] [PubMed]
- Geyer, R.; Jambeck, J.R.; Law, K.L. Production, use, and fate of all plastics ever made. Sci. Adv. 2017, 3, e1700782. [Google Scholar] [CrossRef]
- Sanchez, F.A.C.; Boudaoud, H.; Camargo, M.; Pearce, J.M. Plastic recycling in additive manufacturing: A systematic literature review and opportunities for the circular economy. J. Clean. Prod. 2020, 264, 121602. [Google Scholar] [CrossRef]
- Rejeski, D.; Zhao, F.; Huang, Y. Research needs and recommendations on environmental implications of additive manufacturing. Addit. Manuf. 2018, 19, 21–28. [Google Scholar] [CrossRef]
- Zander, N.E.; Gillan, M.; Lambeth, R.H. Recycled polyethylene terephthalate as a new FFF feedstock material. Addit. Manuf. 2018, 21, 174–182. [Google Scholar] [CrossRef]
- Herianto; Atsani, S.I.; Mastrisiswadi, H. Recycled Polypropylene Filament for 3D Printer: Extrusion Process Parameter Optimization. IOP Conf. Ser. Mater. Sci. Eng. 2020, 722, 012022. [Google Scholar] [CrossRef]
- Chong, S.; Pan, G.-T.; Khalid, M.; Yang, T.C.-K.; Hung, S.-T.; Huang, C.-M. Physical Characterization and Pre-assessment of Recycled High-Density Polyethylene as 3D Printing Material. J. Polym. Environ. 2016, 25, 136–145. [Google Scholar] [CrossRef]
- Tsai, H.-H.; Wu, S.-J.; Wu, Y.-D.; Hong, W.-Z. Feasibility Study on the Fused Filaments of Injection-Molding-Grade Poly(Ethylene Terephthalate) for 3D Printing. Polymers 2022, 14, 2276. [Google Scholar] [CrossRef]
- Bakır, A.A.; Atik, R.; Özerinç, S. Effect of fused deposition modeling process parameters on the mechanical properties of recycled polyethylene terephthalate parts. J. Appl. Polym. Sci. 2020, 138, 49709. [Google Scholar] [CrossRef]
- Hamod, H. Suitability of recycled HDPE for 3D printing filament. Degree Thesis, Arcada University of Applied Science, Helsinki, Finland, 2014; p. 52. [Google Scholar]
- Vidakis, N.; Petousis, M.; Maniadi, A. Sustainable Additive Manufacturing: Mechanical Response of High-Density Polyethylene over Multiple Recycling Processes. Recycling 2021, 6, 4. [Google Scholar] [CrossRef]
- Zander, N.E.; Gillan, M.; Burckhard, Z.; Gardea, F. Recycled polypropylene blends as novel 3D printing materials. Addit. Manuf. 2018, 25, 122–130. [Google Scholar] [CrossRef]
- Chow, H.M.; Koay, S.C.; Choo, H.L.; Chan, M.Y.; Ong, T.K. Investigating effect of compatibilizer on polymer blend filament from post-used styrofoam and polyethylene for fused deposition modelling. J. Phys. Conf. Ser. 2022, 2222, 012006. [Google Scholar] [CrossRef]
- Vaucher, J.; Demongeot, A.; Michaud, V.; Leterrier, Y. Recycling of Bottle Grade PET: Influence of HDPE Contamination on the Microstructure and Mechanical Performance of 3D Printed Parts. Polymers 2022, 14, 5507. [Google Scholar] [CrossRef]
- Utracki, L.A.; Wilkie, C.A. Polymer Blends Handbook, 2nd ed.; Springer: New York, NY, USA, 2014. [Google Scholar]
- Pietrasanta, Y.; Robin, J.-J.J.; Torres, N.; Boutevin, B. Reactive compatibilization of HDPE/PET blends by glycidyl methacrylate functionalized polyolefins. Macromol. Chem. Phys. 1999, 200, 142–149. [Google Scholar] [CrossRef]
- Šenitková, I.; Bednárová, P. Life cycle assessment. JP J. Heat Mass Transf. 2015, 11, 29–42. [Google Scholar] [CrossRef]
- Filimonau, V. Life cycle assessment. Routledge Handb. Tour. Sustain. 2015, 6, 209–220. [Google Scholar]
- Utela, B.; Storti, D.; Anderson, R.; Ganter, M. A review of process development steps for new material systems in three dimensional printing (3DP). J. Manuf. Process. 2008, 10, 96–104. [Google Scholar] [CrossRef]
- Iniguez, C.G.; Michel, E.; Gonzalez-Romero, V.M.; Gonzalez-Nunez, R. Morphological stability of postconsumer PET/HDPE blends. Polym. Bull. 2000, 45, 295–302. [Google Scholar] [CrossRef]
- Lei, Y.; Wu, Q.; Clemons, C.M.; Guo, W. Phase structure and properties of poly(ethylene terephthalate)/high-density polyethylene based on recycled materials. J. Appl. Polym. Sci. 2009, 113, 1710–1719. [Google Scholar] [CrossRef]
- Taghavi, S.K.; Shahrajabian, H.; Hosseini, H.M. Detailed comparison of compatibilizers MAPE and SEBS-g-MA on the mechanical/thermal properties, and morphology in ternary blend of recycled PET/HDPE/MAPE and recycled PET/HDPE/SEBS-g-MA. J. Elastomers Plast. 2018, 50, 13–35. [Google Scholar] [CrossRef]
- Tariq, A.; Ahmad, N.M.; Abbas, M.A.; Shakir, M.F.; Khaliq, Z.; Rafiq, S.; Ali, Z.; Elaissari, A. Reactive Extrusion of Maleic-Anhydride-Grafted Polypropylene by Torque Rheometer and Its Application as Compatibilizer. Polymers 2021, 13, 495. [Google Scholar] [CrossRef]
- Ehrenstein, G.W.; Riedel, G.; Trawiel, P. Thermal Analysis of Plastics; Carl Hanser Verlag GmbH & Co. KG: Munich, Germany, 2004. [Google Scholar]
- Pan, Y.; Wu, G.; Ma, H.; Zhou, S.; Zhang, H. Improved compatibility of PET/HDPE blend by using GMA grafted thermoplastic elastomer. Polym. Technol. Mater. 2020, 59, 1887–1898. [Google Scholar] [CrossRef]
- ISO 180. Available online: https://yiqi-oss.oss-cn-hangzhou.aliyuncs.com/aliyun/technology/94265/14981.pdf (accessed on 25 June 2023).
- ISO 14040. Available online: https://www.ag5.com/certifications/iso-14040/ (accessed on 25 June 2023).
- ISO 14044. Available online: https://www.iso.org/standard/38498.html (accessed on 25 June 2023).
- Ramzy, A.; Elfeky, A.; Aboulseoud, H.; Shihata, L.; Wohlgemuth, V. Resource and Energy Efficiency Analysis in Bottle-To-Bottle Recycling Plant—Case Study. In Advances and New Trends in Environmental Informatics. ENVIROINFO 2021; Springer: Cham, Switzerland, 2021; pp. 105–115. [Google Scholar] [CrossRef]
- Ragab, A.; Ramzy, A. Cradle-to-Gate Life Cycle Assessment of Bottle-to-Bottle Recycling Plant: Case Study; Springer International Publishing: Berlin/Heidelberg, Germany, 2023. [Google Scholar]
- Ragab, A.; Osama, A.; Ramzy, A. Simulation of the Environmental Impact of Industries in Smart Cities. Ain Shams Eng. J. 2023, 14, 2103. [Google Scholar] [CrossRef]
- Torres, N.; Robin, J.J.; Boutevin, B. Study of compatibilization of HDPE-PET blends by adding grafted or statistical copolymers. J. Appl. Polym. Sci. 2001, 81, 2377–2386. [Google Scholar] [CrossRef]
- Van Kets, K.; Delva, L.; Ragaert, K. Structural stabilizing effect of SEBSgMAH on a PP-PET blend for multiple mechanical recycling. Polym. Degrad. Stab. 2019, 166, 60–72. [Google Scholar] [CrossRef]
- Cazan, C.; Cosnita, M.; Duta, A. Effect of PET functionalization in composites of rubber–PET–HDPE type. Arab. J. Chem. 2017, 10, 300–312. [Google Scholar] [CrossRef]
- Pracella, M.; Rolla, L.; Chionna, D.; Galeski, A. Compatibilization and properties of poly(ethylene terephthalate)/polyethylene blends based on recycled materials. Macromol. Chem. Phys. 2002, 203, 1473–1485. [Google Scholar] [CrossRef]
- Pluta, M.; Bartczak, Z.; Pawlak, A.; Galeski, A.; Pracella, M. Phase structure and viscoelastic properties of compatibilized blends of PET and HDPE recyclates. J. Appl. Polym. Sci. 2001, 82, 1423–1436. [Google Scholar] [CrossRef]
- Tariq, A.; Afzal, A.; Rashid, I.A.; Shakir, M.F. Study of thermal, morphological, barrier and viscoelastic properties of PP grafted with maleic anhydride (PP-g-MAH) and PET blends. J. Polym. Res. 2020, 27, 1–10. [Google Scholar] [CrossRef]
- Van de Voorde, B.; Katalagarianakis, A.; Huysman, S.; Toncheva, A.; Raquez, J.-M.; Duretek, I.; Holzer, C.; Cardon, L.; Bernaerts, K.V.; Van Hemelrijck, D.; et al. Effect of extrusion and fused filament fabrication processing parameters of recycled poly(ethylene terephthalate) on the crystallinity and mechanical properties. Addit. Manuf. 2021, 50, 102518. [Google Scholar] [CrossRef]
- Jayanarayanan, K.; Thomas, S.; Joseph, K. Effect of compatibilizer on the morphology development, static and dynamic mechanical properties of polymer-polymer composites from LDPE and PET. Int. J. Plast. Technol. 2015, 19, 84–105. [Google Scholar] [CrossRef]
- Jiang, C.-H.; Zhong, G.-J.; Li, Z.-M. Recyclability of In Situ Microfibrillar Poly(ethylene terephthalate)/High-Density Polyethylene Blends. Macromol. Mater. Eng. 2007, 292, 362–372. [Google Scholar] [CrossRef]
- Zander, N.; Boelter, Z.R. Rubber toughened recycled polyethylene terephthalate for material extrusion additive manufacturing. Polym. Int. 2020, 70, 742–748. [Google Scholar] [CrossRef]
- Menczel, J.D.; Prime, R.B. Thermal Analysis of Polymers: Fundamentals and Applications; John Wiley & Sons, Inc.: Hoboken, NJ, USA, 2008. [Google Scholar]
- Carté, T.L.; Moet, A. Morphological origin of super toughness in poly(ethylene terephthalate)/polyethylene blends. J. Appl. Polym. Sci. 1993, 48, 611–624. [Google Scholar] [CrossRef]
- Fasce, L.; Seltzer, R.; Frontini, P.; Pita, V.R.; Pacheco, E.; Dias, M. Mechanical and fracture characterization of 50:50 HDPE/PET blends presenting different phase morphologies. Polym. Eng. Sci. 2005, 45, 354–363. [Google Scholar] [CrossRef]
- Jarukumjorn, K.; Chareunkvun, S. Compatibilization of Recycled High Density Polyethylene (Hdpe)/Polyethylene Terephtha-Late (Pet) Blends. J. Sci. Technol. 2006, 14, 1–8. [Google Scholar]
- Yousfi, M.; Lepretre, S.; Soulestin, J.; Vergnes, B.; Lacrampe, M.-F.; Krawczak, P. Processing-induced degradation of nanoclay organic modifier in melt-mixed PET/PE blends during twin screw extrusion at industrial scale: Effect on morphology and mechanical behavior. J. Appl. Polym. Sci. 2013, 131. [Google Scholar] [CrossRef]
- Shafiq, M.; Yasin, T.; Shaista, R.A.M. Structural, thermal, and antibacterial properties of chitosan/ZnO composites. Polym. Polym. Compos. 2013, 16, 101–113. [Google Scholar] [CrossRef]
- Pritchard, G. Plastics Additives an A-Z Reference, 1st ed.; Springer: Dordrecht, The Netherlands, 1998. [Google Scholar]
- Loultcheva, M.; Proietto, M.; Jilov, N.; La Mantia, F. Recycling of high density polyethylene containers. Polym. Degrad. Stab. 1997, 57, 77–81. [Google Scholar] [CrossRef]
- Mancini, S.D.; Zanin, M. Recyclability of PET from virgin resin. Mater. Res. 1999, 2, 33–38. [Google Scholar] [CrossRef]
- Lei, Y.; Wu, Q.; Zhang, Q. Morphology and properties of microfibrillar composites based on recycled poly (ethylene terephthalate) and high density polyethylene. Compos. Part A Appl. Sci. Manuf. 2009, 40, 904–912. [Google Scholar] [CrossRef]
- Zweifel, H.; Maier, R.D.; Schiller, M. Plastics Additives Handbook, 6th ed.; Carl Hanser Verlag: Munich, Germany, 1991. [Google Scholar]
- Cress, A.K.; Huynh, J.; Anderson, E.H.; O’neill, R.; Schneider, Y.; Keleş, Ö. Effect of recycling on the mechanical behavior and structure of additively manufactured acrylonitrile butadiene styrene (ABS). J. Clean. Prod. 2020, 279, 123689. [Google Scholar] [CrossRef]
- Lay, M.; Thajudin, N.L.N.; Hamid, Z.A.A.; Rusli, A.; Abdullah, M.K.; Shuib, R.K. Comparison of physical and mechanical properties of PLA, ABS and nylon 6 fabricated using fused deposition modeling and injection molding. Compos. Part B Eng. 2019, 176, 107341. [Google Scholar] [CrossRef]
- Kalfoglou, N.K.; Skafidas, D.S.; Kallitsis, J.K.; Lambert, J.-C.; Van der Stappen, L. Comparison of compatibilizer effectiveness for PET/HDPE blends. Polymer 1995, 36, 4453–4462. [Google Scholar] [CrossRef]
- Pattanakul, C.; Selke, S.; Lai, C.; Miltz, J. Properties of recycled high density polyethylene from milk bottles. J. Appl. Polym. Sci. 1991, 43, 2147–2150. [Google Scholar] [CrossRef]
- Torres, N.; Robin, J.; Boutevin, B. Study of thermal and mechanical properties of virgin and recycled poly(ethylene terephthalate) before and after injection molding. Eur. Polym. J. 2000, 36, 2075–2080. [Google Scholar] [CrossRef]
- Polline, M.; Mutua, J.M.; Mbuya, T.O.; Ernest, K. Recipe Development and Mechanical Characterization of Carbon Fibre Reinforced Recycled Polypropylene 3D Printing Filament. Open J. Compos. Mater. 2021, 11, 47–61. [Google Scholar] [CrossRef]
- Leong, J.J.A.; Koay, S.C.; Chan, M.Y.; Choo, H.L.; Tshai, K.Y.; Ong, T.K. Composite Filament Made from Post-used Styrofoam and Corn Husk Fiber for Fuse Deposition Modeling. J. Nat. Fibers 2021, 19, 7033–7048. [Google Scholar] [CrossRef]
- Milosevic, M.; Stoof, D.; Pickering, K.L. Characterizing the Mechanical Properties of Fused Deposition Modelling Natural Fiber Recycled Polypropylene Composites. J. Compos. Sci. 2017, 1, 7. [Google Scholar] [CrossRef]
- Chatham, C.A.; Zawaski, C.E.; Bobbitt, D.C.; Moore, R.B.; Long, T.E.; Williams, C.B. Semi-Crystalline Polymer Blends for Material Extrusion Additive Manufacturing Printability: A Case Study with Poly(ethylene terephthalate) and Polypropylene. Macromol. Mater. Eng. 2019, 304, 1800764. [Google Scholar] [CrossRef]


| Blend | Blend Composition/Raw Material Inputs | ||||||||
|---|---|---|---|---|---|---|---|---|---|
| rPET (kg) | rHDPE (kg) | Irganox (kg) | Irgafos (kg) | MA (kg) | SDS (kg) | BPO (kg) | GF (kg) | Distilled Water (kg) | |
| R–Control | 0.8 | 0.2 | - | - | - | - | - | - | - |
| GMA | 0.8 | 0.15 | 0.0006 | 0.0012 | 0.025 | - | 0.025 | - | - |
| SDS | 0.8 | 0.2 | 0.0006 | 0.0012 | - | 0.025 | - | - | 2.5 |
| GMA-SDS | 0.8 | 0.15 | 0.0006 | 0.0012 | 0.01 | 0.025 | - | - | 2.5 |
| GMA-GF | 0.8 | 0.15 | 0.0006 | 0.0012 | 0.025 | - | 0.025 | 0.1 | - |
| SDS–GF | 0.8 | 0.2 | 0.0006 | 0.0012 | - | 0.025 | - | 0.1 | 2.5 |
| R–Control | GMA | SDS | GMA–SDS | GMA–GF | SDS–GF | |
|---|---|---|---|---|---|---|
| Tg from tanδ peak/°C | 97.27 | 95.26 | 93.94 | 93.76 | 96.25 | 96.78 |
| Blend Name | Width/mm | Thickness/mm |
|---|---|---|
| CAD Reference | 10.00 | 3.5 |
| R–Control | 10.98 ± 0.31 | 3.78 ± 0.47 |
| GMA | 11.03 ± 0.65 | 3.69 ± 0.26 |
| SDS | 10.61 ± 0.46 | 3.77 ± 0.10 |
| GMA–SDS | 10.42 ± 0.23 | 3.64 ± 0.03 |
| GMA–GF | 10.59 ± 0.08 | 3.12 ± 0.81 |
| SDS–GF | 10.76 ± 0.17 | 3.56 ± 0.08 |
| SDS–GF | SDS | R–Control | GMA–SDS | GMA–GF | GMA | V–Control | |
|---|---|---|---|---|---|---|---|
| Freshwater ecotoxicity potential (FETP) no LT, kg 1,4-DCB-Eq | 0.007630 | 0.007184 | 0.003163 | 0.004844 | 0.003669 | 0.003224 | 0.003655 |
| Terrestrial acidification potential (TAP) no LT, kg SO2-Eq | 0.023808 | 0.022514 | 0.021770 | 0.022537 | 0.023481 | 0.022187 | 0.022900 |
| Human toxicity potential (HTPc) no LT, kg 1,4-DCB-Eq | 0.055101 | 0.050265 | 0.047578 | 0.049980 | 0.053134 | 0.048297 | 0.045087 |
| Global warming potential (GWP1000) no LT, kg CO2-Eq | 12.678611 | 12.408651 | 12.271578 | 12.524416 | 12.723771 | 12.453811 | 12.795880 |
| Particulate matter formation potential (PMFP) no LT, kg PM10-Eq | 0.008117 | 0.007552 | 0.007264 | 0.007602 | 0.008017 | 0.007453 | 0.007774 |
| Ozone depletion potential (ODPinfinite) no LT, kg CFC-11-Eq | 0.000004 | 0.000035 | 0.000003 | 0.000003 | 0.000004 | 0.000003 | 0.000007 |
| Water consumption potential (WCP) no LT, m3 | 0.035909 | 0.034358 | 0.022370 | 0.030769 | 0.027236 | 0.025684 | 0.030122 |
| Fossil fuel potential (FFP) no LT, kg oil-Eq | 4.476042 | 4.406701 | 4.372121 | 4.468671 | 4.521112 | 4.451771 | 4.794605 |
| Blend Name | % Crystallinity HDPE/PET Phases | Glass Transition Temperature (°C) | E-Modulus (MPa) | Impact Strength (KJ/m2) | % Width Error in Prints | Cost Estimation (USD/Kg) | Fesh Water Eco Toxicity Potential (kg 1,4-DCB-Eq) | GWP (kg CO2-Eq) |
|---|---|---|---|---|---|---|---|---|
| R–Control | 64.8/18.0 | 97.27 | 1045 | 4.5 | 9.8 | 1.5 | 0.003163 | 12.27 |
| GMA | 24.7/22.9 | 95.26 | 806 | 23.8 | 10.3 | 5 | 0.003224 | 12.45 |
| SDS | 40.7/28.3 | 93.94 | 1034 | 33.0 | 6.1 | 2 | 0.007184 | 12.40 |
| GMA–SDS | 26.4/27.6 | 93.76 | 856 | 27.4 | 4.2 | 3.5 | 0.004844 | 12.52 |
| GMA–GF | 21.9/24.0 | 96.25 | 1686 | 5.7 | 5.9 | 6.5 | 0.003669 | 12.73 |
| SDS–GF | 35.9/22.9 | 96.78 | 1665 | 5.6 | 7.6 | 3.5 | 0.007630 | 12.67 |
Disclaimer/Publisher’s Note: The statements, opinions and data contained in all publications are solely those of the individual author(s) and contributor(s) and not of MDPI and/or the editor(s). MDPI and/or the editor(s) disclaim responsibility for any injury to people or property resulting from any ideas, methods, instructions or products referred to in the content. |
© 2023 by the authors. Licensee MDPI, Basel, Switzerland. This article is an open access article distributed under the terms and conditions of the Creative Commons Attribution (CC BY) license (https://creativecommons.org/licenses/by/4.0/).
Share and Cite
Ragab, A.; Elazhary, R.; Schmauder, S.; Ramzy, A. Plastic Waste Valorization for Fused Deposition Modeling Feedstock: A Case Study on Recycled Polyethylene Terephthalate/High-Density Polyethylene Sustainability. Sustainability 2023, 15, 13291. https://doi.org/10.3390/su151813291
Ragab A, Elazhary R, Schmauder S, Ramzy A. Plastic Waste Valorization for Fused Deposition Modeling Feedstock: A Case Study on Recycled Polyethylene Terephthalate/High-Density Polyethylene Sustainability. Sustainability. 2023; 15(18):13291. https://doi.org/10.3390/su151813291
Chicago/Turabian StyleRagab, Amira, Rana Elazhary, Siegfried Schmauder, and Amna Ramzy. 2023. "Plastic Waste Valorization for Fused Deposition Modeling Feedstock: A Case Study on Recycled Polyethylene Terephthalate/High-Density Polyethylene Sustainability" Sustainability 15, no. 18: 13291. https://doi.org/10.3390/su151813291