Article

The In-Hexagon Borehole Layout for the Optimization of the Effective Radius of Gas Extraction

1
School of Resources and Environmental Engineering, Wuhan University of Technology, Wuhan 430070, China
2
China Academy of Safety Science and Technology, Beijing 100012, China
3
Chonfar Engineering and Technology Corporation Ltd., Changsha 410000, China
4
Key Laboratory of Mineral Resources Processing and Environment of Hubei Province, Wuhan 430070, China
5
School of Safety Science and Engineering, Henan Polytechnic University, Jiaozuo 454003, China
*
Author to whom correspondence should be addressed.
Sustainability 2023, 15(17), 12711; https://doi.org/10.3390/su151712711
Submission received: 16 June 2023 / Revised: 24 July 2023 / Accepted: 21 August 2023 / Published: 22 August 2023

Abstract

:
This research was conducted in order to study the relationship between gas geology (initial gas pressure, initial permeability, and buried depth) and effective extraction radius and to achieve precise borehole layouts. Based on the in-hexagon borehole layout mode, the influence of geological factors on borehole effective extraction radius is quantitatively analyzed. Combined with gas geology, the precise borehole layout mode of gas extraction is constructed. The results show that: Based on the two evaluation indexes of borehole number and area redundancy rate, the optimal implementation scheme of the in-hexagon is selected; that is, when the effective extraction radius is R, the borehole spacing along the coal seam strike is 3 R , and along the dip is 1.5R. Based on the four evaluation indexes of effective extraction space volume, relative gas emission, cost rate, and gas isobaric surface shape, the relationship between effective extraction radius and initial gas pressure, permeability, and burial depth is matched quantitatively. The effective extraction radius decreases with the initial gas pressure and buried depth and increases with the initial permeability. The effective extraction radius and initial gas pressure have a linear relationship R = a P + b , the effective extraction radius and initial permeability have a power function relationship R = a k b , and the effective extraction radius and burial depth have a negative exponential relationship R   = a e bH . The response surface interaction model analysis shows that the buried depth has the strongest influence on the effective radius of gas extraction, followed by the initial gas pressure and the initial permeability. Based on the effective extraction radius as a function of gas geology, the precise borehole layout mode of gas extraction is constructed, which can provide a reference for the construction design of underground gas drilling in coal mines. This will provide a technical guarantee for the efficient mining of gas and promote the sustainable development of gas resources.

1. Introduction

In the context of carbon neutrality, coal is an important source of energy supply but also a major source of greenhouse gas emissions. The greenhouse effect from coal seam gas is dozens of times that of carbon dioxide, and this would be a huge pressure on the environment if it were released directly into the atmosphere [1]. In the process of coal mining, five natural disaster accidents often occur, among which gas disaster is the most frequent [2,3]. Coal seam gas pre-drainage can not only ensure the safety of mine production but also help to achieve the goal of carbon neutrality [4,5]. This paper mainly regards the development and application of gas resources as an industry and uses technology optimization to provide a guarantee for the sustainable development of gas resources in China. However, due to the complexity of coal seam occurrence and the imperfect research on the theoretical mechanism of gas flow, the design of borehole layout parameters based on construction experience makes the gas extraction rate low. Therefore, accurate prediction of the effective extraction radius is an important technical means to improve the gas extraction rate.
In the study of gas flow theory, Lin [6,7] and Lou [8] considered the anisotropy of coal to study the influence of vertical ground stress, initial gas pressure, and initial permeability on the effective extraction area of the hydraulic slotting. Peng [9] studied the dynamic response characteristics and coupling mechanism of multi-field parameters during coal mine gas drainage by using the self-developed multi-field coupling gas drainage physical simulation test device. Xu [10] studied the evolution of gas pressure and gas flow rate during the drainage process by carrying out physical simulation experiments of gas drainage under different spacing distances between boreholes. Liu [11] and Dong [12] analyzed the influence of geological and engineering factors on the attenuation law of negative pressure in boreholes through numerical calculation results. Zhang [13,14] explored the evolution law of gas flow rate and cumulative flow rate under different borehole numbers and studied the influence of borehole numbers on the superposition effect of gas extraction. Fan [15] combined the DEM data and mathematical model results to simulate the gas distribution in the goaf before and after the drilling of the working face by using user-defined function codes. In the gas extraction borehole layout, Wang [16] determined the reasonable extraction negative pressure, effective extraction radius, and extraction time by using a numerical simulation method. Lin [17] analyzed the influence of the interaction between geological factors and engineering factors on the pre-drainage of coal seam gas by drilling and put forward the method of accurate borehole layout. Chen [18,19] quantitatively analyzed the influence of borehole spacing on the extraction effect with the volume of effective extraction area as the judgment index. Liu [20] determined the layout of drainage boreholes to eliminate the blank zone and improve the extraction rate by theoretical calculation. Li [21] determined the relationship between the borehole spacing and the effective extraction radius of the borehole through the evolution law of gas flow. Hao [22] and Danesh [23] studied the influence of the buried depth of coal seams on the effective extraction radius of boreholes by establishing a creep-seepage coupling model. Li [24] studied the mechanism of the superposition effect of gas extraction boreholes by a field test and numerical calculation method. Zhao [25] studied the law of gas pressure distributions, gas seepage velocity distributions, and permeability change around two boreholes by simulating the result of the gas pressure drop in different spacing. Zou [26] quantitatively analyzed the effective extraction radius of gas drainage based on the critical gas pressure determination index. Liu [27] and Wei [28] used the improved coal permeability model to conclude that the relationship between permeability and gas pressure is an asymmetric U-shaped variation law and verified the reliability of the model by the results of laboratory tests. Zhang [29] and Liu [30] established a dynamic model for the permeability evolution with the concept of scalar damage variable to study the evolutions of gas pressure, coal permeability, and gas transport for a single borehole.
The predecessors have conducted a lot of research on the theory of gas extraction and the layout of extraction boreholes, but most of them are based on a single borehole layout or equal-spacing boreholes layout to study the effective extraction radius of boreholes. It is rare to use borehole spacing inversion to quantitatively study the effective extraction radius of a borehole through the in-hexagon borehole layout. In this paper, a fluid–solid coupling model is established. The effect of geological factors (initial gas pressure, initial permeability, and burial depth) on the effective extraction radius is investigated by taking effective extraction space volume, relative gas emission, cost rate, and gas isobaric surface shape as the judging criteria. Based on the functional relationship between the effective extraction radius and geological factors, a graded co-mining model for gas extraction is proposed, which will be a guideline for the layout of gas extraction boreholes for coal seam group stratified mining. This will enable China’s gas resource industry to develop steadily in the context of sustainable development.

2. Optimization of the In-Polygon Borehole Layout

The effective extraction radius of gas can guide the arrangement of borehole spacing. If the spacing of boreholes is too large, a blank zone of gas extraction will be formed, which will lead to the occurrence of gas outburst accidents. If the borehole spacing is too small, the number of boreholes will increase, which will lead to repeated extraction in some areas, resulting in increased construction costs and extraction costs. Based on the number of boreholes and the area redundancy rate, the best implementation scheme of the in-polygon borehole layout is preferred.

2.1. Optimization Analysis of the Number of Boreholes

It is assumed that a coal seam to be extracted needs to be arranged with extraction boreholes. The effective extraction radius of the borehole is R, and the extraction boreholes are arranged as shown in Figure 1. The circle represents the effective extraction range of the borehole within the specified time. M boreholes are arranged along the strike of the coal seam, and n boreholes are arranged along the dip of the coal seam. At this time, the total number of boreholes is m × n (Figure 1a), but a blank zone of extraction will be formed (shaded area).
(1)
The in-quadrangle borehole layout
In order to eliminate the blank area generated by the traditional borehole layout, the in-quadrangle borehole layout is proposed. The area of the blank zone needs to be constructed again with extraction boreholes, as shown in Figure 1b. In this way, the blank zone needs to be arranged with (m − 1) boreholes along the strike of the coal seam and (n − 1) boreholes along the dip of the coal seam. The number of the in-quadrangle borehole layout is:
Y = 2 m n m n + 1
where Y is the number of boreholes; m is the number of boreholes along the strike of the coal seam; n is the number of boreholes along the dip of the coal seam.
(2)
The in-hexagon borehole layout
The in-hexagon borehole layout is shown in Figure 2a. It can be seen from Figure 2a that MNQ is an equilateral triangle. So, NQ = 3 R , MP = 1.5R are obtained according to the geometric relationship. The number of boreholes along the strike and dip of the coal seam is:
( m 1 ) × 2 R 3 R = 2 3 ( m 1 )
( n 1 ) × 2 R 1.5 R = 4 3 ( n 1 )
where R is the effective extraction radius, m.
The number of the in-hexagon borehole layout is obtained by multiplying Formulas (2) and (3).
Y = 8 3 3 m n m n + 1
(3)
The in-octagon borehole layout
The in-octagon borehole layout is shown in Figure 2b. US = UT =   2 + 2 R is obtained according to the geometric relationship. The number of main boreholes along the strike and dip of the coal seam is:
( m 1 ) × 2 R 2 + 2 R = 2 2 + 2 ( m 1 )
( n 1 ) × 2 R 2 + 2 R = 2 2 + 2 ( n 1 )
The number of main boreholes is obtained by multiplying Formulas (5) and (6). According to the construction of four secondary boreholes around each main hole, the in-octagon borehole layout is obtained. The number of main boreholes and the number of secondary boreholes are:
X = 4 6 + 4 2 m n m n + 1
Z = 16 6 + 4 2 m n m n + 1
where X is the number of main boreholes; Y is the number of secondary boreholes.
The number of the in-octagon borehole layout is obtained by adding Formulas (7) and (8):
Y = 20 6 + 4 2 m n m n + 1
In the process of coal seam gas extraction, a large number of extraction boreholes are arranged in the coal seam. When there are more extraction boreholes arranged along the strike and dip of the coal seam, the values of m and n are larger. The number of in-quadrangle borehole layouts will mainly depend on 2mn items. Compared with the traditional borehole layout, the in-quadrangle borehole layout is 2 times, the in-hexagon borehole layout is 1.54 times, and the in-octagon borehole layout is 1.72 times.

2.2. Optimization Analysis of the Area Redundancy Rate

In order to study the range of repeated extraction area under the in-polygon borehole layout, a formula for calculating the redundancy rate of extraction area is proposed.
η = S c S
where η is the area redundancy rate, %; S c is the repeated extraction area, m2; S is the actual extraction area, m2.
The drainage redundant area of the in-quadrangle borehole layout, the in-hexagon borehole layout, and the in-octagon borehole layout is shown in Figure 3.
Using CAD area accounting, the area redundancy rate of the in-quadrangle borehole layout is 17%, the area redundancy rate of the in-hexagon borehole layout is 10.9%, and the area redundancy rate of the in-octagon borehole layout is greater than 15.7%.
According to the theoretical calculation, the number of extraction boreholes, and the extraction area redundancy rate index analysis, it is concluded that the in-hexagon borehole layout can fully achieve the reduction of the number of extraction boreholes and reduce the extraction area redundancy based on ensuring no extraction blank zone. Therefore, the borehole layout method selects the in-hexagon borehole layout. The data of the in-polygon borehole layout is shown in Table 1.
The effective extraction radius is inversely calculated according to the in-hexagon borehole layout mode. From the geometric relationship in Figure 2, MNQ is an equilateral triangle. Formula (1) can be obtained according to geometric relationships.
N Q = 3 R M P = 1.5 R
where NQ is the borehole spacing along the coal seam strike, m; MP is the borehole spacing along the dip, m; R is the effective extraction radius, m.
According to the effective extraction space volume, relative gas emission, cost rate, and gas isobaric surface shape, reasonable spacing is obtained by the in-hexagon borehole layout mode. According to Formula (11), the effective extraction radius is inversely calculated to guide the field application.

3. Verification of Fluid–Solid Coupling Model in Gas Extraction Process

3.1. Fluid–Solid Coupling Model

The gas in the coal seam is simplified as an ideal gas. The seepage and diffusion of gas follow Darcy’s law and Fick’s law, and the adsorption and desorption of gas follow the Langmuir equation. The coal seam is a dual fracture–pore structure, and its mechanical characteristics are affected by factors such as ground stress, gas pressure in pores and fractures, and the adsorption and desorption of gas. Considering the pore gas pressure and gas adsorption and desorption, the deformation field equation of the coal body can be derived from the stress balance equation, deformation coordination equation, intrinsic structure equation, and effective stress principle.
G u i , j j + G 1 2 v u j , j i α + K ε L p L ( p L + p ) 2 p , i + f i = 0
where G is the shear modulus, G = E 2 1 + v ; K is the bulk modulus, K = E 3 1 2 v ; α is the Biot coefficient, α = 1 K K s ; v is Poisson’s ratio; E is the elastic modulus, MPa; ε L is the Langmuir volume strain constant; p L is the pressure constant; K s is the elastic modulus of the skeleton; u is displacement, m; p is the gas pressure, MPa; u i , j j and p , i are derivative symbols in tensor form; f is the volume force, Pa.
Gas is transported from pores to fractures by diffusion and seepage, which follow Fick’s law and Darcy’s law. The gas seepage equation can be derived from the gas state equation and continuity equation.
( ϕ M g R T p ) t + ( M g p ϕ k R T μ g ( p + M g R T p g z ) ) = 0
where M g is the molecular weight of gas, kg/mol; ϕ is porosity; R is the gas molar constant, R = 8.314 J/(mol·K); T is temperature, K; t is time, s; v is the flow rate of gas, m/s. μ g is the gas dynamic viscosity, Pa·s; g is the acceleration of gravity, m/s2.
Since the ground stress is much higher than the adsorption expansion stress, it is assumed that gas desorption causes only matrix shrinkage. Based on the elastic strain and adsorption–desorption, the dynamic equation of porosity can be expressed as Equation (14).
ϕ ϕ 0 = 1 + 1 M ϕ 0 p p 0 + ε L 3 ϕ 0 K M 1 p p L + p p 0 p L + p
There is a cubic relationship between porosity and permeability. The dynamic evolution equation of permeability can be expressed as Equation (15).
k k 0 = [ 1 + 1 M ϕ 0 ( p p 0 ) + ε L 3 ϕ 0 ( K M 1 ) ( p p L + p p 0 p L + p ) ] 3
where k is permeability, m2; p 0 is the initial gas pressure, MPa; ϕ 0 is initial porosity; M is constant, M = E 1 v 1 + v 1 2 v .
The fluid–solid coupling model is established by Equations (12)–(15). The influence of geological factors on the effective extraction radius of the borehole can be studied by using COMSOL software 6.0 to simulate gas extraction.
According to the previous theoretical derivation, the geological factors affecting the effective radius of gas extraction are mainly initial gas pressure, permeability, and burial depth. The influence of geological factors (initial gas pressure, initial permeability, and burial depth) on the effective extraction radius of boreholes can be studied using COMSOL numerical simulation software. When the coal seam gas pressure is greater than 0.6 MPa or the gas content is greater than 6 m3/t, it is necessary to implement the regional outburst prevention measures for the pre-drainage of cross-layer drilling in the roof (floor) rock roadway, which are the regulations stipulated in the coal mine safety regulations. In this paper, the radius of the area where the gas pressure drops below 0.6 MPa is called the effective extraction radius. For the convenience of analysis, effective extraction space volume, relative gas emission, and cost rate are defined. The effective extraction space volume is the volume of the area where the gas pressure drops below 0.6 MPa. Relative gas emission and gas control cost rates can be expressed in Equations (17) and (19).
γ = Q V
q = γ ρ
where γ is the extraction volume per unit volume, m3/m3; Q is the extraction volume, m3; V is the effective extraction space volume, m3; q is the relative gas emission, m3/t; ρ is the density of coal, t/m3.
λ = ρ L 1 L 2
K = C S = ρ L 1 V Q L 2 = λ γ
where K is the cost rate of gas control; C is the gas control cost, yuan; S is the income of selling gas, yuan; L 1 is the cost of gas control per ton of coal, yuan/t; L 2 is the sale price per cubic meter of gas, yuan/m3; λ is the cost factor coefficient of gas control, λ = 19.6.

3.2. Field Test of Gas Pressure Evolution Law

(1)
Overview of the mine
A coal mine No. 3 coal seam (buried depth 450 m, thickness 5.12−6.20 m, and average 5.25 m) was studied. The dip angle of the coal seam is 8°, which belongs to the gently inclined coal seam. The overall coal seam is a monoclinic structure, the hydrogeological conditions are simple, and the water inflow is small. The roof of the coal seam is mudstone, sandy mudstone, and siltstone, the local is fine sandstone, and the floor is mudstone. The firmness coefficient of the No. 3 coal seam is 0.45−1.09, the permeability of the coal seam is 4.0 × 10⁻¹⁷ m2, the gas content is 18.08 m3/t, and the original gas pressure is 1.4−1.8 MPa. According to the measured data, the gas content of the No. 3 coal seam is 17.51 m3/t, and the gas pressure is 1.6 MPa. Overall, the No. 3 coal seam has the characteristics of hard coal, high gas content, high gas pressure, and easy drainage.
(2)
Field test location
The North bed plate tunnel in the 1303 coalface was selected as the test site for testing the evolution law of gas pressure. Based on the in-hexagon borehole layout, the construction of cross-layer drilling was carried out. The field test location is shown in Figure 4.
(3)
Field test methods
Under the action of extraction boreholes, the gas pressure of the coal seam will be reduced continuously. By arranging gas pressure test boreholes near the extraction boreholes, the evolution of gas pressure can be monitored through the gas pressure test boreholes.
According to the above borehole layout, the No. 1 to No. 7 extraction boreholes are constructed in turn. The gas pressure test boreholes are arranged at positions of 2.8 m and 4.0 m from the central borehole. The diameter of the borehole is 94 mm.
The gas pressure test hole is sealed by cement mortar, and the sealing length is not less than 20 m. The gas pressure gauge was installed after 24 h.
No. 1–7 extraction boreholes are blocked, and the coal seam gas pressure is measured by the gas pressure test boreholes.
The coal seam gas is extracted through the extraction boreholes, and the gas pressure in the test boreholes is observed.
According to the monitoring results, the gas pressure evolution curve is drawn.

3.3. Model Establishment and Boundary Conditions

Fluid–solid coupling model is applied to COMSOL software. The modeling process of the COMSOL software is divided into the following steps:
(1)
The geometric boundary conditions are established. A three-dimensional numerical model was established: 30 m long, 30 m wide, and 5.85 m high. The geometric model is shown in Figure 5a.
(2)
The stress boundary conditions are assigned values. In the X-axis and Y-axis directions, roller support was applied. At the coal seam top plate, the ground stress was 15 MPa, and a fixed constraint was applied to the bottom plate.
(3)
The in-hexagon borehole layout is selected. The diameter of the borehole is 94 mm. The first borehole is located at (0, 0, 0), and the second borehole is located at (6, 0, 0). Taking the first borehole as the rotating axis and the second borehole as the rotating object, the in-hexagon borehole layout is formed. The borehole is rotated 60° each time, and the rotating object is retained.
(4)
The geometric model is meshed. The research object is divided into free tetrahedral grids. The maximum unit size is 1.0 m, the minimum unit size is 0.1 m, and the curvature resolution is 0.7. The mesh model is shown in Figure 5b.
(5)
The seepage boundary conditions are assigned values. The negative pressure of the extraction was 30 kPa. The seepage boundary and gas pressure around the model were 1.4 MPa. Probes were set in the model, and the positions of the probes were X1 (2.80, 0, 0) and X2 (4.05, 0, 0). Numerical calculation parameters are shown in Table 2.

3.4. Validation of the Fluid–Solid Coupling Model

The evolution law of gas isobaric surface over time is shown in Figure 6. After 40 days of extraction, the superposition effect of the borehole is small, and the gas isobaric surface is distributed independently around the extraction boreholes. After 80 days of extraction, the superposition effect of boreholes increases, and the gas isobaric surface is gradually connected. After 100 days of extraction, the gas isobaric surface is completely connected, which forms the simultaneous extraction of boreholes. However, the gas isobaric surface between boreholes is inward concave, which leads to a blank zone in the extraction area. After 120 days of extraction, the shape of the gas isobaric surface is most consistent with the shape of the in-hexagon borehole layout, which means that the borehole spacing is the most reasonable under the condition of 120 days of extraction.
Figure 7 shows the curves of gas pressure from numerical simulations and field tests. It can be seen from Figure 7 that the gas pressure decreases rapidly and then decreases slowly. In addition, the closer the distance from the extraction borehole is, the faster the gas pressure decreases, and the greater the gas pressure decreases. Due to the influence of field geological structure, there are open faults and joints in the coal seam. The numerical simulation results are not completely coincident with the field test results, but the curve shape and trend are basically the same, which verifies the applicability of the fluid–solid coupling model.

3.5. Analysis of the Evolution Law of Gas Extraction Parameters

Figure 8 shows the evolution of extraction parameters over time. The following rules can be obtained from Figure 8.
(1)
After 40, 100, and 180 days of extraction, the space volume is 40 m3, 227 m3, and 353 m3, respectively. The evolution of the space volume over time can be divided into three stages: slow growth stage, rapid growth stage, and stable growth stage. In addition, the larger the borehole spacing, the later the start of the rapid growth stage of gas extraction space volume is reached. This is because the larger the borehole spacing, the later the borehole superposition effect becomes apparent, which will cause the space volume to reach the start of the rapid growth phase later and later.
(2)
After 8 days of extraction, the relative gas emission reached 47.4 m3/t. After that, the relative gas emission decreased from 47.4 m3/t. to 5.0 m3/t., and finally stabilized to 5 m3/t. The evolution of relative gas emission over time can be divided into three stages: gas extraction rising period, gas extraction falling period, and gas extraction depletion period. In addition, the smaller the borehole spacing, the smaller the peak value of relative gas emission. This is because the smaller the borehole spacing, the borehole superposition effect makes the gas content decrease significantly, which will cause the peak value of relative gas emission to be smaller.
(3)
After 7 days of extraction, the cost rate is reduced by 0.29 yuan/t. After that, the cost rate increased from 0.29 yuan/t to 2.78 yuan/t and finally stabilized to 2.78 yuan/t. The evolution of cost rate over time can be divided into three stages: decline stage, rise stage, and stable stage. In addition, the smaller the borehole spacing, the higher the average cost rate of gas extraction. This is because the drilling spacing is too small, and the longer the depletion period of the extraction area, the greater the cost rate of gas extraction.

4. Result and Discussion

4.1. Analysis of Influence of Initial Gas Pressure on Effective Extraction Radius

According to the geological exploration data, the maximum gas pressure in the exploration area is 1.8 MPa, and the minimum gas pressure in the exploration area is 1.0 MPa. To study the influence of initial gas pressure on the effective extraction radius, initial gas pressures of 1.0 MPa, 1.2 MPa, 1.4 MPa, and 1.6 MPa were selected, and borehole spacing of 2.5–7.5 m was chosen. The burial depth is 600 m, the initial permeability is 4 × 10⁻¹⁷ m2, and other parameters are shown in Table 2.
Figure 9 shows the evolution of extraction parameters with time for initial gas pressures. Figure 10 shows the gas isobaric surface shape after 120 days of extraction for the No. 3 seam. The orange surface in the figure is the gas pressure equivalent surface, and the gas pressure inside its surface drops to below 0.6 MPa. It can be seen from Figure 10b that the gas isobaric surface shape is roughly an in-hexagon, and the internal gas pressure of the in-hexagon borehole layout is significantly smaller than the external gas pressure. This is due to the combined effect of the negative pressure of the borehole and the differential pressure of the coal seam gas pressure, which causes the gas to be transported to the borehole. It can be seen from Figure 10a that the gas pressure equivalent between boreholes is inward concave, which will lead to a blank zone in the extraction area. This is because the borehole spacing is large, the superposition effect is weakened, and the area where the gas pressure is greater than 0.6 MPa appears between the boreholes. When the gas pressure is 1 MPa and the borehole spacing is 7.0 m, there is a blank zone in the gas extraction area. Once a blank zone (gas pressure is greater than 0.6 MPa) occurs, coal and gas outburst accidents will occur, which will cause deaths and economic losses. However, when the gas pressure is 1.0 MPa and the borehole spacing is 6.5 m, the shape of the gas isobaric surface is most consistent with the shape of the in-hexagon borehole layout, which means that the borehole spacing is the most reasonable under the condition of 120 days of extraction.
Table 3 is available from Figure 9 and Figure 10. Table 3 shows the volume of extraction space, relative gas emission, average cost rate, and gas isobaric surface shape after 120 days of extraction. Considering all the indexes, when the initial gas pressure is 1.0, 1.2, 1.4, 1.6 MPa, the reasonable borehole spacing is 6.5, 5.0, 4.0, 3.0 m. and the gas isobaric surface shape is in-hexagon, and there is no blank zone in the extraction area, which indicates that the initial gas pressures match well with the borehole spacing.
The effective extraction radius is inversely calculated according to Formula (11). Table 4 shows the effective extraction radius for different initial gas pressures. The fitted curve between the gas extraction radius and the initial gas pressure is shown in Figure 11. It can be seen from Figure 11 that there is a linear relationship between the effective gas extraction radius and the initial gas pressure, and the effective gas extraction radius decreases as the initial gas pressure increases. This is due to the fact that the rate of change of the gas content of the coal seam decreases as the initial gas pressure of the seam increases. When the initial gas pressure of the coal seam is too high, the smaller the gas content reduction for the same extraction time, which will cause the effective extraction radius to decrease. The response surface of coal seam initial gas pressure and extraction time has a large degree of distortion, which indicates that the interaction effect of those two parameters on extraction radius is obvious. Therefore, in the process of gas extraction, borehole spacing should be arranged reasonably according to the initial gas pressure to achieve the best gas extraction effect.

4.2. Analysis of Influence of Initial Permeability on Effective Extraction Radius

To study the influence of initial permeability on the effective extraction radius, initial permeabilities of 3.0 × 10⁻¹⁷ m2, 4.0 × 10⁻¹⁷ m2, 5.0 × 10⁻¹⁷ m2, and 5.5 × 10⁻¹⁷ m2 were selected, and borehole spacing of 2.5–7.5 m was chosen. The initial gas pressure is 1.4 MPa, the buried depth is 600 m, and other parameters are shown in Table 2.
Figure 12 shows the evolution of extraction parameters with time for initial permeability. Figure 13 shows the gas isobaric surface shape after 120 days of extraction for the No. 3 seam. When the permeability is 5.0 × 10⁻¹⁷ m2 and the borehole spacing is 5.5 m, there is a blank zone in the gas extraction area. However, when the gas pressure is 5.0 × 10⁻¹⁷ m2 and the borehole spacing is 4.5 m, the shape of the gas pressure equivalent surface is an in-hexagon.
Table 5 is available from Figure 12 and Figure 13. Table 5 shows the volume of extraction space, relative gas emission, average cost rate, and gas isobaric surface shape after 120 days of extraction. Considering all the indexes, when the initial permeability is 3.0 × 10⁻¹⁷ m2, 4.0 × 10⁻¹⁷ m2, 5.0 × 10⁻¹⁷ m2, and 5.5 × 10⁻¹⁷ m2, the reasonable borehole spacing is 3.5, 4.0, 4.5, and 5.0 m, respectively.
The effective extraction radius is inversely calculated according to Formula (11). Table 6 shows the effective extraction radius for different initial permeabilities. The fitted curve between the gas extraction radius and the initial permeability is shown in Figure 14. It can be seen from Figure 14 that there is a power function relationship between the effective gas extraction radius and the initial permeability, and the effective gas extraction radius increases as the initial permeability increases. This is due to the large permeability of the coal seam, which facilitates the transport of gas in the extraction of a negative pressure state and is conducive to gas extraction. Therefore, in the process of gas extraction, borehole spacing should be arranged reasonably according to the initial permeability to achieve the best gas extraction effect.

4.3. Analysis of Influence of Burial Depth on Effective Extraction Radius

To study the influence of burial depth on the effective extraction radius, burial depths of 400 m, 450 m, 500 m, and 550 m were selected, and borehole spacing of 1.0–6.0 m was chosen. The initial gas pressure is 1.4 MPa, the initial permeability is 4 × 10⁻¹⁷ m2, and other parameters are shown in Table 2. The following rules can be obtained from previous studies. There is a linear relationship between gas pressure and burial depth. The greater the burial depth of the coal seam, the higher the gas pressure. There is a negative exponential relationship between permeability and burial depth. The greater the burial depth of the coal seam, the lower the permeability of the coal seam. Through geological exploration, the following rules can be obtained. There is a linear relationship between coal seam gas pressure and buried depth: P = 0.0042 H 0.48 , and a negative exponential relationship between permeability and buried depth: k = 1.65 × 10 16 e 0.00286 H . The relationship is coupled with the COMSOL numerical simulation software to study the influence of buried depth on the effective extraction radius.
Figure 15 shows the evolution of extraction parameters with the time for burial depth. Figure 16 shows the gas isobaric surface shape after 120 days of extraction for the No. 3 seam. When the burial depth is 400 m and the borehole spacing is 6.0 m, there is a blank zone in the gas extraction area. However, when the gas pressure is 400 m and the borehole spacing is 5.3 m, the shape of the gas pressure equivalent surface is an in-hexagon.
Table 7 is available from Figure 15 and Figure 16. Table 7 shows the volume of extraction space, relative gas emission, average cost rate, and gas isobaric surface shape after 120 days of extraction. Considering all the indexes, when the burial depth is 400 m, 450 m, 500 m, and 550 m, the reasonable borehole spacing is 5.3, 4.0, 2.8, and 2.3 m, respectively.
The effective extraction radius is inversely calculated according to Formula (11). Table 8 shows the effective extraction radius for different burial depths. The fitted curve between the gas extraction radius and the burial depth is shown in Figure 17. It can be seen from Figure 17 that there is a negative exponential relationship between the effective gas extraction radius and the burial depth, and the effective gas extraction radius decreases as the burial depth increases. This is due to the fact that the greater the depth of the coal seam, the higher the gas pressure and the lower the coal seam permeability, which will cause the effective gas extraction radius to decrease. The response surface of coal seam burial depth and extraction time has the largest distortion degree, which indicates that the interaction effect of those two parameters on extraction radius is significant. In the process of gas extraction, borehole spacing should be arranged reasonably according to the burial depth to achieve the best gas extraction effect.

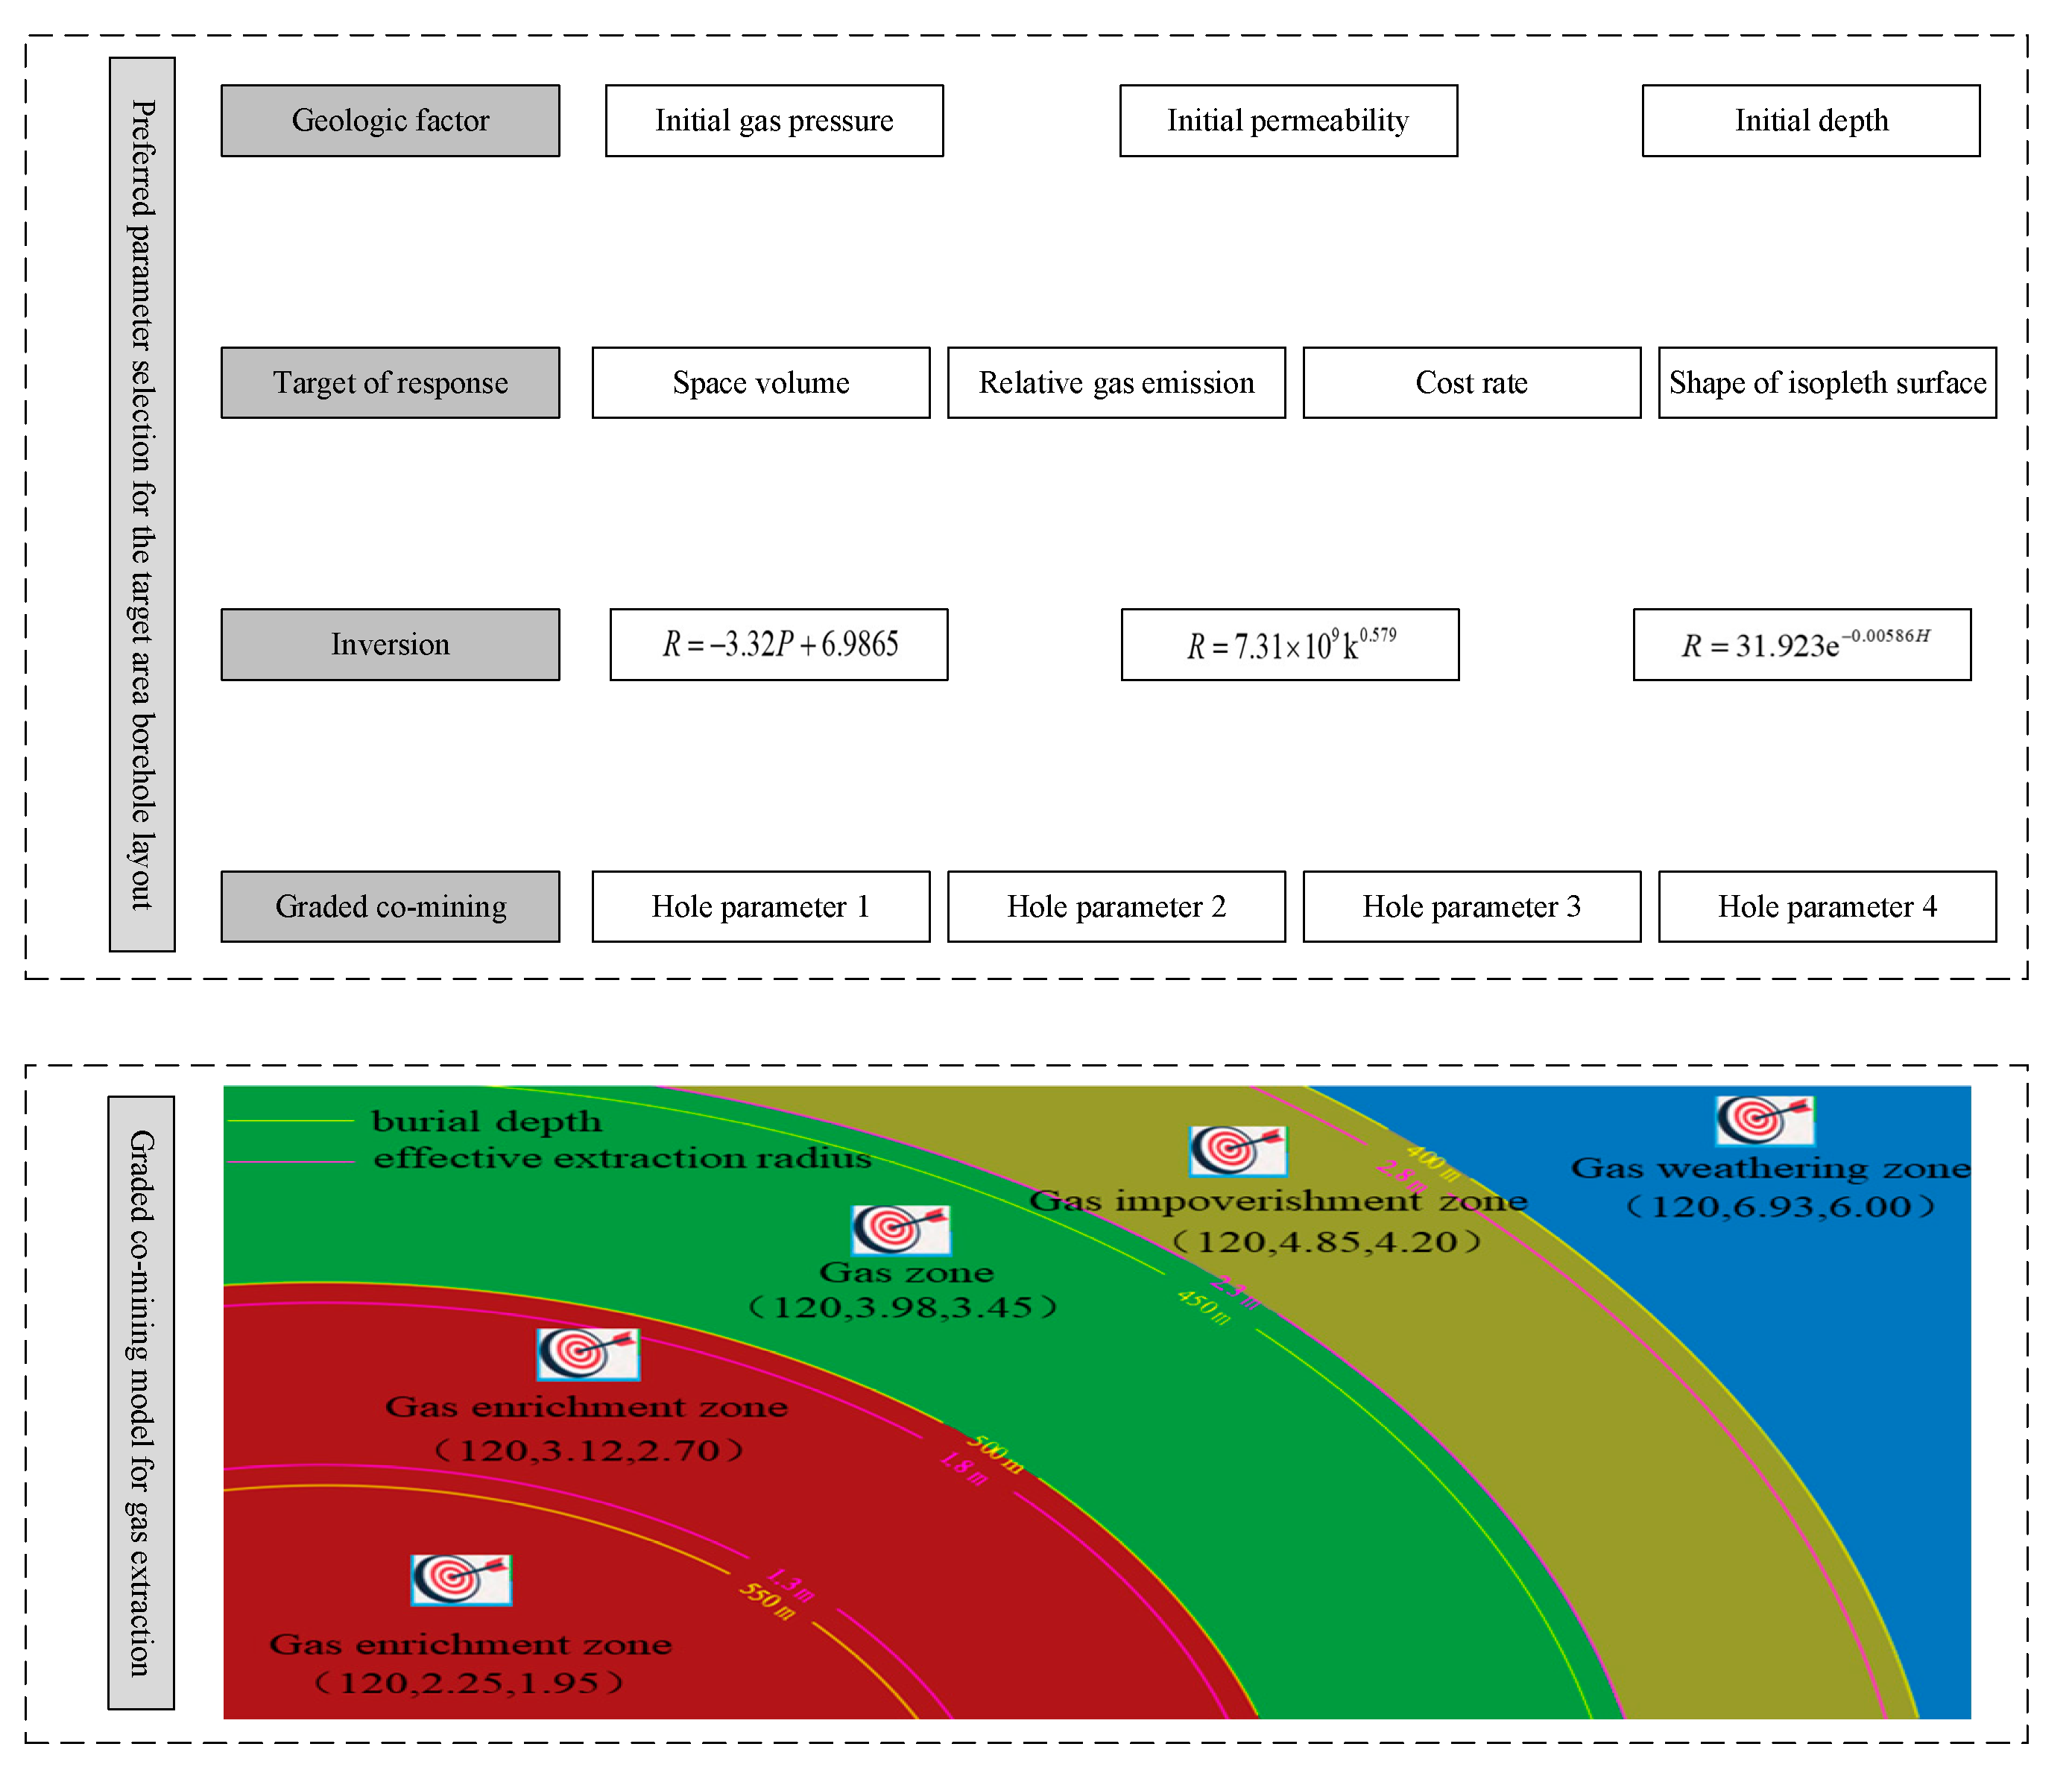
4.4. Graded Co-Mining Model for Gas Extraction

The simulation results show that the geological factors (initial gas pressure, initial permeability, and buried depth) have a great influence on the effective extraction radius. The parameters of borehole layout should be reasonably selected according to the geological conditions and regional characteristics of coal seam gas. According to the quantitative relationship between effective extraction radius and geological factors, the time-zoning layout is carried out.
Figure 18 shows the time-partition prediction model of gas extraction under different buried depths, which mainly includes the following processes:
(1)
Gas geological exploration. Combined with the characteristics of gas occurrence, the gas geological units are graded to form different levels of extraction areas.
(2)
Preferred parameter selection for the target area borehole layout. Based on four evaluation indexes of effective extraction space volume, relative gas emission, cost rate, and gas isobaric surface shape, the relationship between borehole spacing and initial gas pressure, permeability, and buried depth is quantitatively matched at different extraction times.
(3)
Inversion of effective extraction radius. Based on the reasonable spacing of the in-hexagon, the functional relationship between the effective extraction radius and the geological factors at different extraction times is fitted. In addition, the effective extraction radius prediction model diagram is drawn.
(4)
Graded co-mining model for gas extraction. Based on the prediction model diagram of the effective extraction radius of gas extraction, the graded co-mining model diagram is designed. Where (120, 2.25, 1.95) means that when the area is expected to extract 120 days, the borehole spacing along the coal seam strike is 2.25 m, and that along the dip is 1.95 m.

5. Conclusions

Based on the hexagonal borehole layout model in the circle, the relationship between gas geology and effective extraction radius was studied by numerical simulation. The main conclusions are as follows:
(1)
Based on the two evaluation indexes of borehole number and area redundancy rate, the optimal implementation scheme of the in-hexagon borehole layout is selected; that is, when the effective extraction radius is R, the borehole spacing along the coal seam strike is 3 R , and that along the dip is 1.5R.
(2)
Based on the four evaluation indexes of effective extraction space volume, relative gas emission, cost rate, and gas isobaric surface shape, the relationship between borehole spacing and initial gas pressure, permeability, and burial depth is matched quantitatively. The smaller the borehole spacing is, the smaller the peak relative gas emission is and the shorter the time required to reach the peak, but the longer the gas extraction depletion period is, the higher the gas management cost rate is.
(3)
The effective radius of gas extraction decreases with the initial gas pressure and buried depth and increases with the initial permeability. The effective extraction radius and initial gas pressure have a linear relationship R = a P + b , the effective extraction radius and initial permeability have a power function relationship R = a k b , and the effective extraction radius and burial depth have a negative exponential relationship R = a e bH .
(4)
The response surface interaction model was used to analyze the primary and secondary order of the three factors based on the simulation results of the effective extraction radius. It was found that the burial depth had the strongest influence on the effective radius of gas extraction, followed by the initial gas pressure and the initial permeability.
(5)
Based on the effective extraction radius as a function of gas geology, the precise borehole layout mode of gas extraction is proposed, which can provide a reference for the construction design of underground gas drilling in coal mines. This will provide a technical guarantee for the efficient mining of gas and promote the sustainable development of gas resources.
In order to efficiently extract gas resources, the next work will carry out the field application of the precise layout mode of gas extraction boreholes, which will improve the utilization of clean energy such as gas.

Author Contributions

Writing—original draft, L.Z.; supervision, Y.C.; formal analysis, Y.Z.; project administration, G.R.; software, Y.G.; methodology, J.L. All authors have read and agreed to the published version of the manuscript.

Funding

This research was supported by the National Key Research and Development Program of China (No.2022YFC2904002).

Institutional Review Board Statement

Not applicable.

Informed Consent Statement

Not applicable.

Data Availability Statement

The data used to support the results of this study are available from the authors upon request.

Conflicts of Interest

The authors declare no conflict of interest.

References

  1. Song, Y.W.; Yang, S.Q.; Hu, X.C. Prediction of gas and coal spontaneous combustion coexisting disaster through the chaotic characteristic analysis of gas indexes in goaf gas extraction. Process Saf. Environ. Prot. 2019, 129, 8–16. [Google Scholar] [CrossRef]
  2. Jing, G.X.; Liu, M.X. Statistics and analysis of coal mine gas accidents in China from 2015 to 2019. J. Saf. Environ. 2022, 22, 1680–1686. [Google Scholar]
  3. Xu, C.; Wang, K.; Li, X.M. Collaborative gas drainage technology of high and low level roadways in highly-gassy coal seam mining. Fuel 2022, 323, 124325. [Google Scholar] [CrossRef]
  4. Zhang, J.F.; Lin, H.F.; Li, S.G. Accurate gas extraction (AGE) under the dual-carbon background: Green low-carbon development pathway and prospect. J. Cleaner Prod. 2022, 337, 134372. [Google Scholar] [CrossRef]
  5. Xie, H.P.; Ren, S.H.; Xie, Y.C. Development opportunities of the coal industry towards the goal of carbon neutrality. J. China Coal Soc. 2021, 46, 2197–2211. [Google Scholar]
  6. Lin, B.Q.; Song, H.R.; Yang, W. Study on effective gas drainage area based on anisotropic coal seam. Coal Sci. Technol. 2019, 47, 139–145. [Google Scholar]
  7. Lin, B.Q.; Song, H.R.; Zhao, Y. Significance of gas flow in anisotropic coal seams to underground gas drainage. J. Pet. Sci. Eng. 2019, 180, 808–819. [Google Scholar] [CrossRef]
  8. Lou, Z.; Wang, K.; Zang, J. Effects of permeability anisotropy on coal mine methane drainage performance. J. Nat. Gas. Sci. Eng. 2021, 86, 103733-1–103733-13. [Google Scholar] [CrossRef]
  9. Peng, S.J.; Jia, L.; Xu, J. Dynamic response characteristics and coupling law of multi physical field parameters in coal seam gas drainage. J. China Coal Soc. 2022, 47, 1235–1243. [Google Scholar]
  10. Xu, J.; Song, X.Z.; Peng, S.J. Physical simulation experiment on influence of borehole spacing along the seam on effect of gas drainage. Rock. Soil. Mech. 2019, 40, 4581–4589. [Google Scholar]
  11. Liu, J.; Zhang, L.W.; Wang, L. Negative pressure distribution of variable mass flow in coal mine drainage boreholes. Energy Sources Part A Recovery Util. Environ. Eff. 2020, 6, 1–18. [Google Scholar] [CrossRef]
  12. Dong, J.; Cheng, Y.P.; Jin, K. Effects of diffusion and suction negative pressure on coalbed methane extraction and a new measure to increase the methane utilization rate. Fuel 2017, 197, 70–81. [Google Scholar] [CrossRef]
  13. Zhang, C.L.; Xu, J.; Peng, S.J. Effect of borehole amounts on gas drainage quantity and drainage time. J. China Univ. Min. Technol. 2019, 48, 287–294. [Google Scholar]
  14. Zhang, C.L.; Xu, J.; Peng, S.J. Experimental study of drainage radius considering borehole interaction based on 3D monitoring of gas pressure in coal. Fuel 2019, 239, 955–963. [Google Scholar] [CrossRef]
  15. Fan, C.; Xu, H.; Wang, G. Determination of roof horizontal long drilling hole layout layer by dynamic porosity evolution law of coal and rock. Powder Technol. 2021, 394, 970–985. [Google Scholar] [CrossRef]
  16. Wang, Z.F.; Li, Y.T.; Xia, H.H. Numerical simulation on effective drainage radius of drill hole along coal seam based on COMSOL. Saf. Coal Mines 2012, 43, 4–6. [Google Scholar]
  17. Lin, H.F.; Ji, P.F.; Kong, X.G. Precise borehole placement model and engineering practice for pre-draining coal seam gas by drilling along seam. J. China Coal Soc. 2022, 47, 1220–1234. [Google Scholar]
  18. Chen, Y.X.; Chu, T.X.; Chen, P. Quantitative study of 3D numerical simulation on optimizing borehole layout spacing of gas drainage. Coal Geol. Explor. 2021, 49, 78–84+94. [Google Scholar]
  19. Chen, Y.X.; Xu, J.; Peng, S.J. A gas–solid–liquid coupling model of coal seams and the optimization of gas drainage boreholes. Energies 2018, 11, 560. [Google Scholar] [CrossRef]
  20. Liu, J.; Wang, Z.F.; Li, X.C. Study on the methods of eliminating blank zone of mine gas drainage. Coal Sci. Technol. 2012, 40, 59–61+87. [Google Scholar]
  21. Li, R.Z.; Liang, B.; Sun, W.J. Experimental study on both gas drainage radius and bedding borehole space. China Saf. Sci. J. 2016, 26, 133–138. [Google Scholar]
  22. Hao, F.C.; Liu, Y.W.; Long, W.C. Effective gas extraction radius of different burial depths under creep-seepage coupling. J. China Coal Soc. 2017, 42, 2616–2622. [Google Scholar]
  23. Danesh, N.N.; Chen, Z.W.; Aminossadati, S.M.; Kizil, M.S.; Pan, Z.J.; Connell, L.D. Impact of creep on the evolution of coal permeability and gas drainage performance. J. Nat. Gas Sci. Eng. 2016, 33, 469–482. [Google Scholar] [CrossRef]
  24. Li, B.; Sun, D.H.; Zhang, L.L. Study on rational space between gas drainage boreholes passing through seam in coal mine. Coal Sci. Technol. 2016, 44, 121–126+155. [Google Scholar] [CrossRef]
  25. Zhao, D.; Liu, J.; Pan, J.T. Study on gas seepage from coal seams in the distance between boreholes for gas extraction. J. Loss Prev. Process Ind. 2018, 54, 266–272. [Google Scholar] [CrossRef]
  26. Zou, S.C.; Xin, S. Effective extraction radius of gas drilling in coal seam. China Saf. Sci. J. 2020, 30, 53–59. [Google Scholar]
  27. Liu, T.; Lin, B.Q.; Yang, W. Dynamic diffusion-based multifield coupling model for gas drainage. J. Nat. Gas. Sci. Eng. 2017, 44, 233–249. [Google Scholar] [CrossRef]
  28. Wei, J.P.; Qin, H.J.; Wang, D.K. Dynamic permeability model for coal containing gas. J. China Coal Soc. 2015, 40, 1555–1561. [Google Scholar]
  29. Zhang, N.; Li, X.R.; Cheng, H.M. A coupled damage-hydro-mechanical model for gas drainage in low-permeability coalbeds. J. Nat. Gas. Sci. Eng. 2016, 35, 1032–1043. [Google Scholar] [CrossRef]
  30. Liu, J.J.; Wang, D.; Wang, L. A coupled fluid-solid model considering Klinkenberg effect for methane extraction and its application. China Saf. Sci. J. 2016, 26, 92–97. [Google Scholar]
Figure 1. The in-hexagon and the in-octagon borehole layout.
Sustainability 15 12711 g001
Figure 2. The in-hexagon and the in-octagon borehole layout.
Sustainability 15 12711 g002
Figure 3. The extraction redundant area of in-polygon borehole layout.
Sustainability 15 12711 g003
Figure 4. The field test location.
Sustainability 15 12711 g004
Figure 5. The geometric and mesh model.
Sustainability 15 12711 g005
Figure 6. The evolution law of gas isobaric surface over time.
Sustainability 15 12711 g006
Figure 7. The curves of gas pressure from numerical simulations and field tests.
Sustainability 15 12711 g007
Figure 8. The evolution of extraction parameters over time.
Sustainability 15 12711 g008
Figure 9. The evolution of extraction parameters with time for initial gas pressures (1.0 MPa).
Sustainability 15 12711 g009
Figure 10. The gas isobaric surface shape at different gas pressure (t = 120 D).
Sustainability 15 12711 g010
Figure 11. The fitted curve between the gas extraction radius and the initial gas pressure.
Sustainability 15 12711 g011
Figure 12. The evolution of extraction parameters with time for initial permeability (5.0 × 10⁻¹⁷ m2).
Sustainability 15 12711 g012
Figure 13. The gas isobaric surface shape at different initial permeabilities (T = 120 D).
Sustainability 15 12711 g013
Figure 14. The fitted curve between the gas extraction radius and the initial permeability.
Sustainability 15 12711 g014
Figure 15. The evolution of extraction parameters with time for burial depth (400 m).
Sustainability 15 12711 g015
Figure 16. The gas isobaric surface shape at different buried depths (t = 120 D).
Sustainability 15 12711 g016
Figure 17. The fitted curve between the gas extraction radius and the burial depth.
Sustainability 15 12711 g017
Figure 18. The time-partition prediction model of gas extraction under different buried depths.
Sustainability 15 12711 g018
Table 1. The data of the in-polygon borehole layout.
Design SchemeThe Ratio of Number for BoreholeArea Redundancy Rate/%
The in-quadrangle borehole layout217
The in-hexagon borehole layout1.5410.9
The in-octagon borehole layout1.72>15.7
Table 2. Parameters of the numerical model.
ParameterParameter ValueParameterParameter Value
Elastic modulus/MPa2400Langmuir pressure constant/Pa3.03 × 106
Poisson ratio0.3Langmuir volumetric strain constant0.026
Initial porosity0.04Density of coal/(kg·m−3)1400
Initial permeability/m24.0 × 10−17Extraction negative pressure/KPa30
Initial gas pressure/MPa1.4Dynamic viscosity of gas/(Pa·s)1.08 × 10−5
Negative pressure/kPa30Diameter of the borehole/mm94
Klinkenberg factor/Pa1.44 × 105Spacing of the borehole/m6.0
Table 3. Data parameters of gas extraction under different gas pressure.
Gas Pressure/MPaBorehole Spacing/mSpace Volume/m3Relative Gas Emission/m3/tCost RateShape of Isopleth Surface
1.07.0772.91.522.62blank zone
6.5786.11.433.71-
6.0749.71.464.70-
1.25.5442.62.871.68blank zone
5.0437.12.842.37-
4.5399.33.002.91-
1.44.8242.25.560.77blank zone
4.0266.15.031.45-
3.3218.75.921.98-
1.63.5180.38.110.82blank zone
3.0156.69.171.10-
2.5126.610.851.38-
Table 4. The effective extraction radius for different initial gas pressures.
Time/DGas Pressure/MPaBorehole Spacing/mEffective Gas Extraction Radius/mFitting RelationshipCorrelation Coefficient
901.05.83.35 R = 3.1505 P + 6.4489 0.993
1.24.52.60
1.43.52.02
1.62.51.44
1201.06.53.75 R = 3.32 P + 6.9865 0.983
1.25.02.88
1.44.02.31
1.63.01.73
1501.07.54.33 R = 3.5785 P + 7.7703 0.953
1.25.83.35
1.44.52.60
1.63.82.20
Table 5. Data parameters of gas extraction under different initial permeability.
Permeability/m2Borehole Spacing/mSpace Volume/m3Relative Gas Emission/m3/tCost RateThe Shape of Isopleth Surface
3.0 × 10−174.5107.310.470.58blank zone
3.5197.65.361.59-
2.5139.96.882.49-
4.0 × 10−175.0173.48.190.61blank zone
4.0260.05.191.38-
3.0194.96.482.17-
5.0 × 10−175.5324.95.160.69blank zone
4.5340.54.751.30-
3.5265.25.741.99-
5.5 × 10−176.0345.85.210.63blank zone
5.0420.04.171.21-
4.0325.85.171.75-
Table 6. The effective extraction radius for different initial permeabilities.
Time/DPermeability/m2Borehole Spacing/mEffective Gas Extraction Radius/mFitting RelationshipCorrelation Coefficient
903.0 × 10−174.22.43 R = 1.0553 × 10 9 k 0.532 0.955
4.0 × 10−173.82.19
5.0 × 10−173.52.02
5.5 × 10−173.01.73
1203.0 × 10−173.52.02 R = 7.31 × 10 9 k 0.579 0.957
4.0 × 10−174.02.31
5.0 × 10−174.52.60
5.5 × 10−175.02.89
1503.0 × 10−175.53.17 R = 1.25069 × 10 10 k 0.591 0.953
4.0 × 10−175.02.89
5.0 × 10−174.52.60
5.5 × 10−173.82.19
Table 7. Data parameters of gas extraction under different buried depths.
Burial Depth/mBorehole Spacing/mSpace Volume/m3Relative Gas Emission/m3/tCost Rate
yuan/t
Shape of Isopleth Surface
4006.0510.12.761.42blank zone
5.3501.42.772.18-
4.8463.52.842.91-
4504.8242.25.560.77blank zone
4.0266.15.031.45-
3.3218.75.921.98-
5003.3150.18.690.79blank zone
2.8136.19.281.16-
2.3108.410.981.47-
5502.884.914.960.45blank zone
2.385.214.060.81-
1.864.317.571.08-
Table 8. The effective extraction radius for different burial depths.
Time/DBurial Depth/mBorehole Spacing/mEffective Gas Extraction Radius/mFitting RelationshipCorrelation Coefficient
904004.82.77 R = 31.843 e 0.00612 H 0.994
4503.52.02
5002.51.44
5502.01.15
1204005.33.06 R = 31.923 e 0.00586 H 0.991
4504.02.31
5002.81.62
5502.31.33
1504006.03.46 R = 36.506 e 0.00589 H 0.999
4504.52.60
5003.31.90
5502.51.44
Disclaimer/Publisher’s Note: The statements, opinions and data contained in all publications are solely those of the individual author(s) and contributor(s) and not of MDPI and/or the editor(s). MDPI and/or the editor(s) disclaim responsibility for any injury to people or property resulting from any ideas, methods, instructions or products referred to in the content.

