Article

Variability of Extreme Events in Coastal and Inland Areas of South Korea during 1961–2020

1
Department of Environmental Engineering, Seoul National University of Science & Technology (SeoulTech), Nowon-gu, Seoul 01811, Republic of Korea
2
Institute of Environmental Technology, Seoul National University of Science & Technology (SeoulTech), Nowon-gu, Seoul 01811, Republic of Korea
3
Department of Agricultural Engineering, Institute of Agriculture and Life Science, Gyeongsang National University, Jinju-si 52828, Republic of Korea
4
Department of Agricultural and Biological Engineering/Tropical Research and Education Center, Institute of Food and Agricultural Sciences, University of Florida, Homestead, FL 33031, USA
*
Author to whom correspondence should be addressed.
Sustainability 2023, 15(16), 12537; https://doi.org/10.3390/su151612537
Submission received: 2 July 2023 / Revised: 9 August 2023 / Accepted: 16 August 2023 / Published: 18 August 2023
(This article belongs to the Special Issue Advances in Sustainable Management of the Water Environment)

Abstract

:
The increased concentrations of greenhouse gases have led to global warming and an increased frequency and intensity of extreme weather events. Such changes in weather patterns may have unexpected implications for everyday life and water resource management in coastal and inland areas; thus, it is critical to understand the pattern of the changes. This study investigated how extreme weather events have changed in inland and coastal South Korea in the past 60 years (1961–2020) at different temporal scales, from monthly to yearly. This study quantified extreme weather events using multiple meteorological indices such as consecutive dry days (CDD), consecutive wet days (CWD), tropical nights, and icy and frosty days. The trends in the extreme weather indices were statistically tested using a non-parametric test. The results showed increases in the minimum and maximum air temperature and the frequency of warm and cold nights and days. The number of CDD and maximum five-day precipitation (RX5day) at the coastal and inland stations increased in the extreme precipitation-related index. The number of warm days and warm nights increased significantly at the majority of weather stations over the 60 year study period. The number of CWD increased during the selected period, but this was not statistically significant. In addition, we found that the temporal variations in the indices became greater over time, which implies the frequency and severity of extreme events such as drought and storm events may increase in the future. This study could help researchers determine the climatic areas at the selected stations that are critical for optimal water resource management planning and/or modeling.

1. Introduction

Climate change affects most socioeconomic activities either directly or indirectly. The rise in surface temperatures, heat and cold waves, extreme rainfall, and severe cyclones cause human deaths and lead to agricultural and infrastructural losses worldwide. The increase in the frequency of meteorological disasters and related losses have been well documented [1]. Extreme events, defined as an event exceeding or falling short of a threshold determined based on historical records [2], have occurred frequently due to global warming [3]. The frequency, severity, spatial extent, length, and timing of extreme weather and climate events are changing due to climate change, leading to unprecedented occurrences [4]. Assessing extreme weather and climate events is one of the essential tasks in modern climatology. Many studies have demonstrated the impacts of extreme events, with significant changes observed in various climatic variables [5,6].
Extreme climate, defined as a severe meteorological and climatological event that exceeds a certain threshold [7], such as unusually hot heat waves, long droughts, prolonged rainfall and flooding, and frequent and severe tropical cyclones [8], directly affects the number of cool and hot days and the length of dry and wet periods. Extreme climate has substantial consequences and poses challenges to society [9,10,11,12]. These extreme climate events frequently have negative impacts on agriculture, human health, water resources, and infrastructure. There is growing concern about how climate change could affect the intensity and frequency of future extreme weather and climate events.
The Asian continent has had the most natural disasters, with catastrophic occurrences accounting for 43% of all extreme climate events worldwide during the 1990s and 2000s. These disasters are becoming increasingly severe in the 21st century [13]. The United Nations classified South Korea as a water-deficient country, which has lately encountered genuine dry spells and water-shortage issues [14]. According to historical weather data, South Korea has recently endured a massive dry season on a national level [15,16]. Researchers have examined extremes in precipitation and temperature, focusing on extreme variabilities in different countries, such as Japan [17], Thailand [18], Korea [15,16], India [19,20], Iran [21,22], China [4,23,24], and Nepal [25,26]. Some observational studies in Korea have found a link between the recent changes in extreme precipitation and climate change. The severity of summer rains and typhoons has increased in South Korea [27,28]. Some researchers have investigated the temperature changes in South Korea and discovered a link between temperature and ENSO episodes [29,30,31]. Studies reported that the air temperature on the Korean peninsula increased in the 20th century, and the South Korean government began to pay attention to extreme events [16,27,32], climate change impacts on water resources [33,34], and the agricultural sector regarding drought [35,36,37].
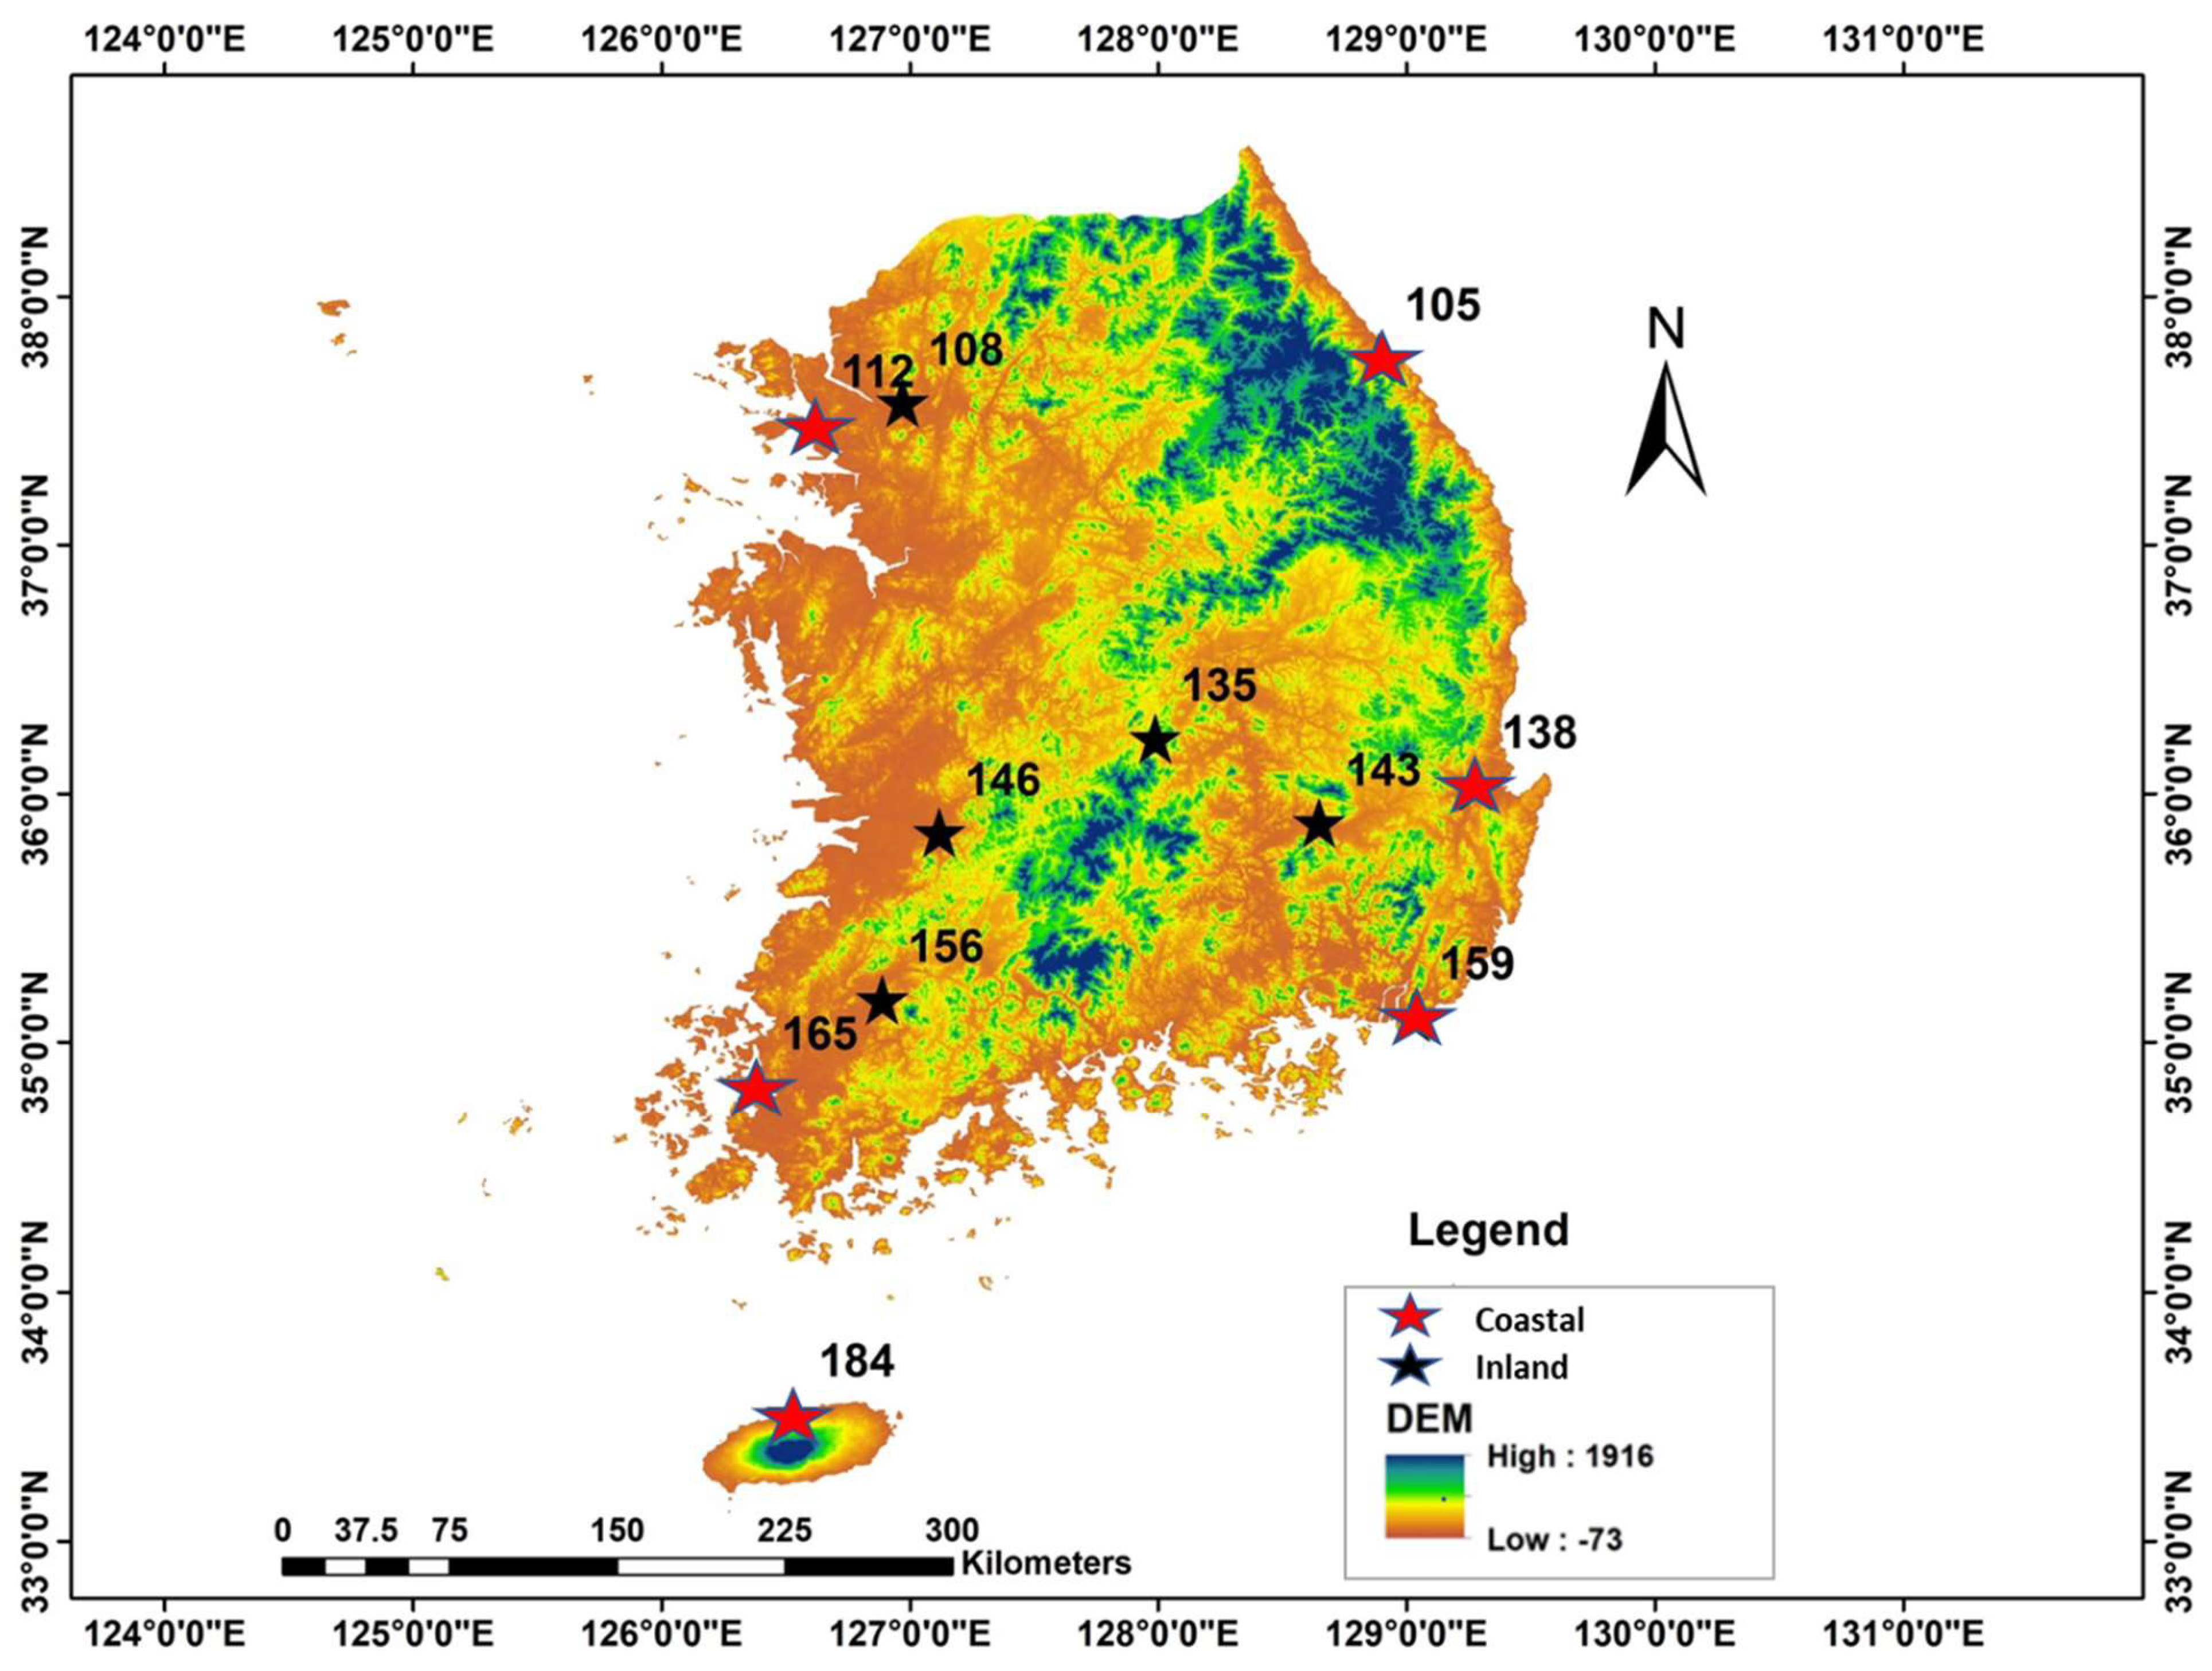
Climate change, shifts in the temporal trends of drought, and extreme occurrences in South Korea have generated considerable concern. Although changes in climate extremes should be regarded as significant determinants of climate change’s impact, research on their characteristics has been limited thus far. The spatial variation in climate in Korea is determined by key climate factors such as latitude, elevation, geographical location, land/sea heating properties, and ocean currents. In reaction to the East Asian Monsoon, it is hot and humid in the summer but cold and dry in the winter [38]. Due to the effects of the Eurasian continent, Korea has a predominantly continental climate. The climate of coastal areas, which is influenced mostly by the ocean, differs from that of inland areas [39]. On average, coastal regions experience a strong temperature gradient in the lower atmosphere at the land–ocean boundary. The rapid change in atmospheric temperature enhances horizontal and vertical pressure gradients in the atmosphere, which trigger the local wind system characterized by a flow from ocean to land during the day [40]. As a result, high evaporation from the ocean increases the moisture content in the atmosphere. This moist air mass hits the coastal terrain (or topography) and causes higher annual rainfall than the interior of the continent. After striking the coast, the air mass has no or very little moisture content to transfer to the interior of the continent and causes low or below average annual rainfall. Some attempts have been made to identify the extreme events in South Korea; however, the studies have not focused on coastal and inland areas [16,17].
To the best of our knowledge, long-term changes in the extremes of South Korea’s coastal and inland areas have not been thoroughly explored. This study grouped selected weather stations into coastal and inland areas according to their location and proximity to the ocean and investigated if the temporal changes in the weather extremes are statistically significant, with the expectation of providing data needed to assess the potential impacts of such changes on agriculture, water resources, and human health. The objectives of this study were to examine how extreme weather events historically changed in inland and coastal areas of South Korea over a 60 year period (1961–2020), and to estimate their relative contributions to trends in specific extreme climate events at stations. Investigating the extreme trends in selected areas will help us understand the long-term trends and variability in the precipitation and temperature in South Korea. Notably, this study investigates (a) the trends in the spatial variability in precipitation and temperature extremes and extreme events that occurred in earlier decades in coastal and inland areas, (b) temporal trends in long-term precipitation and temperature to determine the significant trends in extreme conditions, and (c) trends in the precipitation and temperature indices in coastal and inland areas based on long-term station records.

2. Materials and Methods

2.1. Study Area

Since climate extremes can have complex spatial and temporal variations and Korea is known for its mountainous topography, high-resolution data suitable for regional or local analysis are required to better understand climate extremes and their application to impact assessments across Korea [41]. East Korean warm current and North Korean cold current in the east sea, as well as the yellow sea warm current, play a role in affecting Korea’s climate [39]. We grouped inland and coastal stations based on their proximity to the coast (Figure 1). For example, weather stations in coastal cities located along the coastline were considered coastal stations, and those located inland were considered inland stations (Table 1). Coastal areas at lower altitudes generally experience milder temperatures due to the influence of the nearby ocean, which acts as a temperature buffer. Summers might be cooler, and winters milder compared to higher altitudes. Coastal regions are influenced by sea breezes, which can bring in cooler air from the ocean during the day, moderating temperatures. Inland areas may experience different wind patterns, often influenced by local topography. Inland areas at higher altitudes experience more extreme temperature variations. Summers can be hotter and winters colder compared to coastal areas. The annual average maximum temperatures over 60 years (1961–2020) were 18 °C and 18.3 °C in the coastal and inland areas, respectively. The annual average minimum temperatures were 10.4 °C and 8.5 °C in the coastal and inland areas of the selected stations, respectively, and the annual precipitation was 1311.2 and 1255.9 mm in the coastal and inland areas, respectively. The summer rainy season brings the highest precipitation. Various parts of South Korea receive 1200–1400 mm of rain, which is almost 30% more than the global average of 973 mm [42,43]. Statistics Korea (under the Ministry of Economy and Finance) estimates that approximately 51.6 million people live in South Korea in 2023 [44].

2.2. Data Used, Acquisition, and Climate Indices

Herein, the climate indices, recommended by the WMO Expert Team on Sector-Specific Climate Indices (ET-SCI), were calculated using the R software package (v4.1.1; Vienna, Austria) “CLIMPACT2” [45]. CLIMPACT2 generated the core ET-SCI indices and noncore ET-SCI indices to comprehend past precipitation and temperature changes better. Herein, 11 meteorological stations were employed between 1961 and 2020, and changes in climatic patterns were recorded over two time periods, i.e., 1961–1990 and 1991–2020.
From 1961 to 2020, indices were calculated using 1970–2000 as the baseline period. Before calculating the indices, the errors were minimized using quality control processes that used CLIMPACT2 to perform the homogeneity test. An R-based toolkit RHTest, which uses a two-phase regression technique [46] for the detection and adjustment of inhomogeneity, is available from these data. The Expert Team on Climate Change Detection and Indices (ETCCD) proposed 27 core indices, emphasizing extremes derived from the station’s daily data. The WMO’s Working Group on Climate Change Detection distinguished a numerous indices list [47,48]. The relevance of the sectors, namely, Health, Agriculture and Food Security, and Water Resources and Hydrology, was reflected in the core and noncore indices. These extreme indices are suitable for capturing precipitation and temperature fluctuations across the study area. Percentile-, absolute-, duration-, and threshold-based indices were all used to categorize the indices. Table 2 describes the indices related to the precipitation and maximum and minimum temperatures used.
The Mann–Kendall (MK) test was used to test if the differences between the weather patterns observed in the two periods, 1961 to 1990 and 1991 to 2020, are statistically significant. The MK test, widely used in time series analysis, was expected to help detect trends in the data over time without making any assumptions about the underlying distribution. The test is based on the ranks of the data and determines whether there is a monotonic trend (i.e., a trend that is consistently increasing or decreasing) in the time series. More details on the MK test can be found in the Supplementary Materials.

3. Results

3.1. Monthly Precipitation Changes

Figure 2 shows the temporal variation in monthly average precipitation in the coastal and inland areas during 1961–2020. The coastal areas showed negative changes in June, whereas the monsoonal months, such as July, August, and September, showed positive changes in precipitation, which is consistent with previous studies [37,49,50]. However, precipitation had mixed effects throughout the winter and summer, yielding positive and negative outcomes. The Gangneung (105) station displayed a negative trend in the winter, while the other stations displayed both positive and negative trends. This indicates increasing precipitation trends in May, unlike those in April and June, which exhibited negative trends. In June and July, the Busan (159) station had the most positive and negative changes (Figure 2). Positive changes were mainly observed in the monsoonal and winter months; most stations showed negative changes.
In the inland stations, the monsoonal months showed positive changes in precipitation; however, the summer and winter months mainly showed a negative trend in precipitation patterns. The Daegu (143) station, with less precipitation in the period under comparison, showed the most negative changes (Figure 2). Overall, all the stations indicated positive and negative monsoonal and winter precipitation trends. The Busan station showed the most positive and negative fluctuations in June and August.

3.2. Changes in Precipitation Indices

The consecutive dry days (CDD) revealed that the dry spell in the coastal areas was indeed getting worse. Except for the Gangneung (105) and Pohang (138) stations, most regions showed a positive CDD trend. Table 3 shows the changes in all indices from 1961 to 1990 and from 1991 to 2020. Except for the Mokpo station (165), which showed a negative trend, the consecutive wet days (CWD) indicated a positive trend. The total precipitation (PRCPTOT) in the coastal stations increased gradually; the greatest precipitation change (105.34 mm) was reported at the Busan station (159). The intensity of heavy rainy days increased when considering the R30 mm index. The rainfall intensity in the coastal areas showed an increasing trend, except for station 112. Except for station 165, the maximum five-day precipitation quantity (RX5day) showed an upward trend in the coastal stations. The same increasing trend was observed in the R95p, R99p, and daily precipitation intensity (SDII). The annual precipitation from heavy and very heavy rainy days increased in all the coastal stations except station 156. The analysis of extreme rainfall indices from both inland and coastal stations across different regions of South Korea revealed a distinctive localized topographical impact.
The CDD illustrates changes in dry spells for the inland stations, where the maximum positive trend is 1.03 and the negative trend is −0.67. In all stations, the CWD showed a positive trend, indicating that the number of dry days is steadily increasing. The PRCPTOT indices revealed that precipitation has increased in the inland areas; however, one station (146) showed a negative precipitation trend. The R30 mm showed a trend increase at the stations. These trends imply that rainfall intensity is increasing in the inland areas. The maximum five-day (RX5day) precipitation indices showed increasing trends in the inland areas, indicating an increased rainfall intensity (Table 3). The indices R95p and R99p showed a trend increase at the selected inland stations for heavy rainfall days. The SDII follows the same pattern, indicating an increase in wet days in inland areas. Overall, all the extreme precipitation indices showed increasing trends in the inland and coastal stations (Figure 3). The consecutive dry days (CDD) showed that the dry spell in the coastal areas and inland areas shows less changes. The consecutive wet days (CWD) showed a positive trend. The total precipitation (PRCPTOT) in the coastal stations increased gradually and exhibits a high peak in the plots. The intensity of heavy rainfall on heavy rainy days when rainfall was at least 30 mm (R30 mm) increased. The maximum five-day precipitation quantity (RX5day) showed an upward trend. The same increasing trend was observed for the total annual precipitation from heavy rainy days (R95p), the total annual precipitation from very heavy rainy days (R99p), and the daily precipitation intensity (SDII).

3.3. Monthly Temperature Changes

Coastal areas showed an increasing trend in maximum and minimum temperatures with a few exceptions (Figure 2 and Figure 3), which agrees with previous findings by Park and Min (2017) [50] and Heo and Bell (2019) [51]. From August to December, only the Mokpo station (165) displayed a negative trend, whereas the rest of the stations indicated an increasing trend in selected months. The diverse topography of South Korea, with its mountains and coastal regions, can create microclimates. These small-scale climate variations may result in different weather observations at nearby weather stations. It is normal for the weather to exhibit some degree of variability due to various factors such as natural climate cycles (e.g., El Niño and La Niña), seasonal changes, and short-term weather patterns [52]. The temperature increased more in the winter months than in the other months, indicating that the maximum winter temperature would rise in the future. The Incheon (112) station’s maximum temperature rose by 2.2 °C in February, following similar patterns to the other stations. All the stations had the lowest temperature fluctuations in August (Figure 4). The maximum temperature at the inland stations showed a positive trend. The temperature variations in the stations were minimal in August (both positive and negative). February saw the greatest temperature variation after January and March. Winter showed higher temperature variations than the summer and monsoon seasons. The maximum temperature variation at the Daegu (143) station was 2.23 °C throughout this period (Figure 4).
Regarding the minimum temperature, every weather station in the coastal areas showed an increasing minimum temperature trend in most of the months. In the winter, there were many variations in the minimum temperature. Changes were observed at the Pohang (138) and Jeju (184) stations, which showed monthly temperature changes of more than 1 °C. Noteworthy changes in the minimum temperature occurred in February across all of the locations. The smallest temperature change was recorded at the Mokpo (165) station (Figure 3). The minimum temperature in the selected inland stations showed an increasing trend. The maximum changes were observed in February; the winter months showed the maximum positive temperature changes at all stations except Chupungryeong (135). The temperature at the Chupungryeong (135) station dropped throughout the monsoon months, indicating negative inclinations. Noteworthy changes occurred in the months of January, February, and March (Figure 5).

3.4. Changes in Temperature Indices

In the coastal stations, the summer days (SU) and tropical nights (TR) exhibited an increasing trend, with the most summer days recorded at the Incheon (112) station and with the maximum TR of 16.2 observed at station 184 (Table 4). The ice days (ID) and frost days (FD) showed negative trends, indicating that the maximum and minimum temperatures increased. The daily temperature range (DTR) showed the difference between the daily maximum and minimum temperatures, with a decreasing trend in coastal areas. The number of cool days (TX10p) and cold nights (TN10p) showed a negative trend. The number of hot days (TX90p) and warm nights (TN90p) indicated an increasing trend in the coastal areas, except at station 165 for the TX90p index. There was an increase in the number of extreme cold nights and days, and the number of warm nights and days increased in the selected period. The indices indicated that the maximum and minimum temperatures increased in the coastal areas. The warm spell duration indicator (WSDI) exhibited a positive trend, and the cold spell duration indicator (CSDI) exhibited a negative trend in the selected period; these show temperature increases at the coastal stations.
For the inland stations, the SU and Tr showed increasing trends at all the stations except station 135 for Tr. The ID and FD showed negative trends except for station 135 for FD (Table 4). FD indicates the days when the minimum temperature was below 0 °C, and ID indicates the days when the maximum temperature was below 0 °C in the area. The DTR index showed increasing and decreasing trends at the inland stations, a negative change at stations 108 and 143, and a positive change at the rest of the stations. These results indicate that an increasing temperature trend is evident in the inland areas after the abrupt change. Indices like the number of cool days (TX10p) and cold nights (TN10p) showed a negative trend, except for the Chupungryeong (135) station for TX10p. The number of hot days (TX90p) and warm nights (TN90p) showed positive trends, except for station 135 for TN90p (Table 4). The WSDI showed a positive trend and the CSDI showed a negative trend except for Chupungryeong (135) station. These results indicate that climate change may increase the frequency, duration, and intensity of extreme hot events (Figure 6). Summer days (SU) and tropical nights (TR) exhibited an increasing trend, while ice days (ID) and frost days (FD) showed a negative trend. The daily temperature range (DTR) showed positive trends in the inland and negative trends in the coastal area. The number of cool days (TX10p) and cold nights (TN10p) showed mostly negative trends, while the number of hot days (TX90p) and warm nights (TN90p) showed mostly positive trends. The warm spell duration indicator (WSDI) exhibited a positive trend and the cold spell duration indicator (CSDI) showed a negative trend.

3.5. Trend Analysis of Precipitation and Temperature Indices

The CDD showed positive trends in most coastal stations; however, stations 105 and 138 exhibited negative trends. The CWD showed the opposite of the CDD. Regarding the CWD, most of the stations’ trends were positive except for stations 112 and 184, which showed negative trends. However, all the stations did not exhibit significant changes. PRCPTOT, R30 mm, R95p, RX5day, and SDII indicated positive trends but were not significant except for station 112 for R30 mm (Table 5). R99p exhibited neither positive nor negative trends in the coastal stations. The temperature-related indices showed either negative or significant positive changes. Regarding DTR, FD, and ID, most stations showed significant negative changes in the coastal areas except for station 159, which showed a positive change in DTR and no change in ID. However, station 165 showed only negative trends in all indices, whereas ID indicated no trend in the Jeju (184) station since no ice days were observed and no significant changes were identified. The SU index showed significant positive changes on the summer days; only the Mokpo (165) station showed a positive trend, and there was no significance at all the other stations. Substantial positive and negative changes were identified for the TN10p and TN90p indices; station 165 did not show significant changes, whereas significant positive changes were observed at station 138 for TN10p. The TR indices showed significant positive trends at all the stations except station 165, which showed a positive change with no significance. TX10p showed significant negative trends except at station 165, which showed a negative change with no significance. TX90p showed significant positive trends at all the stations except station 165, which exhibited a negative trend in the indices (Table 6).
The CDD exhibited a positive trend at the inland stations, whereas the CWD showed both positive and negative trends at all stations. Stations 108 and 135 exhibited a significant negative trend. The majority of the precipitation indices, including PRCPTOT, R30 mm, R95p, RX5day, and SDII, showed a non-significant positive trend, while the rainfall intensity increased at the stations. In the case of station 146, both PRCPTOT and SDII decreased over time. The R95p index showed a significant positive trend at the inland stations 135 and 143 (Table 5). DTR showed mixed trends at the stations, i.e., significant positive, significant negative, and positive trends. FD and ID showed significant negative changes at the stations except for FD at station 135. SU showed significant positive trends except at the Chupungryeong (135) station, which showed a positive trend with no significant change. The indices TN10p and TX10p showed significant negative trends in most areas except station 135, which showed positive trends that were not significant. The indices TN90p, TX90p, and TR showed significant positive trends at most stations; however, station 135 showed negative and positive changes but no substantial changes in the indices (Table 6).

4. Discussion

Currently, there is a need to identify relevant climate change signals, particularly in precipitation and temperature, which may be used in coastal and inland planning as well as policymaking. With this consideration, our research has focused on the coastal and inland areas of South Korea in various climate zones. This study demonstrated a notable difference in the variability of coastal and inland area precipitation and temperature.
When compared to the reference period (30–30 years), total and extreme precipitation greatly increased over the past 60 years (1961–2020). As the time period changed, there were obviously increasing trends in annual precipitation as well as extreme events like PRCPTOT, R95p, and R99p. Summer rainfall (late June to early September) in conjunction with synoptic disturbances, typhoons, and convective storms contribute to the total annual precipitation [49,53]. On various timescales, the subtropical East Asian summer monsoon, which produces midsummer rainfall, experiences significant fluctuation, resulting in devastating floods throughout Korea [54]. The annual average precipitation over South Korea showed a rising trend, with increases in precipitation in July and August [54]. Moreover, the contribution of extreme precipitation to total precipitation increased significantly, indicating that the rate of change in extreme precipitation is greater than that of total precipitation. The western North Pacific subtropical high is a prominent large-scale circulation system that controls rainfall during the East Asian summer monsoons and determines the commencement and withdrawal of the summer monsoon [55,56]. Many researchers have focused on the temporal–spatial trends of summer precipitation in South Korea, which is located in the East Asian monsoon zone and receives more than 50% of its annual precipitation during the summer [57,58,
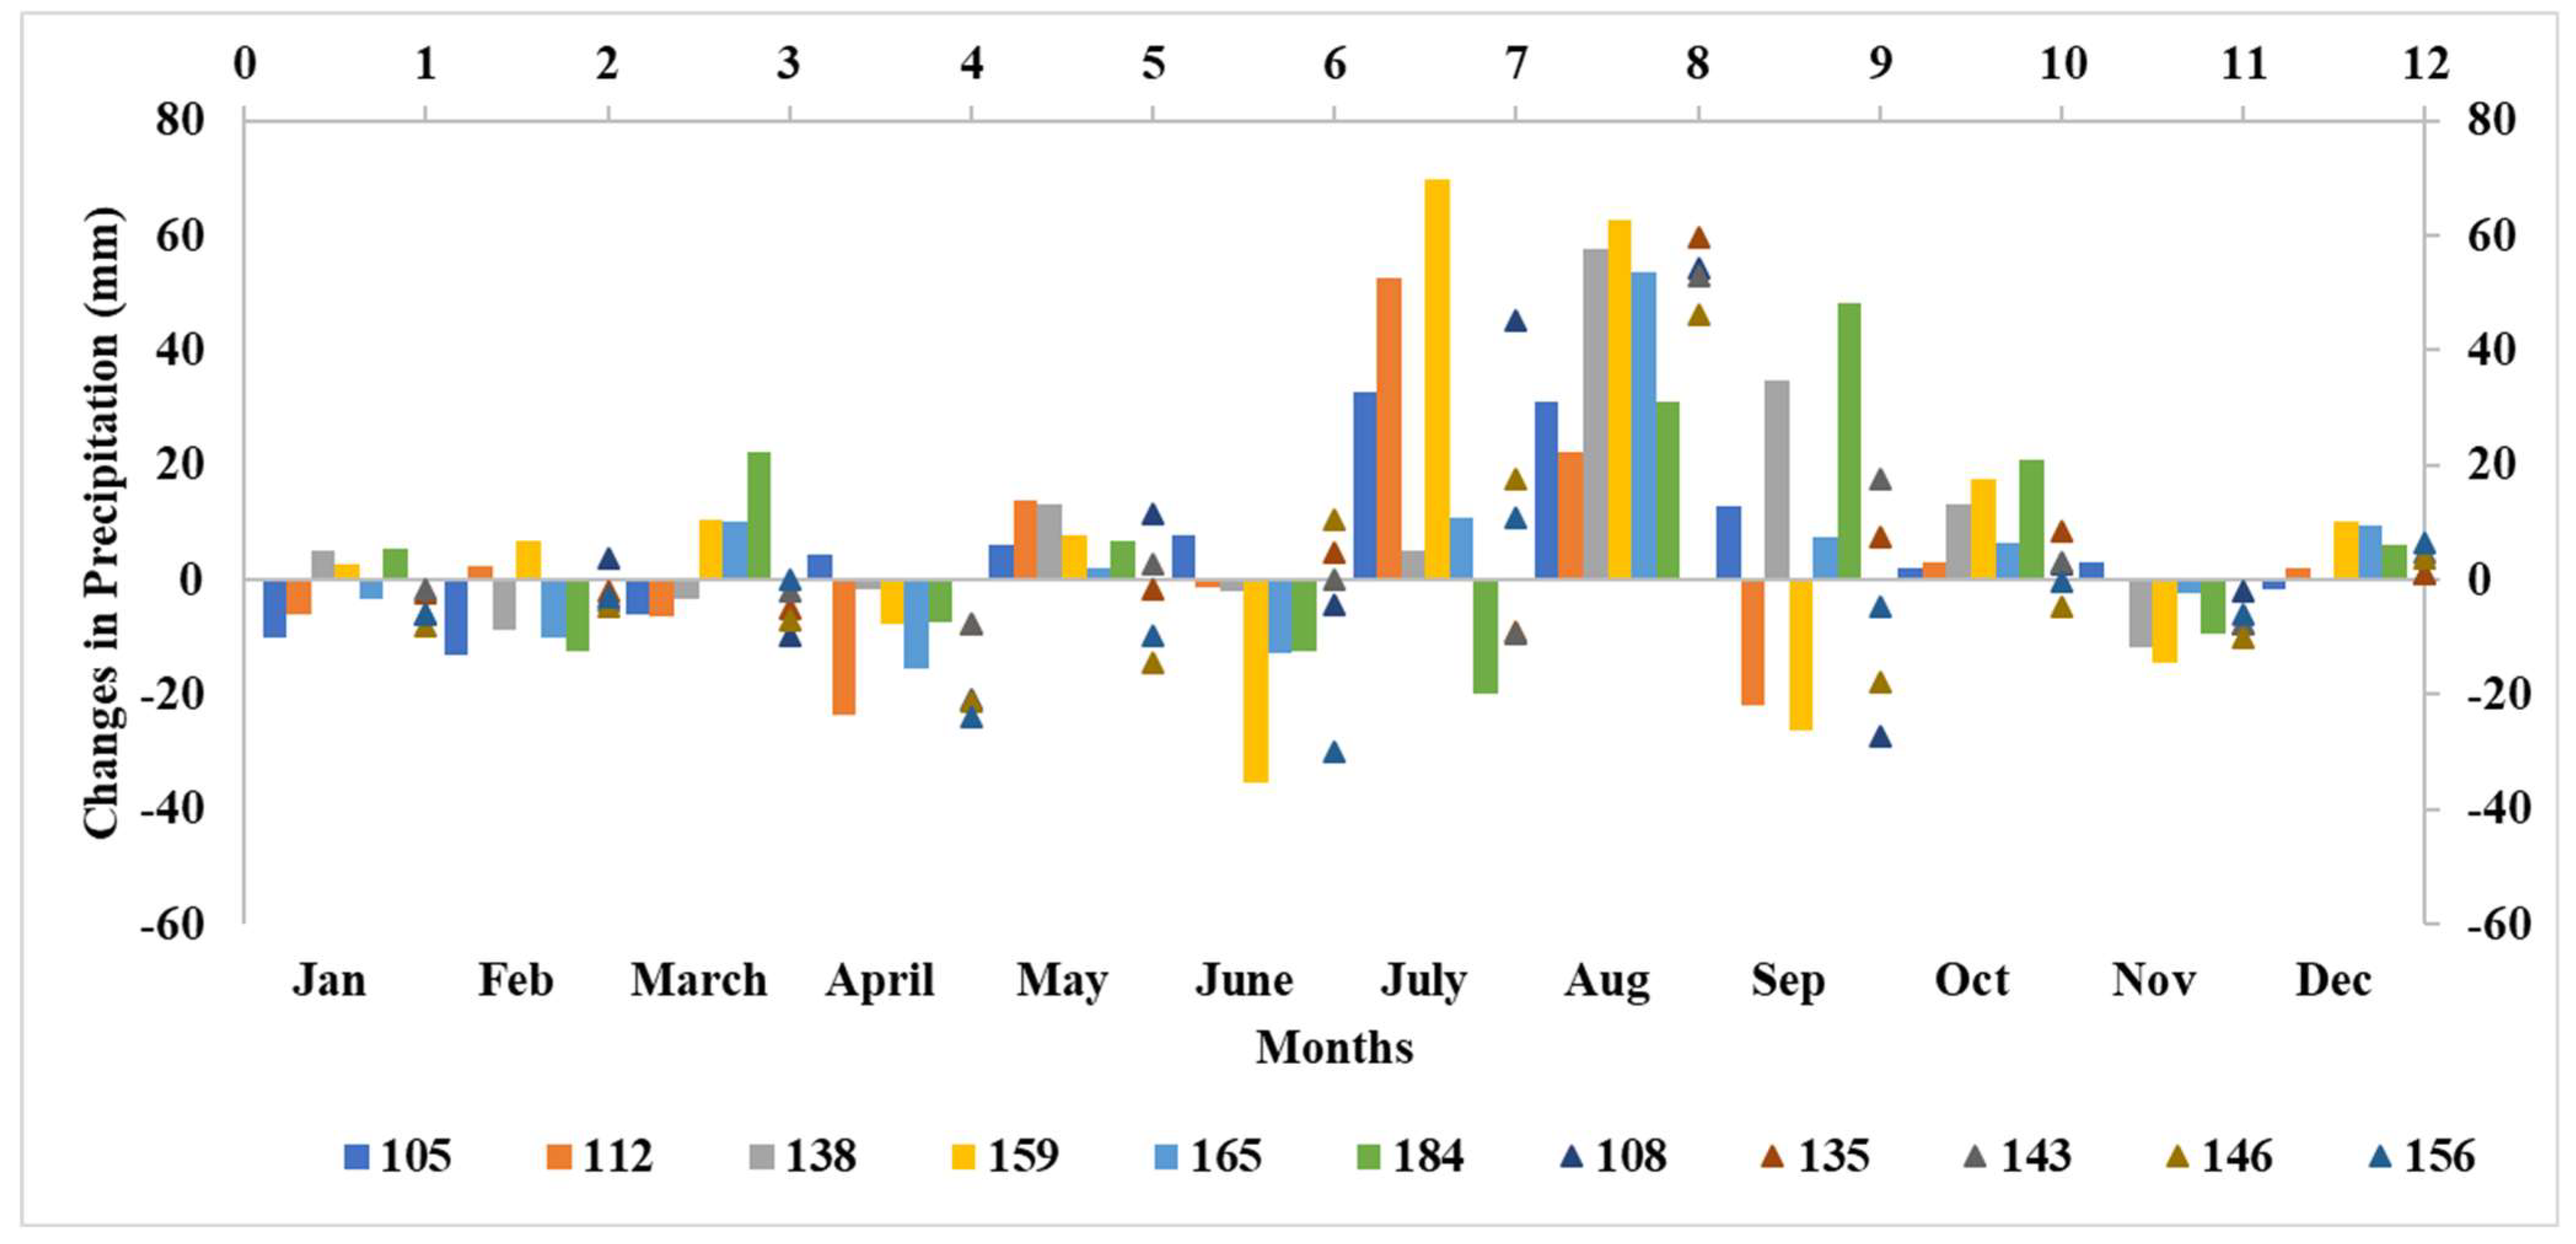
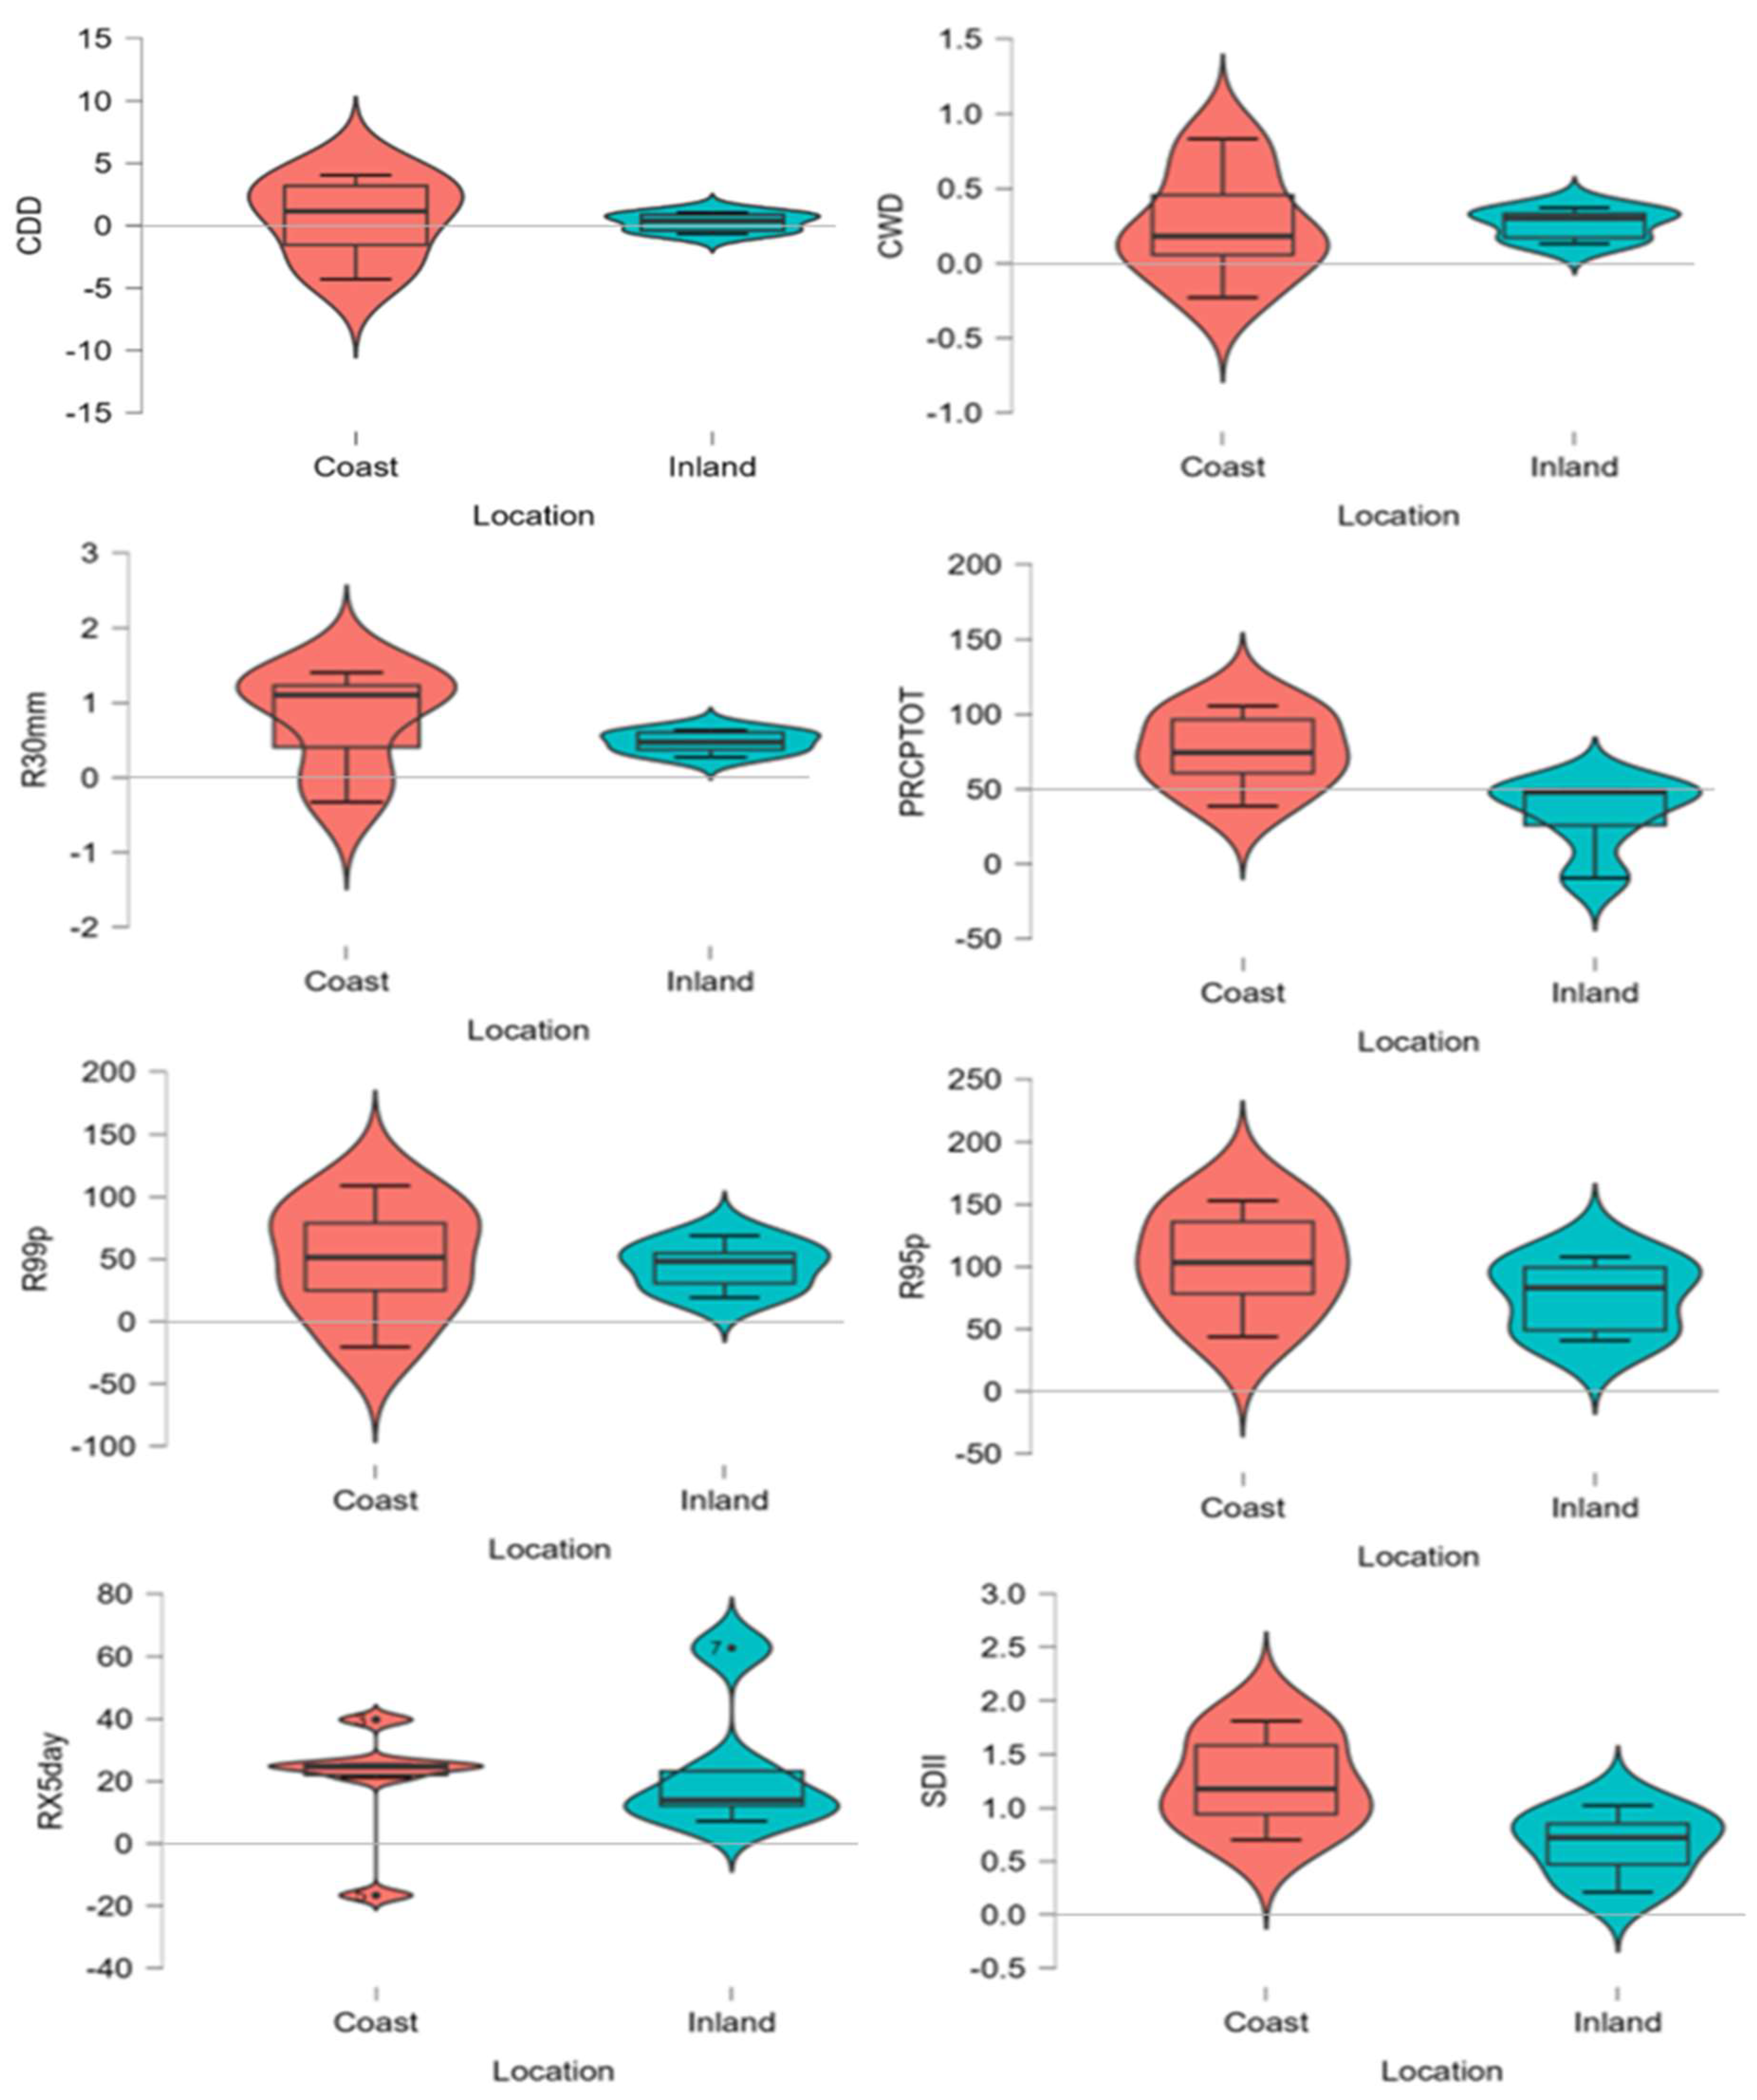
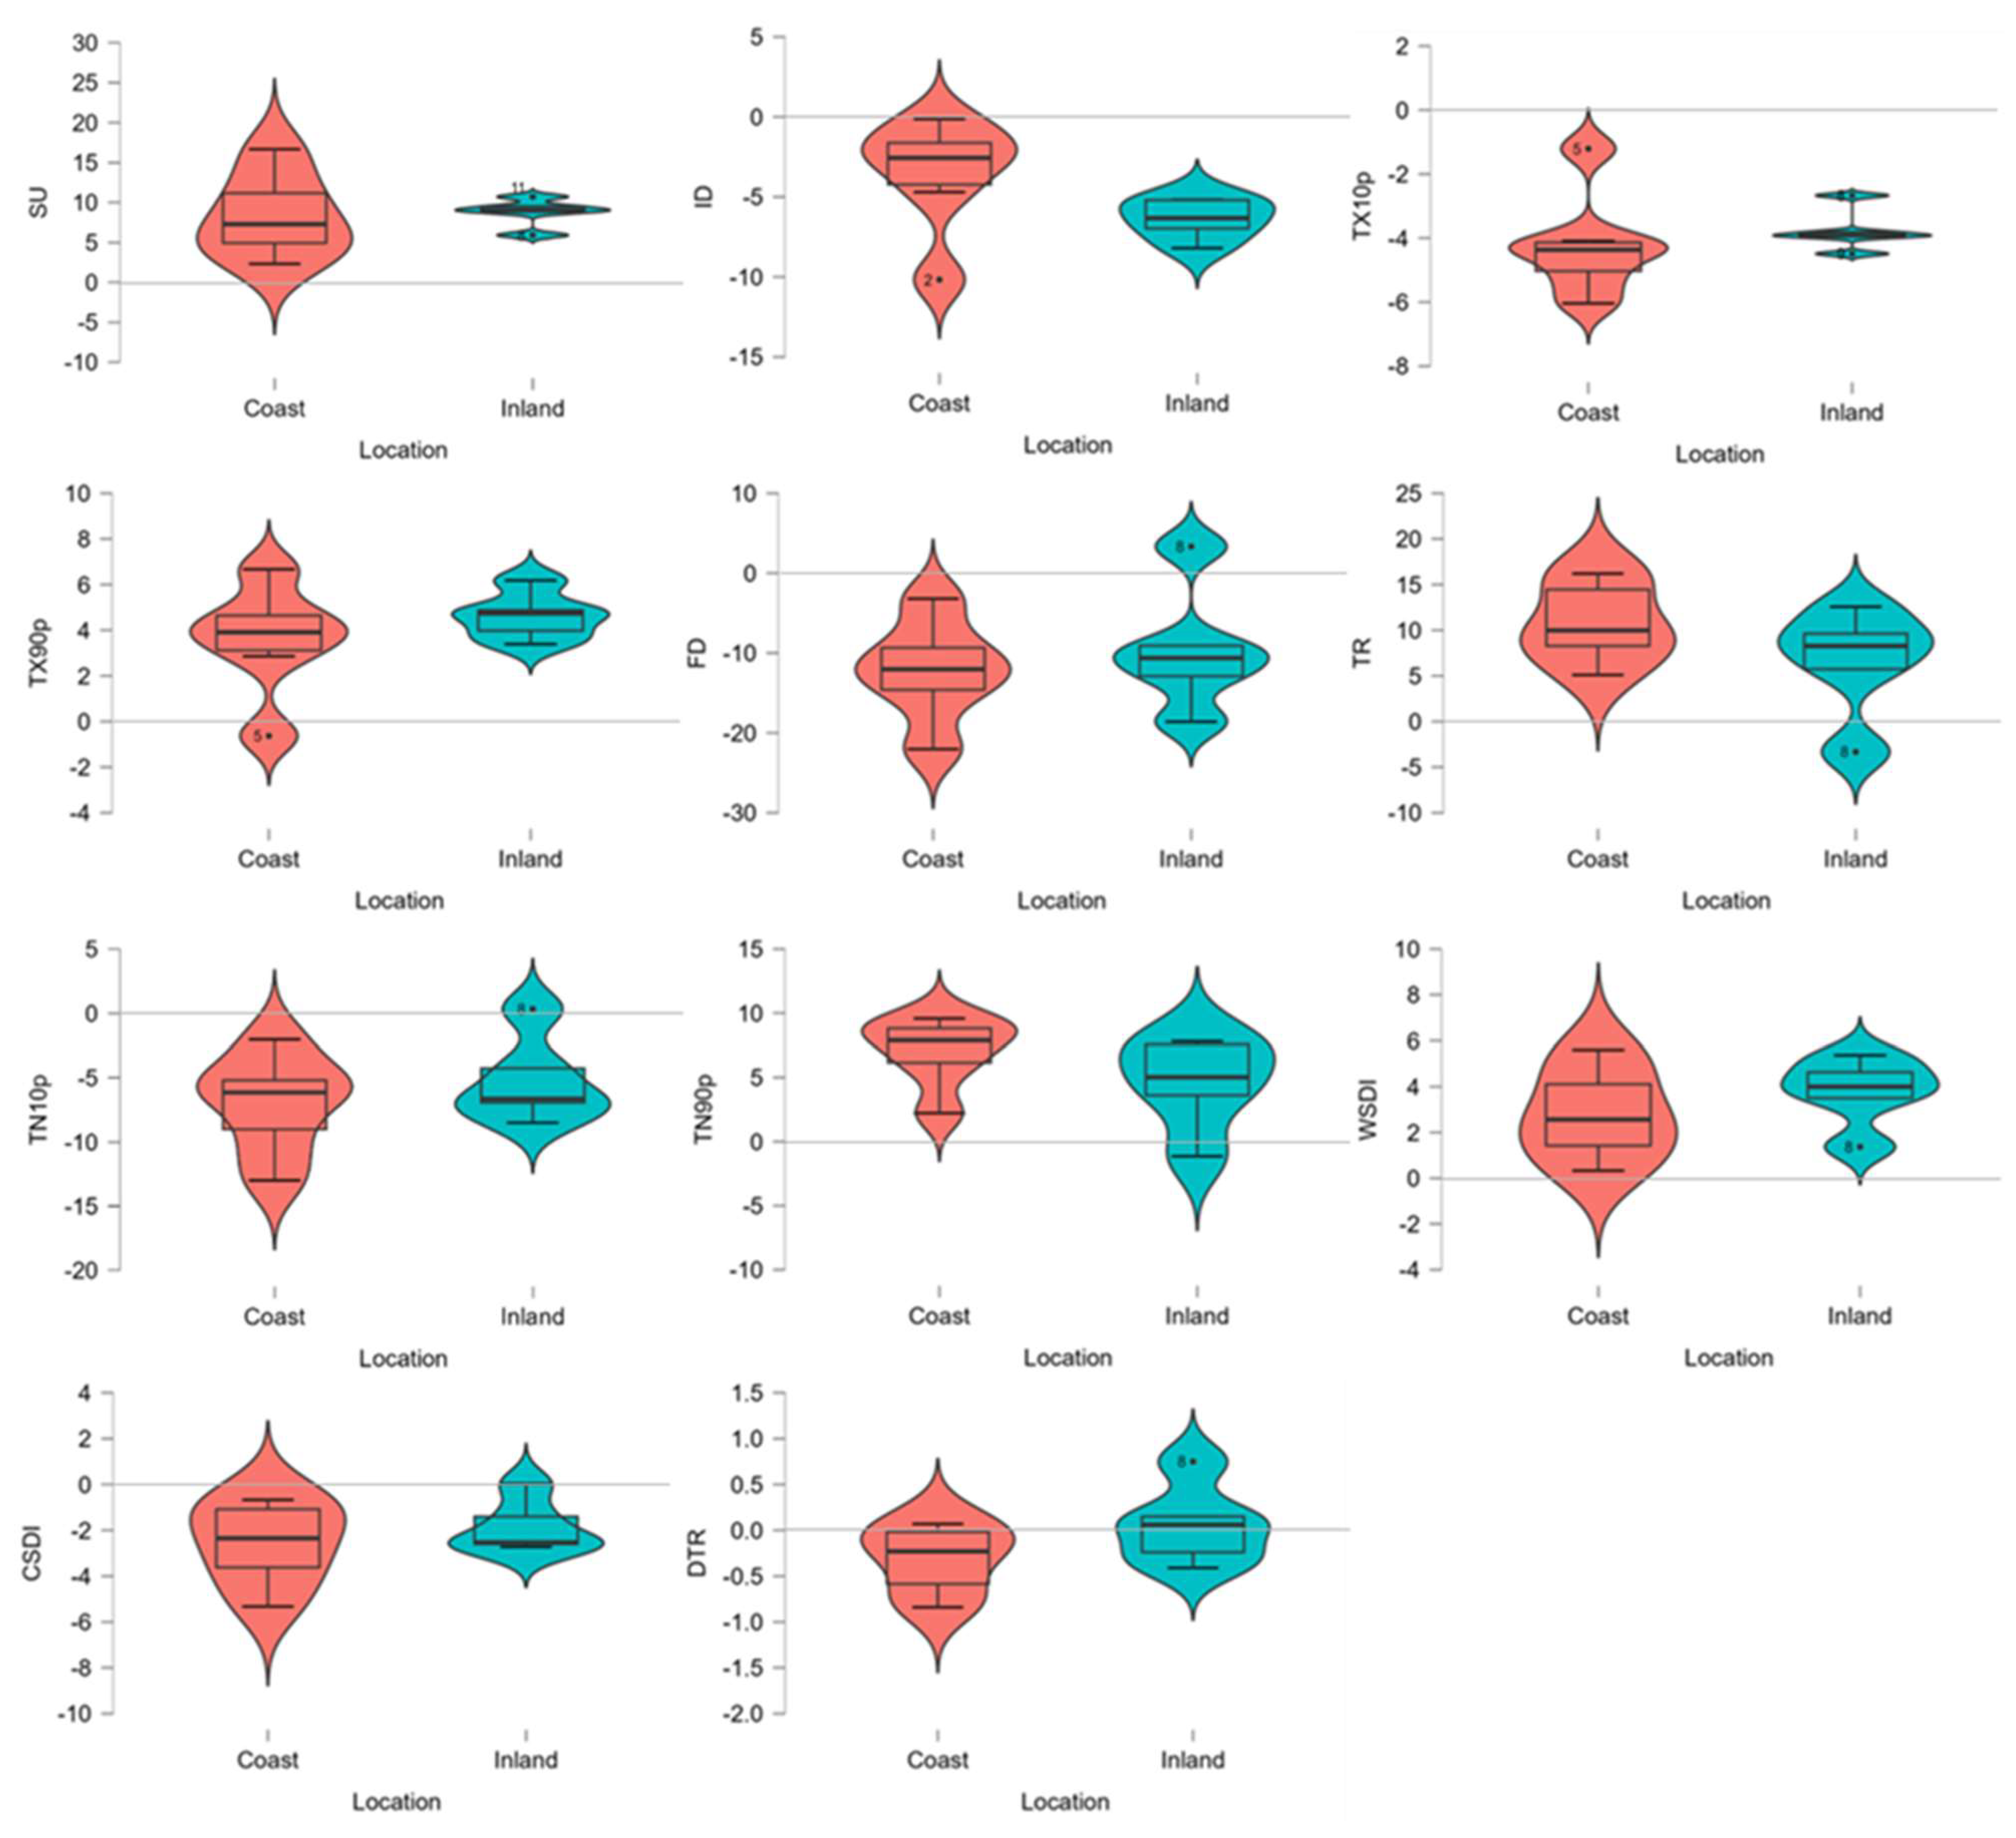
59]. All stations showed positive changes in the coastal areas, whereas only 165 stations exhibited negative changes. Many of the extreme precipitation indicators increased, but not significantly. The CDD and CWD revealed positive and negative changes in the coastal areas, yielding variations in precipitation patterns at various coastal sites. However, the CDD and CWD did not vary appreciably. For the inland stations, the CDD showed a positive shift, indicating that the number of dry days increased with time. However, both positive and negative changes were identified for the CWD, with station 108 showing a substantial negative trend.
The variability in precipitation, which reflects the positive changes in the region, was highest in the coastal stations. When compared to the inland stations, the CDD and CWD were similarly higher in the coastal region. The extreme precipitation RX5day showed increasing trends at the inland and coastal stations except for the Mokpo (165) station. These results suggest an increase in precipitation intensity in both coastal and inland areas. The same results were found for the R30 mm index, which showed increasing trends at all stations except station 112. The SDII showed slightly increasing trends, implying a potential increase in the intensity of extreme precipitation events in the future. In this study, significantly intensified peaks in the rainy season were observed, accompanied by a slight shift and increase in precipitation during the monsoon period. These observations indicate a possible shortening of the monsoon break period with an increase in the number of rainy days and an intensification of precipitation throughout the monsoon period. Ho et al. (2003) studied climate change in Korea over 48 years (1954–2001) and found that significant rainfall anomalies in summer exceeding 100 mm have become more common recently [57]. Although there are regional differences across periods, most of the indices associated with extreme precipitation showed faster changes over the past years, and summer precipitation intensity over South Korea has increased [27,28].
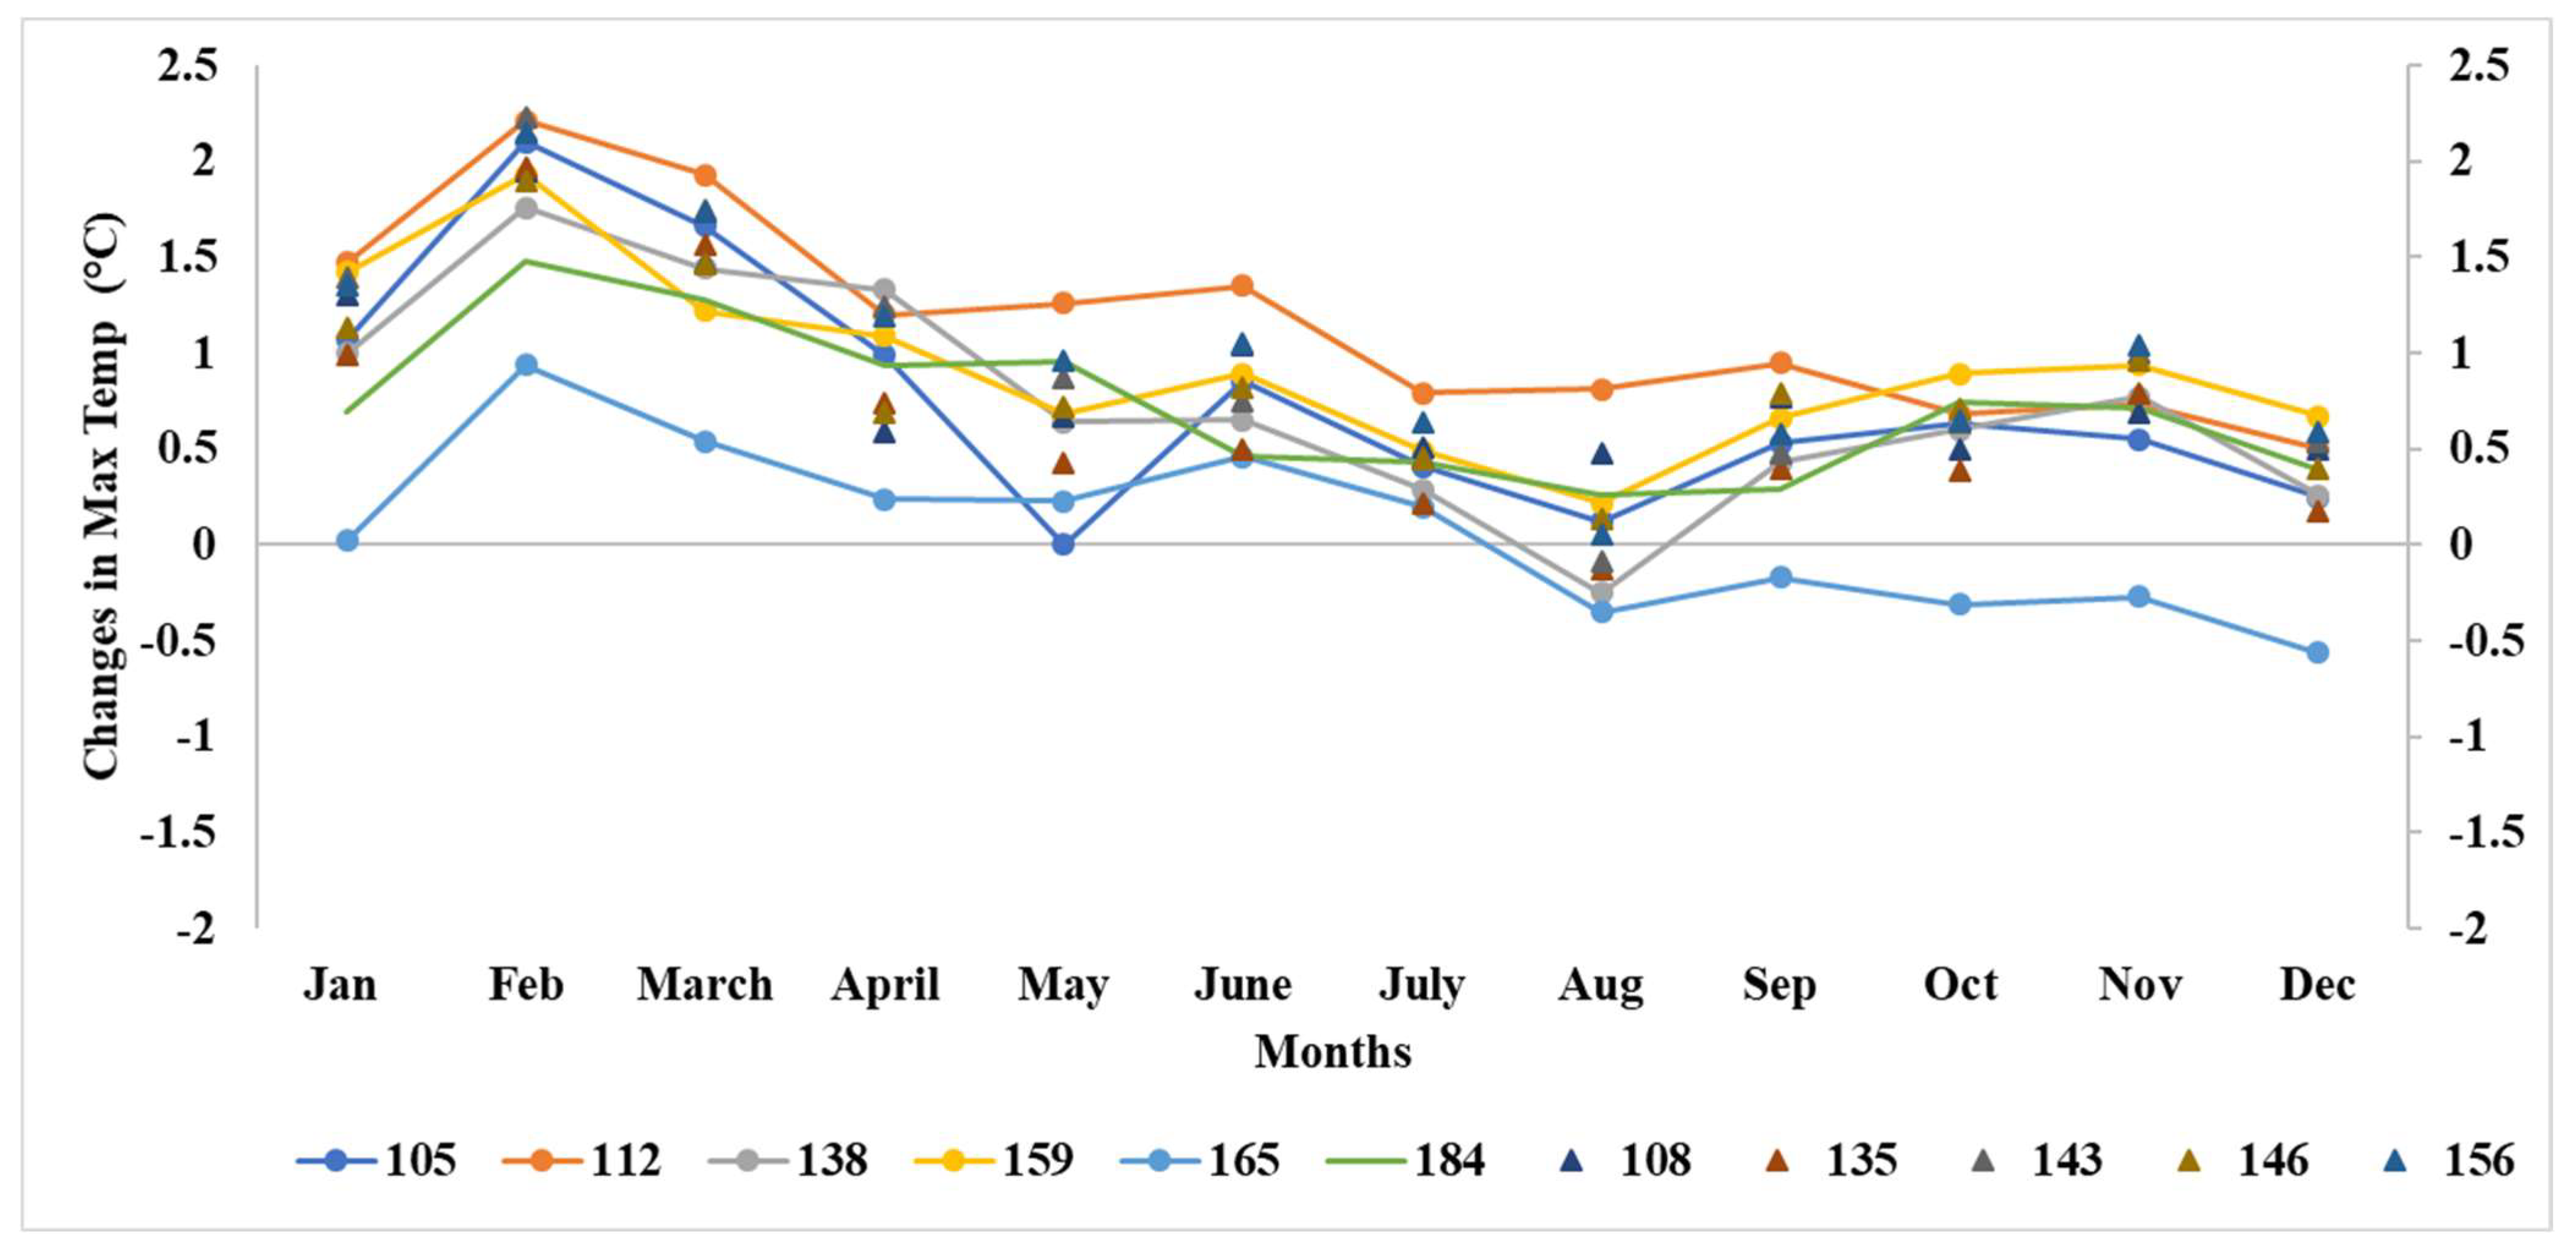
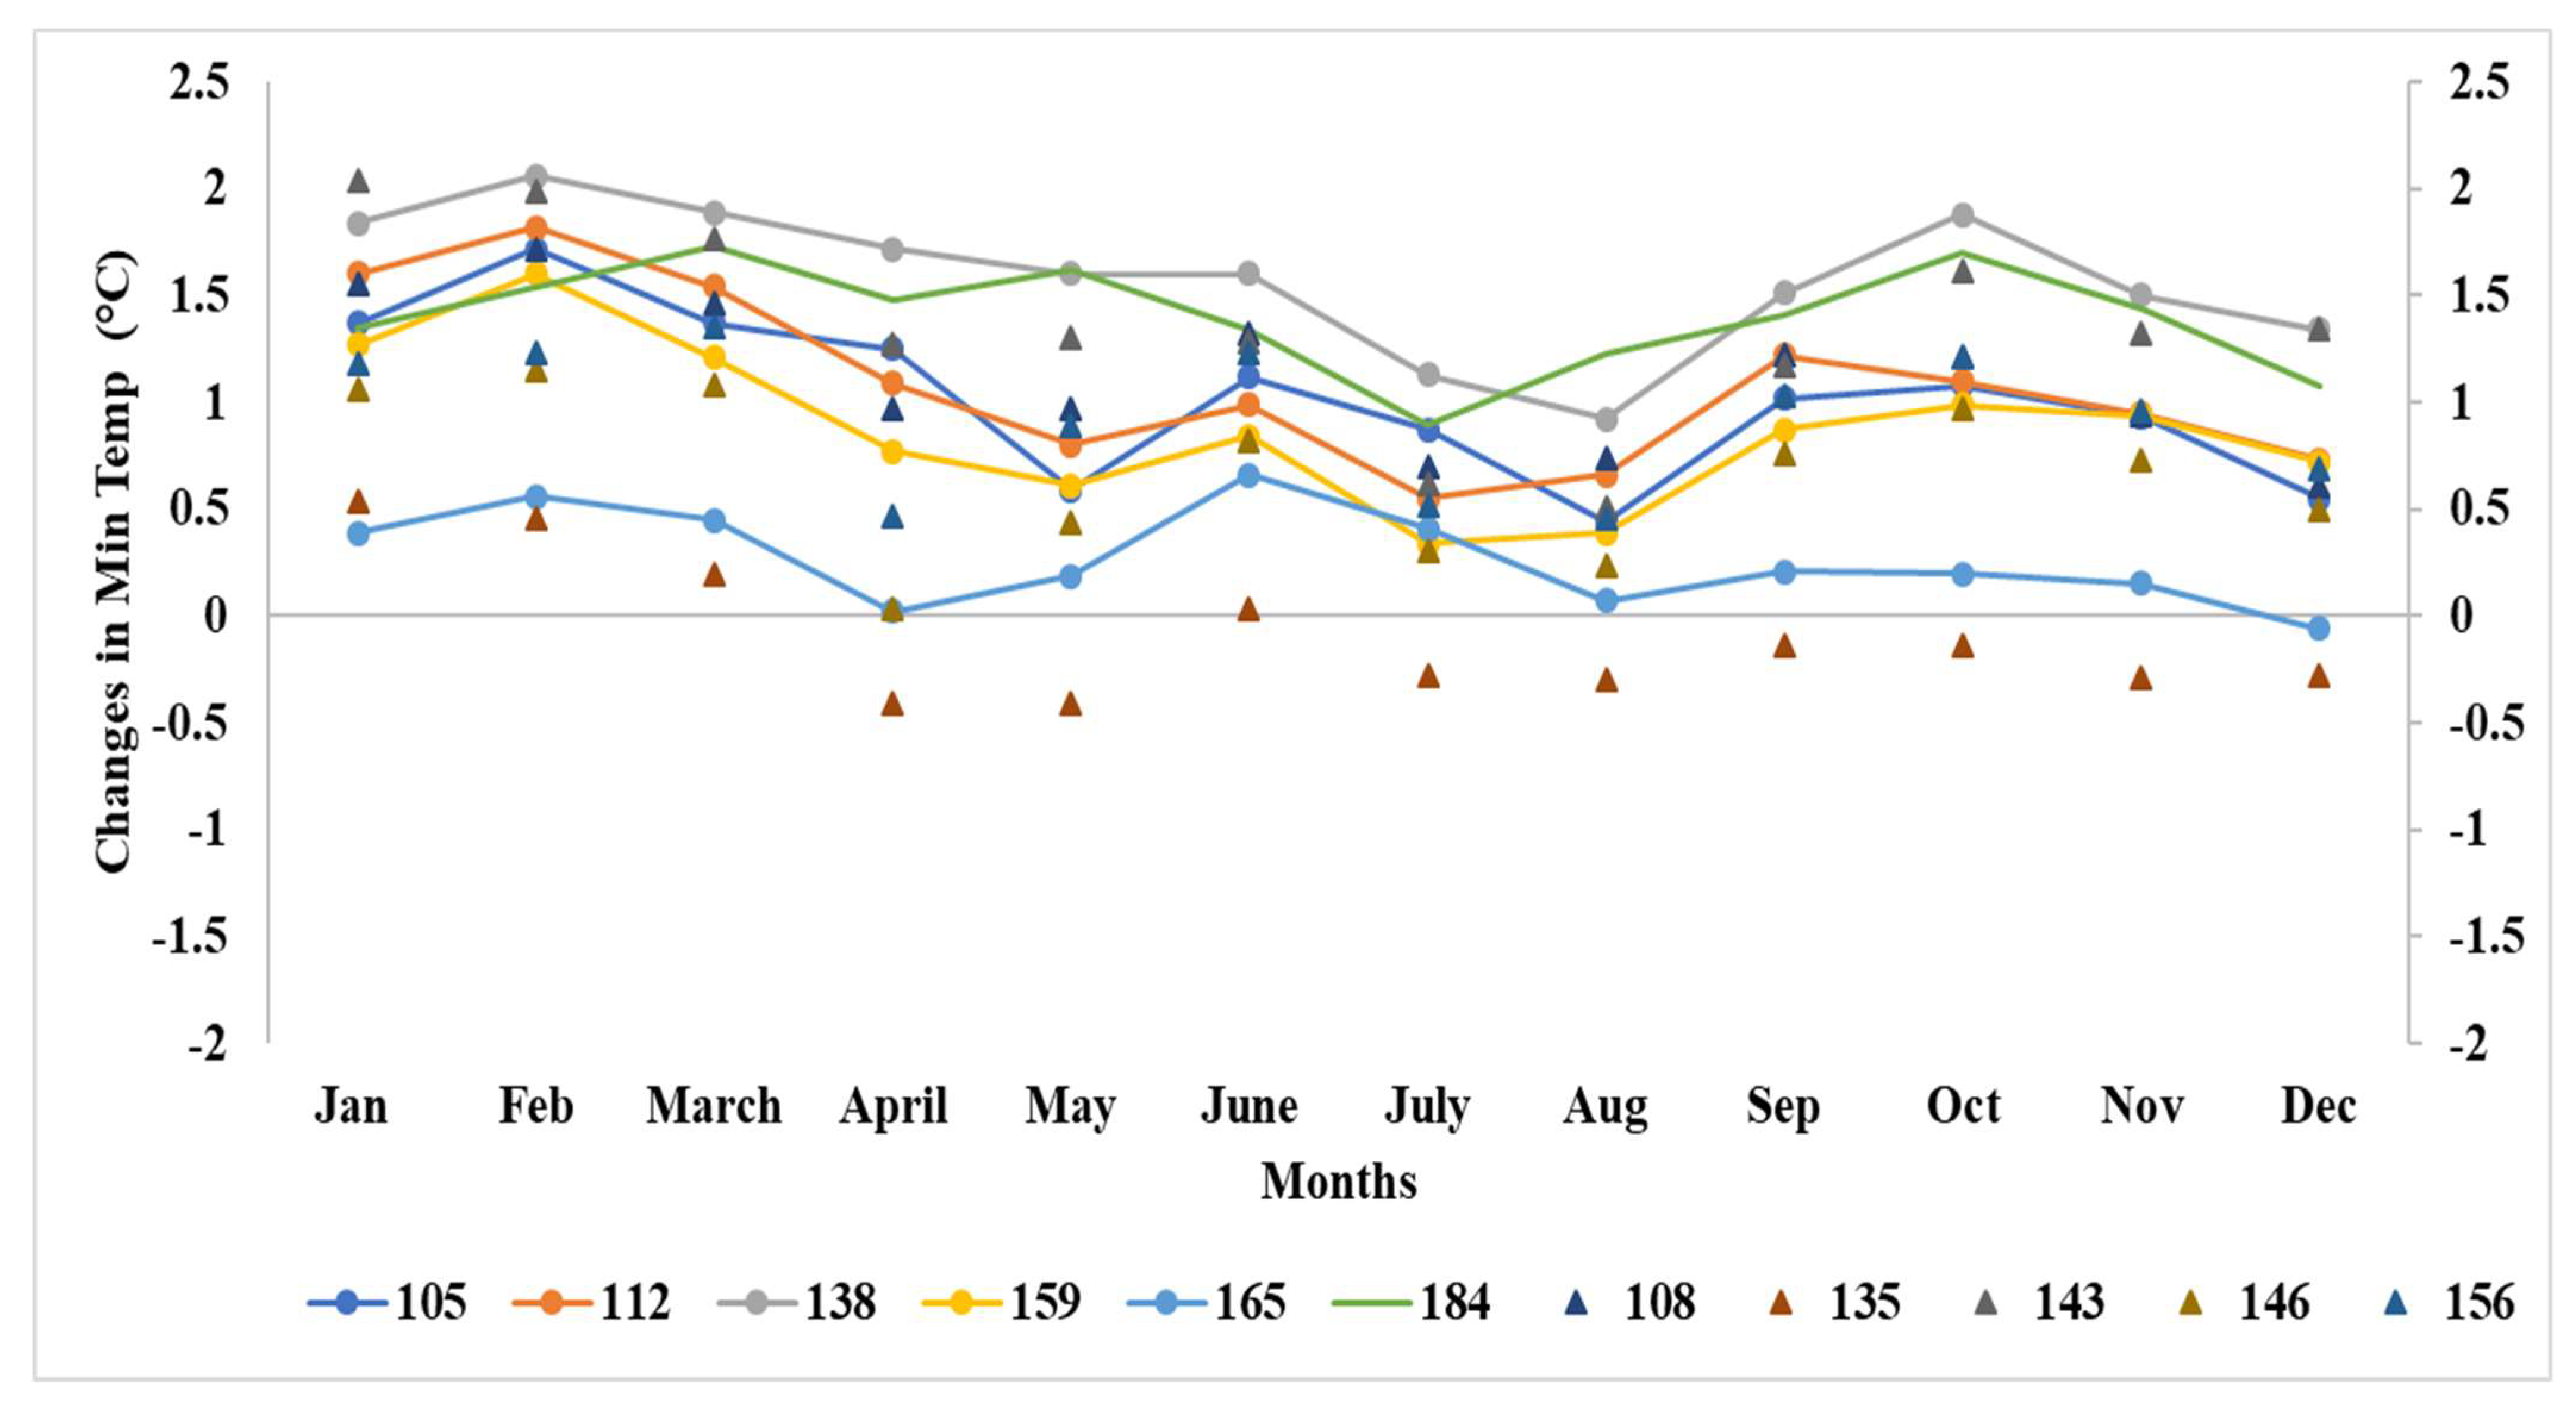
The temperature indices showed an overall increase in temperature from 1961 to 2020, with fluctuations in the number (or frequency) of warm/cold days and nights (Figure 5). The temperature increases were statistically significant at the 0.05 level at most of the stations (Table 6). The minimum temperature indices showed a stronger increasing trend compared to the maximum temperature indices (Table 6), which is consistent with the results of other studies [60,61]. The frequency, duration, and extreme values of temperature indices such as FD, ID, Tr, and SU also showed increasing trends. The values of SU and Tr were found to be increasing, while the values of ID and FD were found to be decreasing at most of the coastal and inland stations. According to Ha and Yun (2012), the increase in temperature led to an increase in the number of tropical nights in South Korea due to global warming and urbanization [62].
The coastal region had the most observed variations in temperature indices, which were evident at the stations. When compared to the inland stations, extreme occurrences, such as SU, FD, TR, ID, TX10p, and TX90p, demonstrate the large changes in the examined periods. The majority of the inland and coastal stations show an increase in air temperature. The frequency of warm days (TX90p) and nights (TN90p) increased, whereas the frequency of ID and cool days (TX10p) and nights (TN10p) declined. In most coastal and inland stations, the TX90p and TN90p showed a significant negative trend, whereas the TX10p and TN10p showed a significant positive trend. These findings are consistent with the major conclusions of the Intergovernmental Panel on Climate Change (IPCC) [8], which stated that it is quite likely that the number of cold days and nights has reduced since 1950, whereas the number of warm days and nights has increased. The Chupungryeong station (135) showed a decreasing trend in most temperature indices; this change was observed due to the high elevation of the area. The WSDI showed a positive trend, whereas the CSDI showed a negative trend; this indicates that a temperature increase was observed in coastal and inland areas. Considering temperature and rainfall extremes together, the coastal and inland areas witnessed noticeably wetter conditions, large increases in associated rainfall extremes, and a concurrent spike in warm extremes. This observation updates prior findings [16,27,63], indicating a heightened probability of catastrophes and incidences of increased rainfall and temperature extremes in coastal and inland areas. The methodologies used in this assessment are relied upon to provide valuable guidelines for detecting extreme events and contribute to the risk preparedness of coastal and inland areas. Thus, these extreme changes will make people more vulnerable to natural hazards and necessitate proper management of climate crises.

5. Conclusions

This study investigated whether the patterns of extreme weather events changed in the inland and coastal areas of South Korea between 1961 and 2020. We selected 11 weather stations that represent the unique combinations of latitude and proximity to the coastline. Statistical analyses showed that the intensity of precipitation events increased in inland areas, and both the intensity and frequency increased in coastal areas. Both coastal and inland areas experienced a notable shift in temperature extremes, while the coastal areas underwent an increase in icy days, frosty days, summer days, and tropical nights. These results suggest that the length and intensity of the dry spells may have a long-term impact on the dry season. The identified changes in the weather patterns might have affected agricultural and hydrological systems and the security of both food and water. Future studies may examine the detailed implications of the observed changes in weather patterns on agricultural productivity and water resource availability. In addition, the climate indices employed to quantify the climate or weather patterns can help evaluate what the future climate may look like and how the projected changes may affect agriculture and hydrology.

Supplementary Materials

The following supporting information can be downloaded at: https://www.mdpi.com/article/10.3390/su151612537/s1.

Author Contributions

Conceptualization, S.K.D., Y.H. and H.J.; methodology, S.K.D. and H.J.; software, S.K.D.; validation, S.K.D.; data curation, S.K.D.; writing—original draft preparation, S.K.D.; writing—review and editing, S.K.D., J.K., S.H., Y.H. and H.J.; supervision, H.J.; funding acquisition, H.J. All authors have read and agreed to the published version of the manuscript.

Funding

This research received no external funding.

Institutional Review Board Statement

Not applicable.

Informed Consent Statement

Not applicable.

Data Availability Statement

Data sharing not applicable.

Acknowledgments

This study was financially supported by Seoul National University of Science and Technology.

Conflicts of Interest

The authors declare no conflict of interest.

References

  1. Botzen, W.J.W.; Van Den Bergh, J. Managing natural disaster risks in a changing climate. Environ. Hazards 2009, 8, 209–225. [Google Scholar] [CrossRef]
  2. Nicholls, N.; Seneviratne, S.I. Comparing IPCC assessments: How do the AR4 and SREX assessments of changes in extremes differ? Clim. Chang. 2015, 133, 7–21. [Google Scholar] [CrossRef]
  3. Hao, Z.; AghaKouchak, A.; Phillips, T.J. Changes in concurrent monthly precipitation and temperature extremes. Environ. Res. Lett. 2013, 8, 034014. [Google Scholar] [CrossRef]
  4. Tong, S.; Li, X.; Zhang, J.; Bao, Y.; Bao, Y.; Na, L.; Si, A. Spatial and temporal variability in extreme temperature and precipitation events in Inner Mongolia (China) during 1960–2017. Sci. Total Environ. 2019, 649, 75–89. [Google Scholar] [CrossRef] [PubMed]
  5. Bell, J.E.; Brown, C.L.; Conlon, K.; Herring, S.; Kunkel, K.E.; Lawrimore, J.; Luber, G.; Schreck, C.; Smith, A.; Uejio, C. Changes in extreme events and the potential impacts on human health. J. Air Waste Manag. Assoc. 2018, 68, 265–287. [Google Scholar] [CrossRef]
  6. Arnell, N.W.; Lowe, J.A.; Challinor, A.J.; Osborn, T.J. Global and regional impacts of climate change at different levels of global temperature increase. Clim. Chang. 2019, 155, 377–391. [Google Scholar] [CrossRef]
  7. Das, H.P.; Adamenko, T.I.; Anaman, K.A.; Gommes, R.G.; Johnson, G. Agrometeorology Related to Extreme Events; Technical Note 201; WMO, No 943; WMO: Geneva, Switzerland, 2003; ISBN 9263109435. [Google Scholar]
  8. Jayadas, A.; Ambujam, N.K. Observed trends in indices for daily rainfall extremes specific to the agriculture sector in Lower Vellar River sub-basin, India. J. Earth Syst. Sci. 2019, 128, 1–15. [Google Scholar] [CrossRef]
  9. Zhang, X.; Hegerl, G.; Zwiers, F.W.; Kenyon, J. Avoiding inhomogeneity in percentile-based indices of temperature extremes. J. Clim. 2005, 18, 1641–1651. [Google Scholar] [CrossRef]
  10. Handmer, J.; Honda, Y.; Kundzewicz, Z.W.; Arnell, N.; Benito, G.; Hatfield, J.; Mohamed, I.F.; Peduzzi, P.; Wu, S.; Sherstyukov, B.; et al. Changes in impacts of climate extremes: Human systems and ecosystems. In Managing the Risks of Extreme Events and Disasters to Advance Climate Change Adaptation: Special Report of the Intergovernmental Panel on Climate Change; Cambridge University Press: Cambridge UK; New York, NY, USA, 2012; pp. 231–290. [Google Scholar]
  11. Kundzewicz, Z.W. Extreme weather events and their consequences. Pap. Glob. Chang. IGBP 2016, 23, 59–69. [Google Scholar] [CrossRef]
  12. Malhi, G.S.; Kaur, M.; Kaushik, P. Impact of Climate Change on Agriculture and Its Mitigation Strategies: A Review. Sustainability 2021, 13, 1318. [Google Scholar] [CrossRef]
  13. Hou, H.; Yin, X.; You, D.; Chen, Q.; Tong, G.; Zheng, Y. Apocalypse of overseas experiences on emergency anti-disaster mechanism for China power system. Autom. Electr. Power Syst. 2008, 32, 89–93. [Google Scholar]
  14. Kim, C.J.; Park, M.J.; Lee, J.H. Analysis of climate change impacts on the spatial and frequency patterns of drought using a potential drought hazard mapping approach. Int. J. Climatol. 2014, 34, 61–80. [Google Scholar] [CrossRef]
  15. Min, S.K.; Son, S.W.; Seo, K.H.; Kug, J.S.; An, S.I.; Choi, Y.S.; Jeong, J.H.; Kim, B.M.; Kim, J.W.; Kim, Y.H. Changes in weather and climate extremes over Korea and possible causes: A review. Asia Pac. J. Atmos. Sci. 2015, 51, 103–121. [Google Scholar] [CrossRef]
  16. Kim, G.; Cha, D.H.; Park, C.; Lee, G.; Jin, C.S.; Lee, D.K.; Suh, M.S.; Ahn, J.B.; Min, S.K.; Hong, S.Y. Future changes in extreme precipitation indices over Korea. Int. J. Climatol. 2018, 38, e862–e874. [Google Scholar] [CrossRef]
  17. Duan, W.; He, B.; Takara, K.; Luo, P.; Hu, M.; Alias, N.E.; Nover, D. Changes of precipitation amounts and extremes over Japan between 1901 and 2012 and their connection to climate indices. Clim. Dyn. 2015, 45, 2273–2292. [Google Scholar] [CrossRef]
  18. Limsakul, A.; Singhruck, P. Long-term trends and variability of total and extreme precipitation in Thailand. Atmos. Res. 2016, 169, 301–317. [Google Scholar] [CrossRef]
  19. Dash, S.K.; Saraswat, V.; Panda, S.K.; Pattnayak, K.C. Temperature extremes and their future projections in selected Indian cities along with their meteorological subdivisions and temperature homogeneous zones. Urban Clim. 2022, 41, 101057. [Google Scholar] [CrossRef]
  20. Pradhan, R.K.; Sharma, D.; Panda, S.K.; Dubey, S.K.; Sharma, A. Changes of precipitation regime and its indices over Rajasthan state of India: Impact of climate change scenarios experiments. Clim. Dyn. 2019, 52, 3405–3420. [Google Scholar] [CrossRef]
  21. Soltani, M.; Laux, P.; Kunstmann, H.; Stan, K.; Sohrabi, M.M.; Molanejad, M.; Sabziparvar, A.A.; SaadatAbadi, A.R.; Ranjbar, F.; Rousta, I. Assessment of climate variations in temperature and precipitation extreme events over Iran. Theor. Appl. Climatol. 2016, 126, 775–795. [Google Scholar] [CrossRef]
  22. Fathian, F.; Ghadami, M.; Haghighi, P.; Amini, M.; Naderi, S.; Ghaedi, Z. Assessment of changes in climate extremes of temperature and precipitation over Iran. Theor. Appl. Climatol. 2020, 141, 1119–1133. [Google Scholar] [CrossRef]
  23. Fan, J.; Sun, W.; Zhao, Y.; Xue, B.; Zuo, D.; Xu, Z. Trend Analyses of Extreme Precipitation Events in the Yarlung Zangbo River Basin, China Using a High-Resolution Precipitation Product. Sustainability 2018, 10, 1396. [Google Scholar] [CrossRef]
  24. Zhou, B.; Xu, Y.; Wu, J.; Dong, S.; Shi, Y. Changes in temperature and precipitation extreme indices over China: Analysis of a high-resolution grid dataset. Int. J. Climatol. 2016, 36, 1051–1066. [Google Scholar] [CrossRef]
  25. Bohlinger, P.; Sorteberg, A.; Liu, C.; Rasmussen, R.; Sodemann, H.; Ogawa, F. Multiscale characteristics of an extreme precipitation event over Nepal. Q. J. R. Meteorol. 2019, 145, 179–196. [Google Scholar] [CrossRef]
  26. Talchabhadel, R.; Karki, R.; Thapa, B.R.; Maharjan, M.; Parajuli, B. Spatio-temporal variability of extreme precipitation in Nepal. Int. J. Climatol. 2018, 38, 4296–4313. [Google Scholar] [CrossRef]
  27. Baek, H.J.; Kim, M.K.; Kwon, W.T. Observed short-and long-term changes in summer precipitation over South Korea and their links to large-scale circulation anomalies. Int. J. Climatol. 2017, 37, 972–986. [Google Scholar] [CrossRef]
  28. Choi, J.W.; Cha, Y.; Kim, J.Y. Interdecadal variation of Korea affecting TC activity in early 1980s. Geosci. Lett. 2017, 4, 1–7. [Google Scholar] [CrossRef]
  29. Halpert, M.S.; Ropelewski, C.F. Surface temperature patterns associated with the Southern Oscillation. J. Clim. 1992, 5, 577–593. [Google Scholar] [CrossRef]
  30. Min, W.K.; Yang, J.S. A study on correlation between El-Nino and winter temperature and precipitation in Korea. J. Korean Assoc. Reg. Geogr. 1998, 4, 151–164. [Google Scholar]
  31. Lee, J.H.; Julien, P.Y. ENSO impacts on temperature over South Korea. Int. J. Climatol. 2016, 36, 3651–3663. [Google Scholar] [CrossRef]
  32. Park, J.; Sung, J.H.; Lim, Y.J.; Kang, H.S. Introduction and application of non-stationary standardized precipitation index considering probability distribution function and return period. Theor. Appl. Climatol. 2019, 136, 529–542. [Google Scholar] [CrossRef]
  33. Sohn, S.J.; Tam, C.Y.; Ahn, J.B. Development of a multimodel-based seasonal prediction system for extreme droughts and floods: A case study for South Korea. Int. J. Climatol. 2013, 33, 793–805. [Google Scholar] [CrossRef]
  34. Lee, J.H.; Kim, C.J. A multimodel assessment of the climate change effect on the drought severity-duration-frequency relationship. Hydrol. Process. 2013, 27, 2800–2813. [Google Scholar] [CrossRef]
  35. Mishra, V.; Shah, R.; Thrasher, B. Soil moisture droughts under the retrospective and projected climate in India. J. Hydrometeorol. 2014, 15, 2267–2292. [Google Scholar] [CrossRef]
  36. Nam, W.H.; Hayes, M.J.; Svoboda, M.D.; Tadesse, T.; Wilhite, D.A. Drought hazard assessment in the context of climate change for South Korea. Agric. Water Manag. 2015, 160, 106–117. [Google Scholar] [CrossRef]
  37. Kwon, M.; Kwon, H.; Han, D. Spatio-temporal drought patterns of multiple drought indices based on precipitation and soil moisture: A case study in South Korea. Int. J. Climatol. 2019, 39, 4669–4687. [Google Scholar] [CrossRef]
  38. Yue, J.; Xiao, J.; Wang, X.; Meckler, A.N.; Modestou, S.E.; Fan, J. “Cold and wet” and “warm and dry” climate transitions at the East Asian summer monsoon boundary during the last deglaciation. Quat. Sci. Rev. 2022, 295, 107767. [Google Scholar] [CrossRef]
  39. Choe, B.N. The National Atlas of Korea; National Geographic Information Institute: Suwon, Republic of Korea, 2019. [Google Scholar]
  40. Wang, Y.; Liu, X.; Herzschuh, U. Asynchronous evolution of the Indian and East Asian Summer Monsoon indicated by Holocene moisture patterns in monsoonal central Asia. Earth-Sci. Rev. 2010, 103, 135–153. [Google Scholar] [CrossRef]
  41. Bae, D.H.; Jung, I.W.; Chang, H. Potential changes in Korean water resources estimated by high-resolution climate simulation. Clim. Res. 2008, 35, 213–226. [Google Scholar] [CrossRef]
  42. Korea Meteorological Administration (KMA). Understanding of Climate Change and Application of Climate Change Scenarios; National Institute of Meteorological Research: Seoul, Republic of Korea, 2010. [Google Scholar]
  43. Jung, I.W.; Bae, D.H.; Kim, G. Recent trends of mean and extreme precipitation in Korea. Int. J. Climatol. 2011, 31, 359–370. [Google Scholar] [CrossRef]
  44. Statistic Korean. Available online: https://kostat.go.kr/anse/ (accessed on 3 August 2023).
  45. Alexander, L.; Herold, N. ClimPACT2 Indices and Software; The University of South Wales: Sydney, Australia, 2016; Available online: https://github.com/ARCCSS-extremes/climpact2 (accessed on 3 August 2023).
  46. Wang, X.L. Comments on “Detection of undocumented changepoints: A revision of the two-phase regression model”. J. Clim. 2003, 16, 3383–3385. [Google Scholar] [CrossRef]
  47. Folland, C.K.; Miller, C.; Bader, D.; Crowe, M.; Jones, P.; Plummer, N.; Richman, M.; Parker, D.E.; Rogers, J.; Scholefield, P. Workshop on Indices and Indicators for Climate Extremes, Asheville, NC, USA, 3–6 June 1997 Breakout Group C: Temperature Indices for Climate Extremes. Clim. Chang. 1999, 42, 31–43. [Google Scholar] [CrossRef]
  48. Jones, P.D.; Horton, E.B.; Folland, C.K.; Hulme, M.; Parker, D.E.; Basnett, T.A. The Use of Indices to Identify Changes in Climatic Extremes. Clim. Chang. 1999, 42, 131–149. [Google Scholar] [CrossRef]
  49. Wi, S.; Valdés, J.B.; Steinschneider, S.; Kim, T.W. Non-stationary frequency analysis of extreme precipitation in South Korea using peaks-over-threshold and annual maxima. Stoch. Environ. Res. Risk Assess. 2016, 30, 583–606. [Google Scholar] [CrossRef]
  50. Park, I.H.; Min, S.K. Role of convective precipitation in the relationship between subdaily extreme precipitation and temperature. J. Clim. 2017, 30, 9527–9537. [Google Scholar] [CrossRef]
  51. Heo, S.; Bell, M.L. Heat waves in South Korea: Differences of heat wave characteristics by thermal indices. J. Expo. Sci. Environ. Epidemiol. 2019, 29, 790–805. [Google Scholar] [CrossRef] [PubMed]
  52. Wang, H.; He, S. Weakening relationship between East Asian winter monsoon and ENSO after mid-1970s. Chin. Sci. Bull. 2012, 57, 3535–3540. [Google Scholar] [CrossRef]
  53. Seo, Y.A.; Lee, Y.; Park, J.S.; Kim, M.K.; Cho, C.; Baek, H.J. Assessing changes in observed and future projected precipitation extremes in South Korea. Int. J. Climatol. 2015, 35, 1069–1078. [Google Scholar] [CrossRef]
  54. Jin, Q.; Yang, X.Q.; Sun, X.G.; Fang, J.B. East Asian summer monsoon circulation structure controlled by feedback of condensational heating. Clim. Dyn. 2013, 41, 1885–1897. [Google Scholar] [CrossRef]
  55. Lau, K.M.; Li, M.T. The monsoon of East Asia and its global associations—A survey. Bull. Am. Meteorol. Soc. 1984, 65, 114–125. [Google Scholar] [CrossRef]
  56. Park, S.U.; Ahn, H.J.; Chun, Y.S. Evolutionary features of the large-scale circulation over East Asia during the Changma period of 1985. Asia Pac. J. Atmos. Sci. 1988, 24, 22–43. [Google Scholar]
  57. Ho, C.H.; Lee, J.Y.; Ahn, M.H.; Lee, H.S. A sudden change in summer rainfall characteristics in Korea during the late 1970s. Int. J. Climatol. 2003, 23, 117–128. [Google Scholar] [CrossRef]
  58. Ha, K.J.; Park, S.K.; Kim, K.Y. On interannual characteristics of climate prediction center merged analysis precipitation over the Korean peninsula during the summer monsoon season. Int. J. Climatol. 2005, 25, 99–116. [Google Scholar] [CrossRef]
  59. Lee, S.; Kwon, W.T. A variation of summer rainfall in Korea. J. Korean Geogr. Soc. 2004, 39, 819–832. [Google Scholar]
  60. Da Silva, P.E.; Silva, C.M.S.; Spyrides, M.H.C.; Andrade, L.D.M.B. Precipitation and air temperature extremes in the Amazon and northeast Brazil. Int. J. Climatol. 2019, 39, 579–595. [Google Scholar] [CrossRef]
  61. Mateus, C.; Potito, A. Long-term trends in daily extreme air temperature indices in Ireland from 1885 to 2018. Weather Clim. Extrem. 2022, 36, 100464. [Google Scholar] [CrossRef]
  62. Ha, K.J.; Yun, K.S. Climate change effects on tropical night days in Seoul, Korea. Theor. Appl. Climatol. 2012, 109, 191–203. [Google Scholar] [CrossRef]
  63. Min, S.K.; Kwon, W.T.; Park, E.H.; Choi, Y. Spatial and temporal comparisons of droughts over Korea with East Asia. Int. J. Climatol. 2003, 23, 223–233. [Google Scholar] [CrossRef]
Figure 1. Locations of the coastal and inland stations. The red and black star symbols represent the coastal and inland stations, respectively.
Sustainability 15 12537 g001
Figure 2. Monthly average precipitation (mm) changes between two periods, 1961–1990 and 1991–2020, in the coastal (bars) and inland (triangles) stations.
Sustainability 15 12537 g002
Figure 3. Variations in regionally averaged (red for the coastal station and blue for the inland stations) precipitation extreme indices over the period from 1961 to 2020. The boxes indicate the interquartile model spread (25th and 75th quantiles), with the horizontal line indicating the ensemble median and the whiskers representing 1.5 times the interquartile range of the upper and lower quartiles. The violin-like shapes (violin plots) represent the density of each index.
Sustainability 15 12537 g003
Figure 4. Monthly average maximum temperature changes between two periods, 1961–1990 and 1991–2020, in the coastal (lines) and inland (dots) stations.
Sustainability 15 12537 g004
Figure 5. Monthly average minimum temperature changes between two periods, 1961–1990 and 1991–2020, in the coastal (lines) and inland (dots) stations.
Sustainability 15 12537 g005
Figure 6. Variations in regionally averaged (red for the coastal station and blue for the inland stations) temperature extremes indices over the time period 1961–2020. Boxes indicate the interquartile model spread (25th and 75th quantiles), with the horizontal line indicating the ensemble median and the whiskers representing 1.5 times the interquartile range of the upper and lower quartiles. The violin-like shapes (violin plots) represent the density of each index.
Sustainability 15 12537 g006
Table 1. Location of weather stations analyzed in this study and their basic climatic statistics on an annual average basis.
Station IDStation NameLatitude (°N)Longitude (°E)LocationPCP (mm)T Max (°C)T Min (°C)
105Gangneung37.75128.89Coast1410.317.59.1
112Incheon37.48126.62Coast1188.716.18.6
138Pohang36.03129.38Coast1141.218.610.1
159Busan35.10129.03Coast1524.318.711.3
165Mokpo34.82126.38Coast1139.618.410.4
184Jeju33.51126.53Coast1462.919.012.7
108Seoul37.57126.97Inland1393.917.08.4
135Chupungryeong36.22127.99Inland1172.217.26.8
143Daegu35.88128.65Inland1053.719.39.2
146Jeonju35.84127.12Inland1291.218.88.7
156Gwangju35.17126.89Inland1368.719.09.4
Note: PCP, T Max, and T Min indicate annual average precipitation, annual average maximum temperature, and annual average minimum temperature, respectively.
Table 2. Definitions of the ETCCDI extreme precipitation and temperature indices examined in this study.
Short NameLong NameDefinitionPlain Language DescriptionUnits
CDDConsecutive dry daysMaximum number of consecutive dry days (when PR < 1.0 mm)Longest dry spelldays
CWDConsecutive wet daysMaximum annual number of consecutive wet days (when PR ≥ 1.0 mm)Longest wet spelldays
R30 mmNumber of very heavy rain daysNumber of days when PR ≥ 30 mmDays when rainfall is at least 30 mmdays
PRCPTOTAnnual total wet day PRSum of daily PR ≥ 1.0 mmTotal wet-day rainfallmm
R95pTotal annual PR from heavy rain daysAnnual sum of daily PR > 95th percentileAmount of rainfall from very wet daysmm
R99pTotal annual PR from very heavy rain daysAnnual sum of daily PR > 99th percentileAmount of rainfall from extremely wet daysmm
Rx5dayMax 5 day PRMaximum 5 day PR totalMaximum amount of rainfall in five consecutive daysmm
SDIIDaily PR intensityAnnual total PR divided by the number of wet days (when total PR ≥ 1.0 mm)Average daily wet day rainfall intensitymm/day
SUSummer daysNumber of days when TX > 25 °CDays when maximum temperature exceeds 25 °Cdays
IDIcy daysNumber of days when TX < 0 °CDays when maximum temperature is below 0 °Cdays
TX10pAmount of cool daysPercentage of days when TX < 10th percentileFraction of days with cool daytime temperatures%
TX90pAmount of hot daysPercentage of days when TX > 90th percentileFraction of days with hot daytime temperatures%
WSDIWarm spell duration indicatorAnnual number of days contributing to events where 6 or more consecutive days experience TX > 90th percentileNumber of days contributing to a warm period (where the period has to be at least 6 days long)days
FDFrosty daysNumber of days when TN < 0 °CDays when minimum temperature is below 0 °Cdays
TRTropical nightsNumber of days when TN > 20 °CDays when minimum temperature exceeds 20 °Cdays
TN10pAmount of cold nightsPercentage of days when TN < 10th percentileFraction of days with cold nighttime temperatures%
TN90pAmount of warm nightsPercentage of days when TN > 90th percentileFraction of days with warm nighttime temperatures%
CSDICold spell duration indicatorAnnual number of days contributing to events where 6 or more consecutive days experience TN < 10th percentileNumber of days contributing to a cold period (where the period has to be at least 6 days long)days
DTRDaily temperature rangeMean difference between daily TX and daily TNAverage range of maximum and minimum temperature°C
Table 3. Changes in precipitation indices (1961–1990 and 1991–2020) at different coastal and inland stations in South Korea.
Station IDLocationCDDCWDPRCPTOTR30 mmR95pR99pRX5daySDII
105Coast−4.30.1368.690.1770.5780.8624.730.7
112Coast1.50.0338.51−0.33105.1630.3924.311.09
138Coast−2.330.83101.781.27145.9108.6639.631.26
159Coast0.770.53105.341.1152.6822.8121.061.69
165Coast4.03−0.2357.881.143.62−20.56−16.640.89
184Coast3.730.2379.81.4101.0472.0825.351.81
108Inland0.870.1749.510.2799.1768.5562.581.02
135Inland1.030.347.810.6382.8954.623.150.72
143Inland−0.670.3749.480.6107.5848.0512.10.47
146Inland−0.40.13−9.550.4748.8630.4113.830.21
156Inland0.370.3325.680.3740.5619.017.110.85
Table 4. Changes in temperature indices (1961–1990 and 1991–2020) at different coastal and inland stations in South Korea.
Station IDLocationSUIDTX10pTX90pWSDIFDTRTN10pTN90pCSDIDTR
105Coast4.63−4.7−4.092.861.1−15.47.93−5.735.78−1.83−0.27
112Coast16.67−10.17−6.046.675.6−12.29.33−6.558.53−2.870.07
138Coast5.77−2.83−4.293.942.4−22.0315.73−9.849.58−5.33−0.84
159Coast11.97−2.3−5.234.884.57−11.8710.63−5.07.25−0.830.04
165Coast2.3−1.4−1.21−0.630.33−3.25.1 −2.042.22−0.67−0.19
184Coast8.77−0.13−4.443.882.73−8.516.2−12.988.91−3.87−0.69
108Inland9.5−8.2−3.924.885.37−10.6312.57−6.647.57−2.73−0.24
135Inland5.9−6.97−2.673.391.373.33−3.330.33−1.140.030.75
143Inland9.03−5.17−4.493.984.0−18.69.63−8.57.82−2.6−0.41
146Inland8.83−6.33−3.954.734.63−9.075.73−4.253.61−1.40.15
156Inland10.7−5.2−3.816.183.5−12.98.27−6.935.02−2.530.06
Table 5. Station-by-station annual trends in extreme precipitation indices indicating increasing/decreasing trends with significant changes at the 5% level.
IndicesLocationCDDCWDPRCPTOTR30 mmR95pR99pRX5daySDII
105CoastNPPPPNOPP
112CoastPNPNPNOPP
138CoastNPPPPNOPP
159CoastPPPPPNOPP
165CoastPPPPPSNOPPS
184CoastPSNPPPNOPSPS
108InlandPNSPNPNOPP
135InlandPNPPPSNOPP
143InlandPPPPPSNOPP
146InlandPPNPPNOPN
156InlandPPPPPNOPP
Note: N—negative, P—positive, NS—negative significant, PS—positive significant, NO—no trend.
Table 6. Station-by-station annual trends in extreme temperature indices indicating increasing/decreasing trends with significant changes at the 5% level.
IndicesLocationSUIDTX10pTX90pWSDIFDTRTN10pTN90pCSDIDTR
105CoastPSNSNSPSNONSPSNSPSNONS
112CoastPSNSNSPSNONSPSNSPSNONS
138CoastPSNSNSPSNONSPSPSPSNONS
159CoastPSNONSPSNONSPSNSPSNOP
165CoastPNNNNONPNPSNON
184CoastPSNONSPSNONSPSNSPSNONS
108InlandPSNSNSPSNONSPSNSPSNONS
135InlandPNSNSPSNOPNPNNOPS
143InlandPSNSNSPSNONSPSNSPSNONS
146InlandPSNSNSPSNONSPNSPSNOP
156InlandPSNSNSPSNONSPSNSPSNOP
Note: N—negative, P—positive, NS—negative significant, PS—positive significant, NO—no trend.
Disclaimer/Publisher’s Note: The statements, opinions and data contained in all publications are solely those of the individual author(s) and contributor(s) and not of MDPI and/or the editor(s). MDPI and/or the editor(s) disclaim responsibility for any injury to people or property resulting from any ideas, methods, instructions or products referred to in the content.

