Article

Analysing the Socioeconomic Impacts of Fishing Closures Due to Toxic Algal Blooms: Application of the Vulnerability Framework to the Case of the Scallop Fishery in the Eastern English Channel

by
Sarra Chenouf
1,*,
José Antonio Pérez Agúndez
2 and
Pascal Raux
1
1
Univ Brest, Ifremer, CNRS, UMR 6308, AMURE, IUEM, F-29280 Plouzané, France
2
Ifremer, Univ Brest, CNRS, UMR 6308, AMURE, Unité d’Economie Maritime, IUEM, F-29280 Plouzané, France
*
Author to whom correspondence should be addressed.
Sustainability 2023, 15(16), 12379; https://doi.org/10.3390/su151612379
Submission received: 25 June 2023 / Revised: 3 August 2023 / Accepted: 9 August 2023 / Published: 15 August 2023
(This article belongs to the Special Issue Sustainable Blue Economy and Marine Management)

Abstract

:
Harmful and toxic algal blooms (HABs) are an increasing concern for marine social-ecological systems. These unpredictable events threaten human health and may affect the viability of economic activities such as shellfish fisheries due to harvesting bans. Monitoring and early warning systems are developed to support management decisions to mitigate and reduce impacts. Nevertheless, HAB alert systems currently only focus on the environmental dimensions to identify the risk of bloom occurrences. Other socioeconomic dimensions associated with HABs are generally not taken into account to support decision making. Integrating information on the economic risk of HABs and on adaptive strategies of impacted communities would provide essential insights for decision makers. This study presents an analysis of how the potential impacts of HAB-related restrictions on economic activities can be effectively assessed to support decision making. A vulnerability-based approach is developed and applied to the case study of the French scallop fishery in the eastern English Channel. The results showed clear differences in vulnerability patterns between the studied fishing fleets despite their similar exposure. This is associated with the heterogeneity in individual characteristics in terms of sensitivity level and adaptive strategies. This research highlights the important effect of social factors such as adaptation in the magnitude of HAB impacts and supports the relevance of the vulnerability approach in the assessment of socioeconomic impacts of such events. Combining environmental and socioeconomic factors through a composite index can bridge the existing gaps in addressing and mitigating HAB impacts.

1. Introduction

1.1. Background and Aim of the Study

In the context of global issues, many fisheries in the world are facing several ecological, economic and social issues that threaten their sustainability and challenge the governance and the management system [1,2]. The degradation of marine environment is one of the most important issues that affect the ecosystems’ properties and condition the functioning of the fishing activities and their management. In particular, harmful algal blooms (HABs) are one of the pressures that may affect marine ecosystems and produce negative impacts on human health and wellbeing [3]. These natural and unpredictable phenomena represent a growing concern for fishing communities all around the world [4,5,6,7,8]. When they occur, toxic blooms can contaminate marine organisms such as shellfish and lead the management authorities to implement commercial bans in order to avoid the consumption of contaminated seafood and protect human health. This mitigation strategy is still the most adopted in many countries around the world in order to manage HAB risks and impacts [9,10,11,12]. Based on routine monitoring programmes, this management strategy consists of adapting to the occurrences of blooms and implementing a set of measures and restrictions based on risk analysis [9,13,14,15]. These management measures can generate economic impacts on fisheries-dependent activities and threaten their sustainability [8,16,17]. In addition to economic impacts, these access bans to HAB-affected areas can also have non-economic impacts including ecosystem services that have social or cultural value, and affect the recreation activities and the wellbeing of coastal communities [7,8,18].
Whether based on mitigation or on other strategies, HAB risk-management systems aim to reduce both sanitary and socioeconomic impacts [15]. However, the particularities of HAB phenomena (i.e., their hazardous and random nature as well as their spatial evolution) and the affected activities make it challenging to achieve this objective. Early warning systems based on remote sensing are among the multiple and emerging monitoring methods developed to provide information on HAB occurrences and toxins in order to assist the management decisions [19]. Despite their high spatial resolution and the relevant information that they can provide, these systems only focus on environmental dimensions, i.e., they only express the risk of HAB occurrences and not toxicity and its associated socioeconomic consequences, which makes them not effective enough to support decision making. An alert system that considers both HAB occurrences/toxicities and socioeconomic risks is essential to improve the efficiency of management actions. To integrate social and economic dimensions of HAB into such systems, a thorough understanding of the associated impacts and responses of stakeholders is necessary.
Many studies have been carried out on HAB impacts. The aim of these research efforts is to support decision making and policies in order to mitigate and reduce HAB consequences [20,21]. However, the majority of these studies mainly focuses on aggregate monetary assessments of economic losses associated with HAB occurrences [3,22,23]. There are still very few studies focusing on the integration of social issues in impact assessments in the literature despite their recent increases. In addition, there is no specific impact assessment concerning the French fisheries. A few works have been conducted on HAB costs but they only concerned limited areas or have been aggregated to other areas such as the research conducted by Hoagland and Scatasta (2006) [23] on HAB-related costs in the EU zones.
Social factors, in particular the characteristics and behaviours of communities, have an important role in the way in which individuals may be affected. These social factors may explain the variability of HAB impacts and the complexity of their assessments. It is recognised in the literature that adaptive strategies allowing impact mitigation, despite their potential costs, contribute (in the short or long term) to minimising the economic losses of HABs, which induce overestimations or biases in HAB cost assessments in some cases [3,22,24]. In the case of fisheries, during HAB events and harvest closures, moving to other fishing areas or changing the target species could be an alternative strategy to reduce the economic loses. But, these strategies depend on the individual capacity to adapt, taking into account economic, institutional and social constraints. Moreover, according to many studies, harvesting bans can have a positive effect on fisheries. As some phycotoxins do not directly affect shellfish and their commercialisation may be authorised after decontamination [25], the closed areas may become fishery reserves allowing fishermen to compensate their short-term losses after the fishing areas are reopened [3,26].
Taking into account all these risk avoiding strategies and their individual variability, the impact level is significantly different from assessments only based on monetary evaluations of short-term losses. Recent studies on HAB impacts highlight therefore the relevance of considering individual and collective responses and behaviours of the HAB-affected communities in impact assessments [8,14,27]. This can allow for a better understanding of the impacts and provide valuable insights into decision making and HAB mitigation. In the same way as all disturbances and consequences related to natural disasters, the degree of HAB impact depends on many factors, which are mostly related to the adequacy of the implemented management system and the socioeconomic characteristics of the impacted populations, and not only to the severity of HAB events [8]. These factors include the frequency of HAB toxic events and restrictions duration, the communities’ dependency on the resource exposed to contaminations, and their ability to avoid or reduce the associated impacts. This defines the concepts of the communities’ exposure to unfavourable conditions (HAB), their sensitivity to experiencing this risk, and finally, their capacity to adapt in order to minimise the resulting consequences. Many studies highlighted that in the case of HAB effects on human health, the level of impacts is positively correlated with the severity of HAB events [28,29]. However, in the case of coastal-dependent activities such as fisheries, the extent of harm due to HABs is not necessarily proportional to the severity of these events, because communities’ sensitivity and responses vary according to their individual characteristics, which leads to differences in vulnerability patterns [27]. Hence, even though their exposure to the HAB risk is similar, some communities may be highly impacted compared to others. This link between HAB severity and socioeconomic properties and responses to management strategies is rarely addressed in the literature about HAB impact assessments. It can then result in a different distribution of impacts according to fleet segments.
Vulnerability to natural disasters varies frequently over time [30]. This is due to the spatial and temporal variability of both the exposure of communities to risks and their associated responses. Existing research carried out on socioeconomic dimensions of HAB consequences only focus on some specific events, generally the most affecting occurrences. This reflects thus a state at a specific moment and provides limited information on adaptive strategies that does not allow the integration of dynamic processes, which are important to decision making. The temporal and spatial trends and the evolution of HAB impacts are not yet investigated in the literature. The development of an assessment framework based on the vulnerability approach and the analysis of the evolution of communities’ responses can meet these needs.
This paper addresses the socioeconomic impacts of toxic algal blooms on fishing activity in the English Channel using a vulnerability analysis framework. This approach, usually used to assess impacts of natural disasters resulting from climate change, is applied to the case of socioeconomic impacts of HABs on fishing-dependent communities. The aim of this paper is to assess the impact breadth of HAB-related closures on the French fishing activity. Using the vulnerability framework, this study focuses on the case of the scallop fishery and has two main objectives. The first one is to identify which fishing communities are more likely to be vulnerable to these closures. The second objective is to analyse the spatial and temporal evolution of fishers’ vulnerability and understand which factors are contributing to these trends.

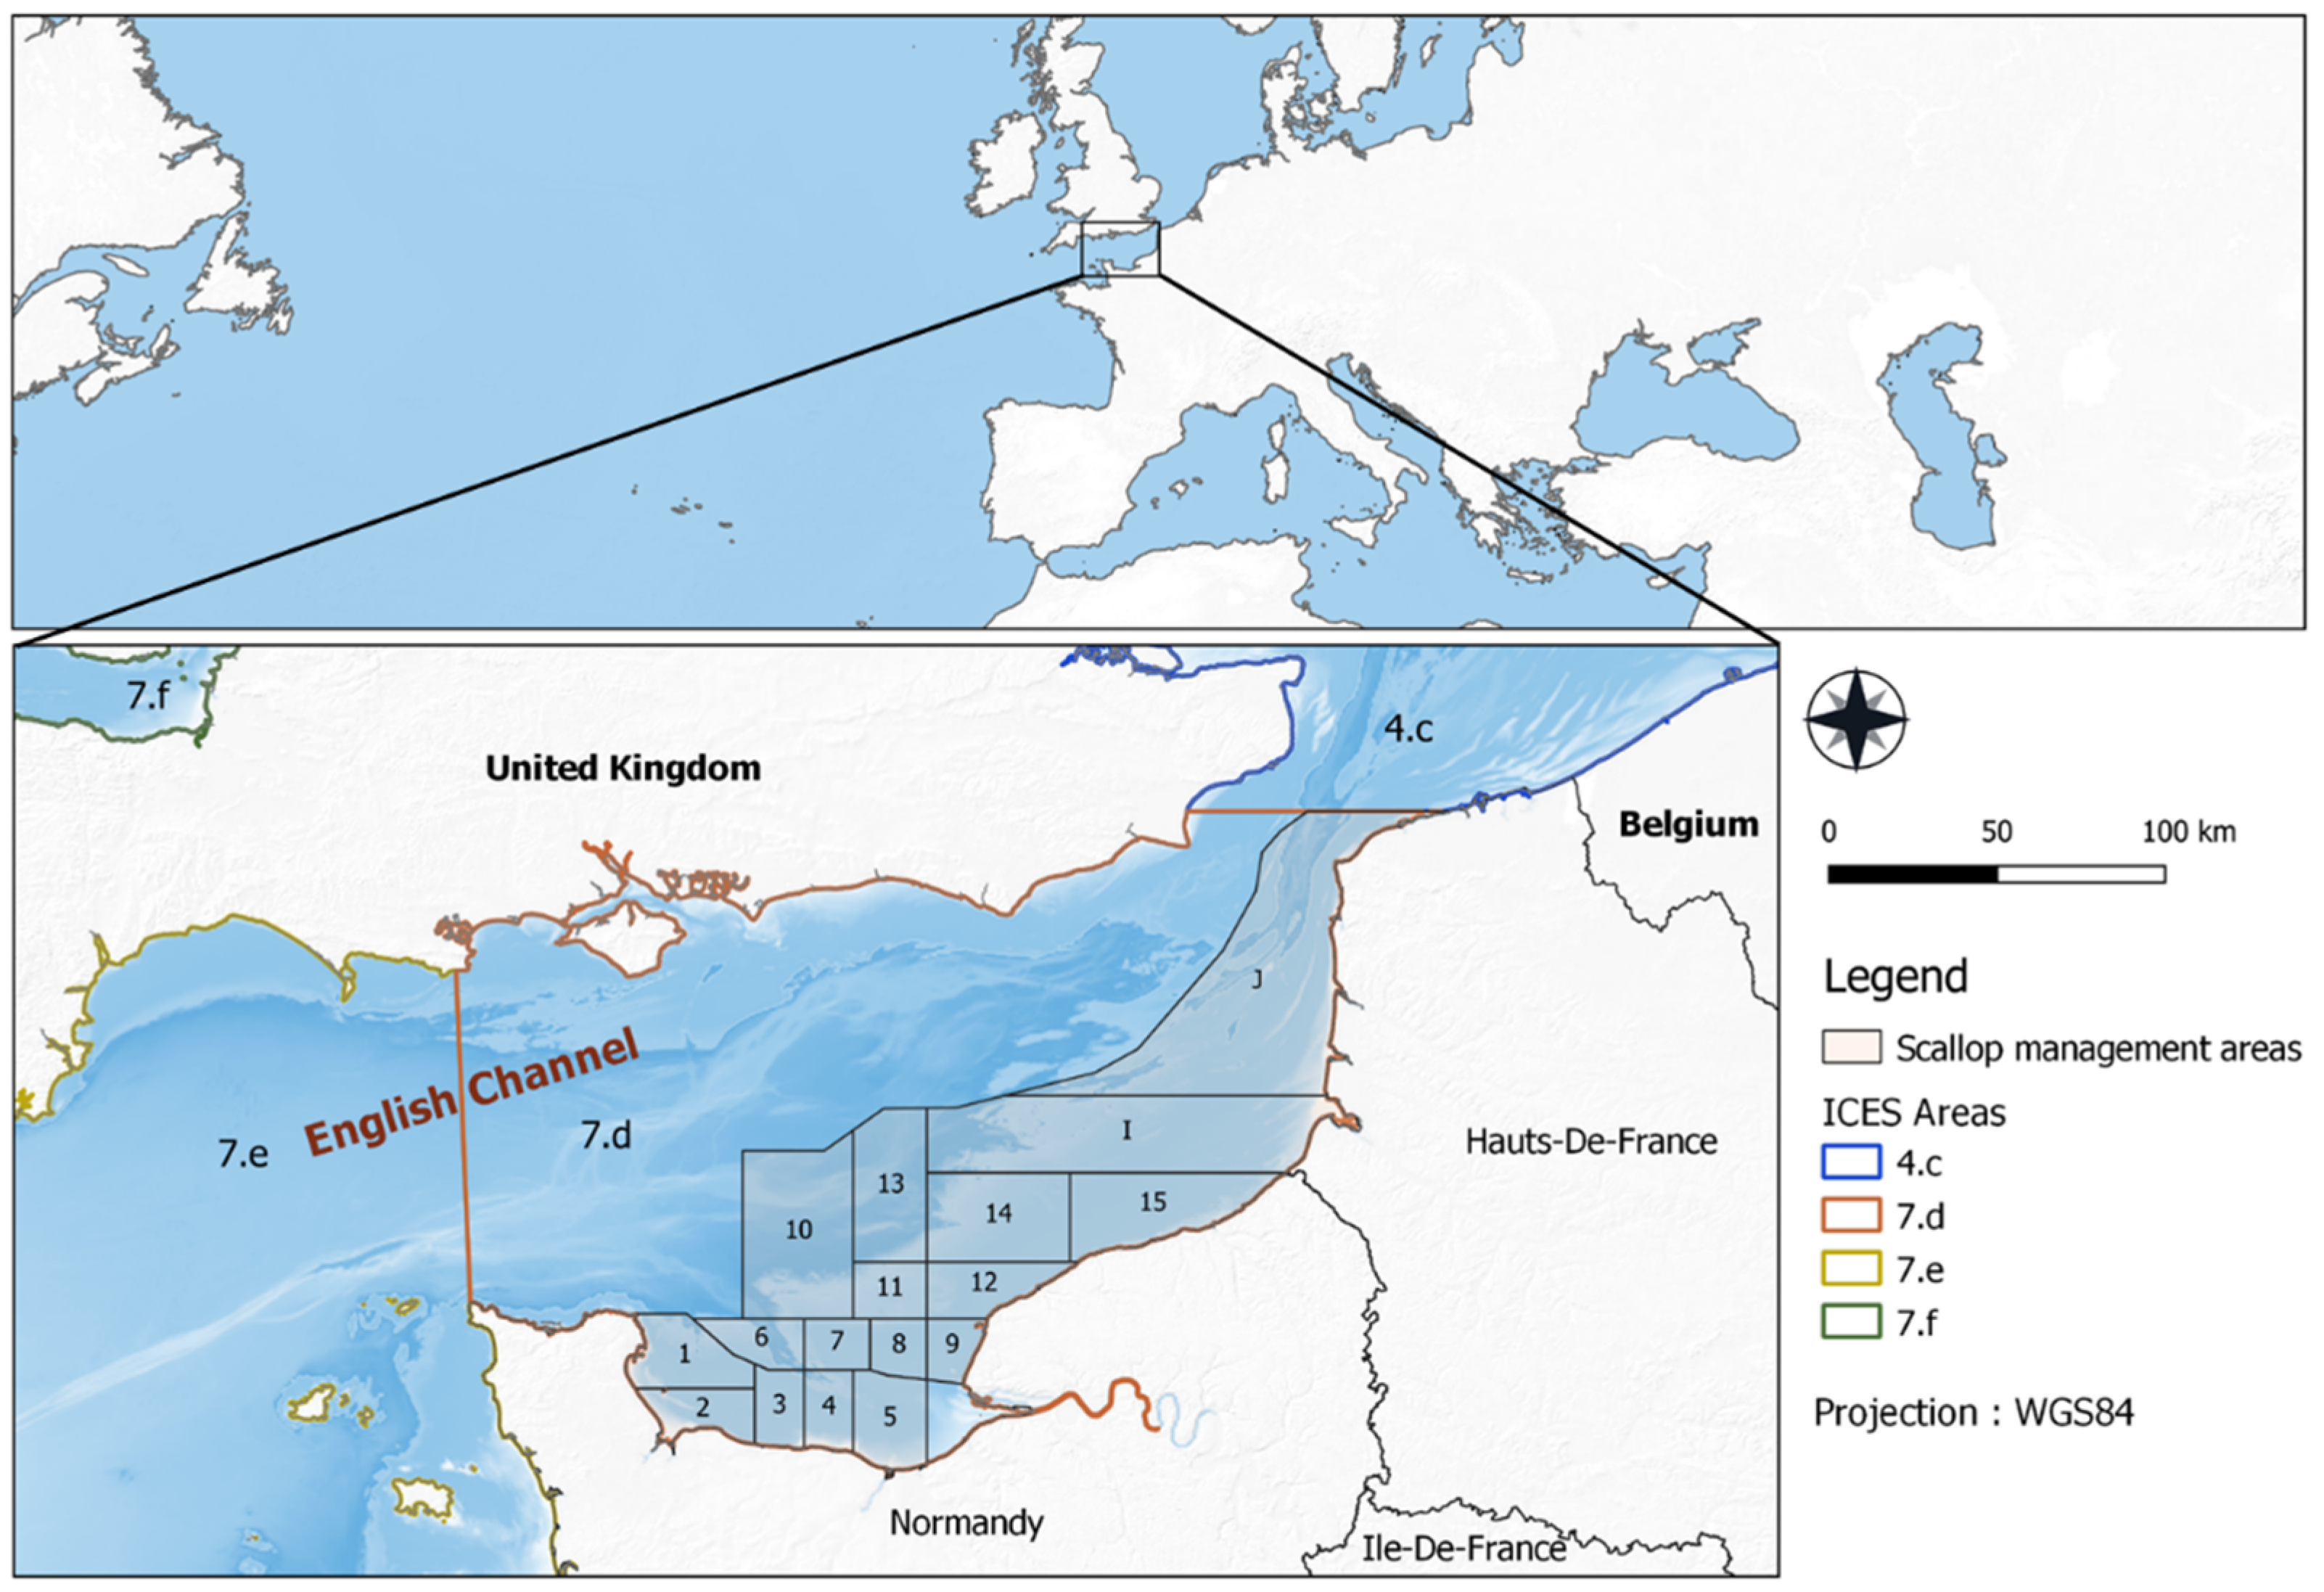
1.2. The Case Study of the Scallop Fishery Faced with HAB Toxicity Events in the Eastern English Channel

The French coasts of the eastern English Channel are rich in biodiversity [31]. This biodiversity has made this area a home of multiple activities and constitute the support of many fisheries, in particular the scallop fisheries, which represents the main target species for coastal communities in this area [32]. In France, the scallop fisheries are strictly regulated and subject to specific operating conditions through compulsory management measures implemented particularly in the classified shellfish bed of the Bay of Seine (zones 1 to 5 in Figure 1). This management consists of a set of access rules and technical measures that aim to manage and preserve this fishery resource [33]. On the other hand, this area has been one of the spots of harmful and toxic algal blooms for several decades. The three main groups of toxic species identified in these blooms are Dinophysis, Pseudo-nitzschia and Alexandrium, which, respectively generate toxins causing diarrheic (DSP), amnesic (ASP), and paralytic (PSP) shellfish poisoning. The monitoring of these phytoplankton and their accumulated toxins in marine organisms is mandatory in France in the framework of the official sanitary monitoring system [25]. The regulatory thresholds for toxic phytoplankton biomass and their toxin concentrations are set in the European regulations (Regulation (EC) N°853/2004 of 29 April 2004 (Annex III, Section VII, Chapter V)). According to the monitoring data, Dinophysis and Pseudo-nitzschia blooms are frequent in the eastern English Channel causing shellfish toxicity every year. In 2004, the abundance of Dinophysis reached 803,000 cells per litre of water in the Bay of Seine. For a taxon that has never proliferated at high biomasses in France (<10,000 cells/L), this concentration is a national record for at least the past thirty years [25]. For Pseudo-nitzschia, this area has experienced two major episodes of very high shellfish toxicities, one in 2004 and the other in 2012.
Since 2003, scallops have been frequently affected by HAB toxins, leading to commercial bans when the concentration of toxins is higher than the regulatory thresholds defined in the European regulation. The dynamics of HAB events and their toxicity have led to the adaptation of management strategies and the responses of fishing communities. If fisheries management in the English Channel is facing multiple environmental, socioeconomic, and institutional issues, HAB events have become a major issue for the sustainability of the fishery over the last decades. In this context, the exposure of such an important fishery to an unpredictable HAB risk may have significant socioeconomic impacts. A detailed understanding of the fishery activity and the vulnerability of fishing communities to HABs is therefore needed to support the management of this risk.

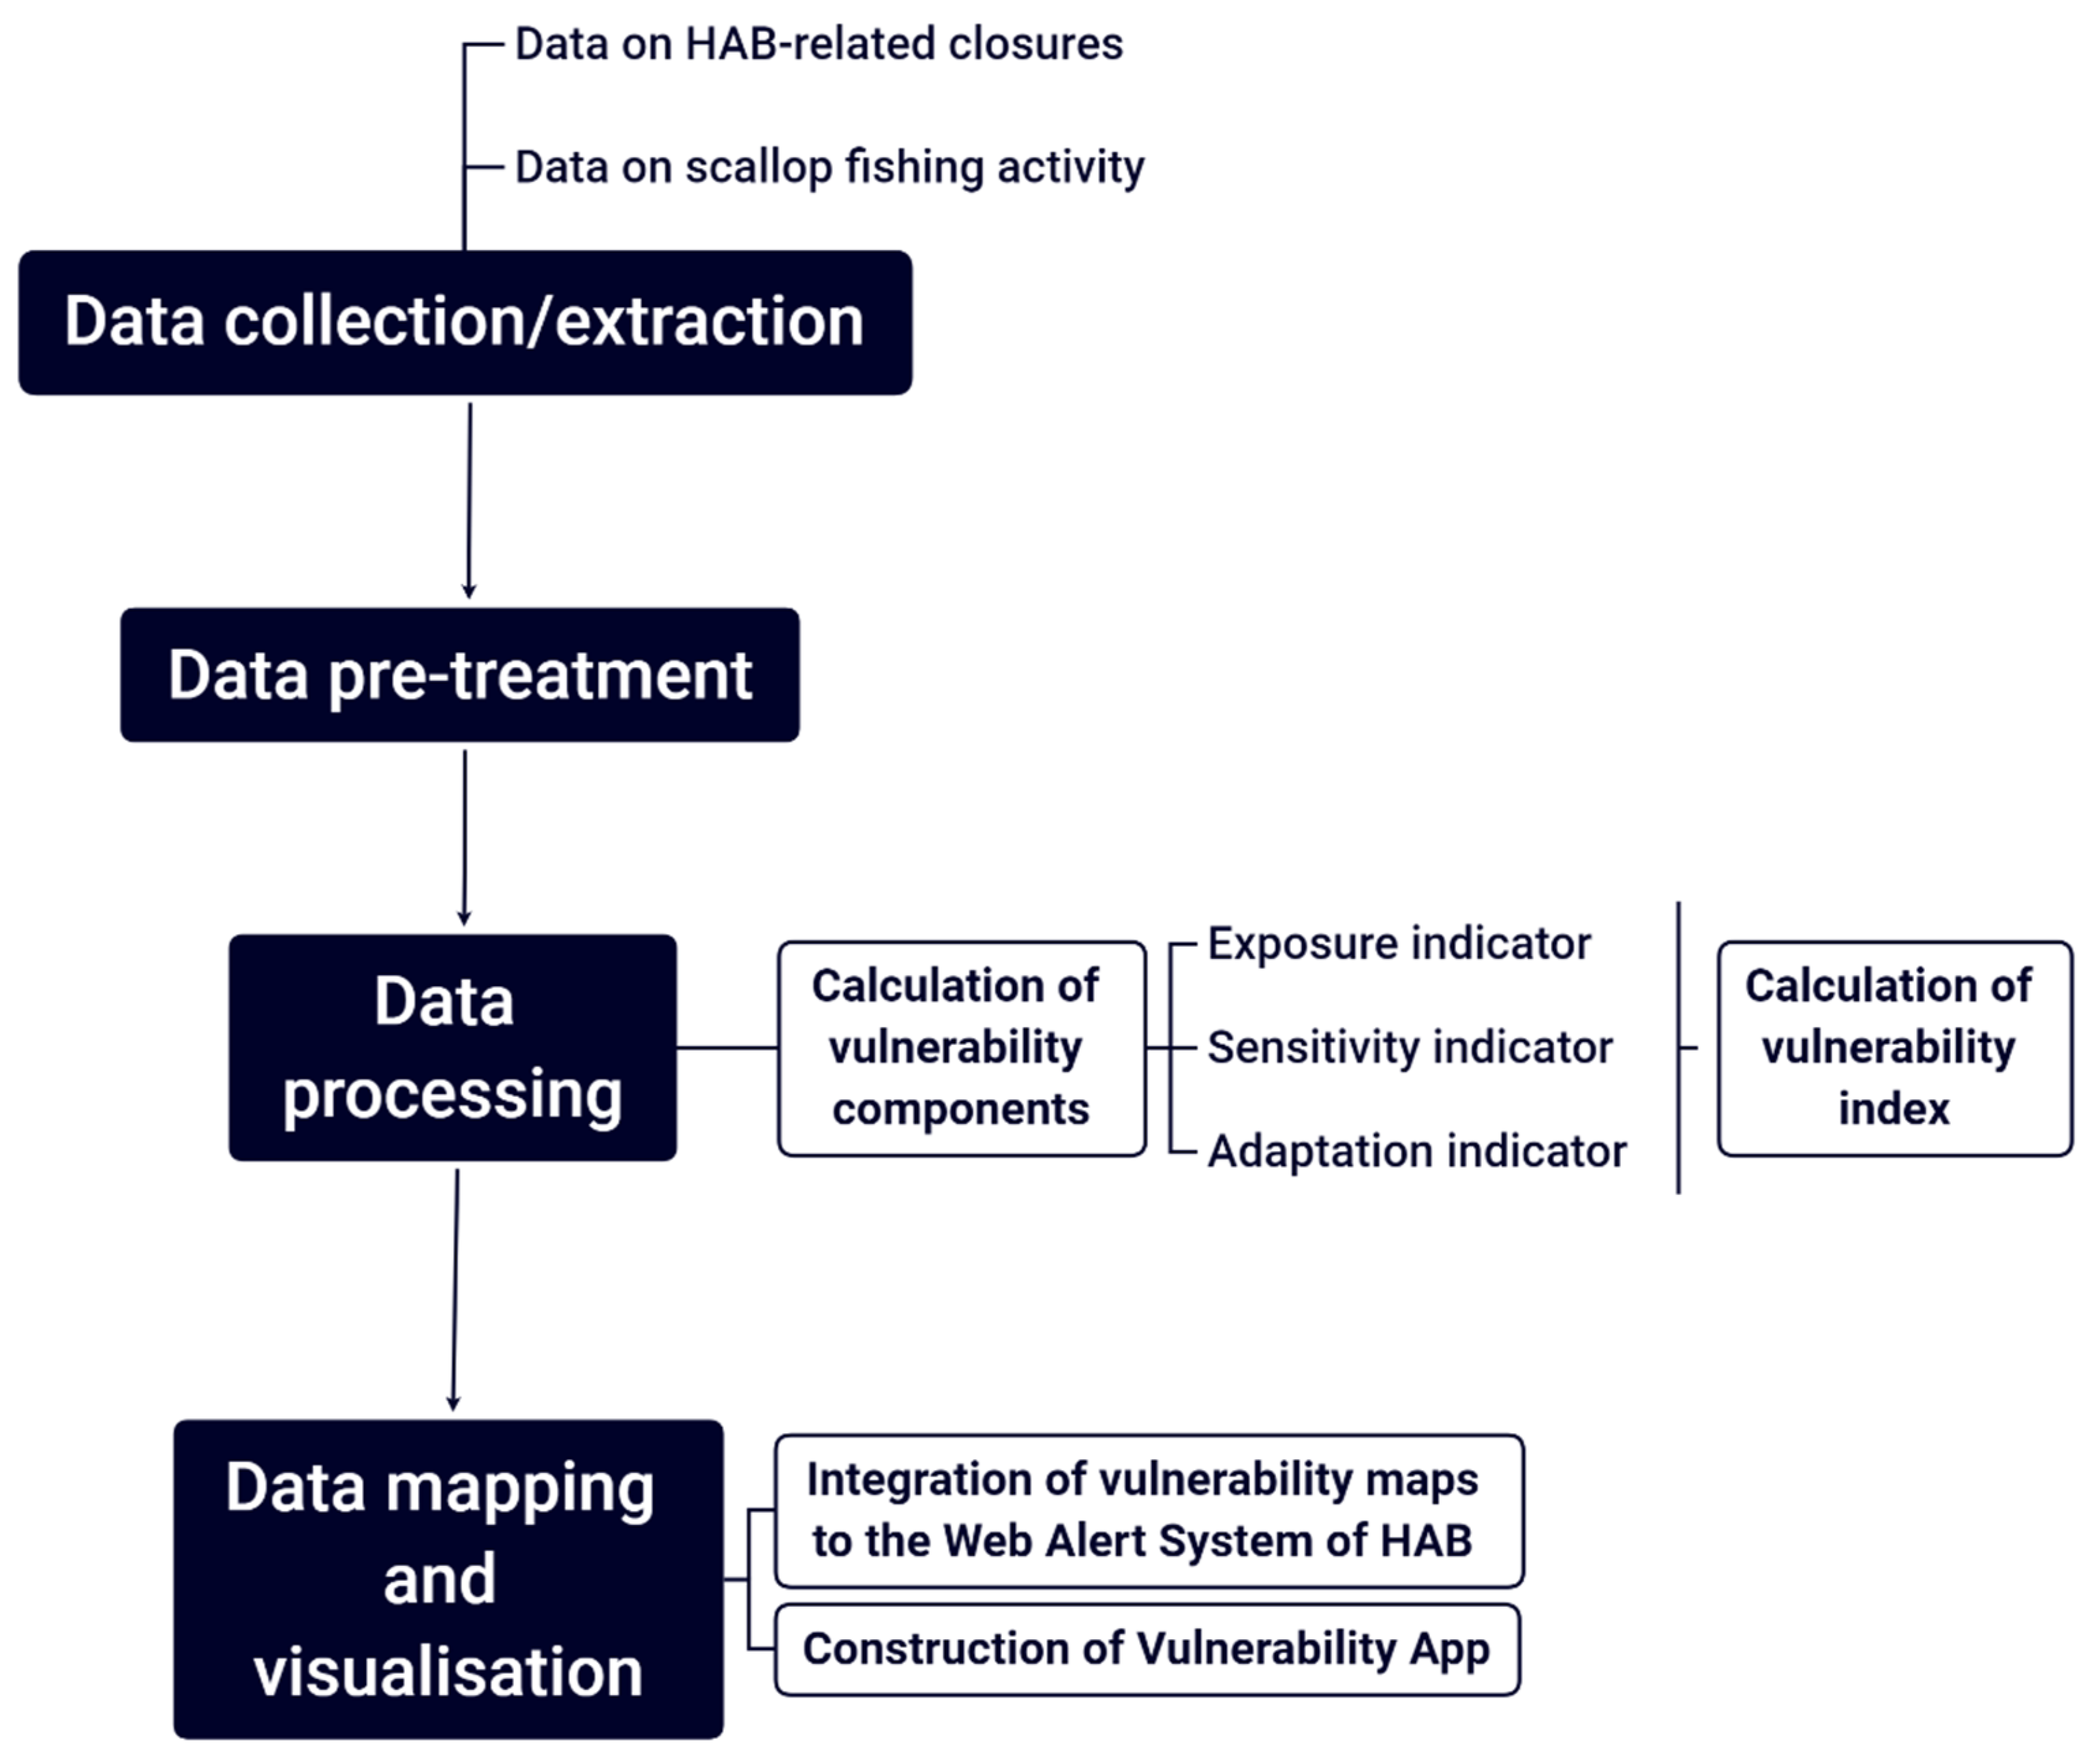
2. Materials and Methods

The population studied in this paper concerns fishers targeting scallops in the eastern English Channel, i.e., the ICES area 7.d (Figure 1). Database concerns all vessels using dredges (exclusive or polyvalent) and which catch more than 1 kg of scallops via fishing trips. In France, these vessels are structured in four fleet categories according to the typology defined by the IFREMER’s Fisheries Information System (French national monitoring network for the observation of marine resources and the monitoring of professional fishing fleets), which is adapted to the framework of the European programme of fleets economic performance (Table 1). The objective of this typology is to manage the heterogeneity of fishing vessels and to classify them into groups or segments having similar fishing techniques and strategies as well as homogeneous economic characteristics [34,35]. In this work, the size segmentation is different from that used in the fleet typology of IFREMER, the French Institute of Marine Research. This segmentation is based on scallop management regulations concerning the maximum scallop quantity (quota) allowed per landing (Section 8 of the decree n°0191 of 21 August 2018), according to the exploitation conditions, which depend on the technical characteristics of vessels (e.g., length, width, and type of the vessel) [36].
The potential socioeconomic impact of HABs on a scallop-dependent fishery is related to the potential loss of income due to fishing closures during toxicity events. These effects depend mainly on the specific characteristics and activity strategies of each fishing company. In this paper, the vulnerability approach is used to address the social and economic issues induced by HAB-related fishing closures, and aims to (1) have a better understanding of how fleet segments are affected, and (2) measure the degree to which these fleet segments are likely to be impacted due to their exposure closures.
Vulnerability is a concept that describes the susceptibility of exposed elements or systems (e.g., ecosystems, human communities, and activities) to experience losses or negative consequences due to a hazard event [30,37,38,39,40]. It refers to a situation resulting from a combination of environmental, physical, economic, and social factors [39,41]. The vulnerability analysis is a framework primarily applied to climate change issues. This approach is increasingly extended to other contexts and issues related to social-ecological systems, but the purpose is still the assessment of the extent of hazard impacts and the adaptive capacity of the exposed elements [42]. The aim of vulnerability assessments and analysis is to inform and assist decision making [43].
Various methods and tools are used in the vulnerability analyses [42]. In this study, indicator-based method and mapping were chosen to measure and analyse the vulnerability of fishers and its spatial and temporal trends. It consists of constructing, calculating, and then spatializing the vulnerability composite index (Figure 2). This approach highlights the importance of measuring the spatial effects, which is rarely considered in impact assessments, to achieve a more comprehensive and in-depth understanding of the dynamics of HAB impacts and communities’ responses.
There are different methods used to define and calculate the vulnerability index, but all these methods are based on three components or dimensions: exposure, sensitivity, and adaptive capacity [43] (Figure 3). Exposure and sensitivity determine the potential impact associated with HAB events [43]. A long-term closure (exposure) of an area highly frequented by fishing vessels, which depend on scallop production (sensitivity) could thus result in additional costs and production losses (potential impact). This potential impact can be reduced by the adaptive responses, and contribute to measure the degree of the vulnerability to HABs.

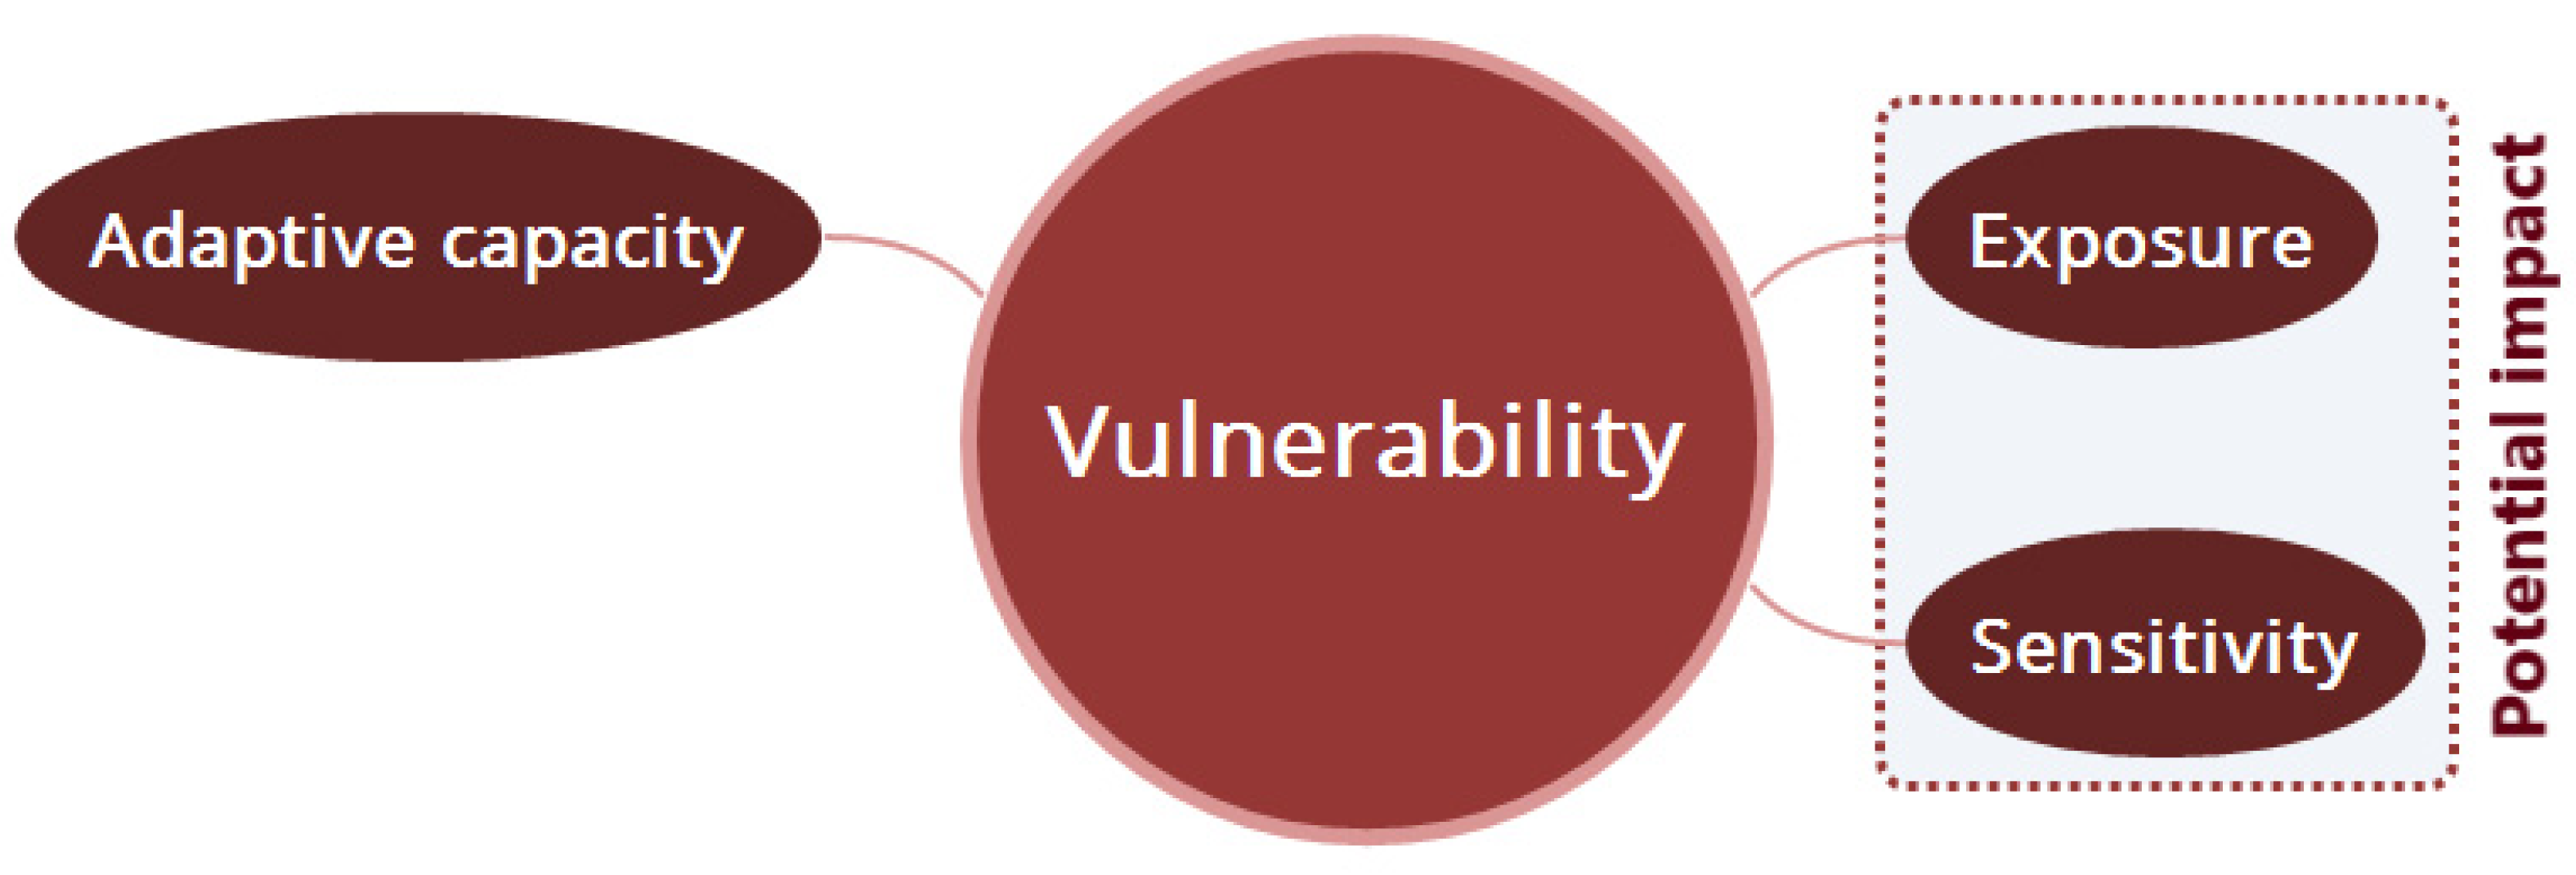
2.1. The Vulnerability Components

2.1.1. Exposure

The exposure is defined as the condition of being subject to negative effects resulting from a given hazard [44]. According to the IPCC (Intergovernmental Panel on Climate Change), it is also defined by the magnitude of the hazard [45].
Toxic algal blooms can affect fisheries in many ways, both directly and indirectly. The direct effects include impacts on the exploited species, which lead to economic loss related to changes in species physiology, behaviour, reproduction and recruitment, causing abundance issues or mortalities [46]. In our case study, the exposure of fishers to toxic algal blooms is related to the indirect impacts, as scallops are not directly affected by HAB toxins but can accumulate them and threaten the consumers’ health. The nature of fishers’ exposure to HABs is therefore linked to the measures implemented to protect human health. Exposure describes then the fact that fishing fleets are confronted with closures of production areas due to scallops’ contamination by phycotoxins and refers to the magnitude of these closures.
Here, the exposure is measured based on an indicator defined from the rate of lost working days related to fishing bans due to HAB events. This indicator was calculated using data on administrative closures (legal decrees) and scallop fishing periods, provided by the DIRM-MEMN (Direction Inter-régionale de la Mer Manche Est—Mer du Nord: administration in charge of the implementation of management measures regarding HAB events in the eastern English Channel). Data on area closures contain information about the date and duration of closures in number of days structured by production zones and fishing seasons between 2012 and 2019. Data on fishing periods refer to the fishing calendar indicating the dates of the beginning and the closing of scallop fishing season for each production area as defined in regulation. The rate of lost working days due to HAB-related closures was calculated for each vessel category, production area, and fishing season as the duration of closures in days divided by the total days authorised for the fishing season (Equation (1)).
Exposure category f ( zone z ) ,   ( season s ) = Duration   of   closures   ( zone z ) , ( season s ) Duration   of   the   fishing   season   ( zone z ) , ( season s )

2.1.2. Sensitivity

Sensitivity refers to the susceptibility to experience harm and negative effects resulting from the exposure to a given risk, and the degree to which an exposed system is affected [44,45]. If exposure is resulted from external and uncontrolled factors (natural, institutional, etc.), sensitivity depends on the characteristics of the exposed system (scallop fishing fleets) [44]. The identification of variables used to describe the fishers’ sensitivity is therefore based on the analysis of their characteristics. Thus, the sensitivity of scallop fishers to HAB-related closures is defined by their dependency to both scallop production and scallop fishing zone likely to be closed. In this paper, only economic dependency was considered. The dependency indicator is defined as the scallop contribution in total revenues of each vessel category. It was calculated as the scallop production (catch value) divided by the total production of the vessel category (all captured species) in each fishing area (Equation (2)).
Sensitivity category f ( zone z ) ,   ( season s ) = Scallop   production   ( zone z ) ,   ( season s ) Value   of   total   landings   ( zone z ) ,   ( season s )
Data used to calculate the sensitivity indicator were obtained from the Fisheries Information System of IFREMER. These data represent landings in volume and value, structured by year, week, fishing fleet category, species, and fishing zone (Table 2). As scallop fishing is a seasonal activity in France (from October to May), the variable “fishing season” was added to the data table, based on the fishing calendar of scallops provided by the management administration.

2.1.3. Adaptive Capacity

Adaptive capacity results from the ability to respond and to develop alternatives in order to reduce or moderate harm [45]. It is defined as the process of adjustment and development of behavioural characteristics that enable communities to cope with changes in order to insure their incomes and wellbeing [47]. Based on fishing strategies in the English Channel, the adaptive capacity of each vessel category was assessed through two variables associated with fishers’ flexibility. This flexibility refers first to fishermen’s level of polyvalence or their catches diversity, which means their ability to target other species in addition to scallops (strategy or capacity 1). Second, it refers to the spatial distribution of scallop vessels and their capacity to change fishing grounds during ban periods (strategy or capacity 2). The level of polyvalence of fishers was calculated as the production of other species divided by the total production of each vessel category. The capacity of vessels to change fishing zones was assessed using the distribution of scallop production and the contribution of the different fishing areas to the landings. As fishers use both strategies at the same time, the adaptive capacity index was defined as the maximum value between capacity 1 and 2 (Equation (3)).
Adaptive   capacity category f ( season s ) =   max ( capacity   1 ,   capacity   2 )

2.2. The Composite Index of Vulnerability

The combination form of the vulnerability components is context-specific depending on how the relationship among the vulnerability components is described [48]. In this work, the vulnerability index is defined as a function of exposure and sensitivity, which can be reduced by adaptive capacity. The multiplication of exposure and sensitivity values defines the potential impact score (Equation (4)). Finally, the resulting index represents the overall vulnerability of each vessel category per fishing zone and season (Equation (5)).
Potential   immpact category f ( zone z ) ,   ( season s ) = Exposure   ×   Sensitivity
Vulnerability category f ( zone z ) ,   ( season s ) = Potential   impact Adaptive   capacity
The construction of the vulnerability composite index involves two steps. First, the indicators of exposure, sensitivity and adaptive capacity were calculated and normalised using Min–Max method. This method allowed us to transform resulting values into a normalized range between 0 and 1 in order to use common scale for all indicators (Equation (6)).
Xnormalised = (XXmin)/(XmaxXmin)
Xnormalised is the standard indicator, X is the original value of the calculated indicator, and Xmin and Xmax are the minimum and maximum values of the dataset for each vessel category, fishing season and zone.
The second step concerns the aggregation of dimensions and the construction of the composite index of vulnerability using Equation (5). In this study, it is assumed that all indicators are equally important, and equal weighting is used. The resulting vulnerability index was normalised between 0 and 1, with higher values indicating greater vulnerability. Table 3 summarises the indicators chosen to characterise each dimension of the vulnerability index, their construction and aggregation.
The processed indicators of exposure, sensitivity, and adaptive capacity as well as the composite index of vulnerability have been published as an open-access dataset (https://doi.org/10.35110/c12ca075-e2aa-41b9-962c-99111897b86e) [49], accessed on 10 June 2023.

2.3. Spatialisation of the Vulnerability Index

In this paper, the approach adopted for the spatialization of the vulnerability index is based on dynamic visualisation. This approach consists of representing the vulnerability of each fishing fleet category in a visually interactive format that allows for analysing, understanding, and communicating the vulnerability spatial and temporal dynamics. In order to simplify the interpretation and the spatial representation of the vulnerability index, values were grouped and classified into five discrete categories ranged as follows: lowest (between 0 and 0.2), low (between 0.2 and 0.4), moderate (between 0.4 and 0.6), high (between 0.6 and 0.8), and highest (between 0.8 and 1). After calculating the three components of vulnerability and the construction of the composite index, vulnerability maps have been created and integrated into the web alert system of HAB events developed by S-3 EUROHAB project. The objective is to translate a general risk of HAB occurrence into a vulnerability score adapted to the different categories of fishing fleets and provide a socioeconomic information in addition to the environmental aspects of this phenomenon. Spatial data on scallop production zones were provided by Ifremer. All data processing and production of the shape files were performed using R software (version 4.1.2) and QGIS (version 3.10.10).
The spatialisation concerns not only vulnerability index but also its three components. This allows us to better understand factors influencing the vulnerability dynamics, explore the spatial patterns and correlations between the vulnerability components. An interactive Web application was developed using R programming language and Shiny package. This interactive visualisation aims to have a holistic view of the vulnerability and its components and to present all the dimensions of the dataset including the fishing fleet categories as well as the spatial and temporal aspects. The process of the development of this web application involved two steps. First, based on the created indicators dataset, the application was locally developed and written in R Shiny tool [50] of RStudio using shinydashboard [51] and shinyWidgets [52] packages. Second, it was deployed to the web server of Ifremer and a link was generated to make the application accessible by users.

3. Results

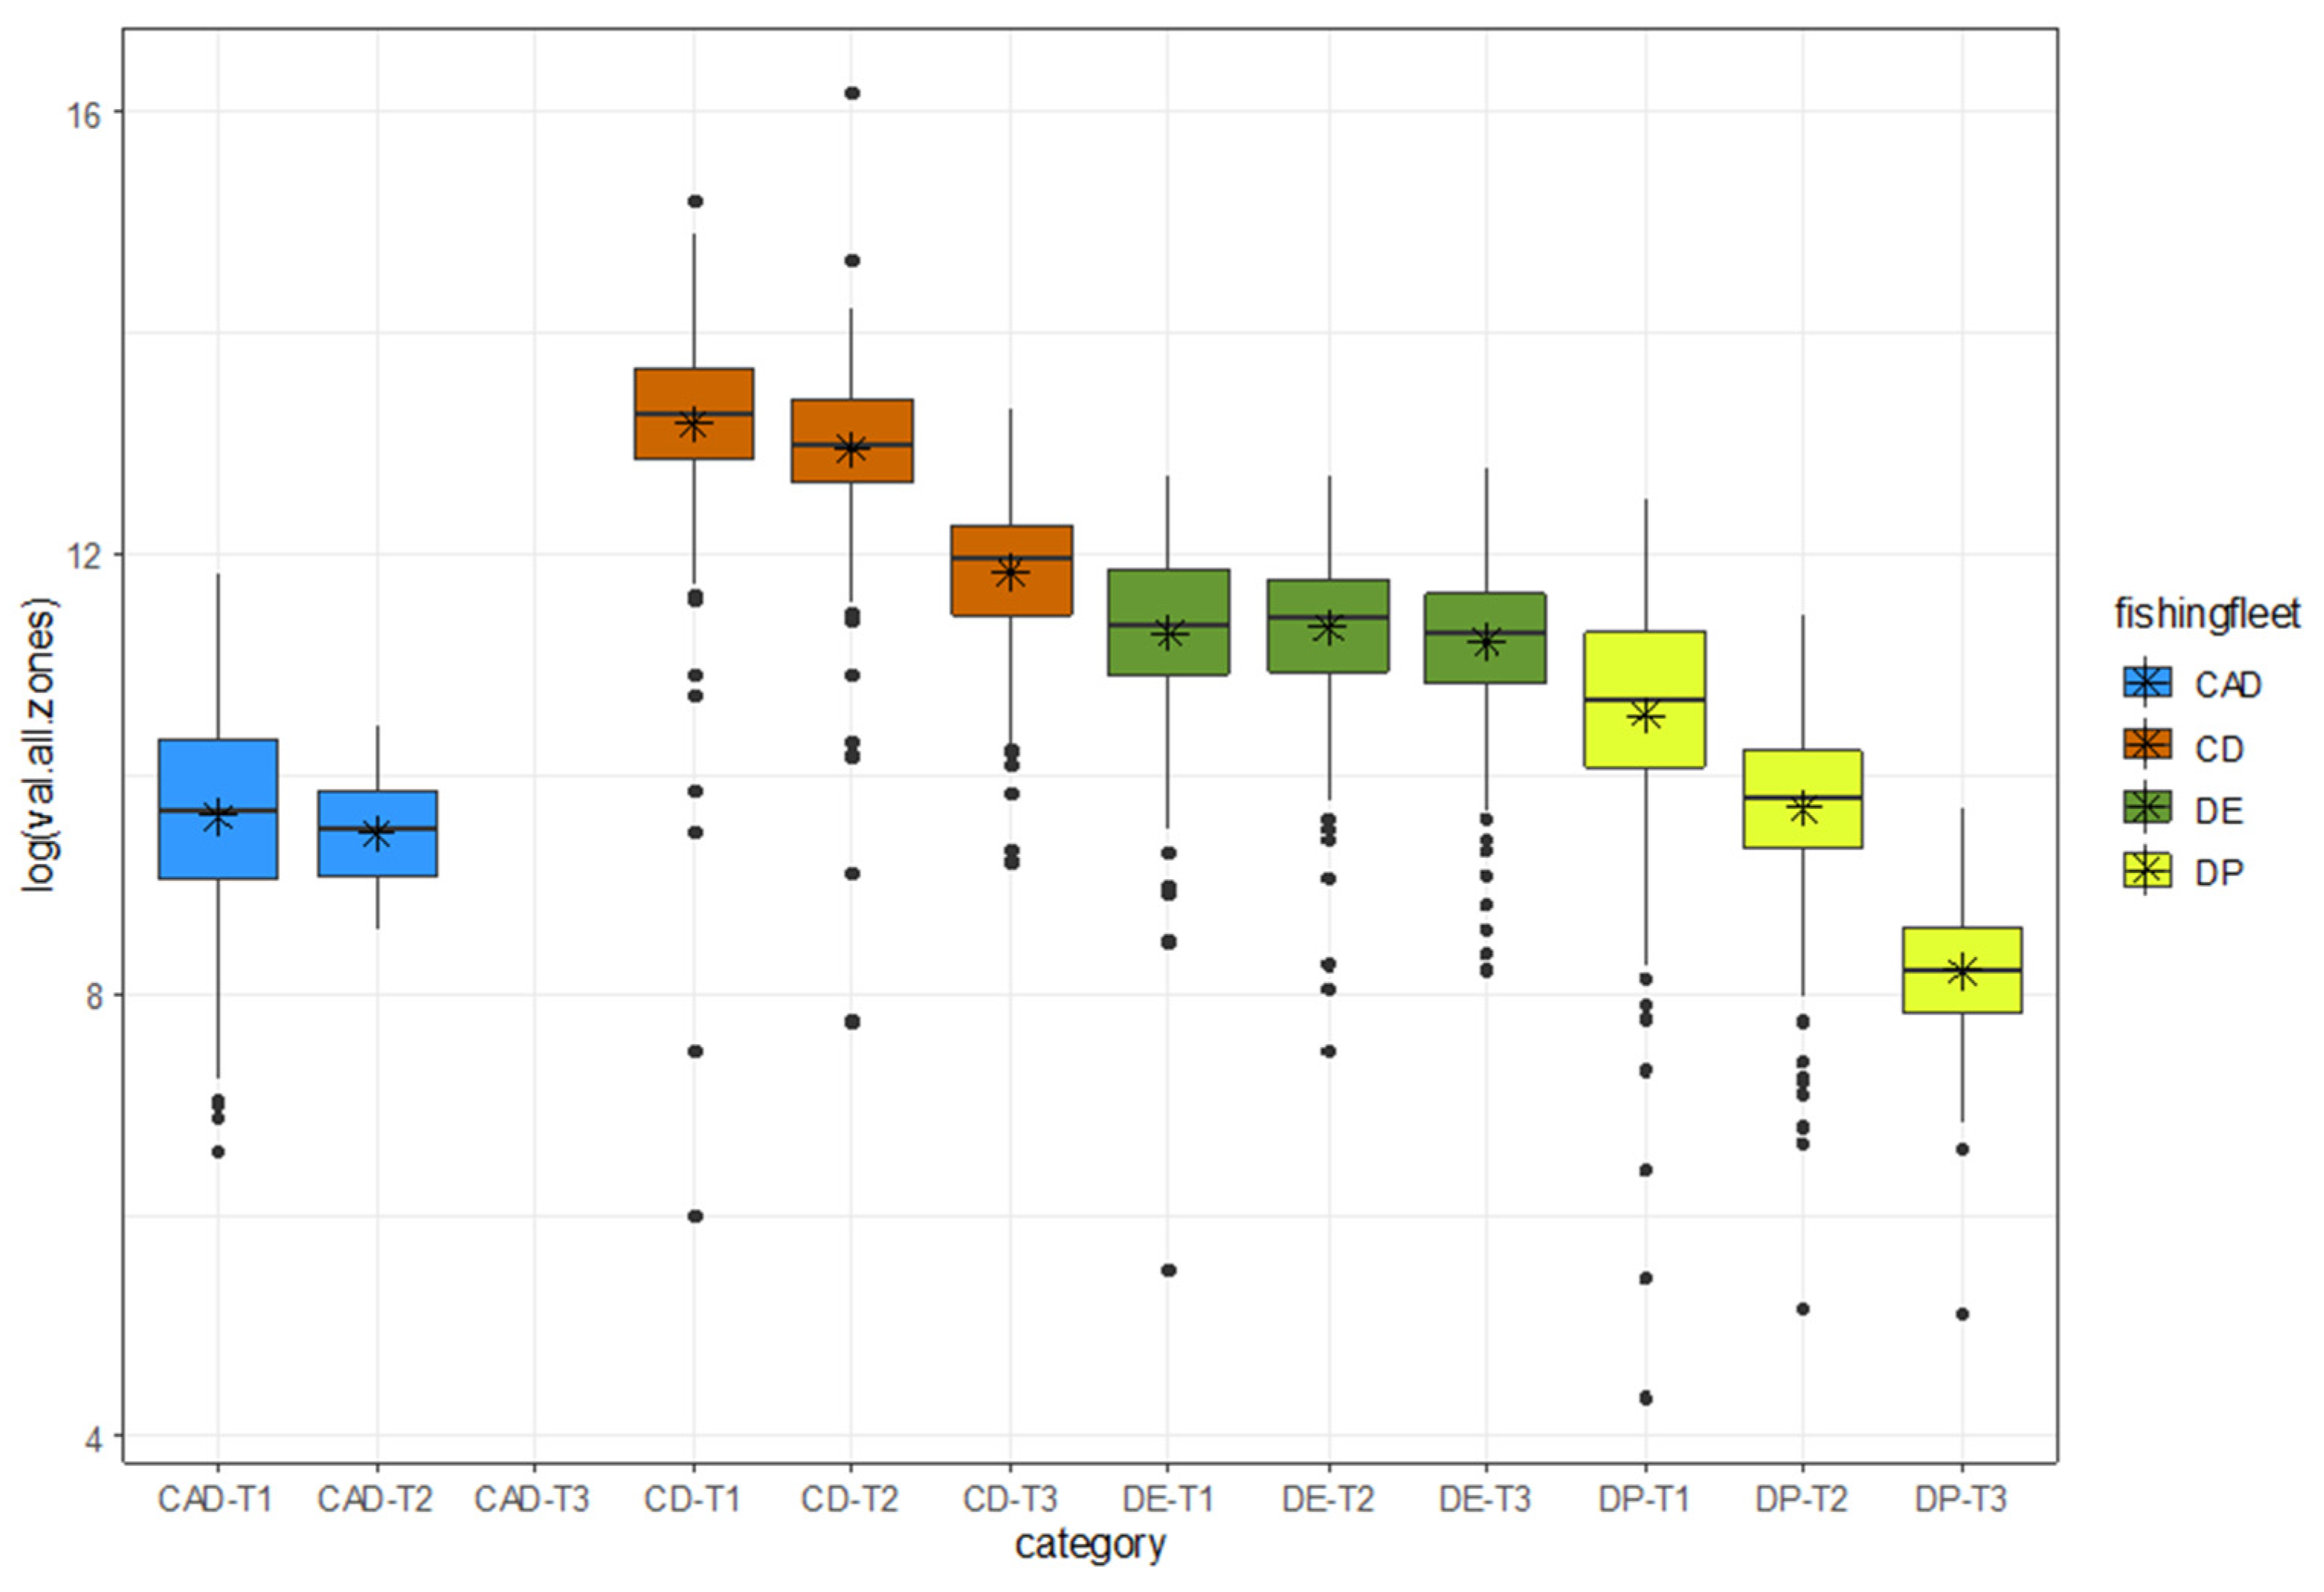
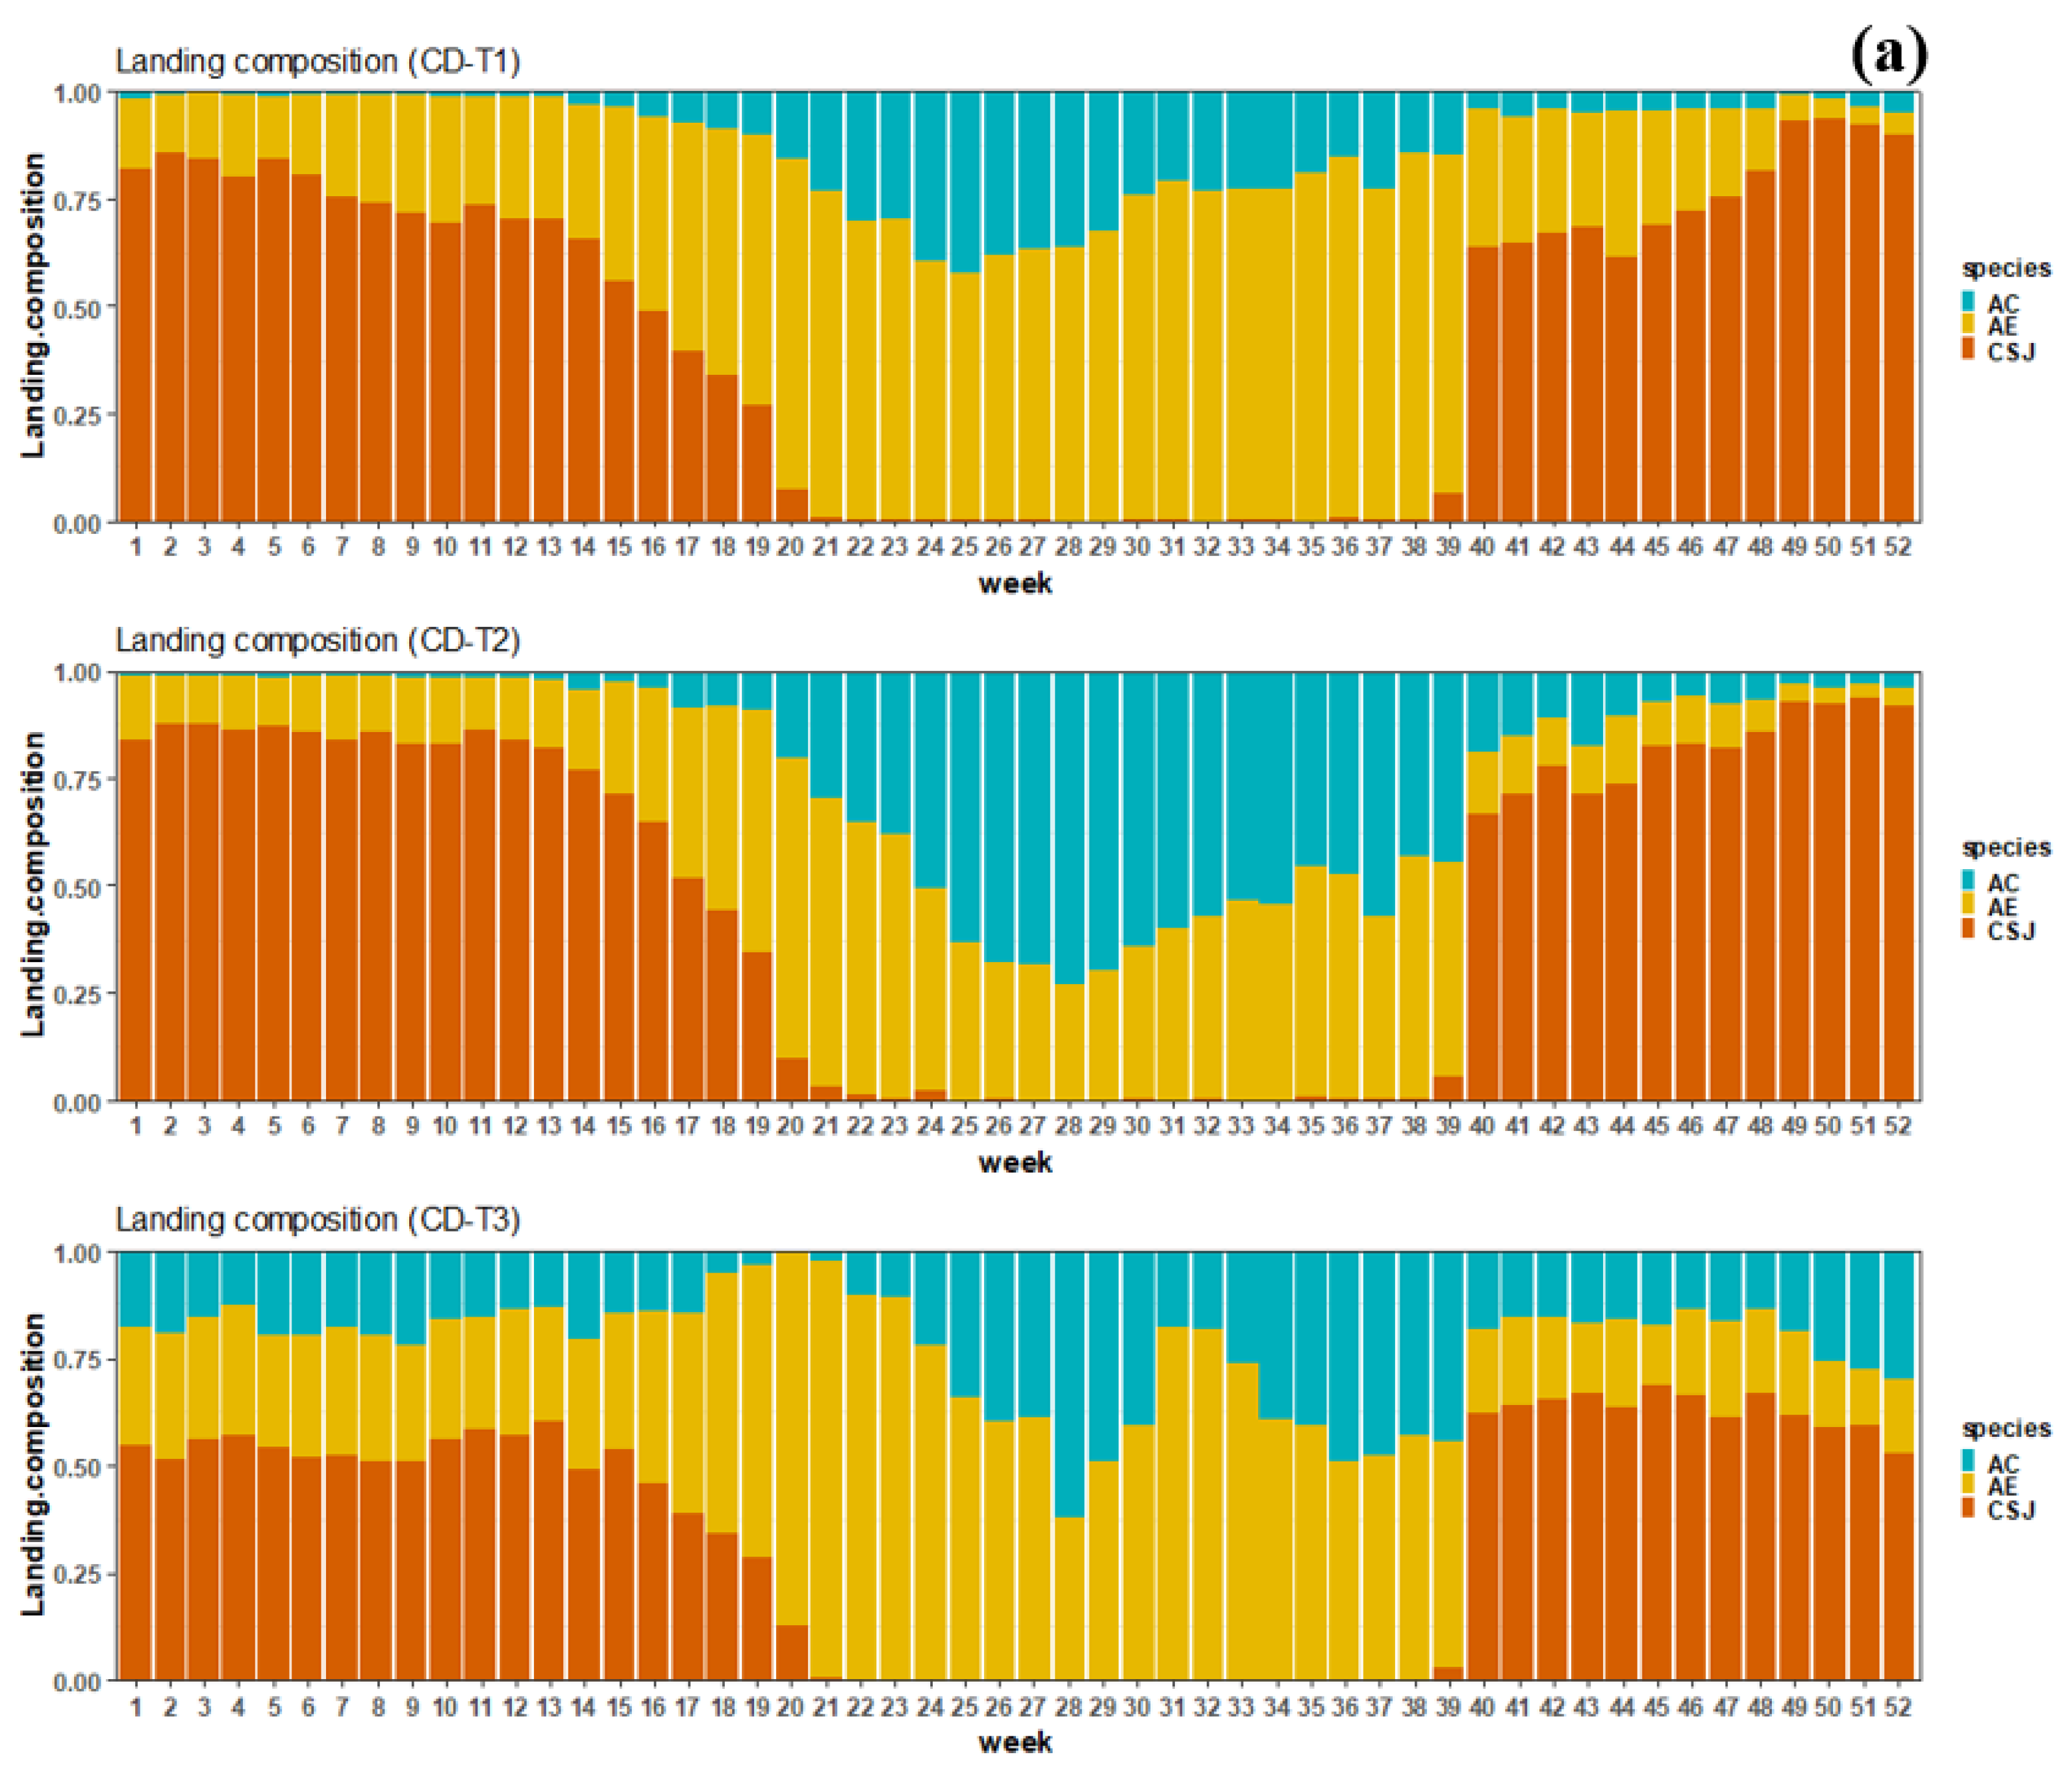
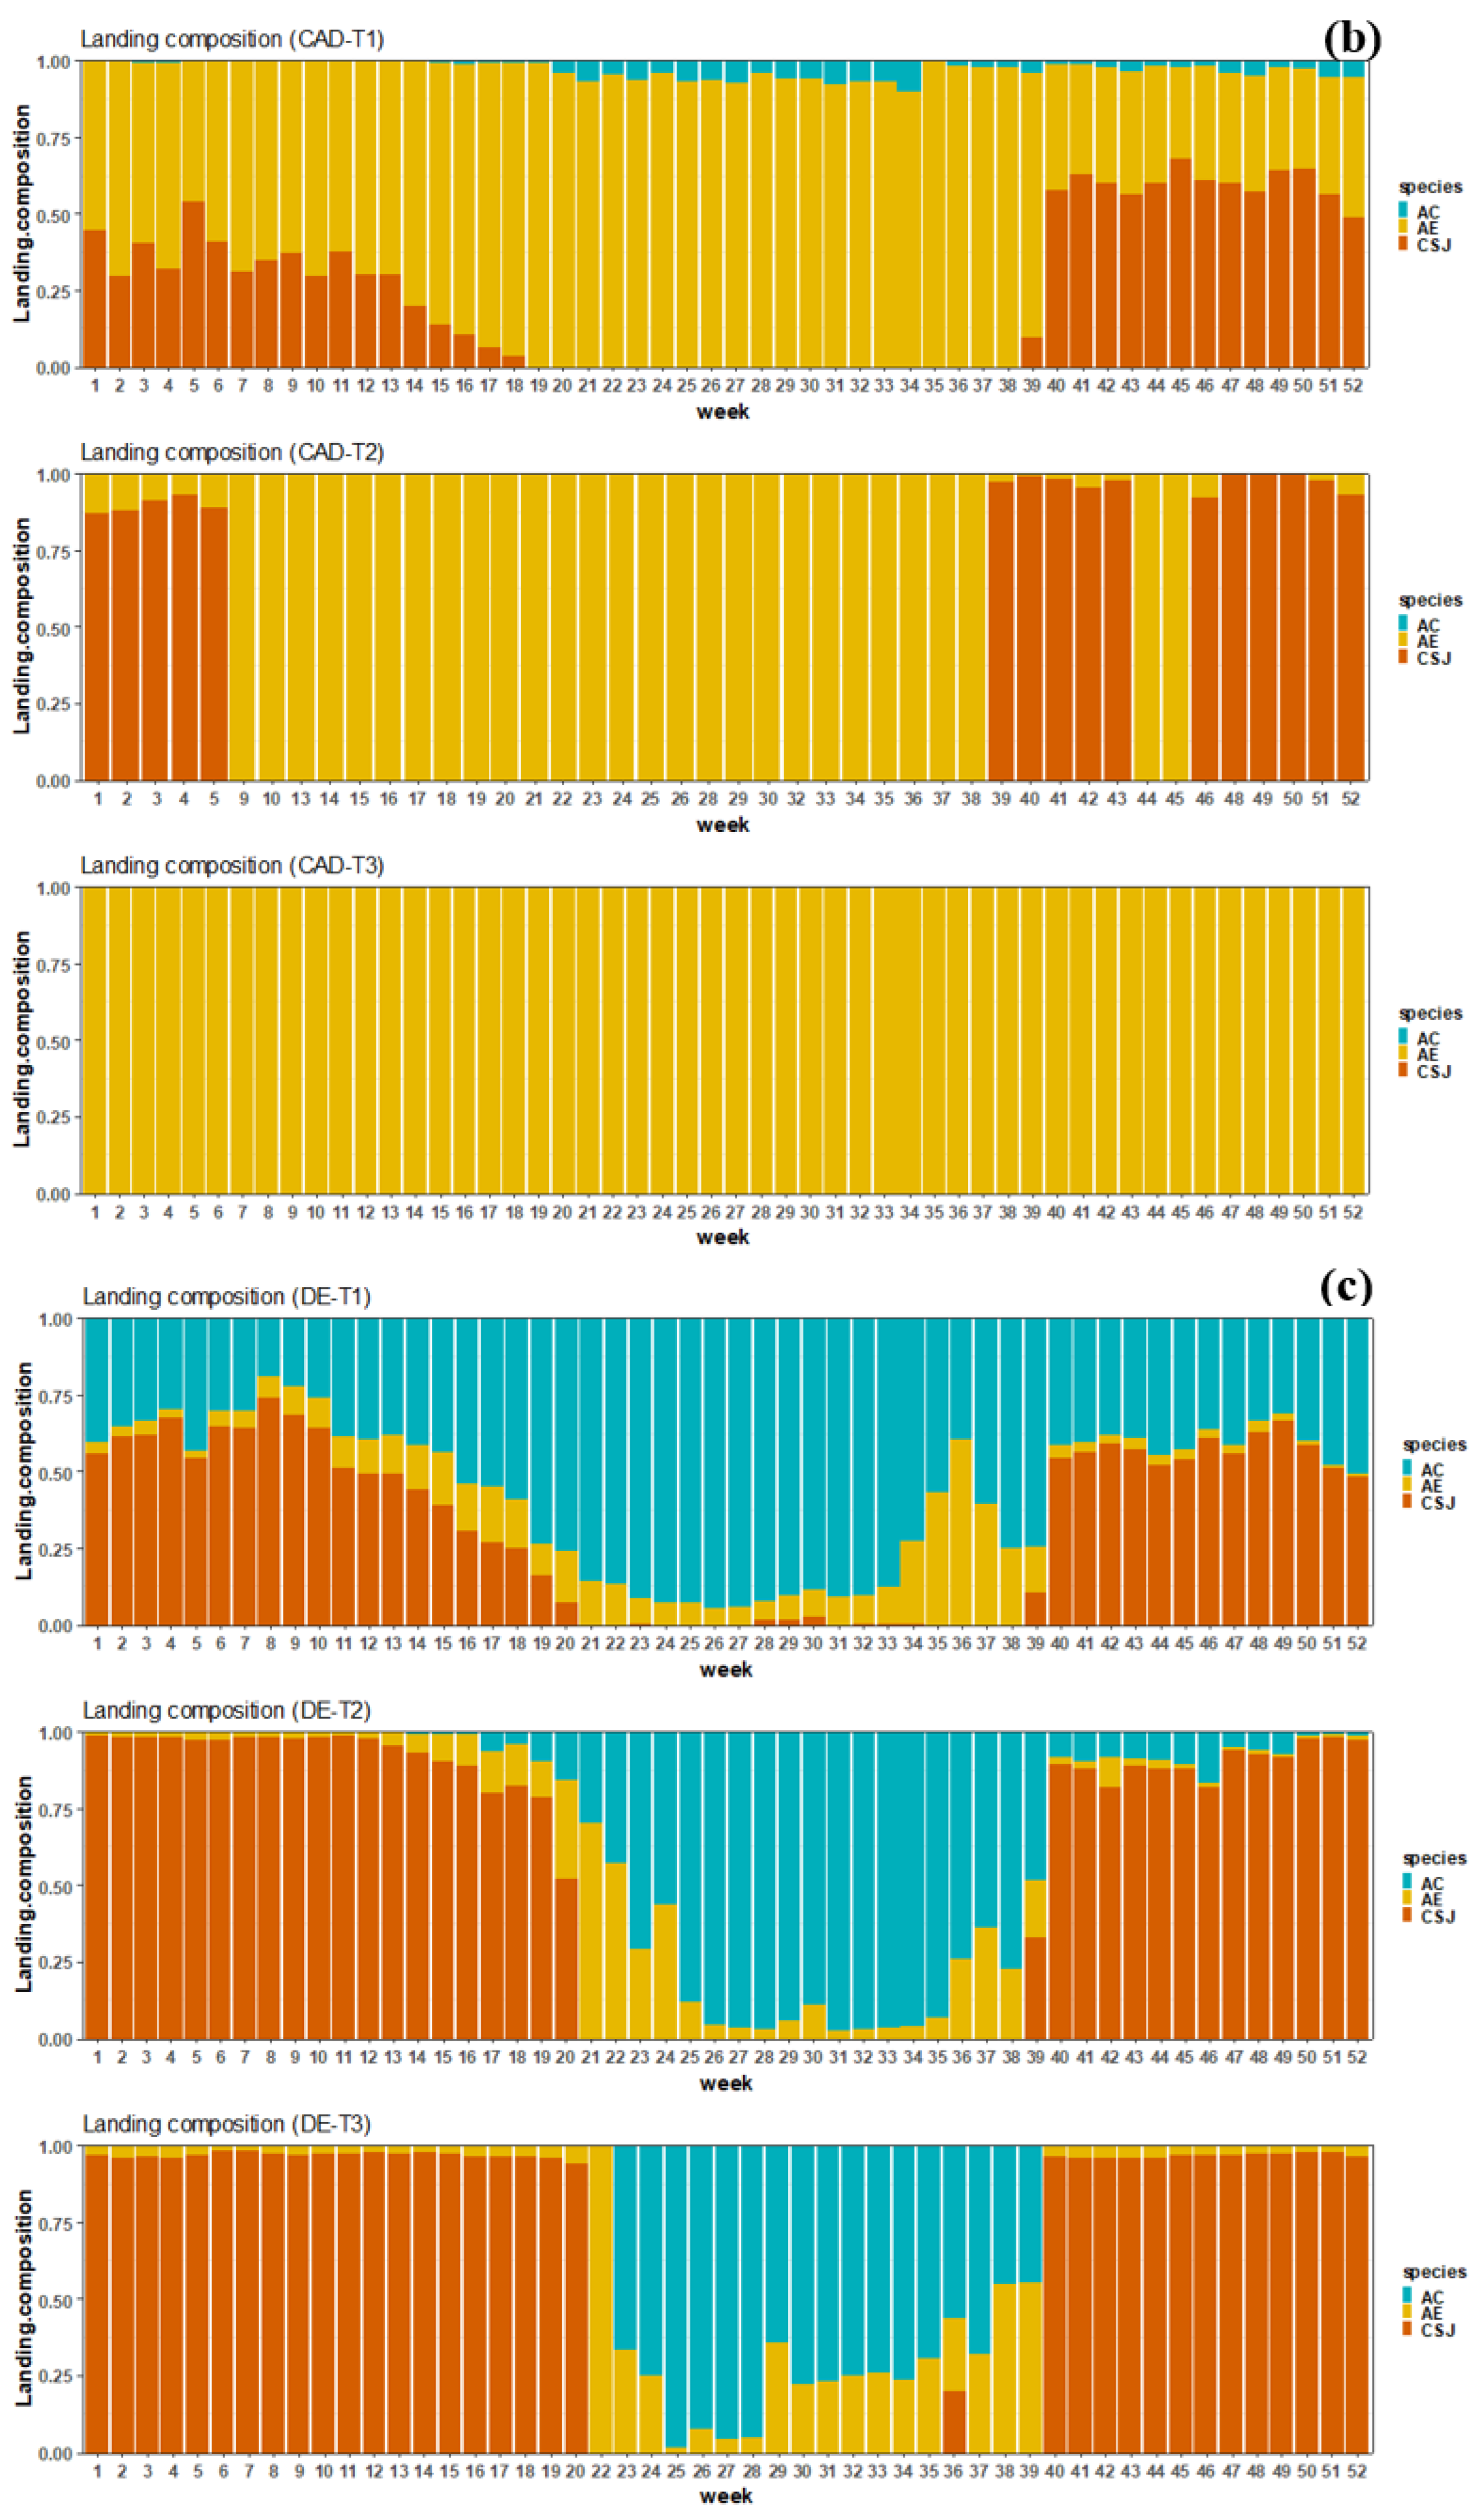
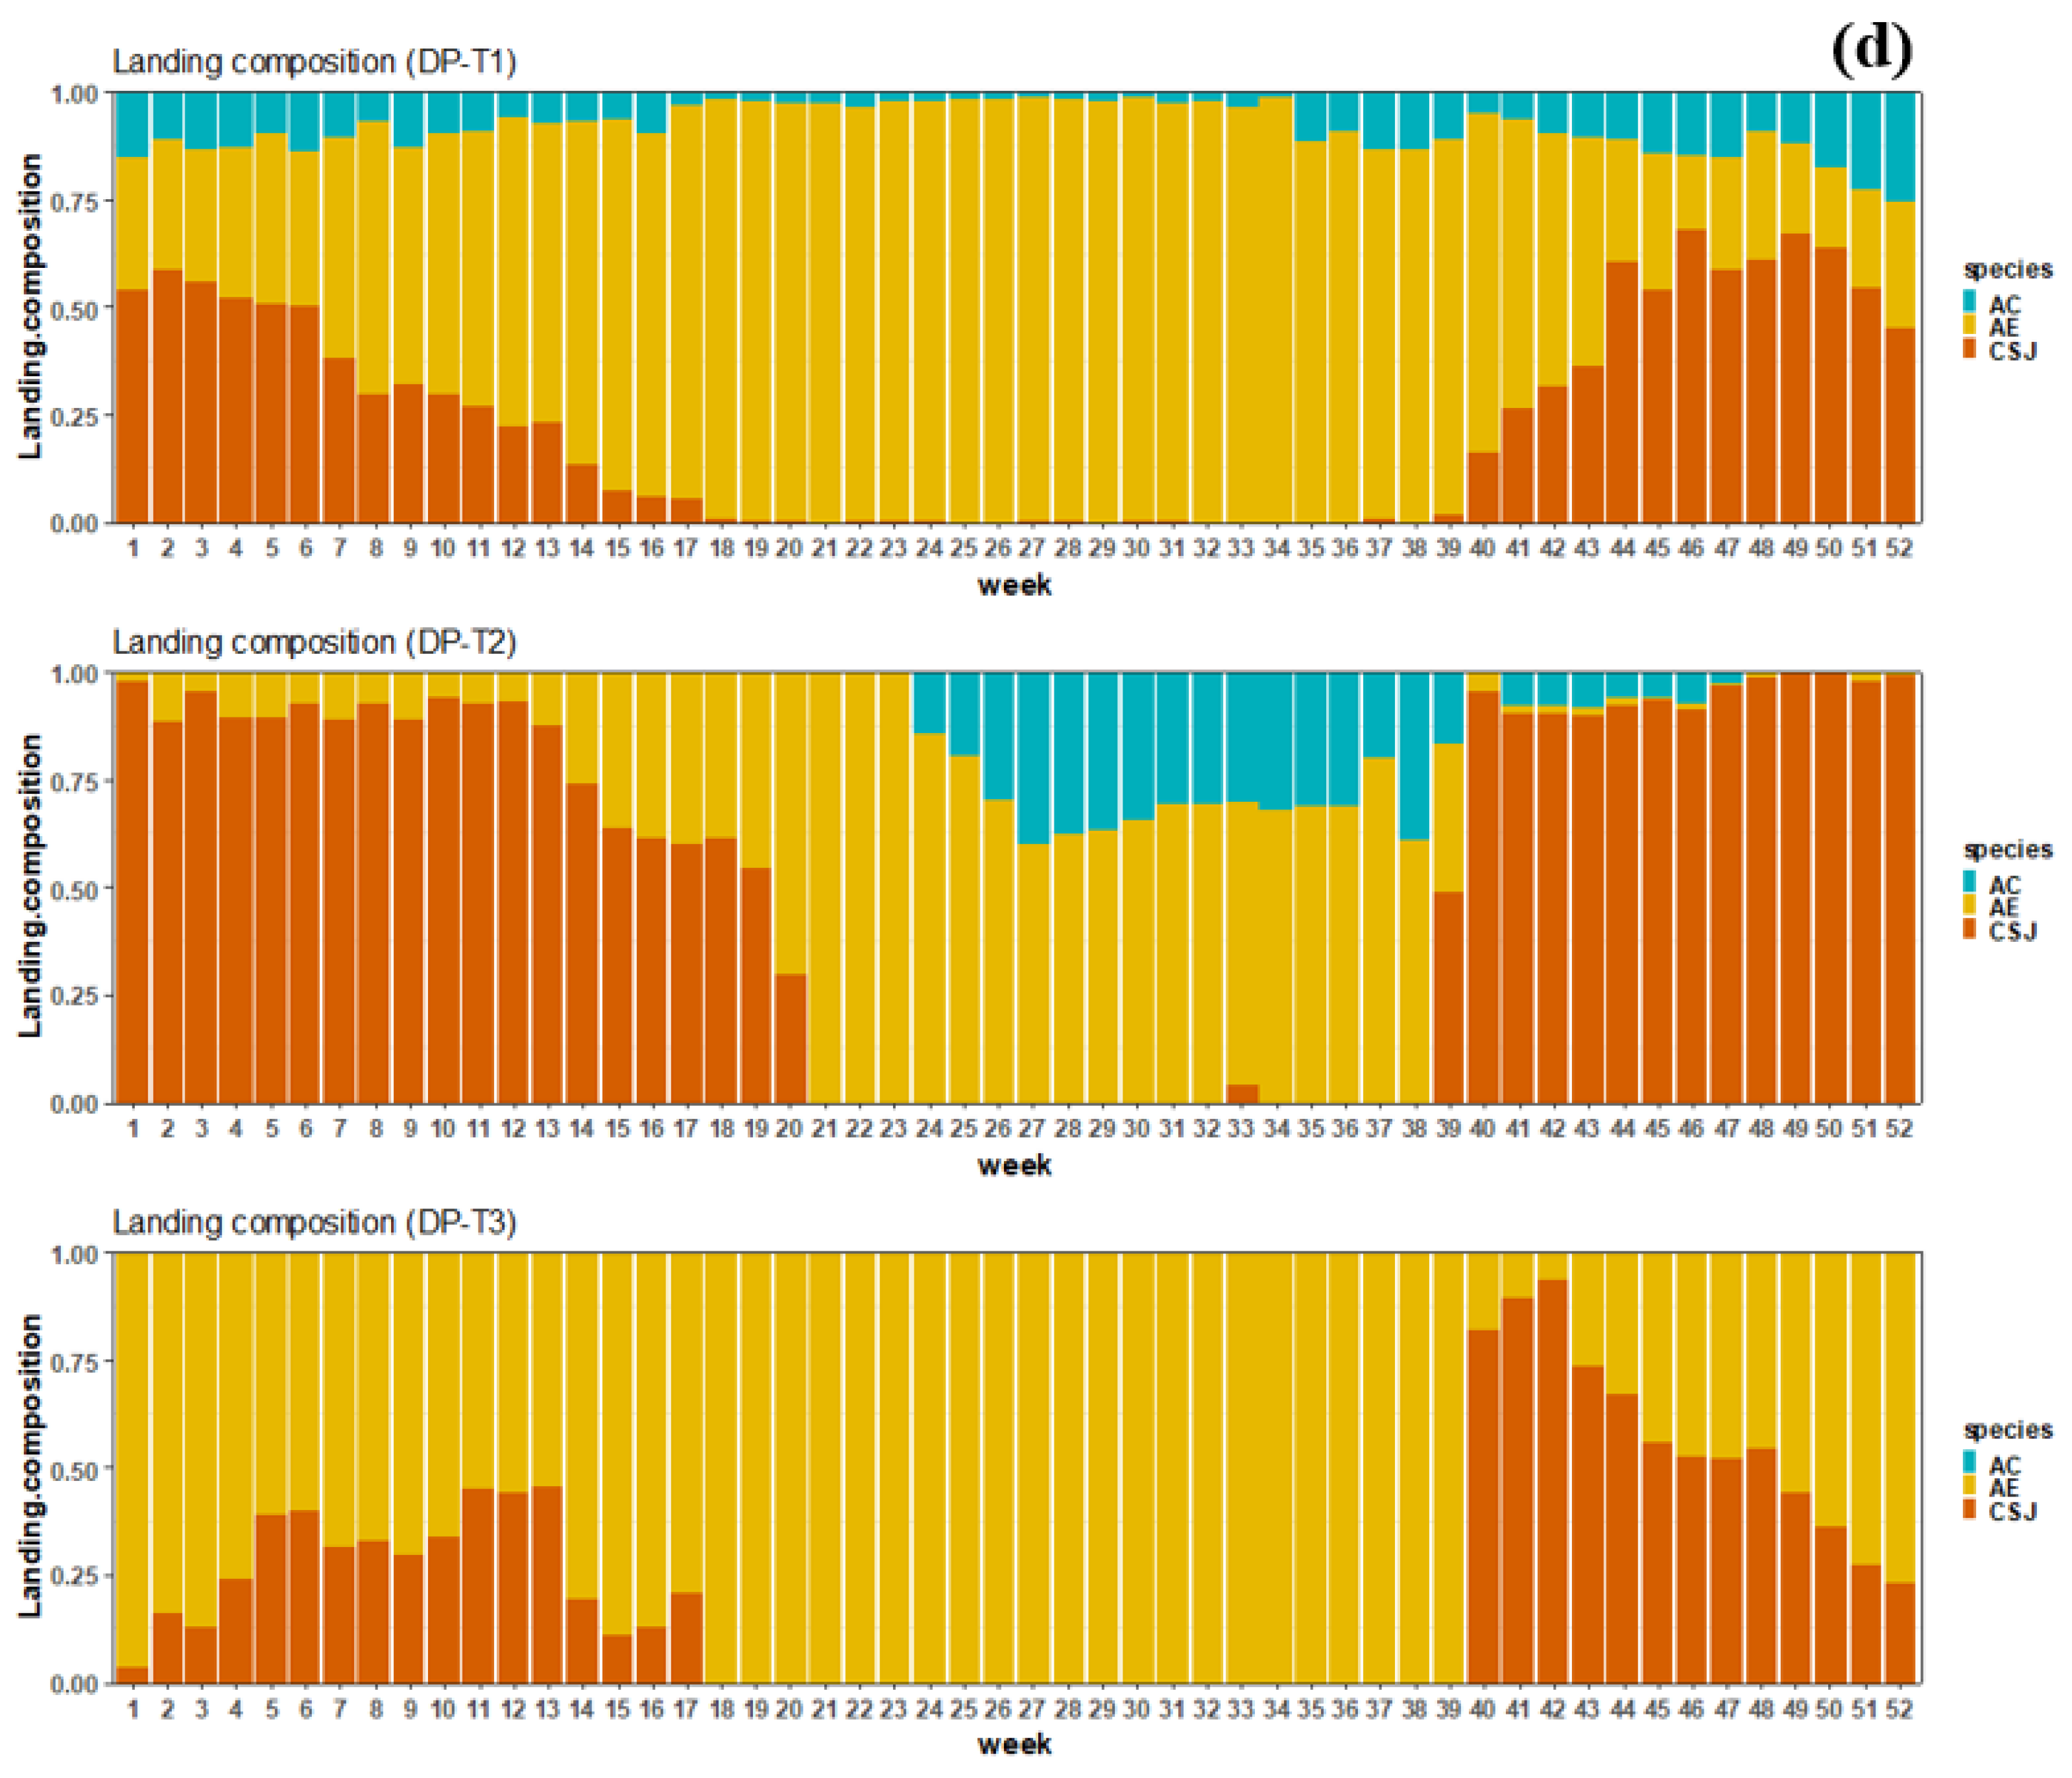
3.1. Characterisation of Scallop Fishing Activity in the English Channel

Scallop fishing vessels are structured in four categories according to their fishing techniques and target species: Trawlers–Dredgers, Trawlers using passive gears, Exclusive Dredgers, and Polyvalent Dredgers. The majority of vessels belong to the categories of Trawlers–Dredgers and polyvalent Dredgers. In terms of vessel length, the class of vessels <15 m contains the largest number of vessels for all categories (more than 70%).
The analysis of the scallop landings shows that the Trawlers–Dredgers represent the category that contributes the most to the total production of scallops, followed by Exclusive Dredgers, Polyvalent Dredgers, and then Trawlers using passive gears (Figure 4). For all vessels, the category of vessels <15 m seems to be the most important in terms of scallop landings. Vessels >16 m of the category of Trawlers using passive gears are not represented. This category does not target scallops, but rather targets other species.
Figure 5 details the landings composition (in value) of each fleet category. It highlights the seasonal patterns of scallop fishing activity as well as the variability in the level of polyvalence between fleet categories. The weekly evolution of the interannual average landings shows that fishing vessels are polyvalent, which means that they catch other species in addition to scallops. Fishing landings consist of various species including shellfish (scallops, white scallops, dog cockles, mussels, brown shrimps, and crawfish), flatfish (common sole, turbot, and European plaice), crabs (European spider crab and edible crab), common cuttlefish, Atlantic mackerel, red mullet, and some species of ray fish. The contribution of each species to the total landings depends on the fleet category and varies according to the fishing seasons. During scallop fishing season, from weeks 1 to 20 and the weeks 40 to 52, the fleet category of dredgers is the most dependent on scallop landings (98%), in particular, the Exclusive Dredgers >15 m (DE-T2 and DE-T3) and the Polyvalent Dredgers DP-T2. For the Trawlers, the most dependent categories to scallop landings are vessels <16 m (CD-T1 and CD-T2). Trawlers using passive gears are the least dependent on scallop landings; these vessels target mostly other species than shellfish. When the scallop fishing season is closed (from May to September), all vessels target other species. Exclusive Dredgers mainly target shellfish, in particular white scallops and dog cockles, while the other fleet categories catch other species such as the common sole and the common cuttlefish.

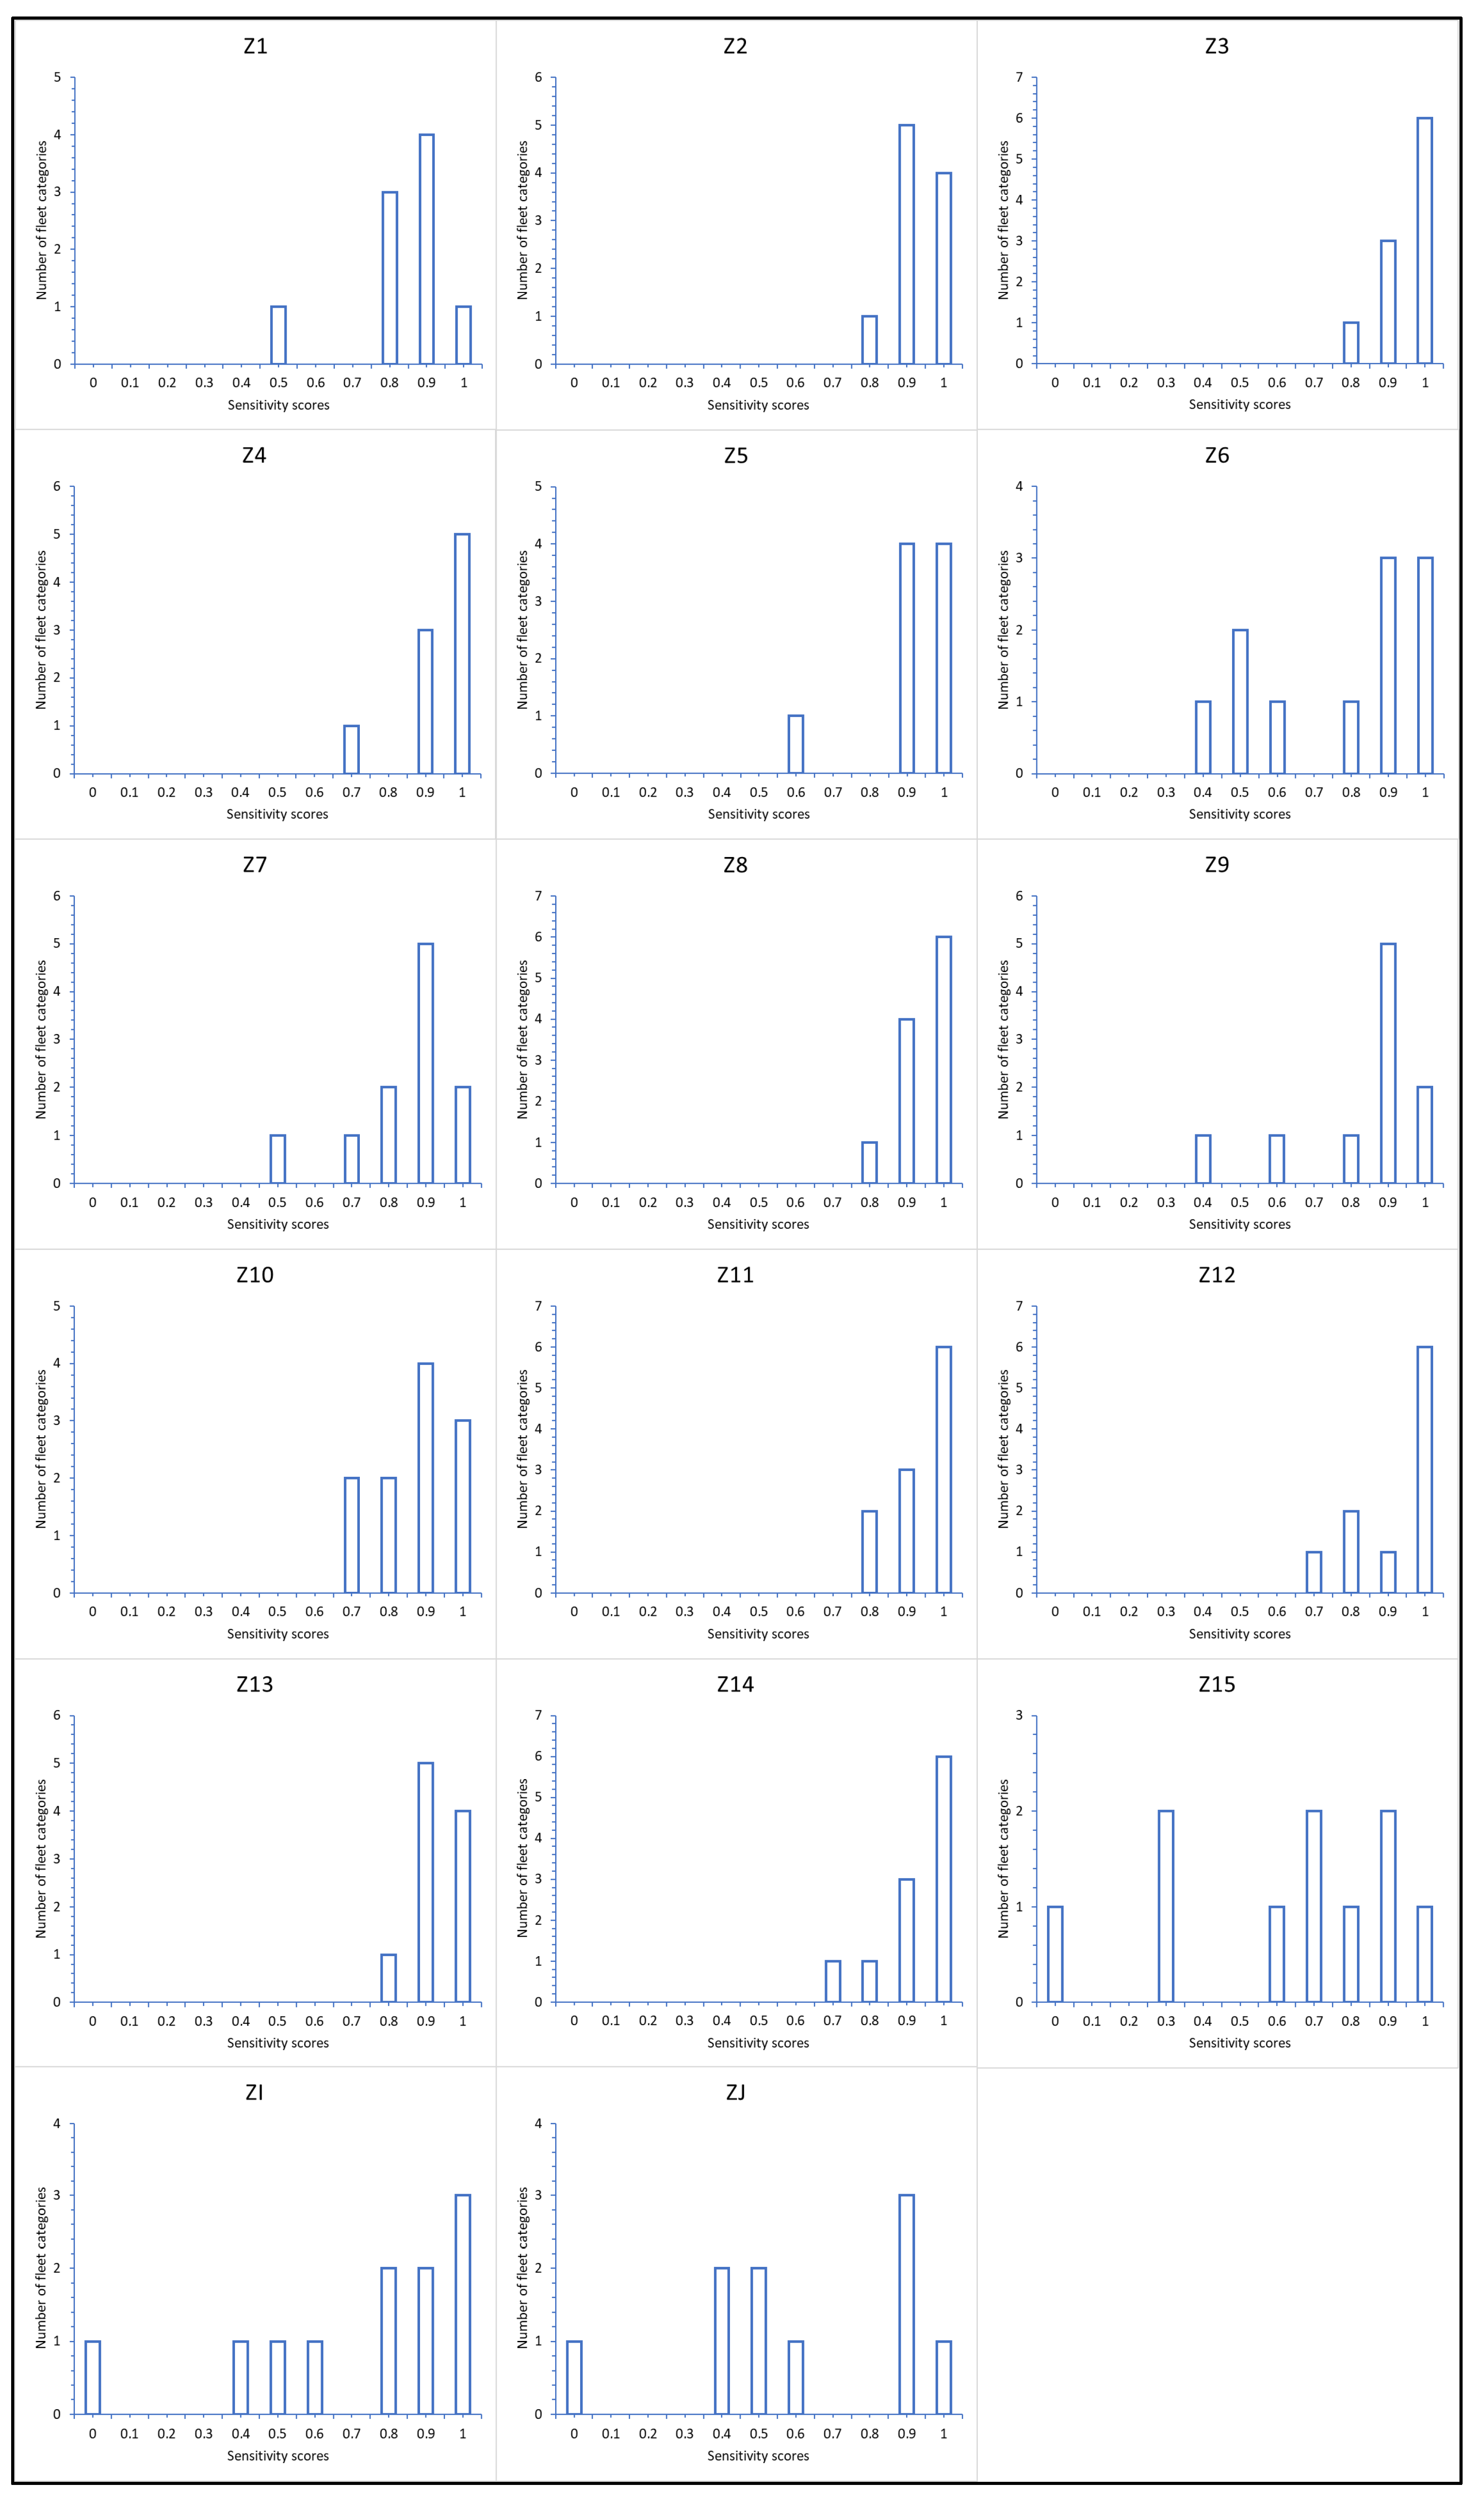
3.2. Exposure of Scallop Fisheries to HAB-Related Closures

Table 4 presents the exposure scores for each fishing zone and fishing season. As shown in this table, the analysis of spatial trends of the exposure indicator highlighted that fishing zone 9 represents a high-risk zone because it shows a high level of exposure (exposure indicator = 1) over a long period: during the entire 2012–2013, 2013–2014, and 2018–2019 fishing seasons as well as several weeks in the 2014–2015 season. Results show that zones 1, 2, 3, 4, and 5 representing the Bay of Seine have never been closed, this is why they shows the lowest score of exposure. This is due to many reasons: on one hand, it could be explained by the dynamics of HAB events and the environmental, biological, and ecological aspects, and on the other hand, it is related to the specific management measures implemented in the Bay of Seine. In fact, the scallop fishing season in the Bay of Seine is particularly short compared to the other fishing areas. It is generally opened later in November/December and closed in February/March. We can assume then that the period of high toxicities and contamination of scallops coincides with the period of closure of the fishing season (before the opening of the season or after its closure). This means that although the scallops are contaminated, there are no toxicity tests conducted to confirm or monitor the contamination, as samples are not carried out when the fishing season is closed (no fishing activity, so no risk for the consumer’s health).
The analysis of temporal evolution of the exposure indicator showed that scores are particularly high at the beginning of the fishing season (from October to December). The high level of exposure over the 2012–2013 and 2013–2014 fishing seasons especially in zone 9, 12, and 13 is related to the long closures due to episodes of toxins causing ASP. Starting from the season 2014–2015, closures are due to episodes of toxins causing DSP. The 2014–2015 and 2018–2019 seasons are characterized by a high level of exposure and large spatial trends (all areas out of the Bay of Seine were concerned by HAB-related closures).

3.3. Sensitivity of Fishers upon the Scalop Fishing Activity

The sensitivity indicator of fishing fleets to the risk of HAB-related closures revealed that all the studied fleet categories are highly dependent on scallop fishing. The analysis of the dependency of fleet categories to scallop production and thus their sensitivity to fishing zones closures showed that fishing fleets are highly sensitive. Sensitivity scores varied between 0.5 and 1 for the majority of categories (Figure 6). Data on Trawlers using passive gears >15 m and Polyvalent Dredgers >16 m were excluded from the data analysis because they contain a lot of missing data. These categories do not appear to rely on scallop fishing activity.
Spatial and temporal variability of the sensitivity indicator among fleet categories has been observed. As shown in Figure 6, fishing fleets are highly dependent on the Bay of Seine, especially zones 2, 3, and 4, over all fishing seasons. The dependency scores for the other areas vary depending on fishing seasons and fleet categories. Trawlers–Dredgers <15 m, Exclusive Dredgers >15 m and Polyvalent Dredgers <16 m seemed to be less dependent on zone 1 during the 2017–2018 fishing season. The calculated standard deviation showed a significant variation in sensitivity levels among the different fleet categories in zones 1, 6, 15, I and J. This indicates that these areas are not equally frequented by fishing fleets. The selection and choice of fishing zones is influenced by various factors, including technical characteristics, and environmental and economic conditions, as well as the traditional knowledge and experience of fishermen. The analysis of the spatial distribution of scallop fishing fleets highlighted that the Bay of Seine is the most productive and frequented zone. Fishing vessels are concentrated in this zone in the beginning of the fishing season from November to February/March, then they move to the other zones when the Bay of Seine is closed. This explains the fact that sensitivity levels are relatively high in all areas when data are aggregated by fishing season. This data aggregation by season is due to the lack of more detailed data to calculate the exposure indicator (data on fishing areas closures are only available at the fishing season time scale).

3.4. Adaptive Capacity Analysis

Results showed that the adaptive capacity of scallop fishing fleets is relatively high. All fleet categories indicate an adaptive capacity level above 0.7. The analysis of variability between fleet categories did not reveal significant disparities. This is related to the fact that scallop fishing vessels are able to shift to other fishing grounds and compensate their incomes by other species especially during the summer period. It is also related to the aggregation method of the adaptive capacity indicator (maximum value). The structure of vessels population including its composition, characteristics, and regional distribution can significantly influence the level and the pattern of adaptive capacity. Therefore, an analysis was conducted to assess the uniformity of fleet categories in terms of adaptive capacity, focusing on the regional distribution of the studied fleet categories by homeport. The results, presented in Table 5, show that the structure of the fishing fleet population varies across areas. For instance, fleets from the Bay of Seine (generally from the ports of the maritime district of Caen and Cherbourg) primarily consist of small-scale vessels (<16 m), whereas larger-scale vessels (>16 m) are mainly from the maritime district of Dieppe and Fécamp. This distribution highlights the particularity of scallop fishing in the English Chanel in terms of response to HAB events, including socioeconomic aspects, as well as the regulation and management of the activity.

3.5. Vulnerability Analysis

Results of the vulnerability scores showed that vulnerability levels vary across the different fleet categories. Spatial and temporal variabilities have also been highlighted. The highest vulnerability was observed for Trawlers–Dredgers >15 m, all Exclusive Dredgers, and small-scale Polyvalent Dredgers <16 m, especially in zone 9 during the 2012–2013, 2013–2014, and 2018–2019 fishing seasons. This highest vulnerability corresponds to the high level of exposure and sensitivity. The vulnerability of small-scale Trawlers–Dredgers (<15 m) is moderate even for highest levels of exposure and sensitivity in zone 9 during hot-spot seasons. This is related to their high level of adaptive capacity. On the other hand, the low exposure over the Bay of Seine zones plays a key role in the vulnerability patterns due to its high importance for fishing fleets especially small-scale vessels of Normandy and their high dependency on this area. High and moderate vulnerability have been observed in many zones including zones 13, 14, 15, I, and J.
The vulnerability, once calculated and assessed, is made available to stakeholders in a simple, operational way through a web server. It is accessible for each fishing season, area, and fleet segment. This tool provides a user-friendly interface that enables stakeholders to visualise vulnerability and its components quickly and easily, and aids in evaluating the impacts related to closures of fishing areas due to marine phycotoxin contaminations. Compared to an existing system that only considers a global and homogeneous impact on the entire fishery, this tool helps us to better understand the distribution of these impacts within a heterogeneous fishing fleet, and to define potential actions to be implemented to support the most vulnerable vessels. The developed application for the dynamic visualization of vulnerability and its components maps are accessible at: https://scallop-fishing-indicators.ifremer.fr/ (accessed on 28 May 2023). An overview of the application is presented in Figure 7.

4. Discussion and Conclusions

The dynamics of HABs induces the exposure of the scallop fishing fleet to HAB-related closures. Closures are a consequence of management measures to reduce HAB risks on human health. As a mobile spatial activity, the scallop fishing fleet will then face a certain variability regarding exposure trend. The duration and location of closures significantly influence the level of impact. The analysis of the spatial and temporal trends of the exposure indicator allowed us to determine high-risk zones and periods. It highlighted that the coincidence of a high level of exposure in the beginning of the fishing season and the large trend of closures could have a significant impact on fishing activity because it is the period of high production of scallops. In terms of spatial distribution of the resulting exposure indicator, the analysis showed that the Bay of Seine, the most productive area for scallops, has never been closed due to toxic HAB events. Considering the impact of global changes on the dynamics of HABs, especially the toxic events, closures in the Bay of Seine could have a significant impact on scallop-fishing activity and modify the patterns of their vulnerability.
In terms of fleet segments, exposure is similar for all categories, according to their fishing grounds. The variability of vulnerability is related to the socioeconomic characteristics of each fleet segment, including their sensitivity and adaptive capacity. Sensitivity levels of fishers are relatively high for all fleet categories. Therefore, vulnerability pattern is mainly influenced by the adaptive capacity. Fishing vessels operating in the Bay of Seine and in zones called “proche exterieur” (Figure 1) in particular zones 9 as well as the zone 12 are polyvalent and have a thriving market for their catches due to the high demand for scallops. On the other hand, fishing vessels of Boulogne-Sur-Mer are less polyvalent and they do not have a large market. Tools including equipment, fishing techniques, and infrastructure varies according to each fishing port. Some ports such as the port of Port-en-Bessin may have competitive advantages in terms of catches valorization (ability to obtain higher price or better demand, “fishing in their garden”), which can affect opportunities for fishermen operating in these zones. The ports infrastructure and the market structure have therefore a key role for the adaptive capacity of fishers. Fishing vessels in the Bay of Seine are very structured and the area is highly protected through many regulations and restrictions. However, the ports in this area have many facilities and infrastructures to support fishermen. Areas out of the Bay of Seine, in particular the eastern zones, are bigger than the Bay of Seine, and ports are less structured and do not benefit from the same social cohesion. As a result, fishing vessels are able to move and change their fishing ground easily. All these factors explain the relative high level of adaptive capacity of scallop fishing vessels from the Bay of Seine.
The spatial and temporal analysis of the vulnerability of scallop fishers faced with HAB-related area closures allowed us to analyse both HAB events consequences in terms of management actions (closures), and fishing communities’ characteristics (sensitivity) and responses in terms of adaptive capacity. The construction of vulnerability indicators makes it possible to describe qualitatively how fishermen are impacted by HAB events, taking into account both spatial and temporal dimensions. Their perception of the associated risk varies significantly based on fishing techniques, strategies, and capacity to adapt to HAB-related closures, while considering economic resilience. The differentiation between more and less polyvalent fleet categories refines the dynamics of fishermen’s responses to HAB shocks and, consequently, their vulnerability. The analysis results enable a focus on the most vulnerable segments, while other segments are capable of internalizing and smoothing the impacts of HABs over the entire season, through market adjustment effects and spatial and technical polyvalence. This approach also provides a historical analysis of past events, which allows for a more proactive response to potential crises. In fact, while the monitoring data on HABs and their toxins are centralized and recorded, collecting specific data on fishing grounds closures remains challenging. Currently, there is no consolidated database or system gathering all these historical data, which led to a loss of memory regarding past events and their associated crises. Nonetheless, this temporal and spatial analysis over seven fishing seasons (from 2012 to 2019) provides a better understanding of the associated impacts and highlights the periods and areas where fishing fleets are most susceptible to adverse consequences.
Such an approach proves more operational than the commonly found monetary assessments that focus on lost income or profits [23,53]. Monetary impact assessments quantify the magnitude of the pressure, but do not provide sufficient information on the necessary actions for effective management. On the other hand, vulnerability indicators, allow for the characterisation of each fisherman’s activity during specific periods. This provides valuable insights on changes in activity over time or space, which can be mobilized to prevent or mitigate the economic impacts associated with HABs. These actions can be used for decision making at both the individual and collective level. At an individual level, fishermen can make informed choices based on business strategies, such as adjusting activity programming or changing target species. On a collective level, actions can be taken to collectively manage the impacts, such as redistributing fishing effort to prevent local overexploitation when fishing zones are closed. In this context, the division of the fishing area in the eastern English Channel into small zones and the establishment of scallop fishing zones, referred to as the current “sanitary zones” (Figure 1), represents the initial planning action of the French management system in response to the HAB toxicities crisis in 2012. The primary objective of this measure is to implement partial closures rather than a complete ban of the entire area. This progressive approach has facilitated crisis management and enabled fishermen to develop coping strategies during toxicity episodes by continuing their fishing operations in non-closed areas. However, further reflections and efforts are necessary to adapt to this restructured management system, especially in terms of supporting fishermen in their adaptation to access restrictions of fishing zones. Potential compensation and mitigation measures for the associated impacts could be considered, including allocating quotas or additional fishing days to the most vulnerable fishermen, or providing financial support to offset losses or costs related to closures, such as expenses incurred when shifting to alternative fishing grounds. Investing in the renovation and modernisation of fishing vessels, (investing in vessels that consume less energy), is another proposal for improving the resilience of fishermen.
Furthermore, the vulnerability approach provides a new perspective for understanding the consequences of HABs in terms of governance, particularly in promoting proactive measures rather than relying solely on reactive approaches such as bans and fishing area closures. However, the present approach has limitations regarding the processing of the exposure component. Closure data are not consistently and centrally archived, and there can be a time lag between data collection and availability. As a result, vulnerability calculations are based on aggregated data by fishing season, while the proposed vulnerability tool is designed to operate in real time, continuously updating the vulnerability indicator for each event leading to a closure. Real-time monitoring of HAB impacts has long been a challenge due to delays associated with in situ sampling and analysis [15]. However, advancements in remote sensing, particularly through the use of Sentinel 3 Ocean and Land Colour Instrument (OLCI) satellites, have enabled the development of online early warning systems that provide timely information within a few hours of satellite image acquisition. The S-3 EUROHAB portal (www.s3eurohab.eu/portal) accessed on 15 March 2023, operating in the Channel area and funded under the French-Channel-English Interreg programme, is an example of such an early warning system. While these systems provide probabilities of harmful algal bloom occurrences, they do not directly assess toxicity risks that could lead to closures. Progress is being made in addressing this limitation, and as soon as toxicity risks associated with blooms can be translated into closure risks for specific species, the vulnerability indicator can be processed in a more dynamic manner. In this logic of dynamic vulnerability index, this study has demonstrated the capacity to provide and present vulnerability index on a weekly time scale. This temporal resolution aligns better with the available in situ monitoring data on HAB-related scallops’ toxicity (weekly toxicity results), and it is well suited to fishing activity based on weekly quotas. Furthermore, it addresses management needs by delivering more timely information. Although this paper does not present the results of the weekly indicators due to data limitations, it illustrates the value of prioritising more detailed time scales to comprehend the dynamics of the vulnerability index.

Author Contributions

Conceptualization, S.C. and J.A.P.A.; methodology, S.C.; software, S.C.; validation, S.C., J.A.P.A. and P.R.; formal analysis, S.C.; investigation, S.C.; data curation, S.C.; writing—original draft preparation, S.C.; writing—review and editing, S.C., P.R. and J.A.P.A.; visualization, S.C.; project administration, S.C., J.A.P.A. and P.R. All authors have read and agreed to the published version of the manuscript.

Funding

This research was conducted as part of the S-3 EUROHAB project (Sentinel-3 products for detecting EUtROphication and Harmful Algal Bloom events), which received funding from the European Regional Development Fund under the INTERREG France-Channel-England (Project Number 106).

Institutional Review Board Statement

Not applicable.

Informed Consent Statement

Not applicable.

Data Availability Statement

Data on indicators of vulnerability and its components are available in INDIGEO portal at https://doi.org/10.35110/c12ca075-e2aa-41b9-962c-99111897b86e (accessed on 10 June 2023) and the visualization application is accessible at https://scallop-fishing-indicators.ifremer.fr/ (accessed on 28 May 2023).

Acknowledgments

The authors gratefully acknowledge the financial support provided by S3-EUROHAB project for this research and the technical support of INDIGEO and Ifremer.

Conflicts of Interest

The authors declare no conflict of interest.

References

  1. Gascuel, D. L’approche écosystémique des pêches, une condition pour l’exploitation durable des océans. Pour 2009, 202–203, 199–206. [Google Scholar] [CrossRef]
  2. Guillotreau, P. Mare Economicum: Enjeux et Avenir de la France Maritime et Littorale, 2nd ed.; Presses Universitaires de Rennes: Rennes, France, 2018; p. 556. [Google Scholar]
  3. Berdalet, E.; Fleming, L.E.; Gowen, R.; Davidson, K.; Hess, P.; Backer, L.C.; Moore, S.K.; Hoagland, P.; Enevoldsen, H. Marine harmful algal blooms, human health and wellbeing: Challenges and opportunities in the 21st century. J. Mar. Biol. Assoc. UK 2016, 96, 61–91. [Google Scholar] [CrossRef] [PubMed]
  4. Babin, M.; Cullen, J.; Roesler, C.; Donaghay, P.; Doucette, G.; Kahru, M.; Lewis, M.; Scholin, C.; Sieracki, M.; Sosik, H. New Approaches and Technologies for Observing Harmful Algal Blooms. Oceanog 2005, 18, 210–227. [Google Scholar] [CrossRef] [Green Version]
  5. Shen, L.; Xu, H.; Guo, X. Satellite Remote Sensing of Harmful Algal Blooms (HABs) and a Potential Synthesized Framework. Sensors 2012, 12, 7778–7803. [Google Scholar] [CrossRef] [Green Version]
  6. Hernández-Fariñas, T.; Soudant, D.; Barillé, L.; Belin, C.; Lefebvre, A.; Bacher, C. Temporal changes in the phytoplankton community along the French coast of the eastern English Channel and the southern Bight of the North Sea. ICES J. Mar. Sci. 2014, 71, 821–833. [Google Scholar] [CrossRef] [Green Version]
  7. Ritzman, J.; Brodbeck, A.; Brostrom, S.; McGrew, S.; Dreyer, S.; Klinger, T.; Moore, S.K. Economic and sociocultural impacts of fisheries closures in two fishing-dependent communities following the massive 2015 U.S. West Coast harmful algal bloom. Harmful Algae 2018, 80, 35–45. [Google Scholar] [CrossRef]
  8. Moore, K.M.; Allison, E.H.; Dreyer, S.J.; Ekstrom, J.A.; Jardine, S.L.; Klinger, T.; Moore, S.K.; Norman, K.C. Harmful Algal Blooms: Identifying Effective Adaptive Actions Used in Fishery-Dependent Communities in Response to a Protracted Event. Front. Mar. Sci. 2020, 6, 803. [Google Scholar] [CrossRef]
  9. Anderson, D.M. Approaches to monitoring, control and management of harmful algal blooms (HABs). Ocean Coast Manag. 2009, 52, 342. [Google Scholar] [CrossRef] [Green Version]
  10. Beckler, J.S.; Arutunian, E.; Moore, T.; Currier, B.; Milbrandt, E.; Duncan, S. Coastal Harmful Algae Bloom Monitoring via a Sustainable, Sail-Powered Mobile Platform. Front. Mar. Sci. 2019, 6, 587. [Google Scholar] [CrossRef] [Green Version]
  11. Brown, A.R.; Lilley, M.; Shutler, J.; Lowe, C.; Artioli, Y.; Torres, R.; Berdalet, E.; Tyler, C.R. Assessing risks and mitigating impacts of harmful algal blooms on mariculture and marine fisheries. Rev. Aquac. 2020, 12, 1663–1688. [Google Scholar] [CrossRef] [Green Version]
  12. Davidson, K.; Whyte, C.; Aleynik, D.; Dale, A.; Gontarek, S.; Kurekin, A.A.; McNeill, S.; Miller, P.I.; Porter, M.; Saxon, R.; et al. HABreports: Online Early Warning of Harmful Algal and Biotoxin Risk for the Scottish Shellfish and Finfish Aquaculture Industries. Front. Mar. Sci. 2021, 8, 19. [Google Scholar] [CrossRef]
  13. Kudela, R.M.; Bickel, A.; Carter, M.L.; Howard, M.D.A.; Rosenfeld, L. Chapter 5—The Monitoring of Harmful Algal Blooms through Ocean Observing: The Development of the California Harmful Algal Bloom Monitoring and Alert Program. In Coastal Ocean Observing Systems; Liu, Y., Kerkering, H., Weisberg, R.H., Eds.; Academic Press: Cambridge, MA, USA, 2015; pp. 58–75. [Google Scholar] [CrossRef]
  14. Ekstrom, J.A.; Moore, S.K.; Klinger, T. Examining harmful algal blooms through a disaster risk management lens: A case study of the 2015 U.S. West Coast domoic acid event. Harmful Algae 2020, 94, 101740. [Google Scholar] [CrossRef] [PubMed]
  15. Pérez Agúndez, J.A.; Chenouf, S.; Raux, P. Addressing the Governance of Harmful Algal Bloom Impacts: A Case Study of the Scallop Fishery in the Eastern French Coasts of the English Channel. J. Mar. Sci. Eng. 2022, 10, 948. [Google Scholar] [CrossRef]
  16. Hallegraeff, G.M.; Anderson, D.M.; Cembella, A.D.; Enevoldsen, H.O. Manual on Harmful Marine Microalgae; UNESCO: Paris, France, 2003; p. 793. [Google Scholar]
  17. Moore, S.K.; Dreyer, S.J.; Ekstrom, J.A.; Moore, K.; Norman, K.; Klinger, T.; Allison, E.H.; Jardine, S.L. Harmful algal blooms and coastal communities: Socioeconomic impacts and actions taken to cope with the 2015 U.S. West Coast domoic acid event. Harmful Algae 2020, 96, 101799. [Google Scholar] [CrossRef] [PubMed]
  18. Willis, C.; Papathanasopoulou, E.; Russel, D.; Artioli, Y. Harmful algal blooms: The impacts on cultural ecosystem services and human well-being in a case study setting, Cornwall, UK. Mar. Policy 2018, 97, 232–238. [Google Scholar] [CrossRef]
  19. Silva, A.; Pinto, L.; Rodrigues, S.; de Pablo, H.; Santos, M.; Moita, T.; Mateus, M. A HAB warning system for shellfish harvesting in Portugal. Harmful Algae 2016, 53, 33–39. [Google Scholar] [CrossRef]
  20. van den Bergh, J.C.J.M.; Nunes, P.A.L.D.; Dotinga, H.M.; Kooistra, W.H.C.F.; Vrieling, E.G.; Peperzak, L. Exotic harmful algae in marine ecosystems: An integrated biological–economic–legal analysis of impacts and policies. Mar. Policy 2002, 26, 59–74. [Google Scholar] [CrossRef]
  21. Lewitus, A.J.; Horner, R.A.; Caron, D.A.; Garcia-Mendoza, E.; Hickey, B.M.; Hunter, M.; Huppert, D.D.; Kudela, R.M.; Langlois, G.W.; Largier, J.L.; et al. Harmful algal blooms along the North American west coast region: History, trends, causes, and impacts. Harmful Algae 2012, 19, 133–159. [Google Scholar] [CrossRef] [Green Version]
  22. Anderson, D.M.; Hoagland, P.; Kaoru, Y.; White, A.W. Estimated Annual Economic Impacts from Harmful algal Blooms (HABs) in the United States; Woods Hole Oceanographic Institution: Woods Hole, MA, USA, 2000; p. 97. [Google Scholar] [CrossRef] [Green Version]
  23. Hoagland, P.; Scatasta, S. The Economic Effects of Harmful Algal Blooms. In Ecology of Harmful Algae; Granéli, E., Turner, J.T., Eds.; Springer: Berlin/Heidelberg, Germany, 2006; Volume 189, pp. 391–402. [Google Scholar] [CrossRef]
  24. Pettersson, L.H.; Pozdnyakov, D. Monitoring of Harmful Algal Blooms, 1st ed.; Springer: Berlin/Heidelberg, Germany, 2013; p. 309. [Google Scholar] [CrossRef]
  25. Belin, C.; Soudant, D. Trente Années D’observation des Micro-Algues et des Toxines D’algues sur le Littoral; Editions Quae: Paris, France, 2018; p. 258. [Google Scholar]
  26. Foucher, E. Evaluation Annuelle du Stock de Coquilles Saint-Jacques de la Baie de Seine: Résultats de la Campagne COMOR 43 (3 au 24 juillet 2013); Ifremer: Brest, France, 2013; pp. 1–17. [Google Scholar] [CrossRef]
  27. Moore, S.K.; Cline, M.R.; Blair, K.; Klinger, T.; Varney, A.; Norman, K. An index of fisheries closures due to harmful algal blooms and a framework for identifying vulnerable fishing communities on the U.S. West Coast. Mar. Policy 2019, 110, 103543. [Google Scholar] [CrossRef]
  28. Backer, L.C.; McGillicuddy, D.J. Harmful Algal Blooms: At the Interface between Coastal Oceanography and Human Health. Oceanography 2006, 19, 94–106. [Google Scholar] [CrossRef]
  29. Kouakou, C.R.C.; Poder, T.G. Economic impact of harmful algal blooms on human health: A systematic review. J. Water Health 2019, 17, 499–516. [Google Scholar] [CrossRef] [PubMed] [Green Version]
  30. Thywissen, K. Components of Risk: A Comparative Glossary; United Nations University Institute for Environment and Human Security: Bonn, Germany, 2006; pp. 7–46. [Google Scholar]
  31. Martin, C.S.; Carpentier, A.; Vaz, S.; Coppin, F.; Curet, L.; Dauvin, J.-C.; Delavenne, J.; Dewarumez, J.-M.; Dupuis, L.; Engelhard, G.; et al. Channel Habitat Atlas for marine Resource Management, Final Report—CHARM Phase II. INTERREG 3a Programme; Ifremer: Brest, France, 2009; pp. 1–626. [Google Scholar]
  32. Le Goff, C.; Lavaud, R.; Cugier, P.; Jean, F.; Flye-Sainte-Marie, J.; Foucher, E.; Desroy, N.; Fifas, S.; Foveau, A. A coupled biophysical model for the distribution of the great scallop Pecten maximus in the English Channel. J. Mar. Syst. 2017, 167, 55–67. [Google Scholar] [CrossRef] [Green Version]
  33. Foucher, E.; Biseau, A.; Berthou, P.; Fifas, S.; Forest, A.; Vigneau, J. Eléments D’information sur la Coquille Saint-Jacques en Baie de Seine et L’éventualité de la Mise en Place d’une Zone de Restriction Spéciale; Ifremer: Brest, France, 2010; p. 23. [Google Scholar]
  34. Berthou, P.; Guyader, O.; Leblond, E.; Demaneche, S.; Daures, F.; Merrien, C.; Lespagnol, P. From Fleet Census to Sampling Schemes: An Original Collection of Data on Fishing Activity for the Assessment of the French Fisheries; Ifremer: Brest, France, 2008; p. 17. [Google Scholar]
  35. European Commission. Scientific, Technical and Economic Committee for Fisheries (STECF)—The 2021 Annual Economic Report on the EU Fishing Fleet (STECF 21-08); Publications Office of the European Uninion: Luxembourg, 2021; p. 532. [CrossRef]
  36. JORF. Arrêté du 10 août 2018 Portant Approbation d’une Délibération du Comité National des Pêches Maritimes et des Élevages Marins Relative aux Conditions D’exercice de la Pêche à la Coquille Saint-Jacques. Acte N° 0191 du 21/08/2018, 21 August 2018; p. 9. Available online: https://www.legifrance.gouv.fr/loda/id/JORFTEXT000037320597 (accessed on 10 May 2023).
  37. Cardona, O.D.; Van Aalst, M.K.; Birkmann, J.; Fordham, M.; Mc Gregor, G.; Rosa, P.; Pulwarty, R.S.; Schipper, E.L.F.; Sinh, B.T.; Décamps, H. Determinants of Risk: Exposure and Vulnerability. In Managing the Risks of Extreme Events and Disasters to Advance Climate Change Adaptation; Field, C.B., Barros, V., Stocker, T.F., Dahe, Q., Eds.; Cambridge University Press: Cambridge, MA, USA, 2012; pp. 65–108. [Google Scholar] [CrossRef] [Green Version]
  38. Alexander, D. Confronting Catastrophe: New Perspectives on Natural Disasters; Oxford University Press: New York, NY, USA, 2000; p. 282. [Google Scholar]
  39. Turner, B.L., II; Kasperson, R.E.; Matson, P.A.; McCarthy, J.J.; Corell, R.W.; Christensen, L.; Eckley, N.; Kasperson, J.X.; Luers, A.; Martello, M.L.; et al. A framework for vulnerability analysis in sustainability science. Proc. Natl. Acad. Sci. USA 2003, 100, 8074–8079. [Google Scholar] [CrossRef] [PubMed]
  40. Bentirou Mathlouthi, R.; Pomade, A.; Becerra, S. Vulnérabilité(s) Environnementale(s): Perspectives Pluridisciplinaires; l’Harmattan: Paris, France, 2023; p. 614. [Google Scholar]
  41. Felbruegge, T.; von Braun, J. Is the World Becoming a More Risky Place? Trends in Disasters and Vulnerability to Them; Discussion Papers 18730; University of Bonn, Center for Development Research (ZEF): Bonn, Germany, 2002; p. 42. [Google Scholar]
  42. Biggs, R.; Vos A de Preiser, R.; Clements, H.; Maciejewski, K.; Schlüter, M. The Routledge Handbook of Research Methods for Social-Ecological Systems, 1st ed.; Routledge: London, UK, 2021; p. 526. [Google Scholar]
  43. Thiault, L.; Jupiter, S.D.; Johnson, J.E.; Cinner, J.E.; Jarvis, R.M.; Heron, S.F.; Maina, J.M.; Marshall, N.A.; Marshall, P.A.; Claudet, J. Harnessing the potential of vulnerability assessments for managing social-ecological systems. Ecol. Soc. 2021, 26, 1–22. [Google Scholar] [CrossRef]
  44. Belliveau, S.; Smit, B.; Bradshaw, B. Multiple Exposures and Dynamic Vulnerability: Evidence From the Grape Industry in the Okanagan Valley, Canada. Glob. Environ. Chang. 2006, 16, 364–378. [Google Scholar] [CrossRef]
  45. IPCC. Climate Change 2022: Impacts, Adaptation and Vulnerability; Contribution of Working Group II to the Sixth Assessment Report of the Intergovernmental Panel on Climate Change; Cambridge University Press: Cambridge, UK; New York, NY, USA, 2022; p. 3056. [Google Scholar]
  46. Basti, L.; Hégaret, H.; Shumway, S.E. Harmful Algal Blooms and Shellfish. In Harmful Algal Blooms: A Compendium Desk Reference; Shumway, S.E., Burkholder, J.A.M., Morton, S.L., Eds.; John Wiley & Sons, Ltd.: New York, NY, USA, 2018; pp. 135–190. [Google Scholar] [CrossRef]
  47. Smit, B.; Wandel, J. Adaptation, adaptive capacity and vulnerability. Glob. Environ. Chang. 2006, 16, 282–292. [Google Scholar] [CrossRef]
  48. Allison, E.H.; Perry, A.L.; Badjeck, M.-C.; Adger, W.N.; Brown, K.; Conway, D.; Halls, A.S.; Pilling, G.M.; Reynolds, J.D.; Andrew, N.L.; et al. Vulnerability of National Economies to the Impacts of Climate Change on Fisheries. Fish Fish. 2009, 10, 173–196. [Google Scholar] [CrossRef] [Green Version]
  49. Chenouf, S. Indicateurs de Sensibilité, D’exposition, de Capacité D’adaptation et de Vulnérabilité des Navires de Pêche de Coquilles Saint-Jacques en Manche-Est Face Aux Impacts des Efflorescences Algales Nuisibles (HABs); UMR6554 LETG CNRS (INDIGEO): Brest, France, 2022. [Google Scholar] [CrossRef]
  50. Chang, W.; Cheng, J.; Allaire, J.J.; Sievert, C.; Schloerke, B.; Xie, Y.; Allen, J.; McPherson, J.; Dipert, A.; Borges, B.; et al. Shiny: Web Application Framework for R. CRAN R-Packages. 2023. Available online: https://cran.r-project.org/web/packages/shiny/index.html (accessed on 8 June 2023).
  51. Chang, W.; Ribeiro, B.B. Shinydashboard: Create Dashboards with “Shiny”. CRAN R-Packages. 2021. Available online: https://cran.r-project.org/web/packages/shinydashboard/index.html (accessed on 8 June 2023).
  52. Perrier, V.; Meyer, F.; Granjon, D.; Fellows, I.; Davis, W.; Matthews, S.; JavaScript and CSS libraries authors. ShinyWidgets: Custom Inputs Widgets for Shiny. CRAN R-Packages. 2023. Available online: https://cran.r-project.org/web/packages/shinyWidgets/index.html (accessed on 8 June 2023).
  53. Adams, C.M.; Larkin, S.L. Economics of Harmful Algal Blooms: Literature Review; Food and Ressource Economics Department (FRED), Gulf of Mexico Alliance: Gainesville, FL, USA, 2013; pp. 1–32. [Google Scholar]
Figure 1. Location map of the study area (zones from 1 to J represent the scallop fishing areas. Zones 1, 2, 3, 4 and 5 are called Bay of Seine, zones 6, 7, 8, and 9 are called Proche exterieur, zones from 10 to J are called Outside the Bay of Seine or offshore zones). Note: The delimitation of the scallop fishing areas was revised in 2021, and zones from 1 to J are therefore no longer current. However, the approach and analysis in this study are still applicable to the new delimitations.
Sustainability 15 12379 g001
Figure 2. Process of the vulnerability index construction and mapping.
Sustainability 15 12379 g002
Figure 3. Vulnerability dimensions.
Sustainability 15 12379 g003
Figure 4. Scallop production (value) in the eastern English Channel by fishing vessel category. CAD: Trawlers using passive gears, CD: Trawlers–Dredgers, DE: Exclusive Dredgers, and DP: Polyvalent Dredgers; T1: <15 m, T2: between 15 m and 16 m, and T3: >16 m.
Sustainability 15 12379 g004
Figure 5. Weekly evolution of landings composition (interannual average between 2012 and 2019, all fishing zones combined) (a) Trawlers–Dredgers, (b) Trawlers using passive gears, (c) Exclusive Dredgers, and (d) Polyvalent Dredgers: CSJ = scallops; AC = other shellfish; AE = other species.
Sustainability 15 12379 g005aSustainability 15 12379 g005bSustainability 15 12379 g005c
Figure 6. Distribution of sensitivity scores according to fishing zones.
Sustainability 15 12379 g006
Figure 7. A screenshot of the interactive maps of the vulnerability indicator and its components.
Sustainability 15 12379 g007
Table 1. Active fishing fleets targeting scallops in the eastern English Channel in 2020 (236 vessels).
Fleet ClassFleet Sub-ClassVessel’s SizeMaximum Quantity/Landing *
TrawlersTrawlers–Dredgers
194 vessels (82%)
<15 m1800 kg
>15 m and <16 m2000 kg
≥16 m2200 kg
Trawlers using passive gears
3 vessels (1%)
<15 m1800 kg
>15 m and <16 m2000 kg
≥16 m2200 kg
DredgersExclusive Dredgers
30 vessels (13%)
<15 m1800 kg
>15 m and <16 m2000 kg
≥16 m2200 kg
Polyvalent Dredgers
9 vessels (4%)
<15 m1800 kg
>15 m and <16 m2000 kg
≥16 m2200 kg
* Daily quotas based on 4 fishing days per week.
Table 2. Data used to calculate sensitivity and adaptive capacity indicators.
VariableDescription
Week1 to 52.
Fishing seasonFrom 2012–2013 to 2018–2019.
Fishing fleet categoryThe fleet categories are defined as the combinations of the vessel’s length and fishing technique (fleet sub-class). There were 12 vessel categories defined for this study.
SpeciesThis variable includes 3 levels: “Scallops”, “Other shellfish”, and “Other species”.
Fishing zoneFishing zones refer to the 17 scallop fishing areas as defined in Figure 1.
QuantityFishing quantity (kg).
ValueFishing value (EUR).
Table 3. Description of the construction of indicators used to calculate the vulnerability composite index.
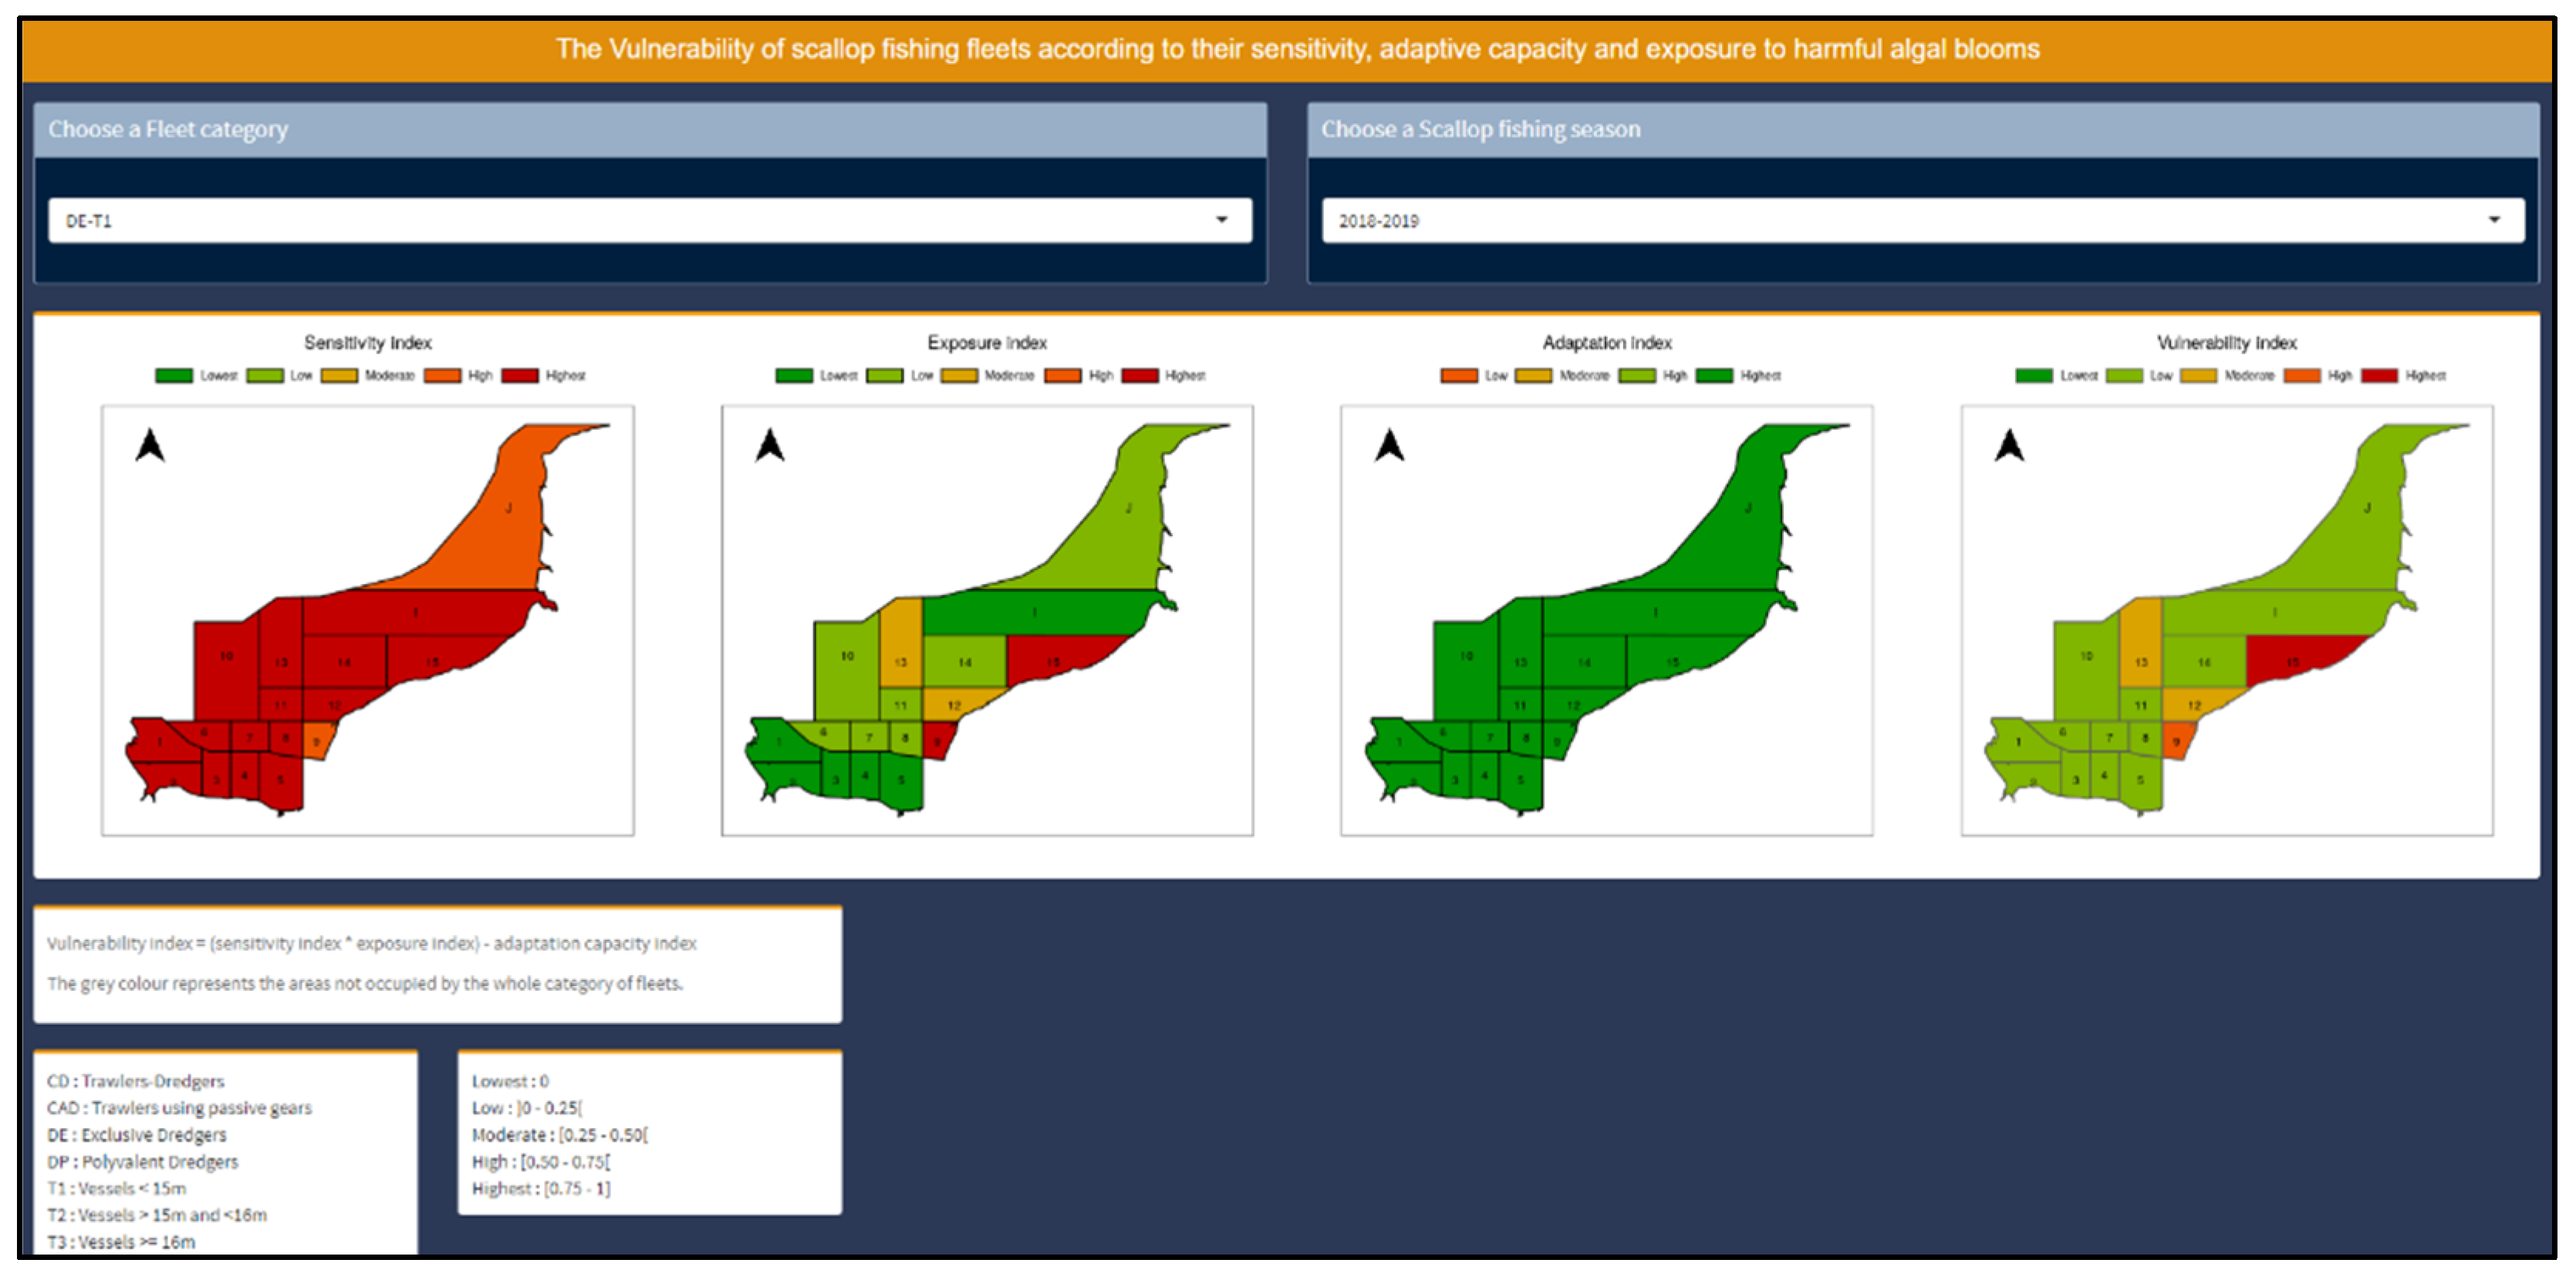
Vulnerability = (Exposure × Sensitivity) − Adaptive Capacity
DimensionsExposureSensitivityAdaptive capacity
ComponentsClosures of fishing areas due to scallops’ contamination by phycotoxinsEconomic dependency to scallop and fishing area likely to be closedVessels’ polyvalence and diversity of catch (changing the target specie, i.e., scallop)Vessels’ capacity to change fishing area
IndicatorsRate of lost working days (closure rate)Scallop contribution in total landingsContribution of other species in total landingsScallop production made in each area divided by the total production of all areas
Indicators constructionDuration of closure in days divided by the total days authorised for the fishing seasonScallop production (sales) divided by the total production of the vessel categoryProduction (sales) of other species divided by the total production of the vessel categoryScallop production came from other areas divided by the total production of all areas
Indicators aggregation method--The maximum value
Table 4. Exposure indicator of inshore fleets to scallop fishing bans due to HAB events.
Scallop Fishing Season
2012–20132013–20142014–20152015–20162016–20172017–20182018–2019
Z10000000
Z20000000
Z30000000
Z40000000
Z50.0300.070000
Z600.150.100.02000.03
Z70.020.150.1000.0600.13
Z80.0200.2300.0100.15
Z9110.4100.0200.96
Z10000.1600.060.190.03
Z110.1900.1500.070.120.07
Z120.400.180.600.160.0600.41
Z130.110.420.020.270.1000.31
Z140.1800.360.280.0800.08
Z150.0600.330.14000.76
ZI0.0100.070.27000
ZJ0.0100.050.2200.080.06
Table 5. Geographical distribution of scallop fishing vessels by maritime district.
Maritime District
BLDPFCLHCNCHOther
CD-T14%11%2%8%63%10%1%
CD-T24%13%4%5%55%19%0%
CD-T39%43%11%8%19%9%1%
CAD-T11%11%0%3%58%15%11%
CAD-T20%0%0%0%0%100%0%
DE-T12%53%1%5%24%14%0%
DE-T23%48%0%5%34%9%0%
DE-T310%60%20%1%6%3%0%
DP-T13%15%0%3%40%33%4%
DP-T211%23%0%5%14%48%0%
DP-T30%0%0%0%60%0%40%
BL: Boulogne-Sur-Mer, DP: Dieppe, FC: Fécamp, LH: Le Havre, CN: Caen, CH: Cherbourg, and Other: Dunkerque, Saint-Malo, Saint-Brieuc, Paimpol, Morlaix, Brest, Concarneau, Saint-Nazaire, La Rochelle, and Marennes.
Disclaimer/Publisher’s Note: The statements, opinions and data contained in all publications are solely those of the individual author(s) and contributor(s) and not of MDPI and/or the editor(s). MDPI and/or the editor(s) disclaim responsibility for any injury to people or property resulting from any ideas, methods, instructions or products referred to in the content.

