Systematic Review

Prey–Predator Mathematics Model for Fisheries Insurance Calculations in the Search of Optimal Strategies for Inland Fisheries Management: A Systematic Literature Review

1
Departement of Mathematics, Faculty of Mathematics and Natural Sciences, Universitas Padjadjaran, Sumedang 45363, Indonesia
2
Departement of Economics, Faculty of Business and Social Development, Universiti Malaysia Terengganu, Kuala Nerus 21030, Malaysia
*
Authors to whom correspondence should be addressed.
Sustainability 2023, 15(16), 12376; https://doi.org/10.3390/su151612376
Submission received: 3 July 2023 / Revised: 22 July 2023 / Accepted: 13 August 2023 / Published: 15 August 2023
(This article belongs to the Special Issue Sustainable Blue Economy and Marine Management)

Abstract

:
Fish stocking in inland fisheries involves a prey–predator interaction model so that the number of fish stocked affects optimal and sustainable yields. It is very important to make mathematical modeling to optimize inland fisheries management which is part of the blue economy. Currently, studies that focus on predator–prey mathematical modeling in inland fisheries, especially those related to insurance are lacking. The bibliometric database was taken from Google Scholar, Dimensions, Science Direct, and Scopus in the 2012–2022 research years. After further processing, it is displayed on the PRISMA diagram and visualized on VOSviewer to display the update of this research topic. As blue economy sustainability, the management of fisheries sector needs to be reviewed deeply. In this study, the assumptions of the predator–prey mathematical model are made to obtain the equilibrium point, maximum sustainable yield (MSY), and catch per unit effort (CPUE) values. These results can be used to calculate fisheries insurance as a strategy for optimizing sustainable fishermen’s income.

1. Introduction

Inland water areas include river basins and flood plains, lakes, and reservoirs. One of the inland waters that most importantly meet the needs of human life, such as water sources, agriculture, industry, electricity, tourism, and fisheries is a reservoir. Currently, most aquatic ecosystems are experiencing degradation along with the increase in human activities around the reservoir waters, leading to habitat degradation and a decrease in the aquatic environment quality. This has caused changes in the ecological structure of fish resources and a reduction in catches [1,2]. Indirectly, the physical condition of a reservoir is one of the causes of decreased fisheries production. However, this decline is significantly triggered by the high fishing pressure as evidence by the decrease in the catch quota. In order to anticipate the decline in fish production, stocking fish seeds need to be performed as an effort to restore fish resources (fish stock enhancement) [3]. Fish stocking in the reservoir has been carried out previously, and the study results showed that the activity was not optimal because the amount of seed stored was insufficient based on the carrying capacity of the waters [4,5]. Other environmental problems were due to anthropogenic activities around the reservoir waters, predatory fish also tend to prey on smaller ones [6]. This is because each population always interacts with others in an ecosystem, thereby fostering a series of predatory events [7]. According to [8] planktonic and detrivore fish are species suitable for stocking in natural fisheries as they are often preyed upon by predators. Consequently, these prey–predator interactions can affect or alter the state of the fish populations in the ecosystem. It can be concluded that one of the main reasons for the extinction of prey populations is the very high predation rate or a very low growth rate of the prey [9,10].
Therefore, it is necessary to consider the stocking density settings. Regulating stocking density is generally part of the cultivation work with the media dictating both the size and type of biota it contains. It is important to note that farmers can easily regulate the stocking density in ponds or other fish cultivation media but it is more difficult to estimate the number in natural aquatic ecosystems. This estimation can only be performed through various approaches—one of which is by using a mathematical model. Sufficient studies on stocking densities with mathematical models, which are influenced by commercial fishing aspects, have not been conducted [3,11]. In fact, the model is able to consider other aspects such as: fish stocking, trapping, and interactions between species in a holistic and analytical study. Holistic and analytical models are resourceful in fisheries management. Specifically, the holistic model assists in analyzing historical trends in fisheries while the analytical illustrates the current state of stocks and assesses conditions in subsequent years when fisheries exhibit a similar pattern [12].
Several previous studies underlying this article are the ones on logistic growth models in the field of aquaculture [13,14]. The model described a fishing strategy that can provide optimum harvesting results in order to maintain a sustainable fish population. Another study developed the interaction model of ecologically exploited species [10,14] and the impact of a maximum sustainable catch policy or Maximum Sustainable Yield (MSY) [15]. Furthermore, the prey–predator model of fishing activities in catch-free and reservation areas [16], as well as the dynamics of fisheries resources in the waters have been investigated [16]. Consequently, this current study examined the model of prey–predator populations in reservoirs with additional harvesting efforts for both populations as well as the stocking of prey. The interaction between predators and prey affects the amount of harvest, the prey–predator model obtains an overview of the amount of sustainable harvest or Maximum Sustainable Yield (MSY). The condition of the equilibrium allows the MSY to obtain the optimal number of predators and/or prey to be harvested [15,17]. The MSY value is used as an insurance calculation to provide an overview of the value of the benefits from harvesting so that the insurance calculation is in accordance with sustainable harvesting conditions [18,19].
After obtaining the prey and predator population models, a simulation was conducted on insurance premium calculations for inland fisheries in order to obtain optimal results and mitigate potential significant losses due to unanticipated crop failure or harvests. Successful stocking relies heavily on proper stocking density as deviations from optimal levels can negatively impact physiological processes and behavior, leading to decreased productivity [20]. In addition to their economic value, selected fish species have certain favorable traits such as ease of breeding, rapid growth, resistance to environmental conditions, and can be used as food by the community [16,21]. Based on this phenomenon, a study was conducted to determine the optimal fish stocking level that can enhance production by applying a logistic growth model to analyze fish catches in the reservoir. This current study aims to aid the management of fish resources in reservoir waters through resource restoration. The selection of the reservoir ecosystem was performed to enable effective monitoring and evaluation of the effects of fish stocking [22]. Reservoirs, being classified as closed ecosystems, are often the site of government fish stocking programs.

2. Materials and Methods

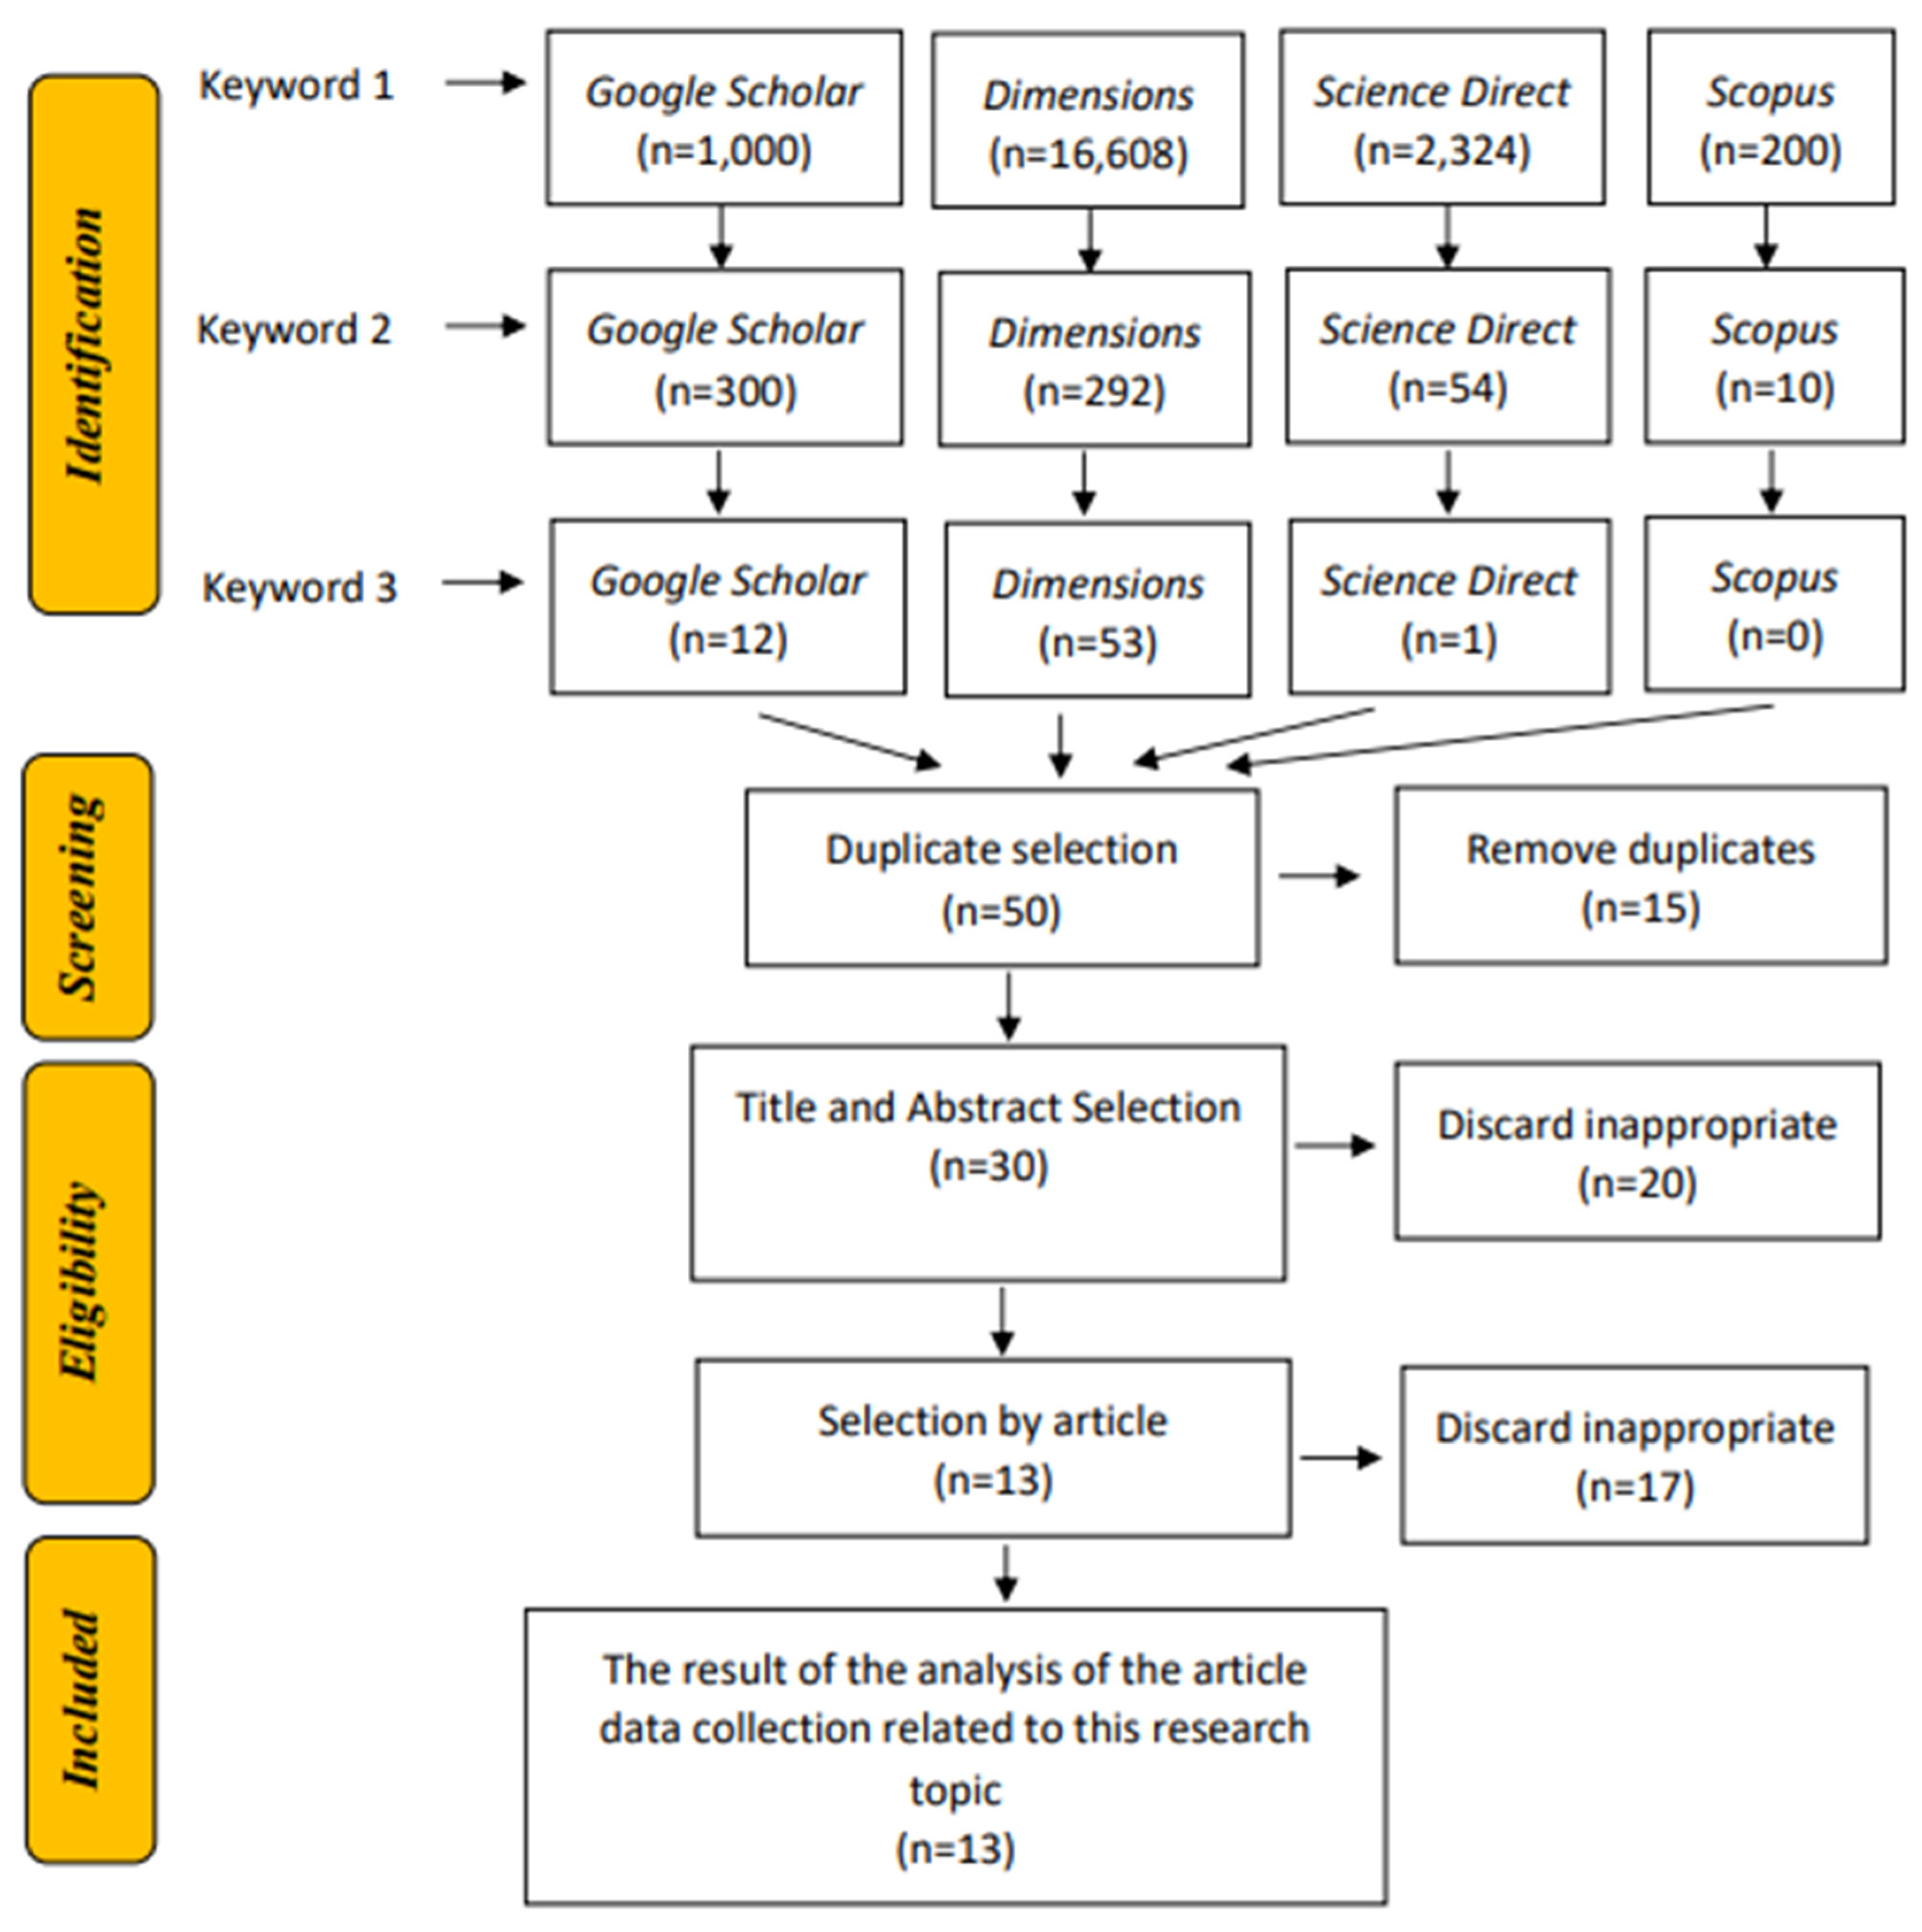
2.1. Scientific Article Data

The current study is built upon those conducted previously, particularly the investigation of logistics growth models in the field of aquaculture [23]. Furthermore, it describes a harvesting approach that provides optimal results while ensuring the preservation and sustainability of fish populations. Meanwhile, another study developed a model that analyzes the interaction between ecologically exploited species and the impacts of MSY policy [24].
Uncontrolled fishing by fishermen can lead to a decline and depletion of fish resources which can be addressed by implementing a proportional fishing strategy [7] and activities periodically or seasonally [23,25]. The exploitation of reservoir fisheries typically occurs through a process of trial and error and while they have been stocked for extended periods. However, the evaluations of stocking effectiveness are infrequently performed [5].
The MSY approach was first introduced by Schaefer in 1954 and 1957. It is a mathematical model that uses a dynamic system-based approach involving the equilibrium point and analyzing both local and global stability. This can ensure the continuity of the system that leads to a successful harvest while maintaining a balanced habitat population [26,27].

2.2. Selection of Literature Database

A summary of the search results from the three filtering processes in the four databases can be seen in Table 1.
A.
(“Predator–Prey Model” OR “Predator-Prey Model” OR “Prey–Predator Model” OR “Prey–Predator Model”);
B.
(“Fishery”) AND (“Maximum Sustainable Yield” OR “MSY”);
C.
(“Insurance”).
Bibliometric search results on Google Scholar used Publish or Perish software for filtering. Meanwhile, for research originating from Dimensions, Science Direct, and Scopus, filtering was carried out on their respective websites with a range of publications from 2012 to 2022. Filtering keywords started from keyword 1 which was typed as A, then it connected “AND” with keywords of type B which produced keywords 2. Finally, from keywords 2 was connected “AND” with keywords of type C which produced keywords 3 as filtering which showed the update of this topic.
After filtering up to keyword 3, the next step was to remove duplicate titles with the help of Jabref software and manually filter abstracts and duplicated text. Table 2 below shows the result of some publications displaying the words under keywords but do not go into detail about the keywords used. This is included in the selection results even though later, the details of the method table to be used are not included because it only appears in words or sentences. However, there is no further discussion of the keywords used as filtering in this process.
The results of the table are displayed in the PRISMA diagram in Figure 1 in order to illustrate the process of filtering articles according to the search.
The PRISMA diagram displays the identification process based on three keywords to carry out the screening process for duplication of publications using the Jabref software so that duplication can be removed. At the eligibility stage, filtering was carried out based on duplication of titles and abstracts followed by the selection of the article contents which resulted in 13 publications. The results of the final process include publications that are in accordance with the topic of this research.

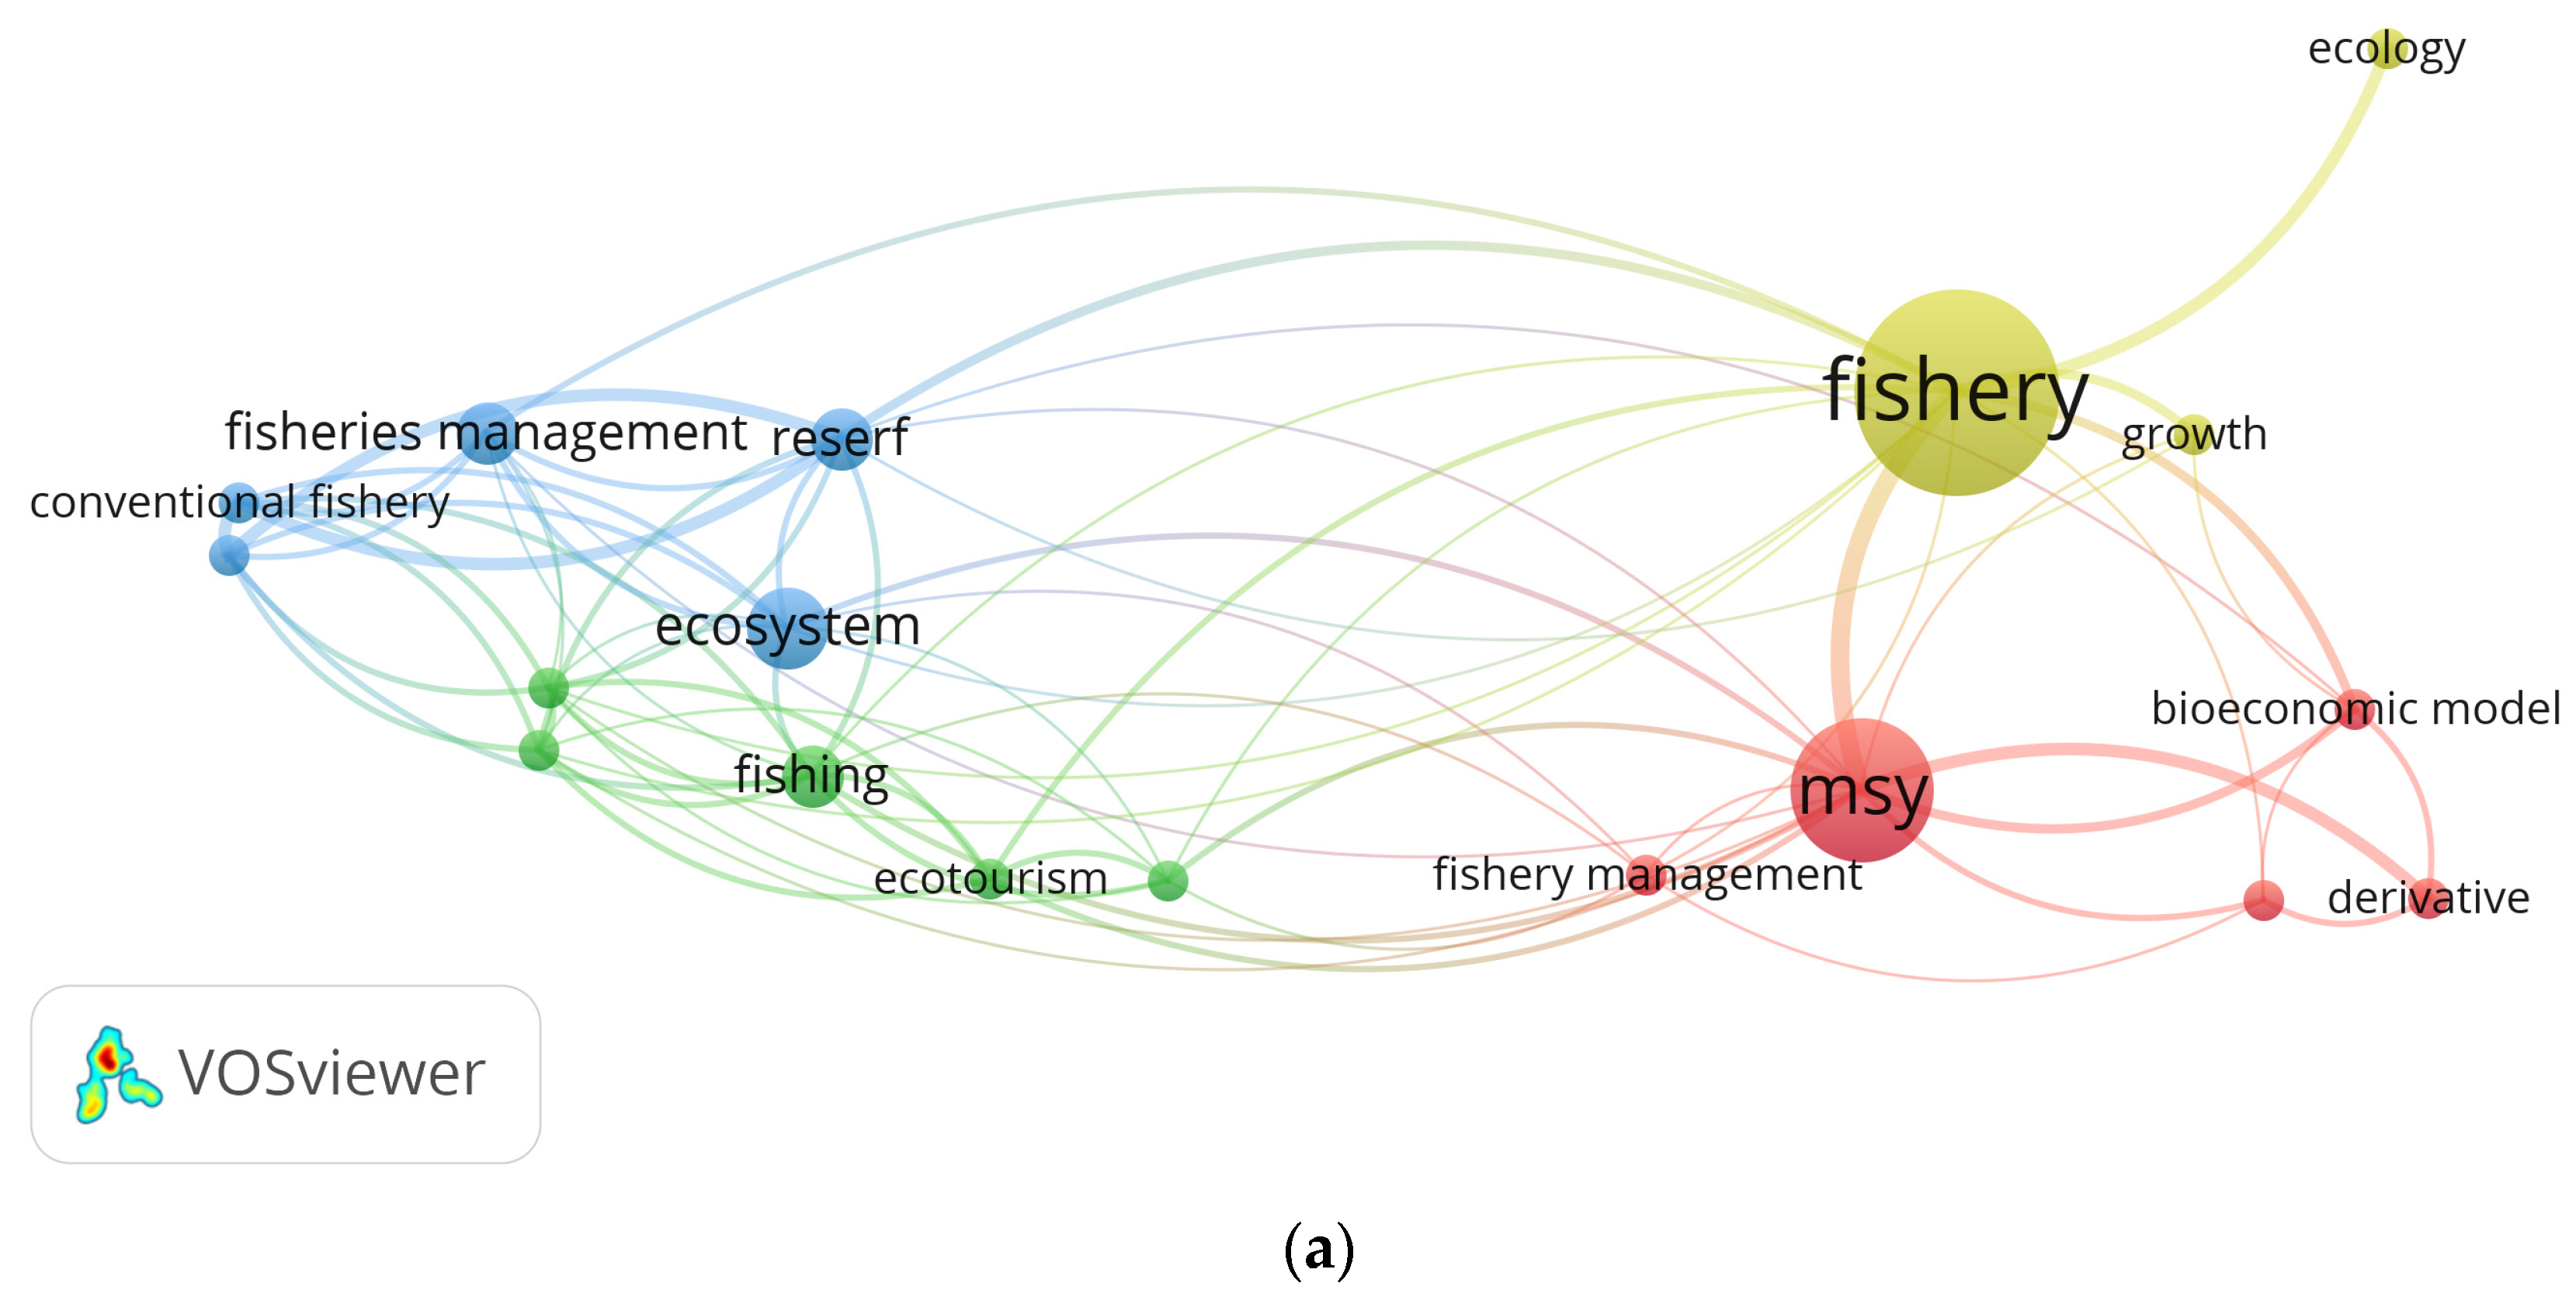
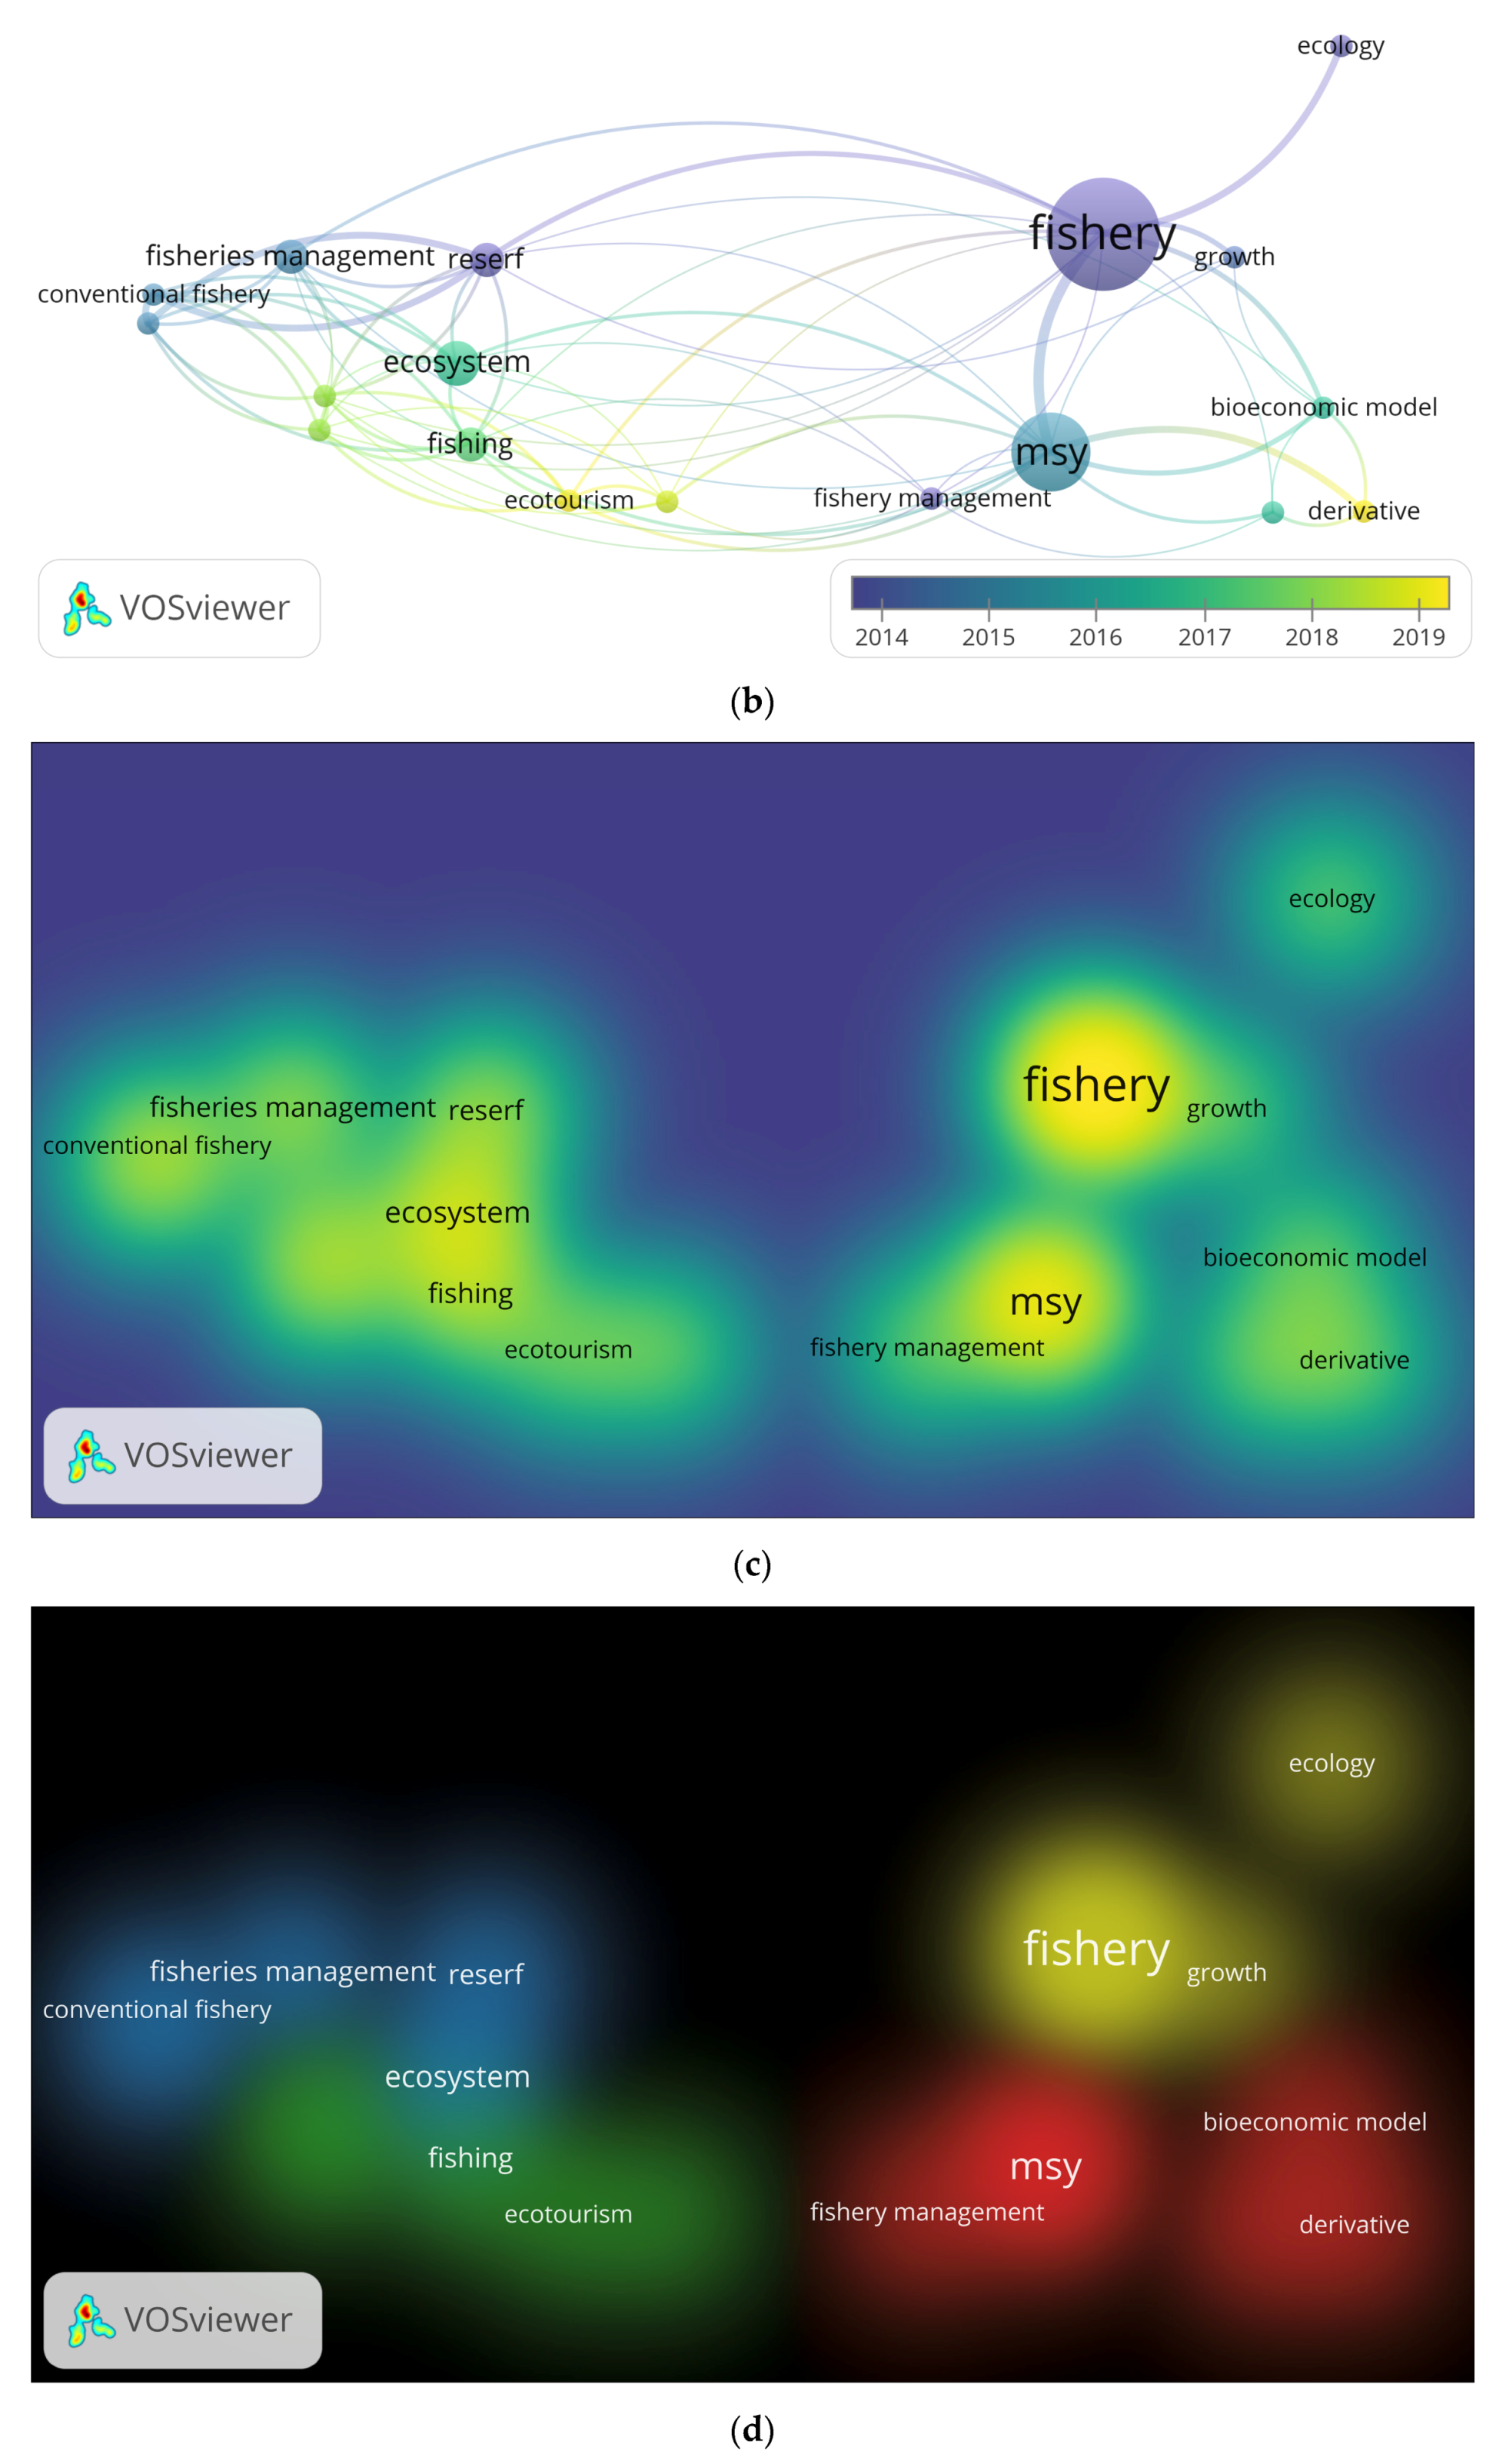
2.3. Bibliometric Analysis

Articles obtained from the final selection results were then stored in “.RIS” format. Subsequently, the bibliometric analysis, which is a branch of library science for examining information was conducted using VOSviewer software version 1.6.19 was released on January 2023. This technique is commonly used to obtain a scientific bibliographic overview of cited publications through literature. The results of the bibliometric analysis are presented through data visualization, which reveals the relationship between the data in the studied articles. Data visualization aims to analyze the content, patterns, and trends of document collections by measuring term power and counting keywords or topics. The emerging topics are grouped into several clusters. Each size reflects the number of articles addressing the keywords in the study topic. A large cluster size indicates a widespread discussion of keywords in the database while a small one suggests a limited discussion concerning the theme.

3. Results

The following section presents the results of the analysis conducted on 13 articles. This includes a visual representation of article data, namely: the development of prey–predator and Insurance in Fisheries, model analysis, an examination of the methods utilized in model analysis, and numerical simulations.

3.1. Article Data Visualization

The topic of prey–predator and insurance in fisheries was visualized using VOSviewer software to determine its novelty (Figure 2).
The visualization demonstrates a limited discourse on the ecological management of fisheries. Meanwhile, the insurance approach within the field remains a noteworthy topic of discussion as it has not become a standard part of the mathematical model.
The discussion of the topic appears to have occurred between 2014 and 2019, although an article search was conducted in the range of 2012–2022 using Publish or Perish. It was observed that the topic of ecology in fisheries has not been explored extensively.
The dimmer visualization is the topic discussion which is rarely carried out while for the bright one there is. However, it can be seen that the density visualization is small. So, it is an interesting topic for further study.
From the density visualization item, the cluster density is displayed to see the topic’s relevance. From Figure 2d, it can be seen that the cluster density of the 13 articles is categorized into 4 as shown in the Table 3 below.
From the results of the cluster density visualization topic of prey–predator and insurance in fisheries, a cluster table is shown in Table 3 to show the depth of subject matter for each cluster produced. In general, the topics of each cluster show a good level of density to develop discussions with these topics.

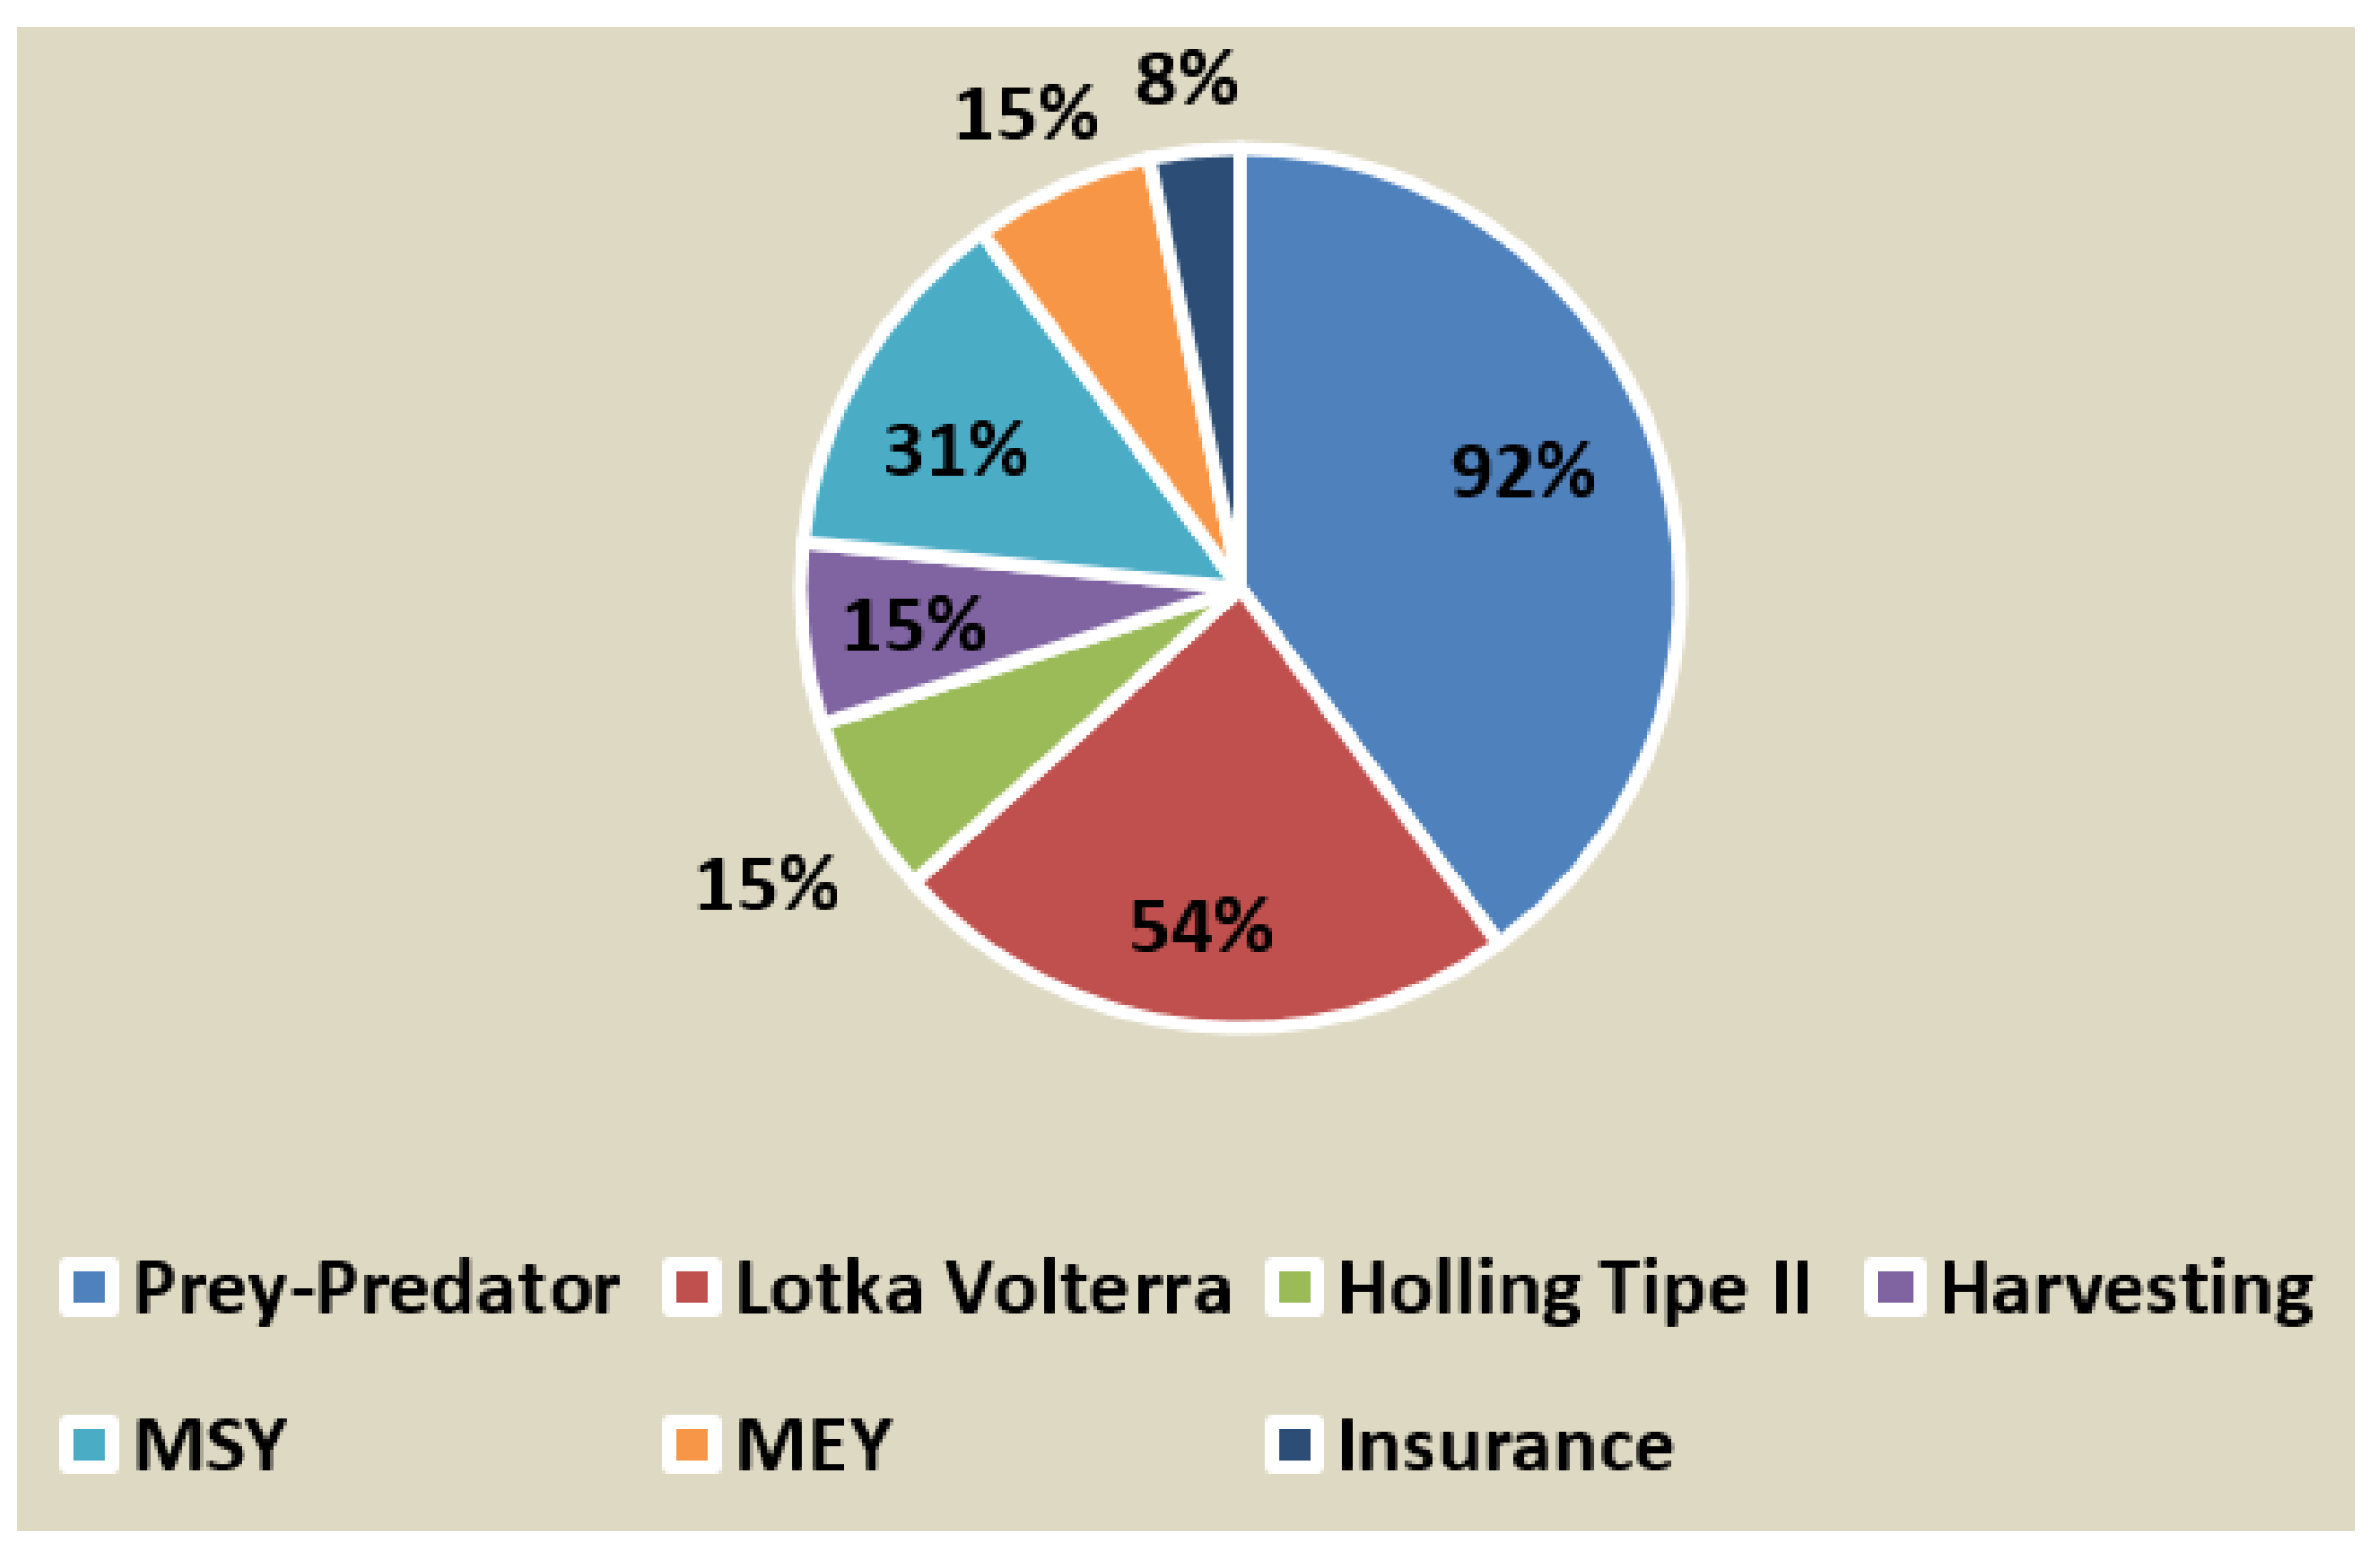
3.2. Mathematics Model

From the PRISMA diagram, 13 articles were discussed along with the methods and objects that were the study goals. Not all articles explain the details of the method in detail and thoroughly in the discussion of the article (Table 4).
The methods used in the 13 articles from the process shown on the PRISMA flow chart are presented below (Table 5). It was discovered that the studies conducted on the combination of mathematical and insurance models in the context of fisheries are limited in number.
The table reveals that there are no articles in the 2012–2022 publications that discussed insurance in fisheries. Some publications only include keywords but there is no further discussion according to the keywords so that the methods used in the research do not involve all methods in the mathematical model. Most of the 13 articles used the Lotka–Volterra model but only a few used the type II Holling function response method in their research studies. For discussion in material harvesting, not all publications explain in detail, only mentioning the word harvesting without further discussion about harvesting material. Likewise, material discussions about MSY, MEY, and insurance are only shown in sentences but there is no discussion in detail. So, a checklist is not carried out on material discussion.
Visualization of the methods used in the 13 articles resulting from the process shown on the PRISMA flow chart are shown in Figure 3.
However, there was also a discussion of the Holling II model, harvesting, and the maximum economic yield (MEY), each accounting for 15% of the discussion. Among the 13 articles reviewed, 92% utilized the prey–predator model and 54% employed the Lotka–Volterra. However, there was discussion of the Holling II, Harvesting, and MEY, each accounting for 15%. Despite being interesting, the discussion on insurance was limited to only a mention of the concept without delving into the specifics of fisheries insurance.
Bar chart visualization of the methods used in the 13 articles resulting from the process shown on the PRISMA diagram are shown in Figure 4.
The bar chart shows the article results from the PRISMA diagram discussing in depth the methods of harvesting, MSY, and insurance so that the novelty of research that discusses in depth the methods of prey–predator, harvesting, MSY, and insurance is very good for further research.
In the fisheries sector as a blue economy, insurance can offer a solution for the fishing industry and regulatory entities to tackle some uncertainties and reach their objectives of sustainability, financial security, and increased productivity [18,38]. For example, an insurance company can utilize optimal crop yields to provide insurance services in the field of fisheries, particularly inland fisheries, in order to anticipate and mitigate negative impacts on production results. Since financial institutions can provide a solution in case of adverse circumstances, the inland fisheries industry tends to develop and advance. The government and industry can also enhance the protection and enforcement of regulations in the fisheries sector by establishing and managing funds, utilizing probabilistic forecasts of future catches, prices, and risks from various scenarios, as well as incorporating commercial insurance to preempt the collapse of the fishing industry [18,39].

4. Discussion

The use of mathematical models in the context of fisheries is not widespread, particularly when it comes to the topic of fisheries insurance. The development of these models remains broad and varies greatly in the fishing industry, making it a challenging topic to discuss. This study aims to assist the fishing industry in making decisions regarding harvesting and stocking levels. When the models are developed, they can be expanded to include insurance, creating even more diverse mathematical models. This is particularly relevant based on the limited number of articles that have addressed the mathematical modeling of the prey–predator relationship in fisheries, specifically regarding insurance [40,41].
Fishery is a blue economy that must be studied more deeply in its management in order to obtain irrational natural resource conditions. Several mathematical models have actually studied models of interaction between prey and predators [22,42]. However, in terms of application in fisheries as a blue economy, they have not been applied in depth to fisheries management. Therefore, the study of prey–predator mathematical models is one of the solutions that can be applied to fisheries management. For predator–prey mathematical models, several have been studied in research [10,15], but more research should be performed with the existence of a spawning fish population and the presence of predation between spawning fish and predatory fish.
First, consider the traditional prey–predator system which combines selective harvesting efforts on both prey and predator from [43],
d x d t = r x 1 x k a x y q 1 e 1 x d y d t = b x y m y q 2 e 2 y
For description of compartments and parameters, see Table 6.
We used the harvesting function based on catch per unit effort (CPUE) hypothesis [10,44,45].
The mathematical model in the traditional predator–prey system can be developed into a prey–predator mathematical model by involving species that are actually involved in these interactions over time. For example, involving spawning fish from prey fish that also interact with predators. The mathematical model of the interaction between predatory fish with stocking fish and fish spawned from adult fish is a model that will be developed further by involving several parameters. The development of other mathematical models can be carried out without involving predatory fish by implementing a management system that separates prey fish from predatory fish so that they are included in the single species mathematical model category by harvesting adult fish where they will produce new spawning fish. Stocked fish and spawned fish are physically the same where the difference is only in their origin; stocked fish come from outside the system, while spawned fish come from within the system.
We propose the stages of developing a mathematical model that describes the interaction of four fish populations: stocking fish, fish population in reservoir, spawning fish, and predatory fish. Due to the absence of fishing in the reservoir, the population stocking fish follows a logistic growth model [15]. Fish population in a reservoir increases due to spawning in nature as spawning fish. Fish stocking is carried out as an effort to restore the population because there is continuous fishing, which results in a decrease in fish resources in the reservoir and is assumed to be carried out every year with the value in stocking already determined. This stocking fish population increases the fish density in the reservoir but decreases due to predation of the stocking fish by predatory fish and also due to the natural death. The many studies of prey–predator mathematical modeling on the application of fisheries as a blue economy will be able to provide better and more sustainable fisheries management strategy solutions.

5. Conclusions

The implementation of prey–predator mathematical models in addressing problems in inland fisheries is limited, specifically in terms of ensuring sustainable fish harvests. Hence, there is a lack of studies in this area. Also, the discussion of incorporating insurance into these models is limited. There is a need to develop an ideal mathematical model that enables us to meet the maximum sustainable yield (MSY) conditions in order to ensure the sustainable management of inland fisheries as a blue economy. Fishery management as a blue economy that must maintain the sustainability of its harvest must involve mathematics in general, and mathematical models in particular, because in reality there are interactions between species that can be calculated using the prey–predator mathematical model. Mathematical models can be developed from simple models involving single species or multispecies and the parameters are determined based on real conditions in the fishery. For further research, insurance can be included in the variable, not just in an advanced process of a mathematical model. This research does not yet exist, but will include insurance in its mathematical model.

Author Contributions

Conceptualization, C.B.; methodology, A.K.S. and S.; formal analysis, J.S. and C.B.; investigation, A.K.S. and S.; resources, A.K.S. and S.; writing—original, C.B. and A.K.S.; writing—revision and editing, C.B.; writing—review and editing, A.K.S. and S.; supervision, C.B. All authors have read and agreed to the published version of the manuscript.

Funding

This research is supported by the Indonesian Ministry of Education, Culture, Research, and Technology for Doctoral Dissertation Research Grant 2023, grant number 3018/UN6.3.1/PT.00/2023, entitled “Model Matematika Predator Prey Untuk Perhitungan Asuransi Perikanan Dalam Pencarian Strategi Optimal Pengelolaan Perikanan Darat”. The APC was funded by Universitas Padjadjaran.

Institutional Review Board Statement

Not applicable.

Informed Consent Statement

Not applicable.

Data Availability Statement

Not applicable.

Acknowledgments

The authors are grateful to the Directorate of Research and Community Service (DRPM) of Universitas Padjadjaran also the Indonesian Ministry of Education, Culture, Research, and Technology.

Conflicts of Interest

The authors declared no conflict of interest.

References

  1. Triharyuni, S.; Aldila, D.; Husnah, A. Jawa Tengah Tilapia Stocking Model in Malahayu Reservoir, Brebes, Central Java. J. Penelit. Perikan. Indones. 2019, 25, 161–168. [Google Scholar] [CrossRef]
  2. Wilson, S.K.; Fisher, R.; Pratchett, M.S.; Graham, N.A.J.; Dulvy, N.K.; Turner, R.A.; Cakacaka, A.; Polunin, N.V.C. Habitat degradation and fishing effects on the size structure of coral reef fish communities. Ecol. Appl. 2010, 20, 442–451. [Google Scholar] [CrossRef] [PubMed] [Green Version]
  3. De Silva, S.S.; Funge-Smith, S.J. A review of stock enhancement practices in the inland water fisheries of Asia. Asiapacific Fish. Comm. 2005, 12, 1–93. [Google Scholar]
  4. Cowan, V.; Aeron-thomas, M.; Payne, I. An Evaluation of Floodplain Stock Enhancement; MRAG Ltd.: London, UK, 1997. [Google Scholar]
  5. Quiros, R. The relationship between fish yield and stocking density in reservoirs from tropical and temperate regions. In Theoretical Reservoir Ecology and Its Applications; International Institute of Ecology, Brazilian Academy of Sciences and Backhuys Publishers: Rio de Janeiro, Brazil, 1999; pp. 67–83. [Google Scholar]
  6. Kralles, E. Mathematical Modeling of Fish Populations in Lake Ontario using Differential Equations. Master’s Thesis, State University of New York, New York, NY, USA, 2018. [Google Scholar]
  7. Herwartz, H. Modelling interaction patterns in a predator-prey system of two freshwater organisms in discrete time: An identified structural VAR approach. Stat. Methods Appl. 2022, 31, 63–85. [Google Scholar] [CrossRef]
  8. Beveridge, M.C.M. Cage Aquaculture; Blackwell Publishing: Hoboken, NJ, USA, 2004; ISBN 1405108428. [Google Scholar]
  9. Kar, T.; Ghosh, B. Bifurcations and feedback control of a stage-structure exploited prey-predator system. Int. J. Eng. Sci. Technol. 2011, 2, 131–141. [Google Scholar] [CrossRef] [Green Version]
  10. Ghosh, B.; Kar, T.K. Sustainable use of prey species in a prey-predator system: Jointly determined ecological thresholds and economic trade-offs. Ecol. Modell. 2014, 272, 49–58. [Google Scholar] [CrossRef]
  11. Vass, K.K.; Shrivastava, N.P.; Katiha, P.K.; Das, A.K. Enhancing fishery productivity in small reservoir in India. WorldFish Cent. Tech. Man. 2009, 1949, 22. [Google Scholar]
  12. Jiménez-Badillo, L. Application of holistic and analytical models for the management of tilapia fisheries in reservoirs Aplicación de modelos holísticos y analíticos para el manejo de pesquerías de tilapia en embalses. Hidrobiológica 2004, 14, 61–68. [Google Scholar]
  13. Laham, M.F.; Krishnarajah, I.S.; Shariff, J.M. Fish harvesting management strategies using logistic growth model. Sains Malays. 2012, 41, 171–177. [Google Scholar]
  14. Roopnarine, P. Ecology and the tragedy of the commons. Sustainability 2013, 5, 749–773. [Google Scholar] [CrossRef]
  15. Kar, T.K.; Ghosh, B. Author ’ s personal copy Impacts of maximum sustainable yield policy to prey—Predator systems. Ecol. Modell. 2013, 250, 134–142. [Google Scholar] [CrossRef]
  16. Dubey, B.; Patra, A. A mathematical model for optimal management and utilization of a renewable resource by population. J. Math. 2013, 2013, 613706. [Google Scholar] [CrossRef] [Green Version]
  17. Supriatna, A.K. Maximum Sustainable Yield for Marine Metapopulation Governed by Coupled Generalised Logistic Equations. J. Sustaninability Sci. Manag. 2012, 7, 201–206. [Google Scholar]
  18. Mumford, J.D.; Leach, A.W.; Levontin, P.; Kell, L.T. Insurance mechanisms to mediate economic risks in marine fisheries. ICES J. Mar. Sci. 2009, 66, 950–959. [Google Scholar] [CrossRef]
  19. Hohl, R. A Review of Aquaculture Insurance Summary; World Bank Group: Washington, DC, USA, 2022. [Google Scholar]
  20. Frost, H.; Ravensbeck, L.; Hoff, P.A.A. Environmental Management of Marine Ecosystems; Taylor & Francis: Oxford, UK, 2018; ISBN 9781498767729. [Google Scholar]
  21. Biswas, A.; Morita, T.; Yoshizaki, G.; Maita, M.; Takeuchi, T. Control of reproduction in Nile tilapia Oreochromis niloticus (L.) by photoperiod manipulation. Aquaculture 2005, 243, 229–239. [Google Scholar] [CrossRef]
  22. Murray, J.D. Mathematical Biology: I. An Introduction, 3rd ed.; Springer: Berlin/Heidelberg, Germany; New York, NY, USA, 2002; ISBN 0387952233. [Google Scholar]
  23. Daci, A. Fish Harvesting Models And Their Applications in a reservoir in Saranda, Albania. J. Multidiscip. Eng. Sci. Technol. 2016, 3, 2458–9403. [Google Scholar]
  24. Clark, C.W. The Worldwide Crisis in Fisheries Economic Models and Human Behavior; Cambridge University Press: New York, NY, USA, 2006; ISBN 9780521840057. [Google Scholar]
  25. Chen, X.; Li, G.; Ding, Q. Bioeconomic Model of Fishery Resources under Ecological and Technological Interdependencies; Fisheries; Chen, X., Ed.; Springer: Singapore, 2021; ISBN 978-981-33-4328-3. [Google Scholar]
  26. Schaefer, M.B. A study of the dynamics of the fishery for yellowfin tuna in the eastern tropical pacific ocean. Bull. Inter-Am. Trop. Tuna Comm. 1957, 11, 247–284. [Google Scholar]
  27. Schaefer, M.B. Some aspects of the dynamics of populations important to the management of the commercial Marine fisheries. Bull. Math. Biol. 1991, 53, 253–279. [Google Scholar] [CrossRef]
  28. Smith, M.D. The New Fisheries Economics: Incentives Across Many Margins. Annu. Rev. Resour. Econ. 2012, 4, 379–402. [Google Scholar] [CrossRef] [Green Version]
  29. Chakraborty, K.; Kar, T.K. Economic perspective of marine reserves in fisheries: A bioeconomic model. Math. Biosci. 2012, 240, 212–222. [Google Scholar] [CrossRef]
  30. Jakubik, P.; Kerimkhulle, S.; Teleuova, S.A. How to Anticipate Recession via Transport Indices. Ekon. Cas. 2017, 65, 972–990. [Google Scholar]
  31. Prosenjit Paul, T.K.K. Impacts of invasive species on the sustainable use of native exploited species, Ecological Modelling. Ecol. Modell. 2016, 340, 106–115. [Google Scholar] [CrossRef]
  32. Das, D.; Kar, T.K. Marine reserve and its consequences in a predator-prey system for ecotourism and fishing. Int. J. Math. Model. Numer. Optim. 2021, 11, 37–52. [Google Scholar] [CrossRef]
  33. Gauteplass, A. On the Optimal Control of an Animal-Vegetation Ecological System. 2012, pp. 1–32. Available online: https://citeseerx.ist.psu.edu/document?repid=rep1&type=pdf&doi=106108f11674038616f6dd0be8342900b63650bb (accessed on 3 June 2023).
  34. Barnett, L.A.K. Effects of Fishing, Species Interactions, and Climate on Populations and Communities: Insights for Ecosystem-Based Fisheries Management; University of California, Davis: Davis, CA, USA, 2015. [Google Scholar]
  35. Seijo, J.C.; Defeo, O.; Salas, S. Fisheries bioeconomics Theory, modelling and management. FAO. Fish. Tech. Pap. 1998, 368, 1–123. Available online: http://www.fao.org/documents/card/en/c/56f81566-3e34-561d-84dd-eb06810ce249/%5Cnhttp://www.fao.org/3/a-w6914e/index.html (accessed on 1 June 2023).
  36. Poudel, D. Stochastic Analysis in Fisheries. 2017. Available online: https://www.researchgate.net/profile/Diwakar-Poudel/publication/275020247_STOCHASTIC_ANALYSIS_IN_FISHERIES_MANAGEMENT/links/59282c1a458515e3d4668e5b/STOCHASTIC-ANALYSIS-IN-FISHERIES-MANAGEMENT.pdf (accessed on 3 June 2023).
  37. Gouhier, T.C.; Guichard, F.; Menge, B.A. Designing effective reserve networks for nonequilibrium metacommunities. Ecol. Appl. 2013, 23, 1488–1503. [Google Scholar] [CrossRef]
  38. FAO. World Review of Capture Fisheries and Aquaculture Insurance 2022; FAO: Roma, Italy, 2022; ISBN 9789251360583. [Google Scholar]
  39. De Llano Massino, A. Financial and Biological Model for Intensive Culture of Tilapia; UNU-Fisheries Training Programme: Reykjavík, Iceland, 2004; 62p. [Google Scholar]
  40. Sessions, S. The International Institute of Fisheries Economics & Trade. Changes 2014, 8, 9. [Google Scholar]
  41. Hotta, M. Fisheries Insurance Programes in Asia-Experiences, Practices and Principles. FAO Fish. Circ. 1999, 948, 54p. [Google Scholar]
  42. Keshet, L.E. Mathematical Model In Biology; SIAM; Random House: New York, NY, USA, 2005; ISBN 0-89871-554-7. [Google Scholar]
  43. Ghosh, B.; Kar, T.K.; Legović, T. Sustainability of exploited ecologically interdependent species. Popul. Ecol. 2014, 56, 527–537. [Google Scholar] [CrossRef]
  44. Clark, R.N. Control System Dynamics; Cambridge University Press: New York, NY, USA, 1996; ISBN 9780521472395. [Google Scholar]
  45. Badrudin. Analisis Data Catch & Effort Untuk Pendugaan MSY; Institute for Mathematics and Computer Science: Plantation, FL, USA, 2018. [Google Scholar]
Figure 1. PRISMA diagram.
Sustainability 15 12376 g001
Figure 2. (a). Network Visualization Topic of Prey–Predator and Insurance in Fisheries; (b). Overlay Visualization Topic of Prey–Predator and Insurance in Fisheries; (c). Item density Visualization Topic of Prey–Predator and Insurance in Fisheries; (d). Cluster Density Visualization Topic of Prey–Predator and Insurance in Fisheries.
Sustainability 15 12376 g002aSustainability 15 12376 g002b
Figure 3. Visualization of the methods used in the 13 articles resulting from the process shown on the PRISMA flow chart.
Sustainability 15 12376 g003
Figure 4. Bar chart visualization of the methods used in the 13 articles resulting from the process shown on the PRISMA diagram.
Sustainability 15 12376 g004
Table 1. The results were positioned in the main text close to their first citation.
KeywordsTypeGoogle ScholarDimensionsScience DirectScopus
Keywords 1A100016,6082324200
Keywords 2A AND B3002925410
Keywords 3A AND B AND C125310
Table 2. Result selection.
DatabaseData Keywords 3Semi-AutomaticManual Selection
DuplicateAbstractFull Text
ExcludedIncludedExcludedIncludedExcludedIncluded
Google Scholar122104606
Dimensions5314391524177
Science Direct1011000
Scopus0000000
Total66165020301713
Table 3. Development of prey–predator and insurance in fisheries.
ClusterItems
1ecotourism
fishing
impact
predator-prey model
species interaction
2conventional fisheries management
ecosystem
fisheries management
insight
reserves
3bioeconomic model
derivative
fisheries management
maximum sustainable yield
MSY
4ecology
economic
fisheries
growth
Table 4. Development of prey–predator and insurance in fisheries.
NoAuthorTitleMethodObject
1.M.D Smith [28]The new fisheries economics: incentives across many marginsLogistics Models and Lotka–VolterraFisheries
2.Peter Roopnarine [14]Ecology and the tragedy of the commonsLogistics Model and Lotka––Volterra, Ricker’s basic modelGeneral interactions between species
3.K. Chakraborty, T.K Kar [29]The economic perspective of marine reserves in fisheries: a bioeconomic modelLogistics Models, and Lotka–VolterraFisheries
4.P. Jakubik [30]How to anticipate recession via transport indicesStochastic Dynamics, Lotka–VolterraTransportation index in fisheries
5.P. Paul, T.K Kar [31] Impacts of invasive species on the sustainable use of native exploited speciesLogistics Model and Lotka–VolterraFisheries
6.D. Das, T.K Kar [32]Marine reserve and its consequences in a predator–prey system for ecotourism and fishingSingle species model, Predator-Prey Model, Harvesting, MSY, EMSY, MEYFisheries
7.X. Chen, G. Li, Q. Ding [25]A bioeconomic model of fishery resources under ecological and technological interdependenciesLogistics Model and Lotka–Volterra.Fisheries
8.A. Gauteplass [33]On the optimal control of an animal-vegetation ecological systemLogistics Model and Lotka–Volterra, Harvesting, Type II Holling Function Response, MSYPlants and animals
9.L.A.K Barnett [34]Effects of fishing, species interactions, and climate on populations and communities: insights for ecosystem-based fisheries managementDynamic Models, Fisheries Management, Predator-Prey Model, HarvestingFisheries
10.Seijo, J.C, Defeo, O and Salas, S, FAO
[35]
Fisheries bioeconomics. Theory, modeling, and managementPrey–Predator ModelFisheries
11.H. Frost, L. Ravensbeck, A. Hoff and P. Andersen. [20]The economics of ecosystem-based fisheries managementFisheries Management, MSY, MEY, Ecosystem Dynamic Model, Prey–Predator ModelFisheries
12.D. Poudel [36]Stochastic analysis in fisheries managementDynamic Growth, Stochastic, Fisheries ManagementFisheries
13.Tarik C. Gouhier, F. Guichard and Bruce A. Menge. [37]Designing effective reserve networks for nonequilibrium metacommunitiesLogistik Model, Prey–Predator Model, Lotka–Volterra,Fisheries
Table 5. Discussion material of prey–predator and insurance in fisheries.
NoAuthorTitleDiscussion Material
Prey–Predator Lotka–VolterraHolling Type IIHarvestingMSYMEYInsurance
1.M.D Smith [28]The new fisheries economics: incentives across many margins
2.Peter Roopnarine [14]Ecology and the tragedy of the commons
3.K. Chakraborty, T.K Kar [29]The economic perspective of marine reserves in fisheries: a bioeconomic model
4.P. Jakubik [30]How to anticipate recession via transport indices
5.P. Paul, T.K Kar [31]Impacts of invasive species on the sustainable use of native exploited species
6.D. Das, T.K Kar [32]Marine reserve and its consequences in a predator-prey system for ecotourism and fishing
7.X. Chen, G. Li, Q. Ding [25]A bioeconomic model of fishery resources under ecological and technological interdependencies
8.A. Gauteplass [33]On the optimal control of an animal-vegetation ecological system
9.L.A.K Barnett [34]Effects of fishing, species interactions, and climate on populations and communities: insights for ecosystem-based fisheries management
10.Seijo, J.C, Defeo, O and Salas, S, FAO
[35]
Fisheries bioeconomics: Theory, modeling, and management
11.H. Frost, L. Ravensbeck, A. Hoff and P. Andersen. [20]The economics of ecosystem-based fisheries management
12.D. Poudel [36]Stochastic analysis in fisheries management
13.Tarik C. Gouhier, F. Guichard and Bruce A. Menge. [37]Designing effective reserve networks for nonequilibrium metacommunities
Table 6. Description symbol of compartments and parameters.
SymbolDescription
x Prey population
y Predator population
r Constant per capita growth rate
k Constant carrying capacity for the prey species
a The predation rate
b The conversion coefficient due to predation
m The natural mortality rate of the predator species
q 1 The catchability coefficients of prey species, respectively
q 2 The catchability coefficients of predator species, respectively
e 1 The independent harvesting effort on prey species, respectively
e 2 The independent harvesting effort on predator species, respectively
Disclaimer/Publisher’s Note: The statements, opinions and data contained in all publications are solely those of the individual author(s) and contributor(s) and not of MDPI and/or the editor(s). MDPI and/or the editor(s) disclaim responsibility for any injury to people or property resulting from any ideas, methods, instructions or products referred to in the content.

