Article

Range Image-Aided Edge Line Estimation for Dimensional Inspection of Precast Bridge Slab Using Point Cloud Data

1
Business School, Hohai University, Nanjing 211100, China
2
School of Civil, Architectural Engineering and Landscape Architecture, Sungkyunkwan University, Suwon 16419, Republic of Korea
3
PT. Miyamoto International Indonesia, Bali 80361, Indonesia
4
Department of Building and Real Estate, The Hong Kong Polytechnic University, Kowloon, Hong Kong, China
5
Department of Architectural Engineering, Chungbuk National University, Cheong-ju 28644, Republic of Korea
*
Author to whom correspondence should be addressed.
Sustainability 2023, 15(16), 12243; https://doi.org/10.3390/su151612243
Submission received: 9 July 2023 / Revised: 6 August 2023 / Accepted: 8 August 2023 / Published: 10 August 2023
(This article belongs to the Special Issue Prefabrication and Modularized Construction)

Abstract

:
The accurate estimation of edge lines in precast bridge slabs based on laser scanning is crucial for a geometrical quality inspection. Normally, the as-designed model of precast slabs is used to match with laser scan data to estimate the edge lines. However, this approach often leads to an inaccurate quality measurement because the actually produced slab can be dimensionally different from the as-designed model or the inexistence of the as-designed model. In order to overcome this limitation, this study proposes a novel algorithm that generates and utilizes range images generated from scan points to enhance accuracy. The proposed algorithm operates as follows: first, the scan points are transformed into a range of images, and the corner points of these range images are extracted using a Harris corner detector. Next, the dimensions of the precast bridge slab are computed based on the extracted corner points. Consequently, the extracted corner points from the range images serve as an input for edge line estimation, thereby eliminating the matching errors that could arise when aligning collected scan points to an as-designed model. To evaluate the feasibility of the proposed edge estimation algorithm, a series of tests were conducted on both lab-scale specimens and field-scale precast slabs. The results showed promising accuracy levels of 1.22 mm for lab-scale specimens and 3.10 mm for field-scale precast bridge slabs, demonstrating more accurate edge line estimation results compared to traditional methods. These findings highlight the feasibility of employing the proposed image-aided geometrical inspection method, demonstrating the great potential for application in both small-scale and full-scale prefabricated construction elements within the construction industry, particularly during the fabrication stage.

1. Introduction

The construction industry is increasingly adopting prefabrication due to its advantages in terms of faster construction, lower costs, and a cleaner environment compared to traditional in situ construction methods [1,2]. In traditional construction processes, waste is generated from various sources, such as leftover materials, packaging, inefficient design, lost or damaged supplies, and discarded materials [3]. According to the Environmental Protection Agency, the United States alone produces over 600 million tons of construction and demolition waste annually [4]. A recent study demonstrated that the use of prefabricated elements could significantly reduce construction waste by up to 83.2% when compared to in situ concrete casting panels [5]. This reduction could be attributed to the controlled factory manufacturing of prefabricated elements, which avoids weather-related damage and facilitates effective recycling practices [6]. Furthermore, the upfront planning required for integrating prefabricated elements into the design helps minimize the need for rework, thereby reducing waste generation [1]. Given the growing emphasis on sustainability and reducing carbon dioxide emissions, the adoption of prefabricated elements has become increasingly popular in the construction industry [2,7,8,9,10]. With the development of sonar and microwave technology, technology for tracking and storing information on prefabricated components has been matured and developed, which benefits the automatic production of prefabricated slabs in the construction industry [11,12,13,14,15].
For the proper assembly of prefabricated elements at the construction site, it is essential to conduct a dimensional inspection during the manufacturing stage to prevent structural failures and construction delays [16]. Table 1 provides a summary of the geometrical inspection checklist and corresponding tolerances for prefabricated elements based on the Construction Quality Assessment System (CONQUAS) specified by BCA [16]. The geometry category includes four key features for assessment: dimension, straightness, squareness, and twist. Each feature has specific inspection checklists referred to as ‘Tolerance’. For instance, the tolerance for dimensions of prefabricated elements can vary based on the edge length. If the edge length ranges from 4.5 m to 6 m, the tolerance value for the geometrical inspection is set at 12 mm.
In recent times, 3D laser scanners have gained popularity for their ability to acquire accurate and efficient geometric data [16]. Thanks to the advantages of laser scanners, numerous researchers have proposed geometrical inspection techniques for prefabricated elements using laser scanning data collected from the laser scanner [18,19,20,21]. There are also a few studies that utilize scan points directly or indirectly without the as-designed model to perform edge line estimation on prefabricated components with simple geometrical features [21]. However, this study targets more complex geometry objects to address the limitation of edge line estimation methods that require an as-designed model as their input. In most of these previous studies, the input for edge line estimation typically requires the as-designed model to be matched with the collected scan points. However, inaccurate measurements often arise due to poor matching between the as-designed model and the collected scan points, particularly when the prefabricated elements differ from the original design [22,23,24]. Figure 1a illustrates the inaccuracies of edge line estimation arising from the matching errors. Image processing algorithms have become mature for geometrical feature extraction and demonstrate high computational efficiency in 2D domain analysis. Hence, range images obtained from point cloud data have the potential to capture object surface geometry for a geometrical inspection [22,23]. Considering the characteristics of laser scanning data and range images, this study aimed to leverage the strengths of both datasets to address the current limitations associated with edge line estimation.
Specifically, this study proposes a novel range image-aided algorithm that generates and utilizes range images obtained from point cloud data to enhance edge line estimation accuracy. Figure 1b indicates the concepts of the proposed range image-aided method. In this approach, the extracted corner points from range images served as the input for edge line estimation. Therefore, there was no need to match the as-designed model and the collected scan points for edge line detection, addressing the measurement errors caused by the alignment process. First, the scan points were transformed into range images, and the corner points of these range images were extracted. Next, the dimension of the precast bridge slab was computed based on the model generated from the extracted corner points. Consequently, there was no need to match the as-designed model with the collected scan points, eliminating inaccuracies arising from matching errors and improving edge line estimation accuracy.
The uniqueness of this study is (1) the development of an enhanced edge line estimation algorithm that generates and utilizes range images from laser scanning data and (2) the successful validation of the proposed edge line estimation technique through a series of tests, including comparative assessments against traditional methods. This paper is structured as follows: Section 2 provides an extensive review of the literature on geometrical inspections utilizing point cloud data and range images separately. The data processing steps involved in the proposed edge line estimation technique are illustrated in Section 3. Validation experiments conducted on both lab-scale specimens and field-scale precast bridge slabs are presented in Section 4. Finally, Section 5 ends with a brief summary.

2. The Literature Review

2.1. Laser Scanning-Based Geometrical Inspection

Numerous studies have proposed geometrical inspection methods based on laser scanning for various construction components, including prefabricated pipes [18], spatial structural components [19], and precast girders [20,21]. For instance, Nahangi et al. [18] presented a framework for quantifying deviations in prefabricated pipe assemblies using laser scanning data. A forward kinematics model based on the 3D image alignment theory and robotic kinematics was utilized to extract deviation information. Lab-scale experiments demonstrated maximum errors of 0.237° for rotational discrepancies and 0.02 cm for translational discrepancies. Liu et al. [19] introduced a holistic assessment framework for the quality control of spatial structural components. Their approach incorporated assessment parameters, refined scanning strategies, and data processing methodologies and utilized point cloud processing, reverse modeling, and finite element analysis. The proposed method was proven effective and applicable as the final evaluation yielded 95% reliability in terms of dimensional accuracy and structural performance. Yoon et al. [20] developed a laser scanning technique to determine the optimal positioning of precast bridge deck slabs. They extracted dimensions and locations of geometric features such as shear connectors and shear pockets and solved a nonlinear minimization problem to determine the optimal positioning of precast bridge deck slabs. Field–scale tests showed how the proposed method eliminated 54 discrepancies between shear connectors on girders and shear pockets on panels. Hodge et al. [21] proposed automatic methods to estimate the positional and dimensional information of bridge girder reinforcement cages. In the study, 3D scan points associated with the reinforcement cages were segmented and classified, reporting a discrepancy of less than 2 mm for the dimensions estimation and 0.1° for the orientation estimation of the rebar cages in validation experiments. Truong-Hong et al. [25] presented a novel method to extract the surfaces of the box and slab beams from point cloud data. This method utilizes both point clouds and contextual knowledge to segment point cloud subsets corresponding to individual bridge components from superstructure to substructure. An experimental test showed that discrepancies between the extracted surfaces and ground truth were no larger than 0.82 for the area overlap ratio and 0.59 degrees for the angular deviation.
The authors’ research group has proposed several edge line estimation algorithms using laser scanning for the edge line estimation of prefabricated elements, including the ‘vector-sum algorithm’ [22], ‘least square regression (LSR) algorithm’ [24,26], and ‘Random sample consensus (RANSAC) algorithm’ [24,27]. The ‘vector-sum algorithm’ identifies points along the edges by calculating the sum of eight vectors connecting the scan point to its eight closest neighboring scan points. Once the edge points were extracted and each edge line was fitted using the least-squares fitting algorithm. In addition, the ‘least square regression (LSR) algorithm’ [24,26] and the ‘random sample consensus (RANSAC) algorithm’ [24,27] were developed for the dimension extraction of precast elements by aligning the as-designed model with collected scan points. These algorithms first extract the last valid scan points (LVSPs), which are located inside the edges, and generate hypothesis scan points (HSPs) adjacent to the LVSPs. Subsequently, the edge line is predicted using line fitting algorithms, employing the centers of these two datasets with LSR and RANSAC algorithms. Validation tests on lab-scale specimens demonstrated an edge line estimation accuracy ranging from 1.5 mm to 2.7 mm, while for field-scale prefabrication elements, the accuracy declined to 3 mm due to reduced data density and a larger element size.
In summary, although there have been extensive studies and developments in laser scanning-based geometrical inspections for construction components, previous studies have typically involved the matching of the as-designed model and the collected scan points for edge line detection. However, inaccurate measurements have been frequently encountered due to the inadequate matching of the as-designed model with the collected scan points, as illustrated in Figure 1a, resulting in poor dimensional inspection results.

2.2. Range Image-Based Geometrical Inspection

Commonly used image processing algorithms, such as edge detection and corner detection methods, are widely employed for geometrical feature extraction [28,29]. Popular edge detection methods include the Sobel and Prewitt operators [30], Robert’s operator [31], and the Canny operator [32]. Representative corner detection algorithms include the SUSAN corner detection algorithm [33], the Harris corner detector algorithm [34], and the Kitchen–Rosenfeld detection algorithm [35].
Range images, which are obtained from a depth camera or generated from point cloud data, have the potential to perform the geometrical inspection of precast concrete (PC) elements. There have been a few studies focusing on the geometrical inspection of precast concrete (PC) elements based on range images [22,23]. For instance, Kim et al. [22] extracted the geometrical features of PC elements based on range images obtained from laser scanning data. The edges and corners of the PC elements were obtained using the Canny edge detector and the Hough transform for the coordinate transformation of point cloud data. However, edges and corners extracted from the range image are vulnerable to mixed pixeled problems [36], which are not subsequent for dimension estimation. Wang et al. [23] estimated the locations of structural features such as the shear keys and shear pockets of PC elements from range images. In the study, 3D laser scanning data were converted into a 2D range image, and then the template-matching approach [37] was used to identify the locations and dimensions of structural features from the range image because of the high computational efficiency in 2D domain analysis. However, the location estimation from the range of images was limited to structural features embedded in small-scale elements of PC slabs with regular shapes.
Although data processing algorithms for feature extraction from images are well-established, a range of image-based geometrical inspection has several limitations, including limited detected size and vulnerability to noisy data. In comparison to dense and precise point cloud data obtained directly from laser scanning, relying solely on range images derived from point cloud data tends to yield rougher geometrical inspection results.
Considering the characteristics of both the laser scanning-based method and the range image-based method, this study proposes a novel range image-aided algorithm that generates and utilizes range images acquired from point cloud data to enhance the edge line estimation accuracy. First, the scan points are transformed into range images, and the corner points of these range images are extracted. Next, the dimensions of the precast bridge slab are computed using extracted corner points. Consequently, the extracted corner points from the range images serve as an input for edge line estimation, thereby eliminating the matching errors that could arise when aligning collected scan points to an as-designed model.

3. Methodology

Figure 2 shows the overall procedure for the proposed edge line estimation algorithm. There are four steps, which contain (1) data pre-processing, (2) the generation of range images from point cloud data, (3) the extraction of corner points from range images, and (4) dimension estimation. First, data pre-processing was conducted to extract the scan points on the top surface of the prefabricated slab for further dimension estimations. Then, a 2D range image was generated from the 3D scan points on the top surface. Third, the corner points were extracted from the 2D range image using a Harris corner detector [34]. In this way, extracted corner points from the range image served as the input for edge line estimation. Finally, the edges of the top surface were estimated by the LSR 2 algorithm [24] for geometrical inspection. Therefore, there was no need to match the as-designed model and the collected scan points for edge line detection, addressing the measurement errors caused by the alignment process. The details of each step are presented in the following sub-sections.

3.1. Data Pre-Processing

This step aimed to remove the background noise and extract the top surface of the precast on the bridge slab. Figure 3 shows the data pre-processing. Note that this study takes the top surface of the precast bridge slab as an example to illustrate the edge line estimation algorithm. The main purpose of the data pre-processing was to eliminate undesired scan points in the background, specifically, those located behind the top surface. Therefore, only scan points on the top surface were preserved for subsequent data processing. Figure 3a shows the original data. In this study, the DBSCAN (Density-Based Spatial Clustering of Applications with Noise) algorithm [38] was employed, which effectively distinguished clusters of high density from clusters of low density. Figure 3b illustrates the outcome of implementing the DBSCAN algorithm. The background scan points were first removed with respect to the assumption that they were the biggest cluster. Then, the top surface was extracted based on the assumption that the scan points on the top surface were the second biggest cluster. Figure 3c shows the extracted scan points on the top surface based on the DBSCAN algorithm.
Once the top surface of the precast bridge slab was obtained, the coordinates with respect to the laser scanner (Figure 3c) were then transformed into a new coordinate system. Here, the initial coordinate system was associated with the position and alignment of the laser scanner, which was difficult to extract geometrical information from. In order to facilitate the geometrical inspection, the scan points were converted to a customized coordinate system where the principal axis of the scan points was parallel to the axis of a new coordinate. Figure 3d shows the scan points that were associated with the top surface after the coordinate transformation.

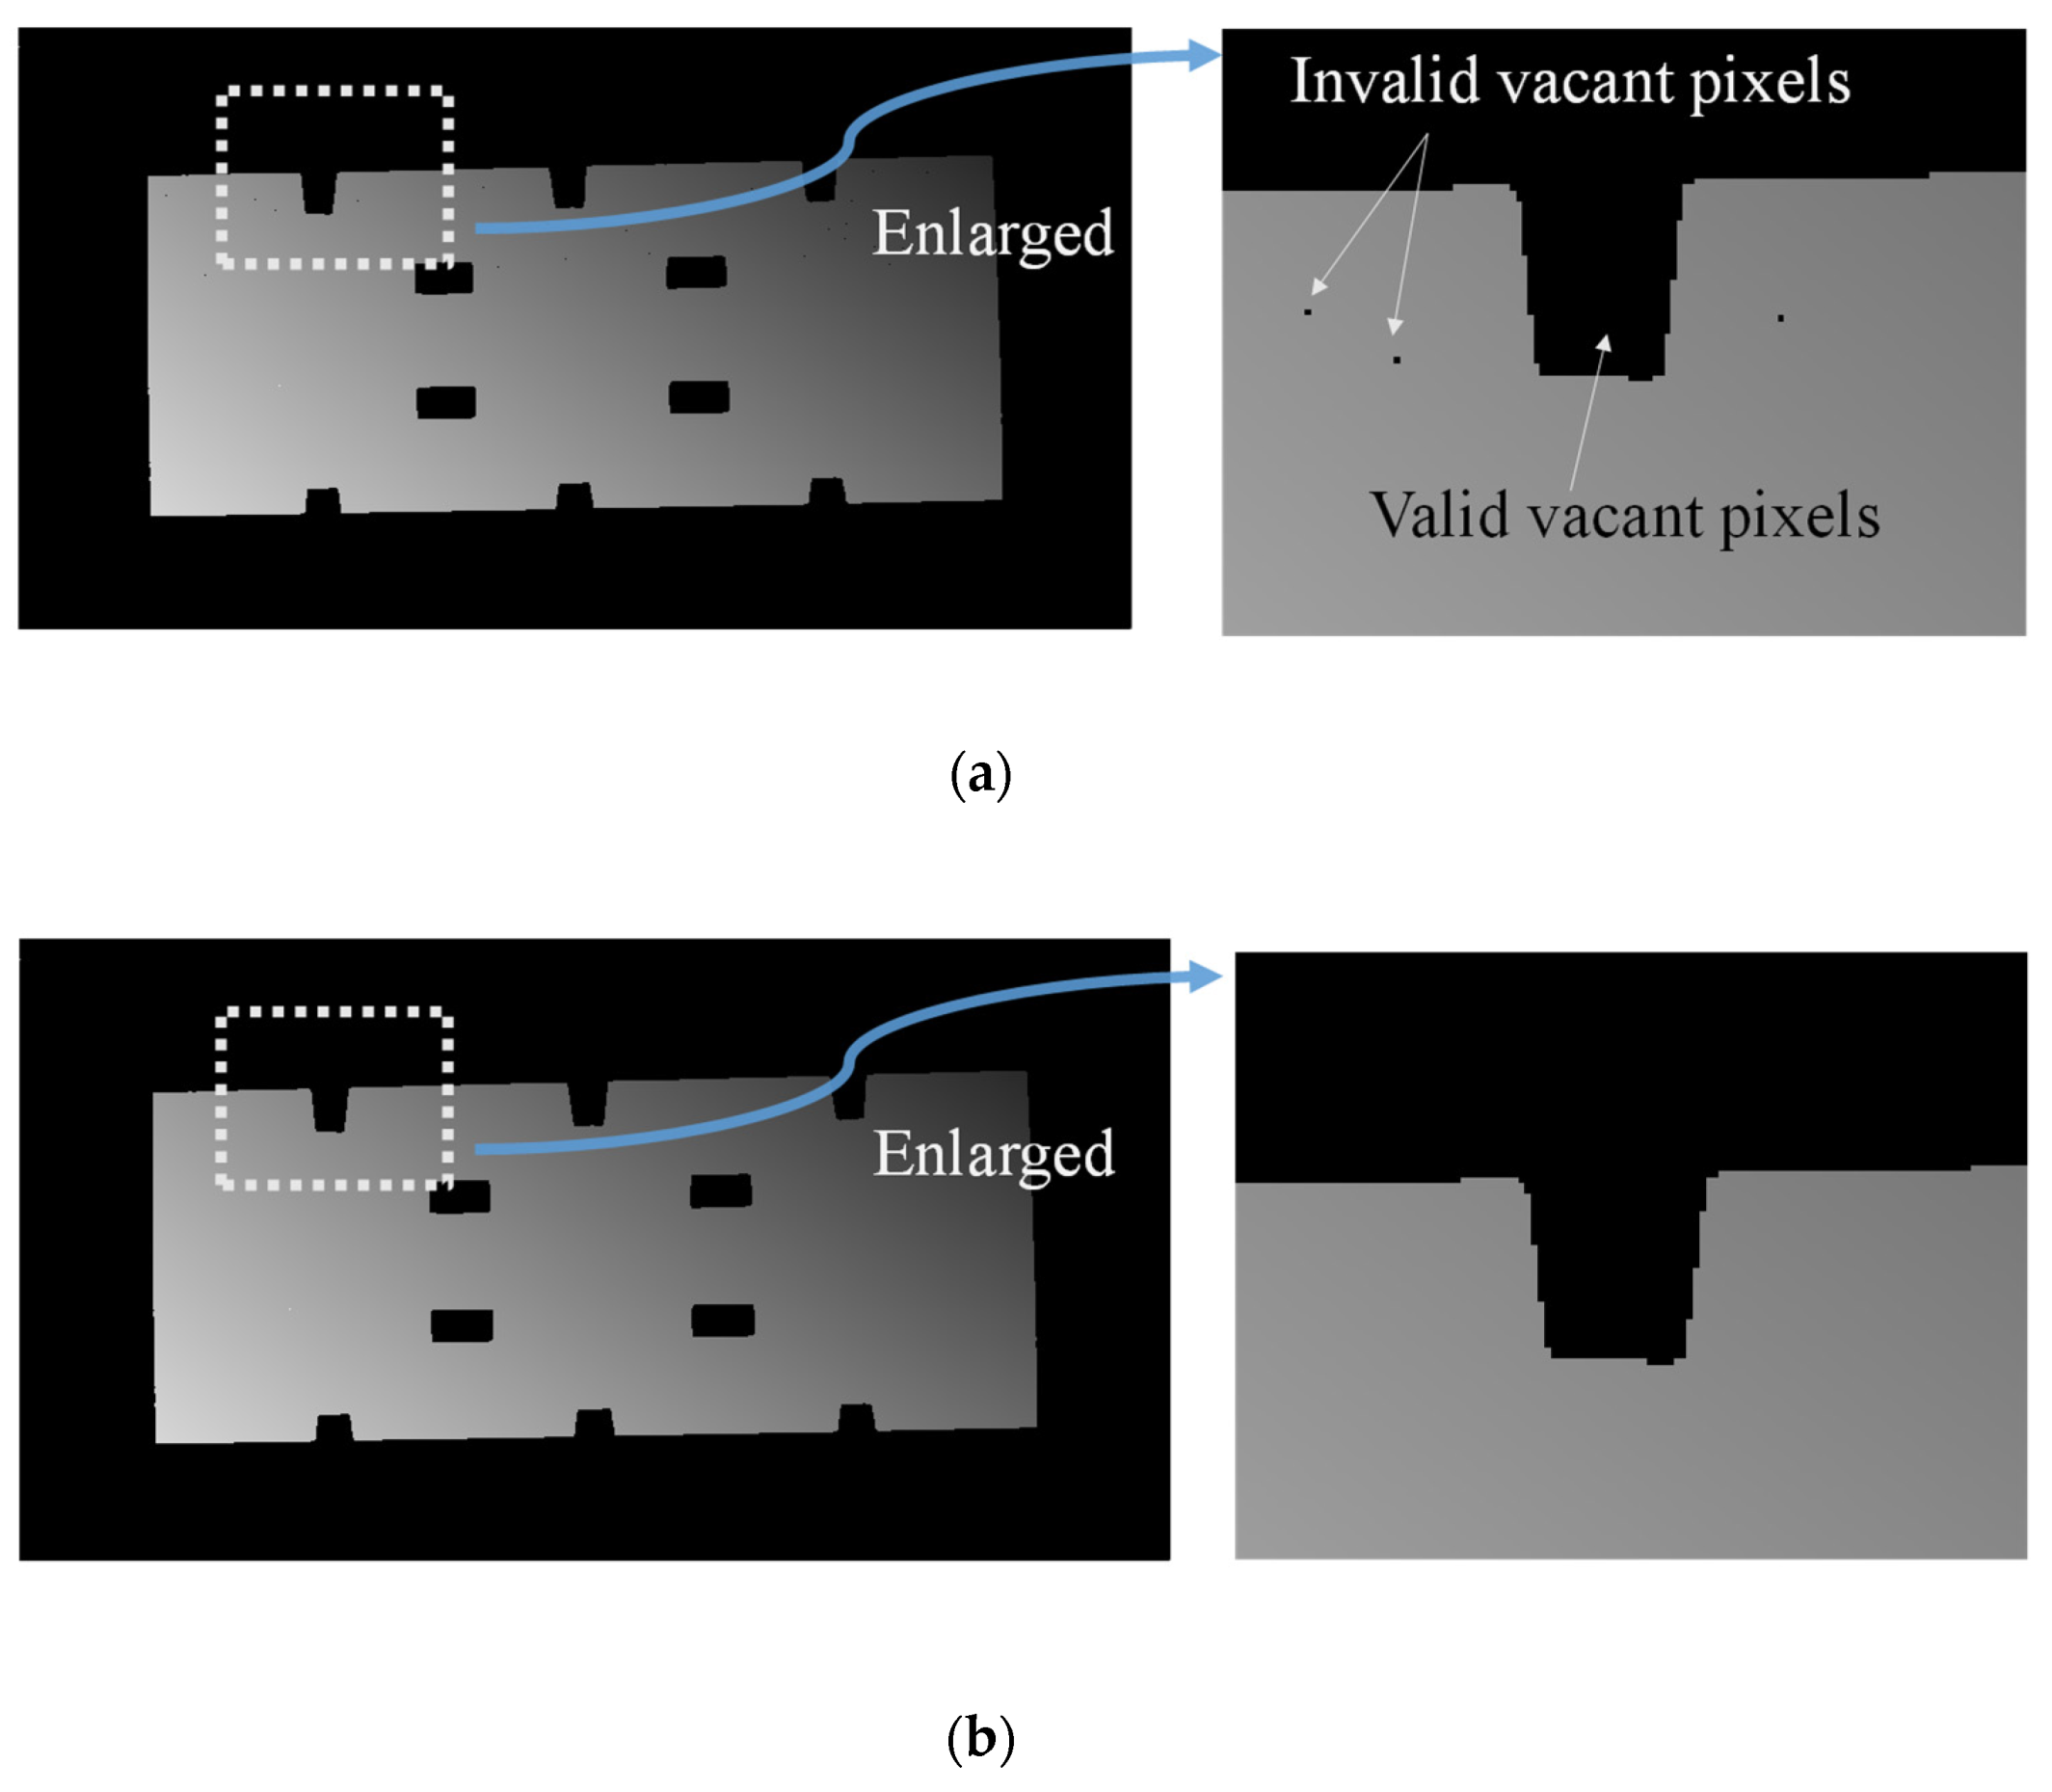
3.2. Generation of Range Image from Point Cloud Data

This step aimed to acquire a range image from point cloud data, which included (1) the simulation of margin points, (2) the creation of 2D pixels, and (3) the elimination of invalid vacant 2D pixels.
Step 1—simulation of margin points: This step involves simulating four margin points corresponding to the four boundary points on the top surface of the precast bridge slab. The purpose of this was to differentiate the edges of the range images acquired from the laser scanning data for subsequent data processing. Figure 4 illustrates the simulation of margin points. Firstly, the four boundary points of the scan points on the top surface, denoted as “LeftTop”, “LeftBottom”, “RightTop”, and “RightBottom” (as shown in Figure 4a), were detected. For example, the boundary point “LeftTop” was identified as the nearest scan point to the position with the minimum X coordinate and maximum Y coordinate of the scan points on the top surface. Scan points obtained from laser scanning were represented as ( r ,   c ,   X ,   Y ,   Z ) , where r and c indicate the column and row number of the scan points, and X, Y, and Z represent the 3D coordinates. The margin points corresponding to these four boundary points were then simulated by calculating the point-to-point distance. Figure 4b illustrates the basic concept of point-to-point distance. Utilizing the line-of-sight principle of laser scanning, the point-to-point distance ( d ) from the simulated adjacent scanning point to the target scan points could be computed using Equation (1) [39].
d = r × θ cos α
where r is the scanning distance from the target scan points to the laser scanning and θ and α are the angular resolution and incident angle of the laser scan beam, respectively.
Figure 4c demonstrates the procedure for simulating margin points using the point-to-point distance. In this case, the boundary point “LeftTop” was taken as the starting point, and its interval number was designated as 0. The simulated scan point with the interval number i relative to the boundary point could be updated as ( r i 1 1 , c i 1 + 1 , X i 1 d i 1 , Y i 1 + d i 1 , Z ) using the point-to-point distance ( d i 1 ) in relation to its adjacent simulated scanning point ( r i 1 , c i 1 , X i 1 , Y i 1 , Z ) with the interval number i 1 . In this way, the four corresponding margin points could be simulated by calculating the point-to-point distance based on a user-defined interval number n . For this study, a value of 100 was selected for n .
Step 2—creation of 2D pixels: Figure 5 illustrates the process of creating 2D pixels from point cloud data. Each 2D pixel was associated with a corresponding 3D scan point, denoted as P i ( r i , c i , X i , Y i , Z i ) in the laser scan data. Initially, 2D grids were generated to organize the 2D pixels of the range image with respect to the column and the row values of the 3D scan points. Figure 5a depicts the generation of 2D grids. The starting position of the 2D grids was selected as the lower left corner, with the minimum column value and row value of the scan points. Subsequently, each 3D scan point was stored in the 2D grids using its respective row and column numbers.
Once the 2D grids were generated, the calculation of 2D pixels corresponding to the 3D scan points stored in the grid was conducted. The 2D pixel of the range image was represented as p i ( θ i , φ i , ρ i ). Here, θ i and φ i represent the row ( r i ) and column ( c i ) values of the corresponding 3D scan point, respectively. p i denotes the gray value of each scan point in relation to the range image, which was determined using Equation (2) [40].
c = 255 ( s m a x s m i n ) ρ i = s m a x s i × c
where s i presents the scanning distance from the corresponding 3D scan point to the laser scanner. s m a x and s m i n are the maximum and minimum distances from the scan points to the instrument center. c is the constant. Figure 5b shows the generated range image by the creation of the 2D pixels.
Step 3—Elimination of invalid vacant 2D pixels: This step focuses on refining the created 2D pixels by eliminating invalid vacant 2D pixels. Vacant pixels could be categorized into two types: (1) valid vacant pixels and (2) invalid vacant pixels. Figure 6a illustrates the distinction between valid vacant pixels and invalid vacant pixels. Invalid vacant pixels, indicated by a grey value of zero, occurred due to incorrect calculations of the structured 2D pixels or the presence of mixed pixel problems [36]. These invalid vacant pixels could be mistakenly identified as edge points during the edge line estimation process. Therefore, it was necessary to refine the generated 2D pixels by eliminating invalid vacant pixels.
To determine the validity of a vacant pixel, its eight nearest neighboring pixels were examined. If more than five of the neighboring pixels were also vacant, the vacant pixel was classified as a valid vacant pixel, typically found in the margins or openings of the prefabricated component. Conversely, if fewer than five neighboring pixels were vacant, the vacant pixel was classified as an invalid vacant pixel. Upon identifying an invalid vacant pixel, its grey value was updated as the mean grey value of its eight neighboring points. In this way, invalid vacant pixels were eliminated. Figure 6b shows the range image after the elimination of invalid vacant pixels.

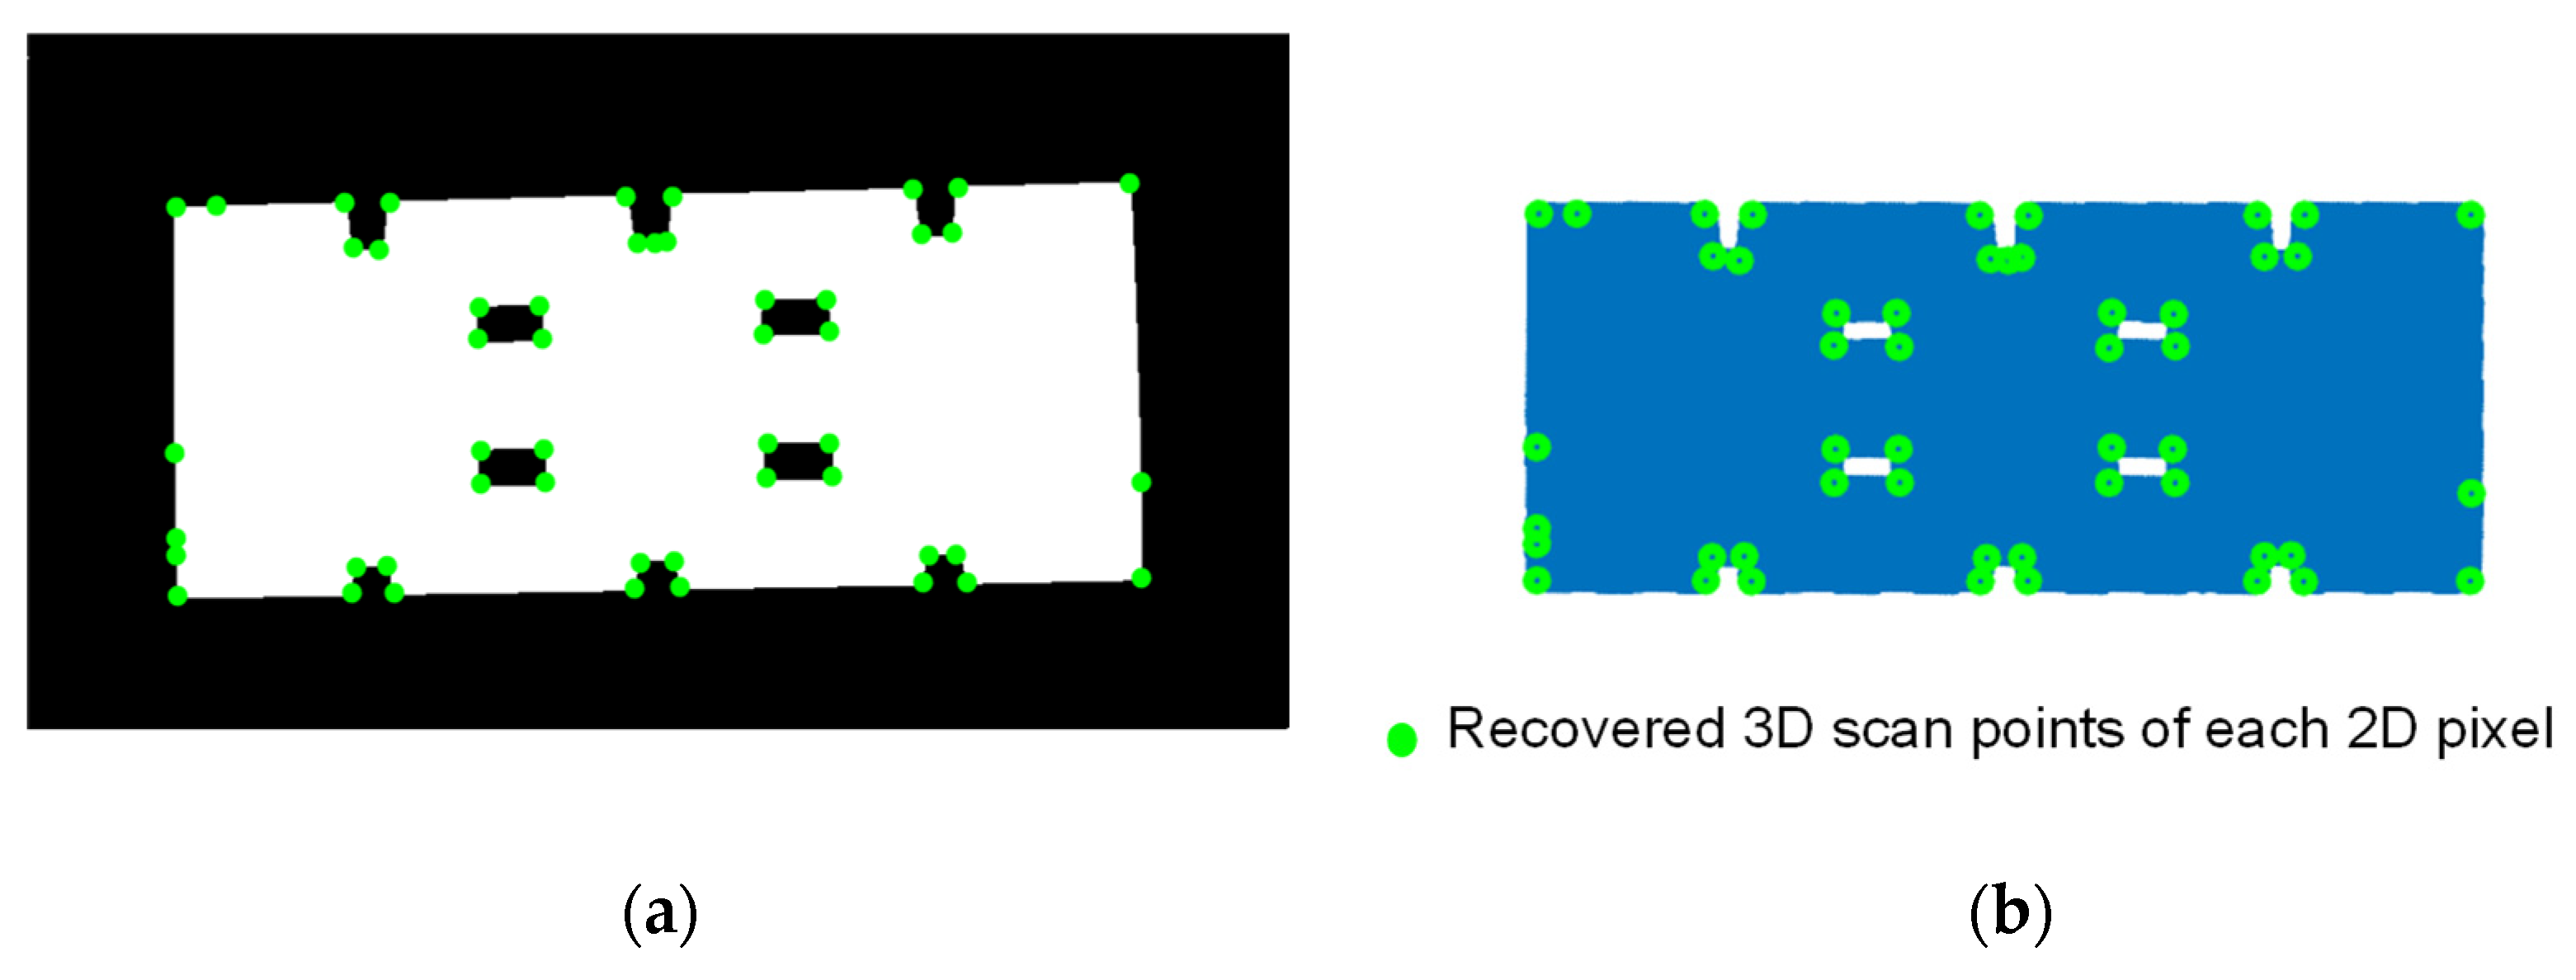
3.3. Extraction of Corner Points from Range Image

This step aimed to extract comer points from the range image by a Harrier corner detector, which contained (1) the data pre-processing of the range image, (2) the extraction of corner points, and (3) the noise filtering of extracted corner points.
Step 1—data pre-processing of range image: This step aimed to enhance the generated range images by applying filtering and smoothing techniques to remove noise. The Gaussian filter [41] was employed to eliminate high-frequency noise in the 2D image. It was assumed that the noise in the range images followed a Gaussian distribution. The Gaussian filter operates by calculating a weighted average of eight-pixel values surrounding each pixel based on a Gaussian function. Figure 7a illustrates the range image after the application of the Gaussian filter. Following the Gaussian filter, the range image was transformed into a binary image to simplify the data and emphasize the contours of the target objects. Pixels with a grey value greater than or equal to the user-defined threshold were considered to belong to a specific object, and their grey value was set to 255. Pixels with a grey value below the threshold were excluded from the object area and assigned a grey value of 0, representing the background or exceptional object area. Figure 7b demonstrates the binary image after the transformation process.
Step 2—extraction of corner points: This step focuses on extracting the corner points on the top surface. Figure 8 illustrates the process for the extraction of the corner points. Firstly, the Harris corner detector was employed to identify the 2D pixels representing the corner points on the range image. Figure 8a shows the extracted 2D pixels representing the corner points on the range image based on the Harris corner detector. Then, the extracted 2D pixels could be recovered as 3D scan points based on the X, Y, and Z valves and corresponding to the 2D pixels, as illustrated in Section 3.2. Figure 8b shows the recovered 3D scan points of each 2D pixel.
Step 3—noise filtering of extracted corner points: After recovering the 3D scan points, it was observed that some scan points located on the edges were mistakenly identified as corner points due to the presence of mixed pixels. To address this issue, extracted corner scan points were further filtered as follows. Figure 9 shows the filtering of extracted corner points. First, the boundary points of the precast bridge slab were extracted based on the method presented by Kim et al. [22]. Figure 9a shows the extracted boundary points. Then, the extracted 3D scan points were further filtered using the criteria, as shown in Figure 9b. For each extracted 3D corner point, the nearest scan points within a user-defined radius ( R ) were found from the extracted boundary points. If the nearest scan points could be fitted as a line, the extracted 3D corner point was positioned along the edge and removed as noise. Otherwise, the extracted 3D corner point was kept as the actual corner point. Figure 9c shows the extracted 3D corner points after filtering.

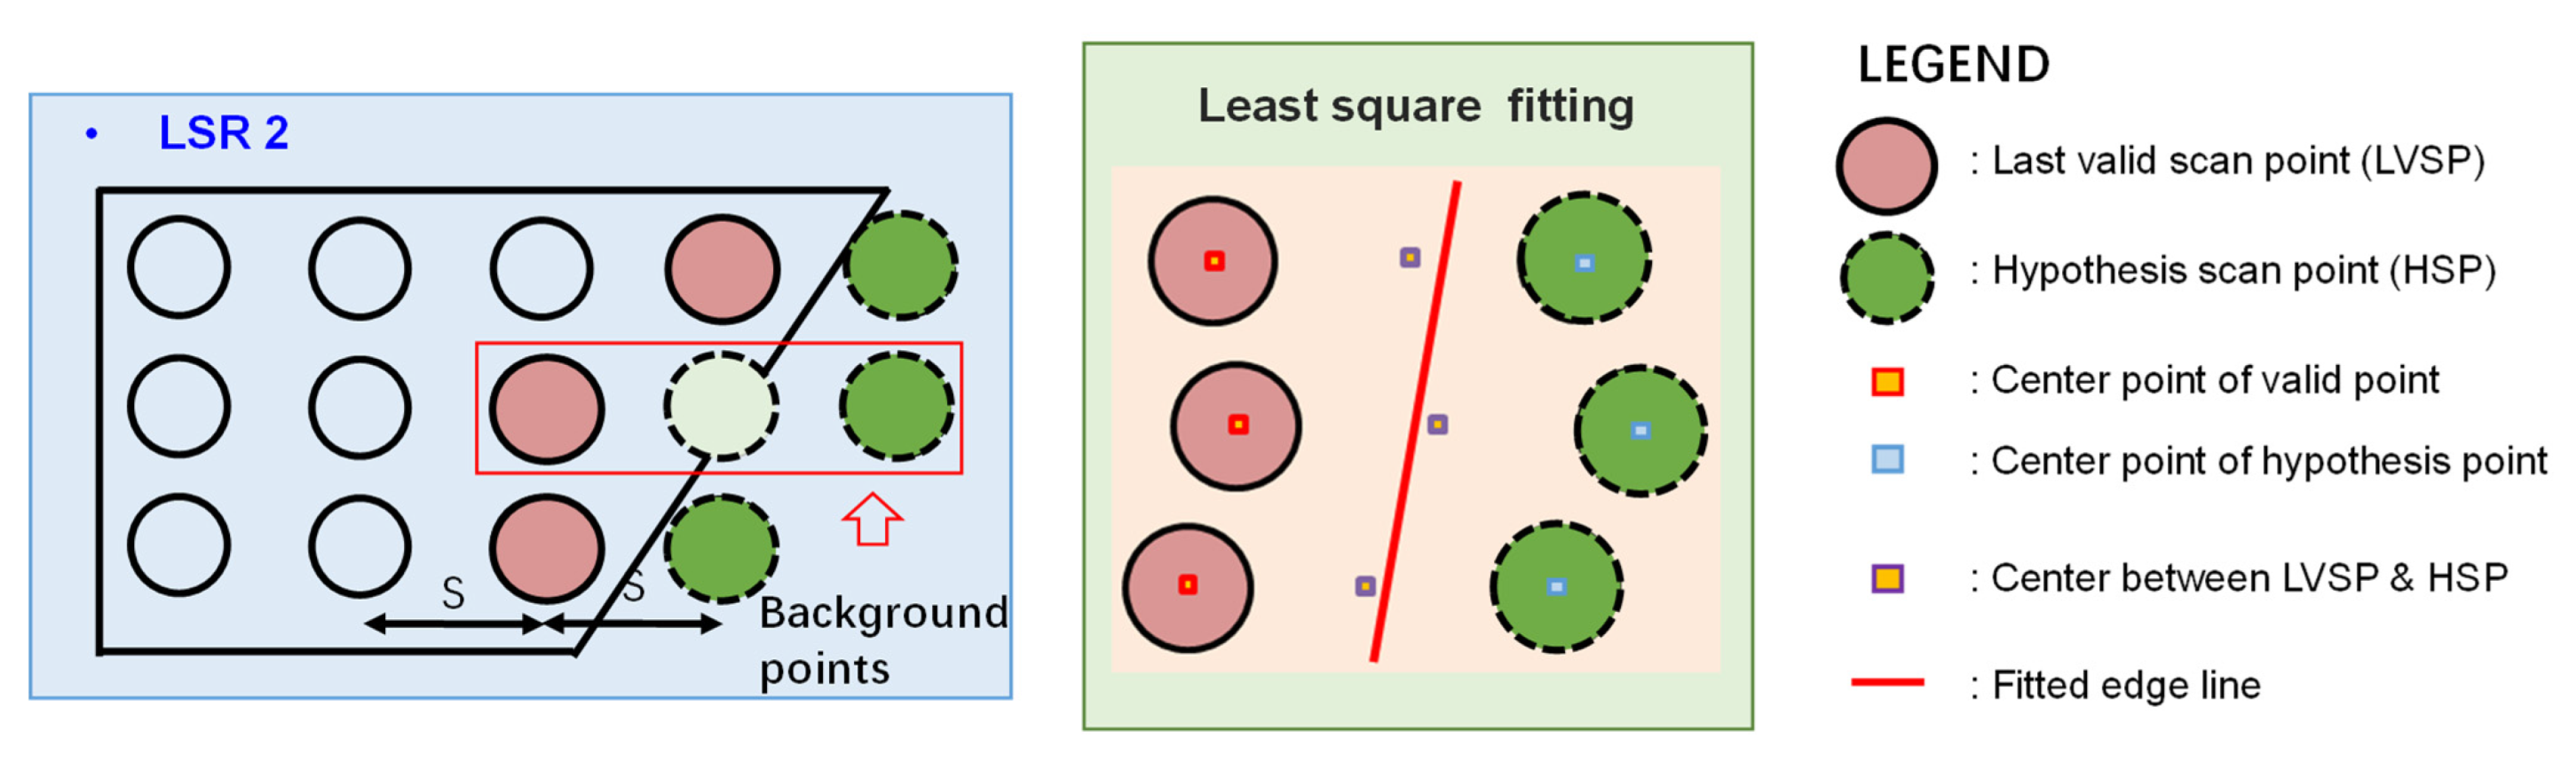
3.4. Dimension Estimation
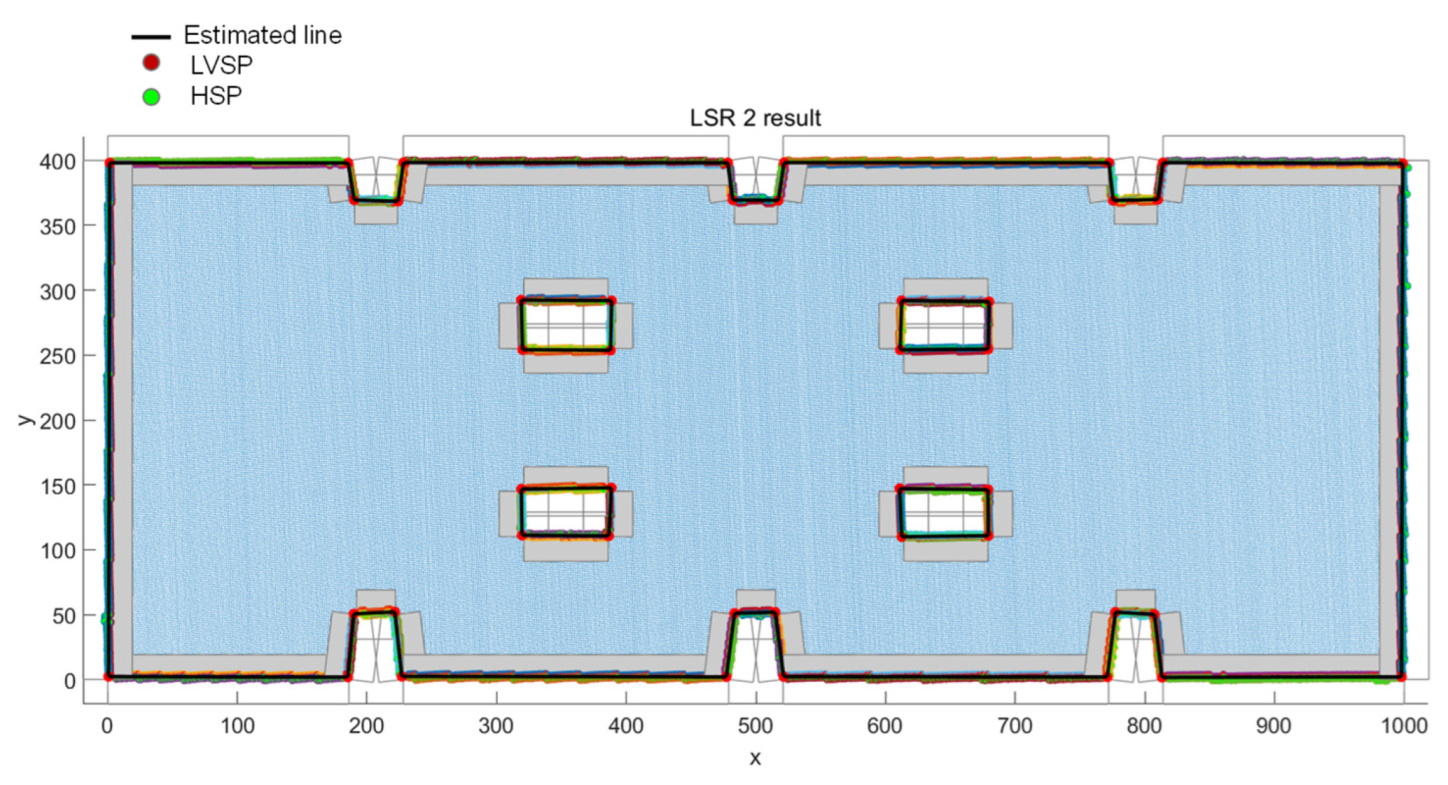
After extracting the corner points of the top surface on the precast bridge slab, the dimension estimation was conducted on the top surface by the LSR 2 algorithm proposed by Wang et al. [23]. Figure 10 shows the concept of the LSR 2 algorithm. Note that the extracted 3D corner points were regarded as an input instead of the as-designed model, which was matched with collected scan points for edge line estimation. The algorithm first identified the last valid scan points (LVSPs) that were positioned inside the edges, followed by the generation of hypothesis scan points (HSPs) (also called “background points”) next to the LVSPs. Finally, the centers between the center points of the LVSPs and the HSPs were computed and utilized to fit an edge line based on the least squares regression. Figure 11 indicates the edge line estimation results based on the LSR 2 algorithm. Note that the center points of the LVSPs and the HSPs were determined as the centers of their corresponding laser beams. The reason for adopting this algorithm was that it could estimate the parameters of edge lines with a high level of accuracy, even with a significant number of outliers.

4. Validation

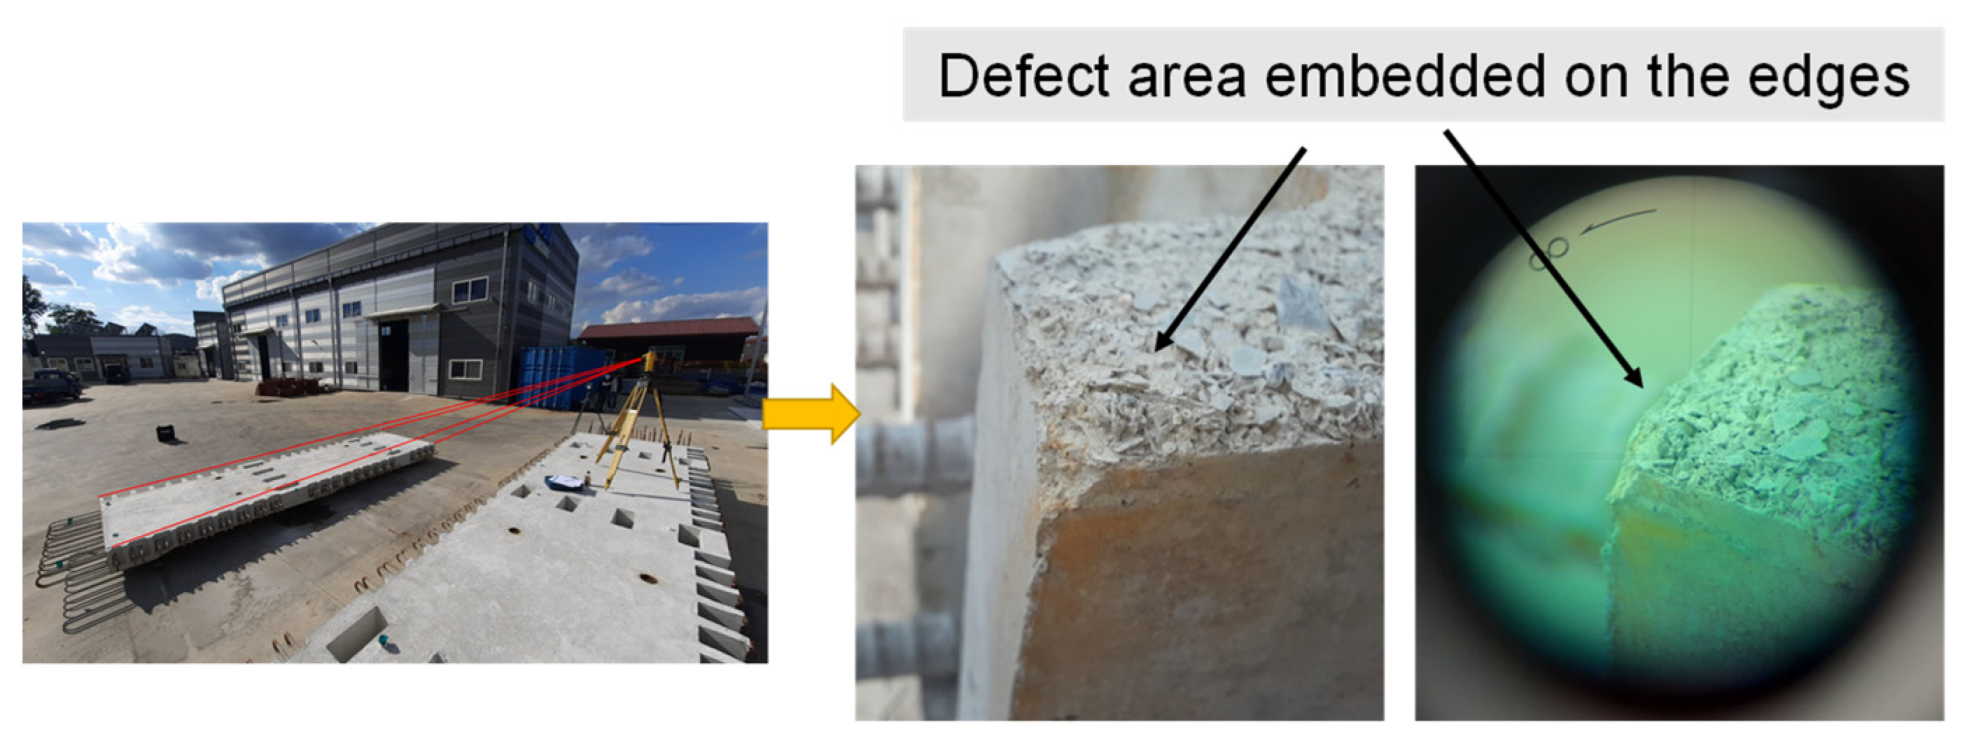
4.1. Experiment Specimen and Configuration

To verify the proposed edge line estimation method, validation experiments were conducted on both lab-scale and field-scale precast bridge slabs. Figure 12a,b show the geometrical information of the two precast bridge slabs. The lab-scale PC slab had dimensions of 1000 mm (length) × 400 mm (width) × 150 mm (height), containing four shear pockets with dimensions of 130 mm in length and 70 mm in width. The field-scale precast bridge slab was specifically designed with dimensions of 6330 mm in length, 1975 mm in width, and 287 mm in height. Additionally, there six shear pockets were embedded on its top surface, each measuring 420 mm in length and 170 mm in width.
Figure 12c,d show the dimensions and test configuration for the geometrical inspection of the precast bridge slab. The laser scanner was held by a framework and located above the center of the top surface of the precast bridge slab. From previous studies [22,23], it was found that higher angular resolutions and lower incident angles were likely to result in accurate edge line estimation results. In this study, the height of the laser scanner varied from 3 m to 3.5 m with a gap of 0.5 m. To capture the laser scanning data of the top surface, a phase-shift laser scanner, Faro S70, was utilized, which offered two distinct angular resolutions of 0.018° and 0.036°. In this study, the “dimension” of the checklist for a geometrical inspection was measured. As for the lab-scale specimen, 28 corners of the outer boundary and 16 corners of the shear pockets on the top surface were extracted. As for the field-scale slab, 182 corners of the outer boundary and 24 corners of the shear pockets were extracted. Then, the distance discrepancies between the actual corners and the estimated corners of the top surface were calculated to verify the proposed method. Note that the actual corners measured manually using a measurement tape were used as the ground truth.

4.2. Results

Table 2 shows the dimension errors under varying scanning heights and angular resolutions of the both lab-scale and field-scale precast bridge slab. Figure 13 shows the comparison of the dimension errors for the two precast bridge slabs. Here, the dimension error is defined as the distance discrepancy between the estimated dimension and the actual dimension that was measured manually using a measurement tape.
There were four observations: first, the average dimensional accuracy of the lab-scale precast bridge slab was 1.22 mm, ranging from 0.91 mm to 1.56 mm. For the field-scale precast bridge slab, the accuracy of the edge line estimation ranged from 2.40 mm to 3.99 mm, with an average value of 3.10 mm. These results indicate that the proposed method had the potential to provide accurate dimensional inspection results for precast bridge slabs. Additionally, the lab-scale precast bridge slab achieved more precise edge line estimation results compared to the field-scale precast bridge slab in most cases. This could be attributed to two factors. On the one hand, the field-scale precast bridge slab suffered from long scanning distances and high incident angles, which negatively impacted the accuracy of edge line estimation for dimensional inspection. On the other hand, the presence of defect areas on the field-scale precast bridge slab, as depicted in Figure 14, further complicated the accurate extraction of corners. Second, one interesting trend in Figure 13 was that the dimension errors of the shear pocket were lower than those of the outer boundary. It could be speculated that the shear pockets were positioned close to the center of the top surface, which had smaller incident angles and a higher scanning density compared to the outer boundary corners. Therefore, the shear pockets exhibited better dimensional accuracy in the dimensional inspection. Third, a positive correlation could be clearly seen between the dimension error and the increase in the angular resolution; it can be concluded that edge line estimation accuracy is largely affected by the number of scan points falling on the PC slab. For instance, the average dimension error of the field-scale PC slab increased from 2.67 mm to 3.52 mm as the angular resolution increased from 0.018° m to 0.036°. Fourth, another interesting finding was that the scanning height effect was not clearly observed for the edge line estimation. As the scan height decreased from 3.5 m to 3.0 m, the incident angle near the edges of the PC slab was enlarged, thereby decreasing the scanning density. Hence, there was no clear correlation between the scanning height and the edge line estimation accuracy. In order to ensure an accurate dimensional estimation, it was recommended to select high angular resolutions and lower incident angles to guarantee a high scan density. However, acquiring scan points with a high scanning density under high angular resolutions and lower incident angles was time-consuming. The tradeoff of scanning time and data quality could be investigated in a future study.

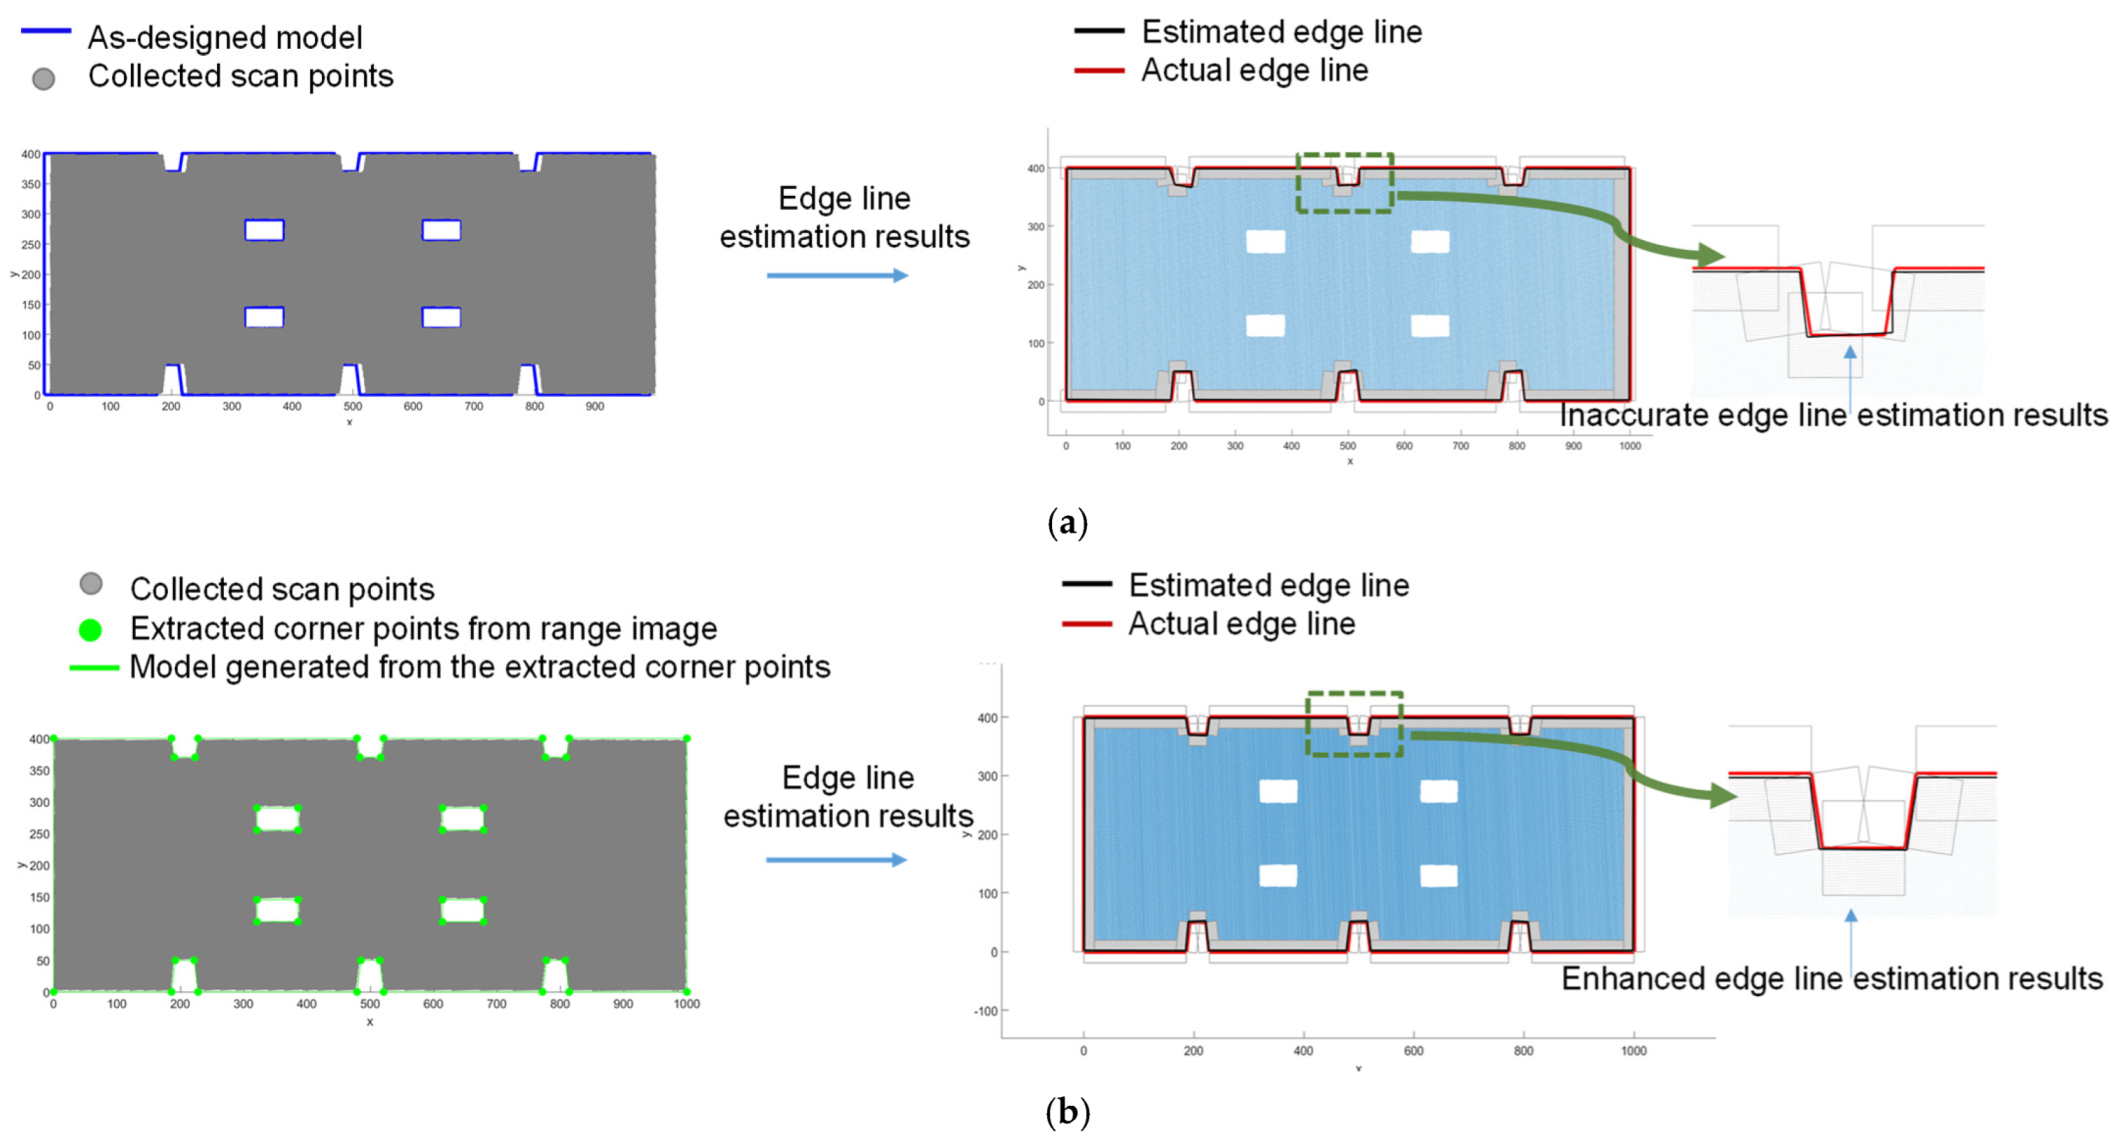
4.3. Comparison with Traditional Dimensional Inspection Methods

To further assess the efficiency and accuracy of the proposed method, a performance comparison test was conducted with both the laser scanning-based method and the direct range image-based method. Laser scanning-based methods performed a dimensional inspection based on point cloud data, which required the alignment of the as-designed model and the collected scan points. The direct range image-based method directly estimated the edge line based on corner points extracted from the range image. Here, the dimension error was defined as the distance discrepancy between the estimated dimension and the actual dimension that was measured manually using a measurement tape. Table 3 presents the comparison results among the three-dimensional inspection methods. The average errors in the edge-line estimation for the lab-scale precast bridge slab were found to be 1.96 mm and 6.26 mm for laser scanning-based and direct range image-based methods, respectively, which were considerably larger than the result (1.20 mm) obtained using the proposed method, as presented in Section 4.2. Similarly, the dimension errors for the dimensional inspection of field-scale precast bridge slabs were 11.27 mm and 11.38 mm for laser scanning-based and direct range image-based methods, respectively, both of which were significantly larger than the result (3.10 mm) achieved using the proposed method. These findings demonstrate that the proposed method outperformed traditional registration methods in terms of dimensional accuracy. This was because the proposed method required no alignment of scan points, and the as-deigned model avoided the inaccurate measurement caused by the alignment.
Figure 15 shows the trend of the comparison results among the three methods for both lab-scale and field-scale precast bridge slabs. The proposed method demonstrated the best performance in edge line estimation, followed by the laser scanning-based method, and the direct range of the image-based method performed the least effectively. The reasons for these observations are illustrated as follows: the laser scanning-based method required the matching of collected scan points with the as-designed model for edge line detection. However, inaccurate measurements were often observed due to the poor matching of scan points and the as-designed model, as illustrated in Figure 1a, thereby degrading edge line estimation accuracy. The direct range of the image-based method was susceptible to noise data such as mixed pixels, wherein noise data located near the edges could be erroneously identified as corner points for edge line estimation. Figure 16 shows the poor extraction of corner points from the direct range image caused by noise data. Compared to the dense and accurate point cloud data, the dimensional accuracy of the direct range image-based method alone was not subsequent for edge line estimation. It was also observed that the proposed method outperformed the laser scanning-based method by 38.7% and 71.7% for the lab-scale and field-scale precast bridge slabs, respectively. This was because the field-scale slab with cracks embedded in it was more likely to suffer from an inaccurate measurement caused by the poor matching of collected scan points and the as-designed model. Therefore, the proposed method had more potential to increase the accuracy of the dimensional inspection for field-scale precast bridge slabs.
From these results, it was demonstrated that the proposed method, which utilized both advantages of point cloud data and range images, was proven to be an accurate method for dimensional inspection.
Figure 17 shows the potential practical application of the proposed algorithm with the existing procedure and geometrical inspection of the prefabricated slab. First, the remote–control interface that controls the laser scanner remotely could be developed to implement scan data acquisition in an automatic manner. After scanning, scanning data could be transmitted to the computing server to process the data. Then, the dimensions of the PC element could be estimated based on the proposed range image-aided method for a geometrical inspection.

5. Conclusions

This study proposes a new edge line estimation algorithm that utilizes range images which are regarded as the input for edge line estimation, avoiding matching errors between the collected scan points and the as-designed model. Then, a series of tests were conducted on both lab-scale and field-scale precast slabs to investigate the feasibility of the proposed edge detection algorithm. The experimental results showed a promising accuracy of around 1.22 mm and 3.10 mm for lab-scale and field-scale precast bridge slabs, respectively, demonstrating the feasibility of the proposed image-aided geometrical inspection. In addition, comparison tests were conducted with traditional registration methods to further analyze the performance of the proposed technique in terms of edge line estimation accuracy. The comparison results demonstrate that the proposed technique yielded more accurate dimensional inspection results compared to the traditional registration methods. This showcases its great potential for application in both small-scale and full-scale prefabricated construction elements within the construction industry, particularly during the fabrication stage. However, there were several limitations. First, this study only analyzed the edge line estimation algorithms for the top surfaces of the precast bridge slabs. Further studies are required to investigate the range image-aided edge line estimation of other geometrical features and construction components. Second, this study focused only on the dimensional estimation for geometrical inspection. Investigations on other checklists such as “Straightness”, “Squareness”, and “Twist” for geometrical inspections are a future direction. Third, RFID tags have gained popularity when searching, identifying, and tracking information on construction components. Additionally, it should be noted that clipless RFID tags have broadened their implementation by reducing costs. The implementation of RFID tags on geomatical inspection to store information related to the dimension and type of the prefabricated slab could be a future direction to facilitate the automation process of geometrical inspections.

Author Contributions

Conceptualization, F.L., M.-K.K. and S.-H.S.; methodology, F.L., M.-K.K. and J.P.P.T.; software, F.L. and J.P.P.T.; validation, F.L., M.-K.K. and J.P.P.T.; formal analysis, F.L., M.-K.K. and J.P.P.T.; investigation, F.L., M.-K.K. and J.P.P.T.; resources, F.L., M.-K.K., J.P.P.T. and S.-H.S.; data curation, J.P.P.T.; writing—original draft preparation, F.L., M.-K.K. and J.P.P.T.; writing—review and editing, M.-K.K.; visualization, J.P.P.T.; supervision, M.-K.K. and S.-H.S.; project administration, M.-K.K., J.-O.S. and S.-H.S.; funding acquisition, M.-K.K., J.-O.S. and S.-H.S. All authors have read and agreed to the published version of the manuscript.

Funding

This research was supported by (1) the “National R&D Project for Smart Construction Technology (No. 21SMIP-A156887-02)” funded by the Korea Agency for Infrastructure Technology Advancement under the Ministry of Land, Infrastructure and Transport, and managed by the Korea Expressway Corporation, (2) the Chungbuk National University BK21 program (2021) and (3) the Humanities and Social Sciences Special Project founded by Hohai University (No. B220201111).

Institutional Review Board Statement

Not applicable.

Informed Consent Statement

Not applicable.

Data Availability Statement

The data that support the finding of this study are available on request from the corresponding author.

Conflicts of Interest

The authors declare no conflict of interest.

References

  1. Hossain, M.U.; Ng, S.T.; Antwi-Afari, P.; Amor, B. Circular economy and the construction industry: Existing trends, challenges and prospective framework for sustainable construction. Renew. Sustain. Energy Rev. 2020, 130, 109948. [Google Scholar] [CrossRef]
  2. Liu, Z.; Pypłacz, P.; Ermakova, M.; Konev, P. Sustainable construction as a competitive advantage. Sustainability 2020, 12, 5946. [Google Scholar] [CrossRef]
  3. Yuan, M.; Li, Z.; Li, X.; Luo, X.; Yin, X.; Cai, J. Proposing a multifaceted model for adopting prefabricated construction technology in the construction industry. Eng. Constr. Archit. Manag. 2023, 30, 755–786. [Google Scholar] [CrossRef]
  4. Department, E.P. Waste Data & Statistics. Available online: https://www.wastereduction.gov.hk/en/assistancewizard/waste_red_sat.htm (accessed on 8 July 2023).
  5. Jahan, I.; Zhang, G.; Bhuiyan, M.; Navaratnam, S.; Shi, L. Experts’ Perceptions of the Management and Minimisation of Waste in the Australian Construction Industry. Sustainability 2022, 14, 11319. [Google Scholar] [CrossRef]
  6. Du, J.; Zhang, J.; Castro-Lacouture, D.; Hu, Y. Lean manufacturing applications in prefabricated construction projects. Autom. Constr. 2023, 150, 104790. [Google Scholar] [CrossRef]
  7. Jo, S.; Lee, J.G.; Choi, J. A Framework of Automating Inspection Task Generation for Construction Projects. Korean J. Constr. Eng. Manag. 2023, 24, 40–50. [Google Scholar]
  8. Kwon, H.; Jeon, S.; Lee, J.; Jeong, K. Development of a Simulation Model for Supply Chain Management of Precast Concrete. Korean J. Constr. Eng. Manag. 2021, 22, 86–98. [Google Scholar]
  9. Gharehbaghi, V.R.; Kalbkhani, H.; Noroozinejad Farsangi, E.; Yang, T.Y.; Nguyen, A.; Mirjalili, S.; Málaga-Chuquitaype, C. A novel approach for deterioration and damage identification in building structures based on Stockwell-Transform and deep convolutional neural network. J. Struct. Integr. Maint. 2022, 7, 136–150. [Google Scholar]
  10. Moomen, M.; Siddiqui, C. Probabilistic deterioration modeling of bridge component condition with random effects. J. Struct. Integr. Maint. 2022, 7, 151–160. [Google Scholar] [CrossRef]
  11. Majidifar, S.; Hayati, M. Design of a sharp response microstrip lowpass filter using taper loaded and radial stub resonators. Turk. J. Electr. Eng. Comput. Sci. 2017, 25, 4013–4022. [Google Scholar] [CrossRef]
  12. Majidifar, S.; Makki, S.V. Dual band bandpass filter using multilayer structure. Appl. Comput. Electromagn. Soc. J. (Aces) 2015, 30, 1096–1101. [Google Scholar]
  13. Rezaei, A.; Yahya, S.I. A New Design Approach for a Compact Microstrip Diplexer with Good Passband Characteristics. ARO-Sci. J. Koya Univ. 2022, 10, 1–6. [Google Scholar] [CrossRef]
  14. Rezaei, A.; Yahya, S.I.; Noori, L.; Jamaluddin, M.H. Design of a novel wideband microstrip diplexer using artificial neural network. Analog Integr. Circuits Signal Process. 2019, 101, 57–66. [Google Scholar] [CrossRef]
  15. Hayati, M.; Majidifar, S.; Sobhani, S.N. Using a hybrid encoding method based on the hexagonal resonators to increase the coding capacity of chipless RFID tags. Int. J. Rf Microw. Comput. Aided Eng. 2022, 32, e23474. [Google Scholar] [CrossRef]
  16. Ma, Z.; Liu, Y.; Li, J. Review on automated quality inspection of precast concrete components. Autom. Constr. 2023, 150, 104828. [Google Scholar] [CrossRef]
  17. Building and Construction Authority, Singapore. Construction Quality Assessment System. Available online: https://www1.bca.gov.sg/docs/default-source/docs-corp-buildsg/quality/conquas-2022-r2-v5.pdf?sfvrsn=5886cff1_0 (accessed on 8 July 2023).
  18. Nahangi, M.; Yeung, J.; Haas, C.T.; Walbridge, S.; West, J. Automated assembly discrepancy feedback using 3D imaging and forward kinematics. Autom. Constr. 2015, 56, 36–46. [Google Scholar] [CrossRef]
  19. Liu, J.; Zhang, Q.; Wu, J.; Zhao, Y. Dimensional accuracy and structural performance assessment of spatial structure components using 3D laser scanning. Autom. Constr. 2018, 96, 324–336. [Google Scholar] [CrossRef]
  20. Yoon, S.; Wang, Q.; Sohn, H. Optimal placement of precast bridge deck slabs with respect to precast girders using 3D laser scanning. Autom. Constr. 2018, 86, 81–98. [Google Scholar] [CrossRef]
  21. Hodge, G.; Gattas, J.M. Geometric and semantic point cloud data for quality control of bridge girder reinforcement cages. Autom. Constr. 2022, 140, 104334. [Google Scholar] [CrossRef]
  22. Kim, M.; Sohn, H.; Chang, C. Automated dimensional quality assessment of precast concrete panels using terrestrial laser scanning. Autom. Constr. 2014, 45, 163–177. [Google Scholar] [CrossRef]
  23. Wang, Q.; Sohn, H.; Cheng, J.C. Automatic as-built BIM creation of precast concrete bridge deck panels using laser scan data. J. Comput. Civ. Eng. 2018, 32, 4018011. [Google Scholar] [CrossRef]
  24. Wang, Q.; Sohn, H.; Cheng, J.C. Development of high-accuracy edge line estimation algorithms using terrestrial laser scanning. Autom. Constr. 2019, 101, 59–71. [Google Scholar] [CrossRef]
  25. Truong-Hong, L.; Lindenbergh, R. Automatically extracting surfaces of reinforced concrete bridges from terrestrial laser scanning point clouds. Autom. Constr. 2022, 135, 104127. [Google Scholar] [CrossRef]
  26. Durbin, J.; Watson, G.S. Testing for serial correlation in least squares regression. I. In Breakthroughs in Statistics: Methodology and Distribution; Springer: Berlin/Heidelberg, Germany, 1992; pp. 237–259. [Google Scholar]
  27. Fischler, M.A.; Bolles, R.C. Random sample consensus: A paradigm for model fitting with. Commun. ACM 1981, 24, 381–395. [Google Scholar] [CrossRef]
  28. Yang, L.; Chen, Y.; Song, S.; Li, F.; Huang, G. Deep Siamese Networks Based Change Detection with Remote Sensing Images. Remote Sens. 2021, 13, 3394. [Google Scholar] [CrossRef]
  29. Yang, L.; Wang, L.; Abubakar, G.A.; Huang, J. High-Resolution Rice Mapping Based on SNIC Segmentation and Multi-Source Remote Sensing Images. Remote Sens. 2021, 13, 1148. [Google Scholar] [CrossRef]
  30. Kanopoulos, N.; Vasanthavada, N.; Baker, R.L. Design of an image edge detection filter using the Sobel operator. IEEE J. Solid-State Circuits 1988, 23, 358–367. [Google Scholar] [CrossRef]
  31. Rosenfeld, A. The max Roberts operator is a Hueckel-type edge detector. IEEE Trans. Pattern Anal. Mach. Intell. 1981, PAMI-3, 101–103. [Google Scholar] [CrossRef]
  32. Canny, J. A computational approach to edge detection. IEEE Trans. Pattern Anal. Mach. Intell. 1986, PAMI-8, 679–698. [Google Scholar] [CrossRef]
  33. Smith, S.M.; Brady, J.M. SUSAN-a new approach to low level image processing. Int. J. Comput. Vis. 1997, 23, 45–78. [Google Scholar] [CrossRef]
  34. Harris, C.; Stephens, M. A combined corner and edge detector. In Proceedings of the Alvey Vision Conference, Manchester, UK, 31 August–2 September 1988; pp. 147–151. [Google Scholar]
  35. Cooper, J.; Venkatesh, S.; Kitchen, L. The dissimilarity corner detector. In Proceedings of the Fifth International Conference on Advanced Robotics ‘Robots in Unstructured Environments, Pisa, Italy, 19–22 June 1991; pp. 1377–1382. [Google Scholar]
  36. Hsieh, P.; Lee, L.C.; Chen, N. Effect of spatial resolution on classification errors of pure and mixed pixels in remote sensing. IEEE Trans. Geosci. Remote Sens. 2001, 39, 2657–2663. [Google Scholar] [CrossRef]
  37. Brunelli, R. Template Matching Techniques in Computer Vision: Theory and Practice; John Wiley & Sons: Hoboken, NJ, USA, 2009. [Google Scholar]
  38. Hahsler, M.; Piekenbrock, M.; Doran, D. dbscan: Fast density-based clustering with R. J. Stat. Softw. 2019, 91, 1–30. [Google Scholar] [CrossRef] [Green Version]
  39. Zhang, C.; Kalasapudi, V.S.; Tang, P. Rapid data quality oriented laser scan planning for dynamic construction environments. Adv. Eng. Inform. 2016, 30, 218–232. [Google Scholar] [CrossRef] [Green Version]
  40. Bao, T.; Zhao, J.; Xu, M. Step edge detection method for 3D point clouds based on 2D range images. Optik 2015, 126, 2706–2710. [Google Scholar] [CrossRef]
  41. Deng, G.; Cahill, L.W. An adaptive Gaussian filter for noise reduction and edge detection. In Proceedings of the 1993 IEEE Conference Record Nuclear Science Symposium and Medical Imaging Conference, San Francisco, CA, USA, 31 October–6 November 1993; pp. 1615–1619. [Google Scholar]
Figure 1. Concepts of the proposed range image-aided method that generates and utilizes range images generated from point cloud data: (a) Inaccurate edge line estimation results caused by the poor matching between the as-designed model and the collected scan points (limitation associated with current edge line estimation); (b) Basic concept of the proposed range image-aided method and expected edge line estimation results.
Sustainability 15 12243 g001
Figure 2. Overall procedure of the proposed edge line estimation method.
Sustainability 15 12243 g002
Figure 3. Data pre-processing: (a) Original data; (b) Implementation results of DBSCAN algorithm; (c) Extracted scan points on the top surface based on the DBSCAN algorithm; (d) extracted scan points on the top surface after the coordinate transformation.
Sustainability 15 12243 g003
Figure 4. Simulation of margin points: (a) Detection of boundary points; (b) Definition of point-to-point distance and (c) Simulation of margin points using the point-to-point distance.
Sustainability 15 12243 g004
Figure 5. Creation of 2D pixels: (a) Generation of the 2D grids; (b) Range images generated by creating the 2D pixels.
Sustainability 15 12243 g005
Figure 6. Elimination of invalid vacant pixels (a) Distinction between valid vacant pixels and invalid vacant pixels; (b) Range image after eliminating invalid vacant pixels.
Sustainability 15 12243 g006
Figure 7. Data pro-processing of range image: (a) Range image after implementing Gaussian filter; (b) Binary image after transformation.
Sustainability 15 12243 g007
Figure 8. Extraction of corner points: (a) Extracted 2D pixels of corner points from range image; (b) Recovered 3D scan points of extracted 2D pixels.
Sustainability 15 12243 g008
Figure 9. Filtering of extracted corner points: (a) Extracted boundary points; (b) Criteria for filtering extracted 3D corner points; (c) Extracted 3D corner points after filtering.
Sustainability 15 12243 g009
Figure 10. Concept of the LSR 2 algorithm.
Sustainability 15 12243 g010
Figure 11. Edge line estimation results based on the LSR 2 algorithm.
Sustainability 15 12243 g011
Figure 12. Test configuration and dimensions of the precast bridge slab: (a) Dimensions of the lab-scale specimen; (b) Dimensions of the field-scale slab; (c) Test configuration for lab-scale specimen and (d) Test configuration for field-scale slab.
Sustainability 15 12243 g012
Figure 13. Comparison of the dimension errors of the lab-scale and field-scale slab: (a) Lab-scale slab; (b) Field-scale slab.
Sustainability 15 12243 g013
Figure 14. Defect area embedded on the edges of the field-scale PC slab detected from the perspective of the total station.
Sustainability 15 12243 g014
Figure 15. Comparison of the dimension errors of the lab-scale specimen and field-scale slab: (a) Lab-scale slab; (b) Field-scale slab.
Sustainability 15 12243 g015
Figure 16. Poor extraction of corner points from the range image caused by noise data.
Sustainability 15 12243 g016
Figure 17. Potential practical application of the proposed algorithm with an existing procedure for the geometrical inspection of prefabricated slab.
Sustainability 15 12243 g017
Table 1. The checklist for geometrical inspections and the corresponding tolerance levels applicable to prefabrication [17].
Categories Tolerance
Dimensions 4.5 m < Length ≤ 6 m: 12 mm
3 m < Length ≤ 4.5 m: 9 mm
Length ≤ 3 m: 6 mm
Straightness 4.5 m < Length ≤ 6m: 12 mm
3 m < Length ≤ 4.5 m: 9 mm
Length ≤ 3 m: 6 mm
Squareness Length > 1.8 m: 12 mm
1.2m < Length ≤ 1.8 m: 9 mm
Width ≤ 1.2 m: 6 mm
Twist Width ≤ 0.6 and Length ≤ 6 m: 6 mm
Others: 12 mm
Table 2. Results of dimension errors under a varying angular resolution and laser scanner heights of both the lab-scale and field-scale precast bridge slab.
Scan Height Lab-ScaleField-Scale
Angular ResolutionAngular Resolution
0.018°0.036°Ave.0.018°0.036°Ave.
Outer boundary3.0 m1.211.561.392.863.873.37
3.5 m1.091.461.282.753.993.37
Shear pocket3.0 m0.951.231.092.653.012.83
3.5 m0.911.341.132.403.212.81
Ave. 1.041.401.222.673.523.10
Table 3. Comparison results of two traditional edge line estimation methods compared to the proposed method.
Objects Methods Scan Height (m)
3.0 m3.5 m
Angular ResolutionAngular Resolution
0.018°0.036°0.018°0.036°Ave.
Lab-scaleLasser scanning-based 1.312.551.572.441.96
Direct range image-based 5.226.946.256.636.26
Propsed method 1.071.231.081.401.20
Field-scaleLasser scanning-based 8.9411.9110.0112.7311.27
Direct range image-based 10.2512.9210.2213.1411.38
Propsed method 2.763.442.583.603.10
Disclaimer/Publisher’s Note: The statements, opinions and data contained in all publications are solely those of the individual author(s) and contributor(s) and not of MDPI and/or the editor(s). MDPI and/or the editor(s) disclaim responsibility for any injury to people or property resulting from any ideas, methods, instructions or products referred to in the content.

