Article

Predicting Nutritional Quality of Dual-Purpose Cowpea Using NIRS and the Impacts of Crop Management

1
Regional Study Center for Improving Adaptation to Drought (CERAAS), Senegalese Institute of Agricultural Research (ISRA), Thies BP 3320, Senegal
2
Agricultural Research Center-Hays, Kansas State University, Hays, KS 67601, USA
3
Department of Animal Biology, Cheikh Anta Diop University of Dakar (UCAD), Km 1, Avenue Cheikh Anta Diop, Dakar BP 5005, Senegal
4
National Agricultural Research Center, Bambey BP 0053, Senegal
*
Authors to whom correspondence should be addressed.
Sustainability 2023, 15(16), 12155; https://doi.org/10.3390/su151612155
Submission received: 14 June 2023 / Revised: 1 August 2023 / Accepted: 7 August 2023 / Published: 9 August 2023
(This article belongs to the Section Sustainable Agriculture)

Abstract

:
Cowpea fodder has been one of the favored livestock forages for centuries in sub-Saharan Africa, particularly in Senegal. However, little research has been conducted on quantifying the nutritional quality of cowpea fodder because of the costly wet chemistry analysis. The main objective of this study was to develop predictive equations for a sustainable quantification of the nutritional quality of dual-purpose cowpea fodder using near infrared spectroscopy (NIRS) and to investigate the influence of cropping system, fertilizer, genotype, and their interaction on biomass yield and cowpea forage nutritional value. In this study, 120 samples from a dual-purpose cowpea variety trial were used to develop NIRS equations to estimate forage quality parameters including concentrations of crude protein (CP), acid detergent fiber (ADF), neutral detergent fiber (NDF), calcium (Ca), phosphorus (P), potassium (K), and iron (Fe). Partial least squares (PLS) regression generated prediction equations using NIRS wavelength measurements, and reference wet chemistry analysis from calibration samples were developed. The PLS prediction equations for the different forage quality parameters had an R2 of calibration 0.94, 0.93, 0.88, 0.63, 0.69, 0.87, and 0.94 for CP, ADF, NDF, Ca, P, K, and Fe, respectively. Using these prediction equations, correlation of the predicted values of the calibration subset and the prediction test subset resulted in significant positive relationships, with R2 of 0.83, 0.74, 0.70, 0.63, 0.59, 0.75, and 0.83 for CP, ADF, NDF, Ca, P, K, and Fe, respectively. The corresponding RMSE of these relationships was 0.91, 2.68, 3.45, 0.23, 0.06, 0.11, and 100 for CP, ADF, NDF, Ca, P, K, and Fe, respectively. The range and mean concentrations of the calibration subset overlapped with that of the prediction subset for all parameters evaluated. Cross-validation procedures indicated good correlations between wet chemistry analysis and NIRS forage quality estimates. Results of the second experiment showed that the cropping system had no significant effect on cowpea forage yield and nutritive value. However, cowpea variety and fertilizer, both individually and their interaction, had a significant effect on fodder yield and cowpea forage quality. We conclude that the NIRS calibration equations developed can be used to accurately predict the cowpea forage quality parameters evaluated in this study.

1. Introduction

Cowpea (Vigna unguiculata (L.) Walp) is among the most important legume crops grown worldwide, with much of the current production in sub-Saharan Africa (SSA) [1]. It is native to the African continent and contributes to food security in SSA immensely because cowpea’s entire aerial section (grain, green pods, and leaves) is edible [2]. The current estimated worldwide land used for cowpea production is about 14.5 million hectares [3], with approximately 80% cultivated cowpea acreage (11.4 million hectares) located in West and East Africa [4]. However, cowpea yields in SSA remain very low due to poor soils, low inorganic fertilizer or manure inputs, and the lack of improved varieties [5].
Cowpea’s drought tolerance, nitrogen (N) fixing ability, adaptability to different cropping systems, and nutritional and economic value make it a suitable crop for smallholder farmers with limited resources, who are mainly located in the semi-arid regions of West Africa [6]. Cowpea serves a dual-purpose role as a source of feed for livestock and a food and protein source for human consumption [7]. In the semi-arid regions in West Africa, cowpea has been an integral part of traditional cropping systems, where grains (green or dry) are used as food and haulms are fed to livestock as nutritious fodder [8].
In Senegal, cowpea mainly grows in low-rainfall regions (Louga, Thies, and Diourbel) as it requires only a short duration from planting to harvest [9]. Cowpea’s adaptation to sandy and infertile soils is another trait marking its potential adaptation as an important crop in Senegal and the surrounding regions [10]. Cowpea fodder has been one of the favored livestock forages for centuries, and its succulent leaves and immature pods are consumed as vegetables in SSA, particularly in Senegal [11]. The sale of cowpea forage is a good source of income for farmers in regions with greater demand for livestock fodder [12].
Cowpea fodder is a great source of protein as it may contain up to 19% crude protein on a dry matter basis [13]. However, few research efforts have been conducted in quantifying the nutritional quality of cowpea fodder in Senegal and most regions of West Africa because of the costly wet chemistry analysis, which is not sustainable. Recently, near infrared spectroscopy (NIRS) has been used to determine the nutritive value of many forage crops and offers some advantages, such as high throughput, less sample preparation, ease of use, sustainability, and non-destructivity [14,15]. The main objective of this study was to contribute to the improvement of food and fodder in Senegal by developing predictive equations for the nutritional quality of dual-purpose cowpea fodder using NIRS data and to investigate the influence of the cropping system, fertilizer, genotype, and their interactions on biomass yield and cowpea forage nutritional value.

2. Materials and Methods

2.1. Location and Experimental Design

Cowpea fodder samples used in this study were collected from a cowpea variety trial (Experiment 1) comprising 20 cowpea varieties (C1 to C20) and a second study (Experiment 2) comprising cropping system × genotype × fertilizer trial, which had 10 cowpea varieties (Table 1). These field experiments were conducted near the National Center for Agronomic Research (CNRA) in Bambey, Senegal (14.709874 N and −16.481225 W). The soil types in Bambey are ferruginous tropical sandy soils rich in iron and slightly leached.
The experimental design of the first study, cowpea variety trial, was a split-plot arrangement with three replications in randomized complete blocks. The main plots were fertilizer treatments, and cowpea varieties were assigned to the subplots. The fertilizer treatments were of two levels, unfertilized control and recommended NPK dose (9 kg N ha−1; 30 kg P2O5 ha−1; 15 kg K2O ha−1). The N fertilizer source used in the study was urea (46-0-0); the P fertilizer source was di ammonium phosphate (0-25-0); and the K fertilizer source was muriate of potash (0-0-61). Each main plot was subdivided into 20 subplots, corresponding to the 20 cowpea varieties. Data from this first experiment were mainly used to develop NIRS to wet chemistry nutritive value prediction equations.
The second experiment was a split–split design with the main plots assigned to cropping system of intercropped cowpea or pure cowpea. Subplots were the first 10 varieties of cowpeas in Table 1, and sub-subplots were five fertilizer management treatments. Fertilizer treatments were as follows: T1 (control); T2 (30 kg P2O5 ha−1 only); T3 (30 kg N ha−1, 30 kg P2O5 ha−1, and 30 kg K2O ha−1); T4 (15 kg N ha−1, 15 kg P2O5 ha−1, 15 kg K2O ha−1); and T5 (2.5 Mg ha−1 manure + 30 kg ha−1 each of NPK). Data from this second experiment were used to study management, genotype, and fertilizer effects on cowpea forage yield and nutritional value.
The first experiment had only two factors, variety and fertilizer, and the second study had three factors: cropping systems; variety; and fertilizer. Even though the two experiments were independent, in a way, the first experiment is a subset of the second study because the second study included the fertilizer and variety factors (plus cropping systems) in its design. Therefore, in this current paper, we addressed the impact of cropping system, variety, and fertilizer on forage nutritive quality from the second study that has more factors, and we used the data from the first study (mainly) to develop predictive models.

2.2. Experimental Study Management and Sample Collection

Experimental plots were cleaned by plowing and harrowing to about 15 cm deep with a tractor and incorporating previous crop residue. The crop was grown strictly under rainfed conditions with millet as the previous crop. Sowing was carried out after July 15 when enough rainfall (>13.5 mm) had been received. Cowpea was planted at a seeding rate of 40,000 seed ha−1 and at a spacing of 50 cm × 50 cm. Mechanical and manual weeding were carried out to control weeds as needed. Fertilizer treatments were applied 25 days after sowing.
At physiological maturity (RH Zadoks growth stage when 80% of matured pods have turned color), cowpea pods, grain, and fodder were hand harvested from 40 plants in each plot and oven dried for 2–3 days at 60 °C to a constant weight. Pods were separated from the plants, shelled, and weighed. The remaining plant biomass was weighed and recorded as fodder from each plot. The dried cowpea forage samples were then divided into two subsamples: one subsample ground using a Wiley Mill (Thomas Scientific, Swedesboro, NJ, USA) to <2 mm screen used for reference wet chemistry analysis; and the other ground using a Cyclone Sample Mill (UDY CORPORATION, Fort Collins, CO, USA) to <1 mm for the collection of NIRS data.

2.3. Collection of Spectra Data

Cowpea forage samples (size < 1 mm) weighing 5 g were transferred into a sample cup and scanned in a Foss NIRSystem equipped with a sample transport module and a small ring cup used to hold the samples during scanning. Data from reference wet chemistry (RWC) analysis of the 2-mm samples were entered into the NIRS database to derive a relationship with the absorbance spectra. The reflectance spectra were taken in the 400 to 2500 nm region and recorded as log(1/R) at 2 nm intervals (Figure 1). Characteristics of the NIRS region include that it is very broad, highly overlapped, and visually difficult to distinguish [14,16]. WinISI II version 1.5 spectral analysis software (InfraSoft International, Port Matilda, PS, USA) was used to scan and analyze.

2.4. Wet Chemistry Analysis

All 120 dual-purpose cowpea forage samples from the cowpea variety and fertility study were sent to a commercial laboratory for wet chemistry analysis to determine forage nutritional quality parameters including crude protein (CP), acid detergent fiber (ADF), neutral detergent fiber (NDF), calcium (Ca), phosphorus (P), potassium (K) and iron (Fe). The CP, NDF, ADF, and minerals element content (Ca, K, P, and Fe) were calculated on a dry matter basis. Briefly, CP was determined using a combustion procedure that result in measurement of sample nitrogen content [17]. The nitrogen percentage was then multiplied by 6.25 to determine the protein concentration [18]. The NDF and ADF concentrations of each sample were determined with the ANKOM 200/220 Fiber Analyzer based on the standard procedures provided by ANKOM Technology (Fairport, NY, USA) [19]. The concentrations of Ca, P, K, and Fe in the cowpea forage samples were determined using an inductively coupled plasma-atomic emission spectroscopy (ICP-AES) after the samples were digested with a nitric–perchloric acid mixture [20,21].

2.5. Near Infrared Spectra Model Calibration and Validation

The near infrared spectra models and the establishment of the local equation for the quantitative analysis of each forage nutritive value parameter were developed with the 120 fodder samples using the modified partial least squares (MPLS) regression and cross-validation techniques. These techniques were used to calculate the correlation between laboratory and spectral data. Outliers were excluded by MPLS as well. The center and select methodology (CSM) was used to choose the 50 calibration subsamples. The center methodology placed all scanned 120 cowpea fodder samples in mathematically similar groups around an average or mean scan. The selection method mathematically chose samples to represent a specific group. Different wave length intervals were used to generate the calibration equations for the chemical components using the selected 50 subsamples. The remaining samples not chosen for calibration equations (70 samples in the case) were used for the prediction of nutritional compositions of cowpea forage samples.
When using NIR spectroscopy, excessive background often exists in the NIR spectra. When necessary, a weighted multiplicative scatter correction (Weighted MSC), normal multiplicative scatter correction (Normal MSC), or detrend (DT) math treatment was applied to correct the scattering effect which optimizes the multivariate regression equations [22]. The mathematical treatment is given by the expression: D, G, S1, S2, where D refer to the derivative order number, i.e., 0 for no derivative operation, 1 for the first derivative and so on; G is gap, the number of data points over which derivation is computed; S1 is the number of data points in the first smoothing; and S2 is the number of data points in the second smoothing. S2 is set at 1 in the case of no second smoothing [23]. The collected spectra data were transformed with several pretreatments before the calibration process. The results were then applied to produce a calibration equation for each parameter, which was then tested on the entire set of forage samples. Using this process, we validated the models used and checked their prediction capacities.
The calibration model was evaluated using statistical parameters including the coefficient of determination in calibration (R2c), standard error of calibration set (SEC), standard error of cross validation (SECV), correlation coefficient in cross validation (1-VR), and the ratio of prediction to standard deviation (RPD). The optimum calibrations were selected based on minimizing SEC and SECV. R2c is used as an excellent indicator of robustness and model accuracy [24,25]. The best models obtained were also selected for each constituent based on the highest R2c.

2.6. Data Analysis

Data analysis of the first Experiment was conducted in SAS. Cowpea genotype, fertilizer treatment, and their interaction effects on forage nutritive value were analyzed using PROC MIXED procedure. Each response variable (CP, ADF, NDF, Ca, P, K, and Fe) was modeled against fixed variables of genotype, fertilizer, and their interaction with replication as a random effect variable. Genotype × fertilizer interaction was not significant, and data from the first study were used to develop the NIRS prediction model. The dataset from 20 cowpea varieties helped to capture a range of variability in nutritive value among cowpea genotypes used in Senegal. Prediction of forage nutrient value from the NIRS equations was conducted using regression. The regression analysis was conducted after a correlation analysis so that the correlated parameters could be included in the model. Calibration and prediction of databases were conducted using MPLS from NIRS. Descriptive analysis was conducted using PROC MEANS procedure in SAS ver. 9.4 (SAS Institute, 2012, Cary, NC, USA) to compare forage nutritive value from wet chemistry analysis with that predicted with NIRS.
Data analysis for Experiment 2 was also conducted in SAS. Cropping system, cowpea genotype, fertilizer treatment, and their interaction effects on forage yield and forage nutritive were analyzed using PROC MIXED procedure. Each response variable (CP, ADF, NDF, Ca, P, K, and Fe) was modeled against fixed variables of cropping system, cowpea genotype, fertilizer treatment, and their interactions, with replication as a random effect variable. For a significant (α = 0.05) main effect, a mean separation test was conducted using Tukey’s honestly significant difference.

3. Results and Discussion

3.1. NIRS Prediction Equations against Wet Chemistry Analysis

Results revealed that the variability using the reference data of the studied parameters fit within the range of variation of these parameters estimated using NIRS prediction equations (Table 2 and Table 3). For example, the mean ± SD for CP concentration of the full set using RWC analysis and NIRS prediction equation were both 13.6 ± 2.5%. Overall, there was a strong similarity between the values of the forage quality parameters predicted by NIRS and those measured using the RWC method, with Ca and P measures showing the weakest relationship. The results agreed with those reported by Harris et al. [26] when comparing NIRS and wet chemistry methods for the nutritional analysis of horse hay. Comparable accuracy and reproducibility for both approaches have also been reported by Williams and Sobering [27].
Recently, prediction of forage quality parameters for several forage crops has been investigated using NIRS [15]. The NIRS technique is fast and reliable compared with traditional analytical methods as it integrates laboratory value with spectral information [14]. However, some variables may differ significantly between the NIRS and RWC methods due to the presence of complex high-molecular-weight organic compounds [28]. Spectroscopic information of the same sample may differ due to differences in particle size and moisture content, or due to presence of other biochemical compounds [29]. Based on the results that were found from both methods (RWC and NIRS prediction equations), the cowpea forage samples had wide ranges in the mineral composition and high SD values for the studied elements. That wide range observed in the mineral composition values can be explained by the diversity of the legume species, stages of maturity at sampling, and differences in plant parts used, i.e., leaves versus stems [30].

3.2. NIRS Models Accuracy: Calibration and Cross Validation

Based on the spectral variability and the outliers pass, 1 sample was deleted for the calibration of P and K, 2 for CP, ADF and Fe, and 3 for NDF out of the 50 samples of cowpea originally selected for calibration (Table 4). The NIRS calibration performance for CP, ADF, NDF, K, and Fe were considered great with high R2c of 0.94, 0.93, 0.88, 0.87, and 0.94, respectively, and medium-to-low R2c for Ca (0.63) and P (0.69). The high R2c (>0.8) found for almost all the variables in this study except Ca and P indicated good prediction from the NIRS calibration models developed in the present study. The SEC values were low for all constituents. According to Hermansen et al. [31], the most accurate models are those that have a high R2c and RPD and low SEC. Similarly, Lebot et al. [32] classified the use of R2c for NIRS models and suggested that models with R2c values of 0.66 to 0.81 can only be used for screening and approximate applications (quantitative predictions). However, 0.83 > R2c > 0.90 can be used for many applications, while models with values of 0.92–0.96 are suitable for most applications, including quality assurance, and models with R2c > 0.98 are usable in any application.
In the current study, the result of R2c for CP, ADF, and Fe were in the range of 0.92–0.96; NDF and K were in the range of 0.83 to 0.90; and the models for Ca and P had R2c values between 0.66 and 0.81. According to Fagan et al. [33], a model is considered good enough to predict a particular quality parameter of samples when the R2c is around 0.90, which was the case for most variables in this study. The R2c values found in the current study for CP and ADF were greater (R2c > 0.9) than those for the NDF constituents (R2c < 0.9), which was in agreement with previous studies [34]. The CP content may be the most widely measured variable in forage and feedstuffs. Previous studies have reported that CP concentrations in forages could be well quantified by NIRS [35]. A higher prediction accuracy using NIRS for CP in comparison to the other parameters was also reported by García and Cozzolino [36], which suggests that the prediction equation developed in the current study can accurately predict the CP concentrations of cowpea samples.
The NDF and ADF contents affect the intake and digestibility of forage by livestock, which were considered to be two important limited factors for the estimation of the nutritive qualities of feed and forage [14]. Previous studies showed that NDF and ADF concentrations could be well predicted by NIRS [36], but in the current study, the NIRS model constructed for NDF (R2c = 0.88) was less accurate than that for ADF (R2c = 0.93). This result differs from those previously reported by Despal et al. [37] in different fiber source feeds (Napier grass, natural grass, rice straw, corn stover, and corn husk) and Rushing et al. [35], who found a more accurate model for predicting NDF than for ADF. Lower prediction accuracies using NIRS have been reported by Hoffman et al. [38], but this time for both variables (NDF and ADF). Asekova et al. [15], in their studies argue, that some calibrations with R2c < 0.7 may only be useful for screening. However, the R2c values of CP, ADF, NDF, K, and Fe in the present study are large enough to allow good estimates of these parameters using NIRS, thus rapidly predicting the nutritive value of cowpea forage.
Overall, it appears that the efficiency of the NIRS in predicting forage quality differs from one parameter to another [39]. Even though the R2c value is a great statistical indicator by which to assess the accuracy of the calibration model, it is not the best indicator for this purpose, as it depends on the range [40]. Thus, the wide range observed in the mineral composition values of the studied elements and within certain parameters in terms of concentration can be explained by the diversity of the leguminous species, the stages of maturity at the time of sampling, and the differences in the plant fractions (leaves versus stems) used [31]. To overcome the shortcoming of the same sample giving different spectral information due to its size, moisture, or mixtures, some authors have proposed that better calibration equations may be obtained by using individual species or groups of similar forage species instead [23]. For example, the predicted CP values in the current study are in the range of 9.1% to 17.9% (Table 3), which is different from what other researchers, namely, Okonya and Maass [41], observed, although they were working with different varieties in sole-cropped cowpea, which ranged from 29.4 to 34.3%. This shows that the nutrient content can also be influenced by environmental factors such as soil fertility, the amount of available assimilates, the maturity at harvest, and the ability of the individual variety to develop a symbiotic relationship with the nitrogen-fixing bacteria in the root nodules [42]. It was reported by Towett et al. [43], in their studies in Tanzania, that cowpea fodder samples from Majimoto (location 1) had the lowest average CP content, while samples from Arusha (location 2) had the highest. Additionally, the average CP content of the second harvest was found to be the lowest, while the fifth harvest had the highest average CP content.
The performances of the cross-validation sets, expressed as “1-VR” and “SECV”, are also shown in Table 4. The highest SECV of 3.57 was obtained for ADF, while the 1-VR was very poor for Ca (0.36) and P (0.44). The prediction capacity of the model obtained was also evaluated with the RPD. It represented the ability of the NIRS model to predict a substance. The values obtained for RPD were between 1.2 for Ca and 2.0 for CP, ADF, and Fe. According to Despal et al. (2020) [37], an RPD value of more than 2 was categorized as a relevant prediction of NIRS. The RPD result for NDF was greater than 2 (RPD = 2.3), equal to 2 for CP, ADF, and Fe (RPD = 2.0), and <2 for Ca, P, and K. Though not measured, the low RPD found in the prediction of Ca, P, and K (RPD < 2) in this study could be due to the presence of polyvalent compounds that can alter the absorption bands of these variables. Five suggested categories of prediction accuracy using RPD values are as follows: (1) RPD < 1.5 indicates an unusable equation; (2) 1.5 < RPD < 2.0 indicates the ability of prediction to distinguish between high and low values; (3) 2.0 < RPD < 2.5 indicate that the model produced an “approximate” quantitative prediction; (4) 2.5 < RPD < 3.0 reflected a “good” quantitative prediction; and (5) an RPD > 3.0 indicated an “excellent” quantitative prediction (Williams, 2001) [44].

3.3. Correlation between RWC and NIRS Prediction

The calibration and prediction points for CP, ADF, NDF, K, and Fe are relatively close to each other, with a good coefficient of determination (R2 = 0.70–0.83) between the RWC analysis and the NIRS prediction methods (Figure 2 and Figure 3). As for P and Ca, the calibration and prediction points do not fit so well, which is reflected in the R2 values of the calibration and prediction models (R2 = 0.59 and 0.63 for P and Ca, respectively). The correlation equations between the predicted and measured concentrations for CP, ADF, NDF, Ca, P, K, and Fe have corresponding RMSEs of 0.91, 2.68, 3.45, 0.23, 0.057, 0.106, and 100.66, respectively. The precision with which the NIRS predicted values matched the RWC analysis using results from the remaining 70 cowpea samples confirmed that the validation was as precise as those obtained by other authors [15,23,45,46] using forage legumes NIRS and wet chemistry analyses (R2 close to 1). Using the criteria, the predictive ability of NIRS equation models expressed by lower SEC and SECV with relatively high R2c and 1–VR values was obtained for CP, ADF, NDF, and Fe in this study. Similar results were obtained by Asekova et al. [15] and by Padhi et al. [47] regarding reliable prediction using NIRS to predict nutritional value of forage. However, moderate useful calibration equations and predictive ability were found for the Ca, P, and K models in the present study (Table 4).

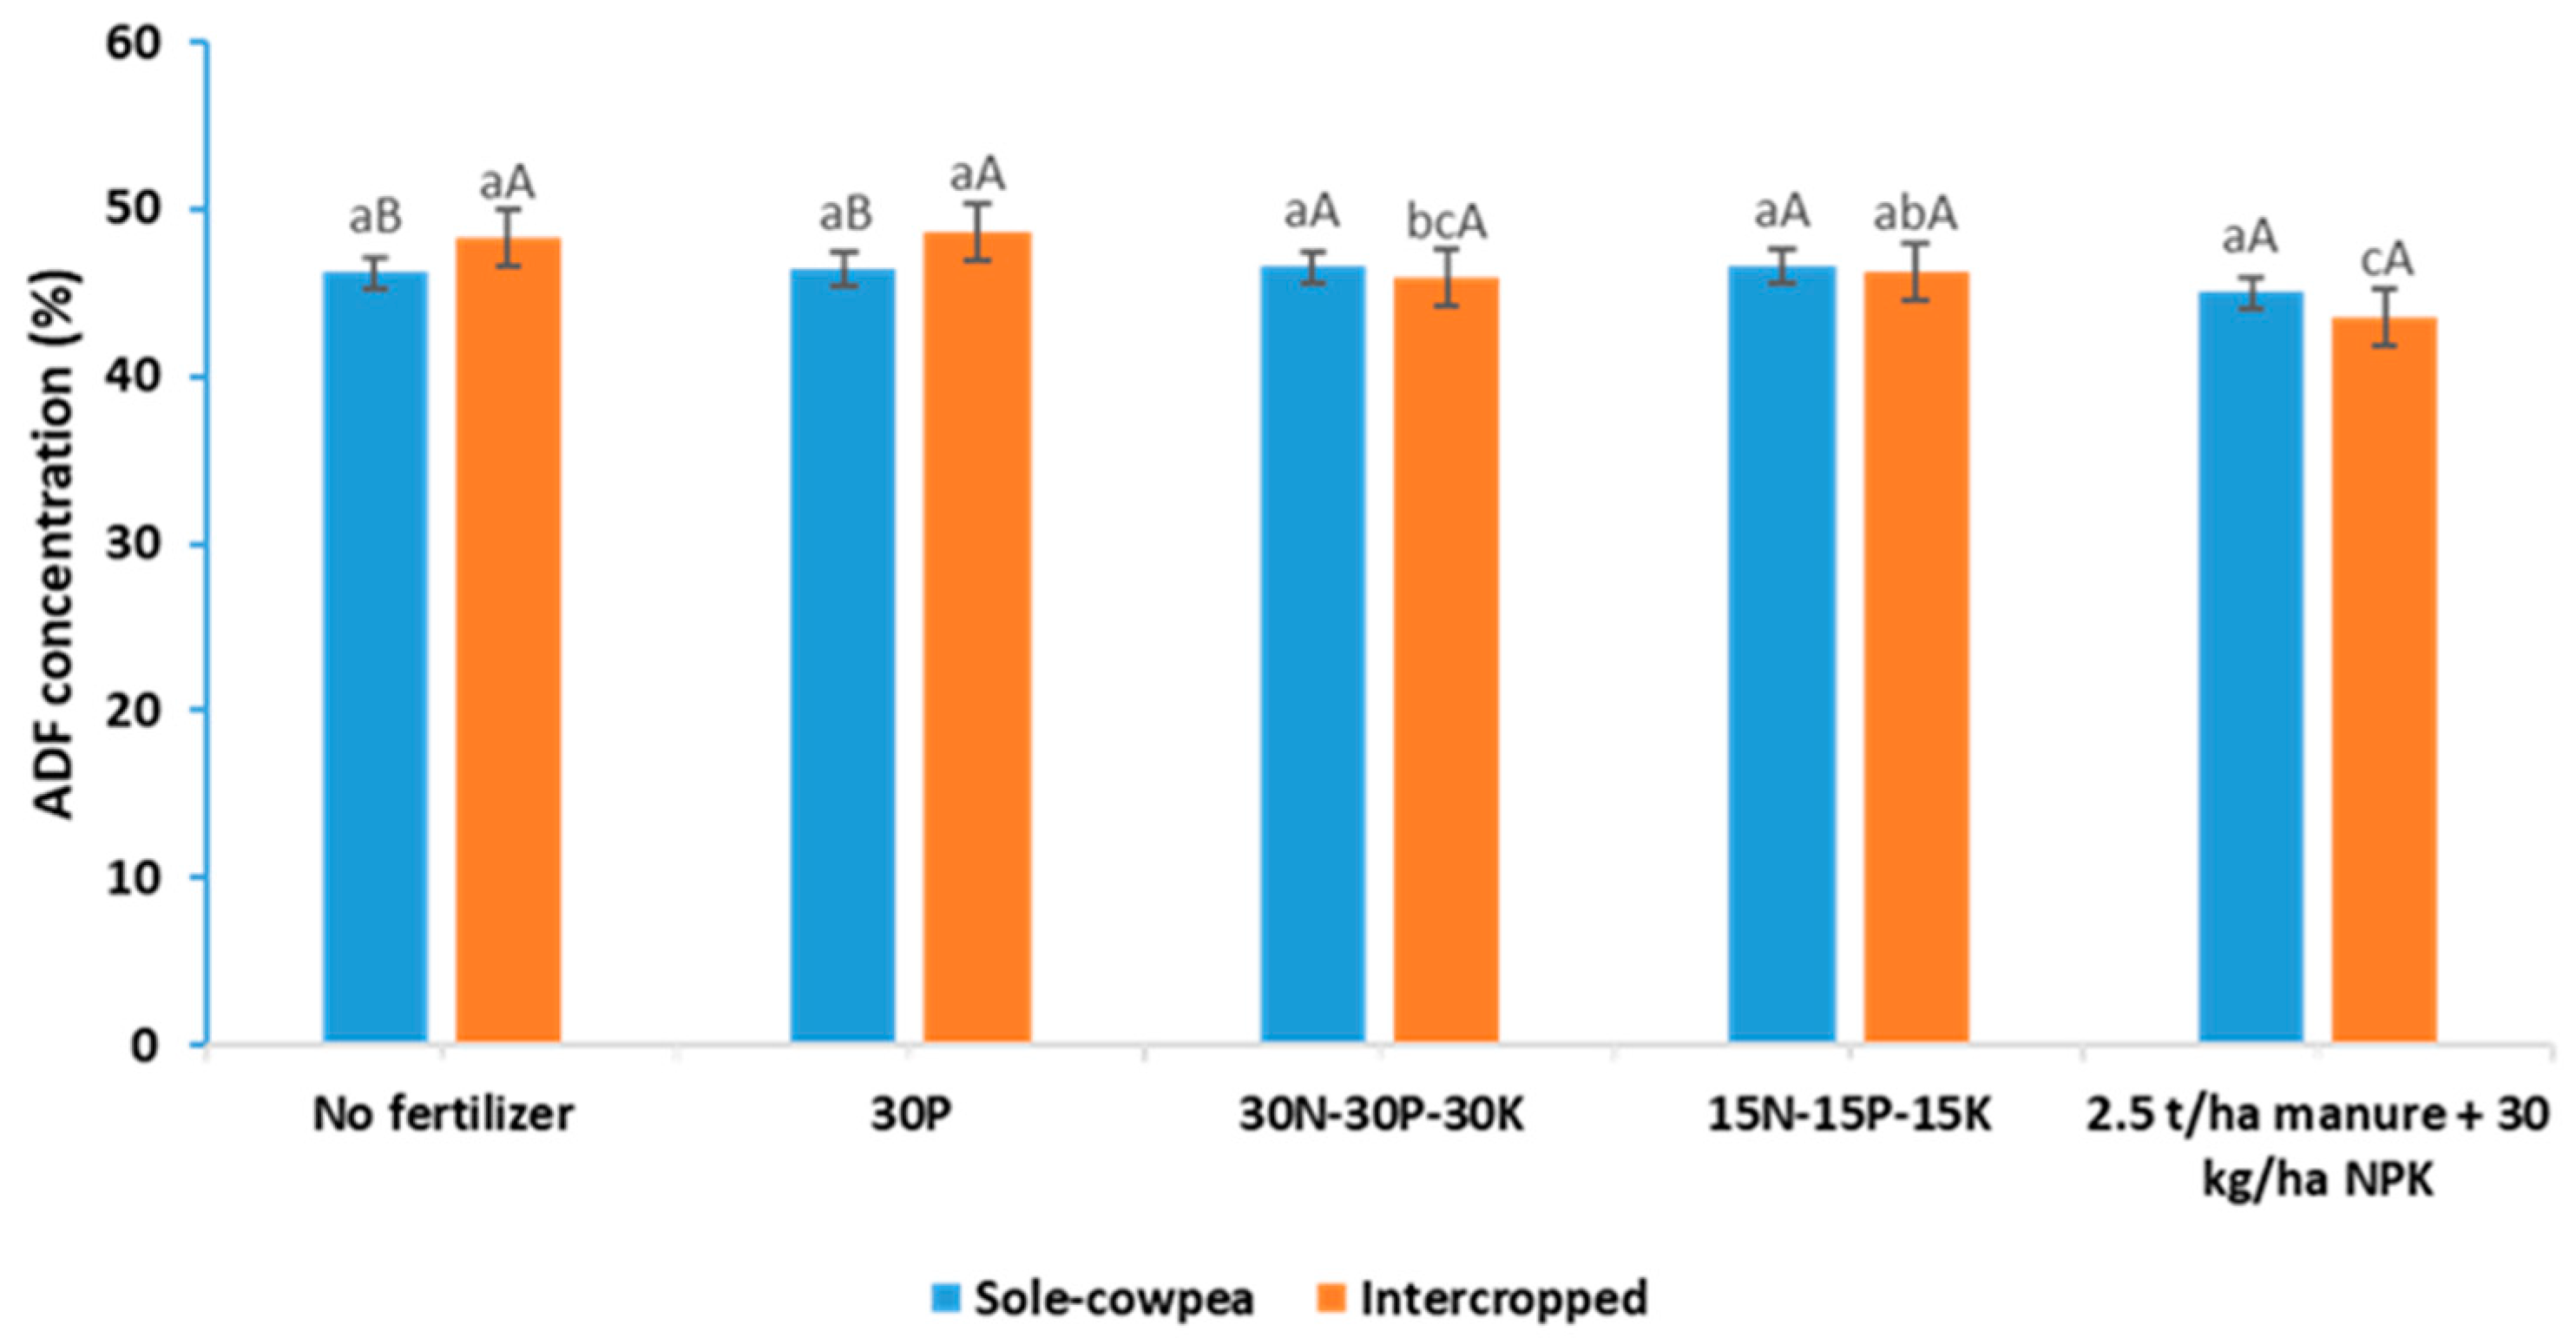
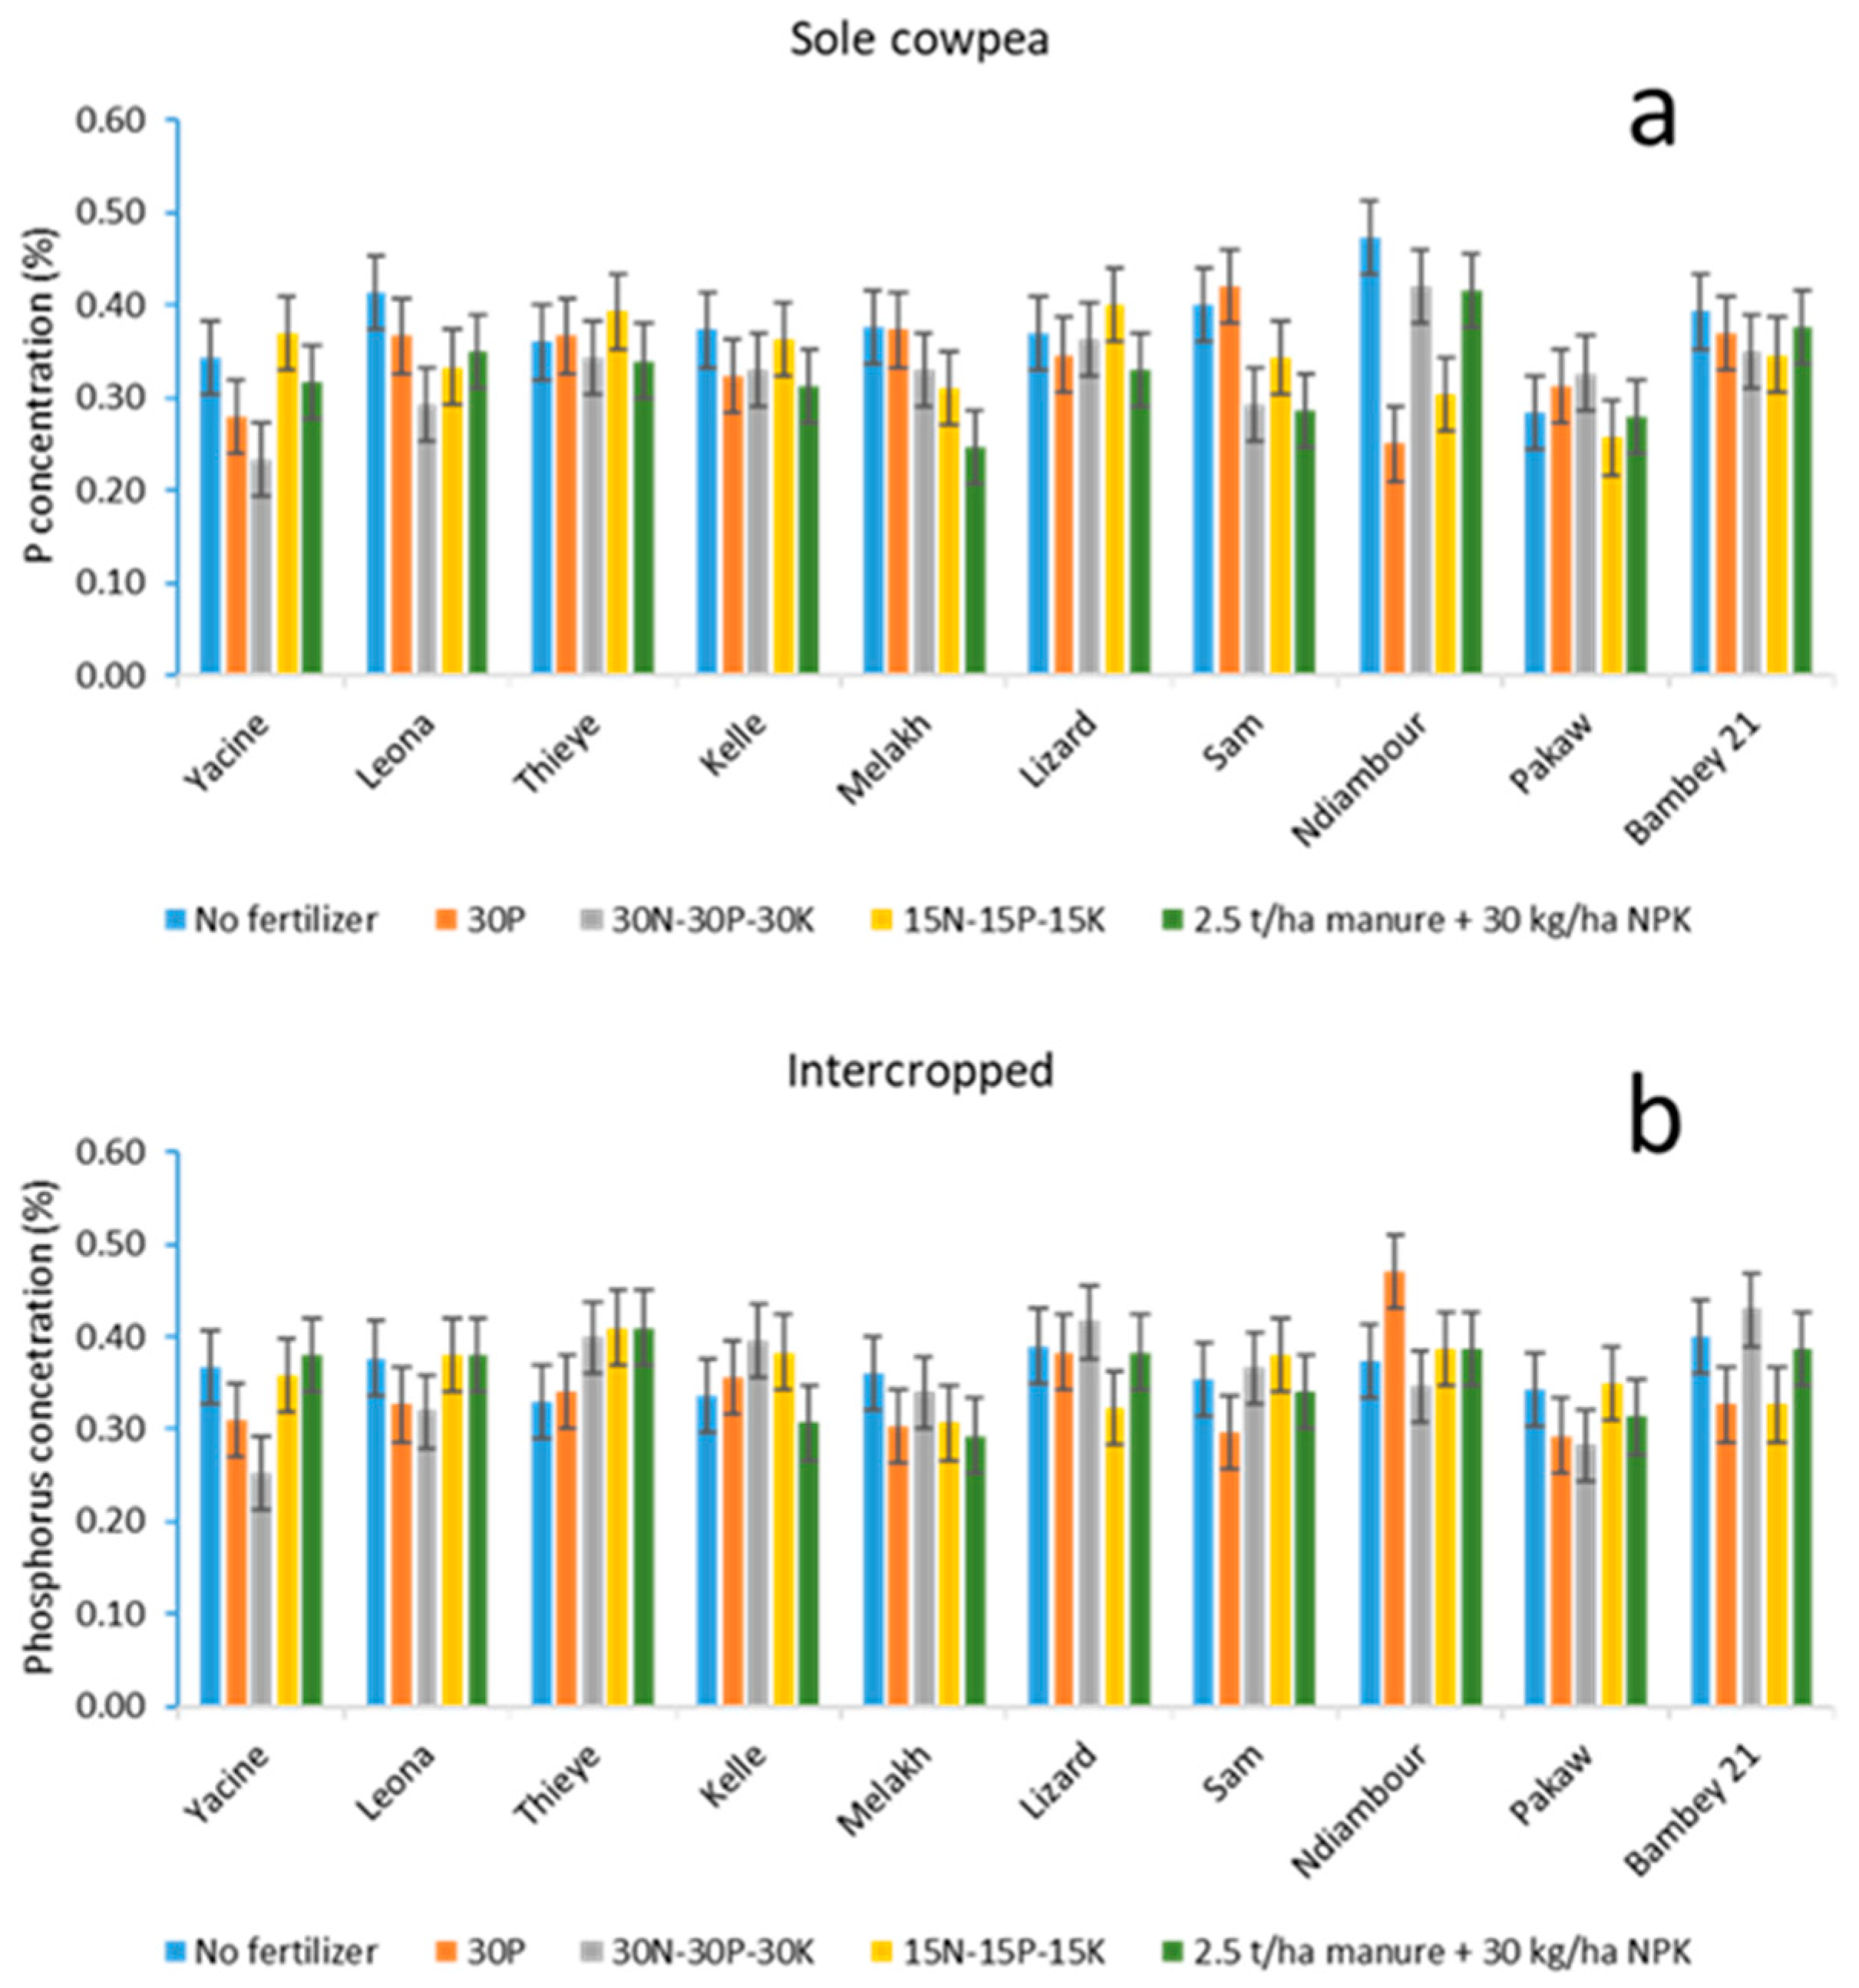
3.4. Cropping System, Fertilizer, and Genotype Effects

Fertilizer and genotype each had an effect on the cowpea biomass yield and nutritional value (Table 5). Considering genotype effects averaged across cropping systems and fertilizer, the dual-purpose cowpea variety “Ndiambour” produced the greatest fodder (1130 kg ha−1) and the best forage nutritive value in terms of CP, NDF, ADF, and P (14.2%, 55.6%, 44.5%, and 0.38%, respectively). Our finding was in agreement with Kumar et al. (2018) [46], who concluded that forage quality depends mainly on its genetic trait (variety); however, it can be improved by good agronomic practices such as the inter-cropping system. Iqbal [48] found that appropriate agronomic management strategies are bound to increase the forage yield as well as its quality attributes, particularly CP concentration.
In this current study, there was no significant difference between the intercropping system and the sole-cowpea system in terms of forage yield; this is in contrast to Alla et al. [49], who reported that forage yields of cowpea were lower in intercropping with maize than in the sole-cowpea system. However, Ba [50] found that intercropping forage yields were greater than either species alone (maize/cowpea). In our study, the cropping system alone had no effect on the nutritional value of cowpea, but its interaction with variety and fertilization and fertilization alone influenced P and ADF concentrations (Figure 4 and Figure 5). The results found by Awad and Ahmed [51] demonstrated that intercropping cereals and cowpea significantly (p ≤ 0.05) increased cowpea forage nutritional quality, which disagrees with our finding that management alone had no effect on nutritional quality unless it interacted with variety and fertilizer. Yadav et al. [52] found that maize and cowpea grown together had a 20.4% higher CP compared to monoculture crops.
The effects of fertilizer application on fodder yield and forage quality across cropping systems and varieties were also considered in this study. The treatments 15N–15P–15K (T4), 30N–30P–30K (T3), and 2.5 t ha−1 manure + 30 kg ha−1 of each (T5) NPK yielded the greatest fodder, which was 676, 651, and 645 kg ha−1, respectively (Table 5). Our results also showed that fertilizer application increased fodder yields but decreased the nutrient concentration of cowpea forage (Table 5). The decreased forage nutritive value with fertilizer application could be due to dilution effect because of the increase in fodder yield with fertilizer application. Awad and Ahmed [51] found that applying fertilizer had no effect on forage productivity but significantly improved forage quality. Hasan et al. [53] also showed that nitrogen fertilizer application significantly increased the nutritive value of cowpea fodder and CP yield, as well as forage production. Increasing cowpea fodder productivity with fertilizer application agrees with the findings of the current study.

4. Conclusions

In this work, we have developed NIRS equations to predict the forage quality of cowpea varieties including CP, ADF, NDF, Ca, P, K, and Fe, and we were able to predict the nutritional composition of independent samples. From the second experiment, we gained insight into the effects of management, genotype, fertilization, and their interactions on the nutritional value of cowpea fodder. From the results of Experiment 2, we conclude that the cropping system by itself has no significant effect on cowpea forage yield and nutrient value. However, cowpea variety, fertilizer, and their interactions do have a significant effect on fodder yield and cowpea forage quality parameters.
The findings of the study show that NIRS could help reduce the need for conventional wet chemistry procedures. However, when applying the developed calibration for new materials, it is important to understand that their spectral variability may not yet be covered. The high correlation between NIRS and wet chemistry analysis found in this study shows the potential use of NIRS for the prediction of these seven forage quality parameters of cowpea varieties grown in Senegal.

Author Contributions

Conceptualization: J.B.N., A.K.O., K.H., D.D., A.F. and L.D.; methodology: J.B.N., A.K.O., K.H., D.D., A.F., L.D. and D.F.; formal analysis: J.B.N., A.K.O., A.F. and Y.A.; data curation: J.B.N., D.D. and D.F; writing—original draft preparation: J.B.N., A.K.O. and A.F.; writing—review and editing: J.B.N., A.K.O., K.H., D.D., A.F., L.D., D.F. and Y.A; supervision: A.K.O., K.H., A.F. and L.D.; project administration: A.K.O., K.H. and A.F; and funding acquisition: A.K.O. and A.F. All authors have read and agreed to the published version of the manuscript.

Funding

This work was funded in whole (or part) by the United States Agency for International Development (USAID) Bureau for Food Security under Agreement #7200AA18LE00003 as part of Feed the Future Innovation Lab for Legume Systems Research. The contents are the sole responsibility of the authors and do not necessarily reflect the views of USAID or the United States Government. This is contribution number 23-279-J from the Kansas Experiment Station.

Institutional Review Board Statement

Not applicable.

Informed Consent Statement

Not applicable.

Data Availability Statement

Data can be made available from authors upon reasonable request.

Conflicts of Interest

The authors declare no conflict of interest. The funders had no role in the design of the study; in the collection, analyses, or interpretation of data; in the writing of the manuscript, or in the decision to publish the results.

References

  1. Kpoviessi, A.D.; Dossou, J.; Chougourou, C.D.; Bokonon-Ganta, H.A.; Francisco, A.R.; Fassinou-Hotegni, V.N. Evaluation de l’effet insecticide et insectifuge du baume de cajou sur les insectes nuisibles du niébé Vigna unguiculata (L.) Walp. Au Champ. Eur. J. Sci. Res. 2017, 146, 417–432. [Google Scholar]
  2. Oyewale, R.O.; Bamaiyi, L.J. Management of cowpea insect pests. Sch. Acad. J. Biosci. 2013, 1, 217–226. [Google Scholar]
  3. Horn, L.N.; Shimelis, H. Production constraints and breeding approaches for cowpea improvement for drought prone agro-ecologies in Sub-Saharan Africa. Ann. Agric. Sci. 2020, 65, 83–91. [Google Scholar] [CrossRef]
  4. Owade, J.O.; Abong’, G.; Okoth, M.; Mwang’ombe, A.W. A review of the contribution of cowpea leaves to food and nutrition security in East Africa. Food Sci. Nutr. 2020, 8, 36–47. [Google Scholar] [CrossRef] [Green Version]
  5. Ramirez-Villegas, J.; Jarvis, A.; Läderach, P. Empirical approaches for assessing impacts of climate change on agriculture: The EcoCrop model and a case study with grain sorghum. Agric. For. Meteorol. 2013, 170, 67–78. [Google Scholar] [CrossRef]
  6. Muranaka, S.; Shono, M.; Manjula, K.; Takagi, H.; Ishikawa, H. Application of near to midinfrared spectroscopy to estimation of grain nitrogen content in cowpea (Vigna unguiculata) grown under multiple environmental conditions. J. Biol. Food Sci. Res. 2015, 4, 16–24. [Google Scholar]
  7. Kulkarni, K.P.; Tayade, R.; Asekova, S.; Song, J.T.; Shannon, J.G.; Lee, J.-D. Harnessing the Potential of Forage Legumes, Alfalfa, Soybean, and Cowpea for Sustainable Agriculture and Global Food Security. Front. Plant Sci. 2018, 9, 1314. [Google Scholar] [CrossRef]
  8. Singh, B.B.; Ajeigbe, H.A.; Tarawali, S.A.; Fernandez-Rivera, S.; Abubakar, M. Improving the production and utilization of cowpea as food and fodder. Field Crops Res. 2003, 84, 169–177. [Google Scholar] [CrossRef]
  9. Kouakou, C.K.; Roy-Macauley, H.; Gueye, M.C.; Otto, M.C.; Rami, J.-F.; Cissé, N. Diversité génétique des variétés traditionnelles de niébé [Vigna unguiculata (L.) Walp.] au Sénégal: Étude préliminaire. Plant Genet. Resour. Newsl. 2007, 152, 35. [Google Scholar]
  10. Singh, B.B.; Tarawali, S.A. Cowpea and its improvement: Key to sustainable mixed crop/livestock farming systems in West Africa. In Crop Residues in Sustainable Mixed Crop/Livestock Farming Systems; CAB in Association with ICRISAT and ILRI: Wallingford, UK, 1997; pp. 79–100. [Google Scholar]
  11. Dugje, I.Y.; Omoigui, L.O.; Ekeleme, F.; Kamara, A.Y.; Ajeigbe, H. Production du Niébé en Afrique de l’Ouest: Guide du Paysan; IITA: Ibadan, Nigeria, 2009; p. 20. [Google Scholar]
  12. Samireddypalle, A.; Boukar, O.; Grings, E.; Fatokun, C.A.; Kodukula, P.; Devulapalli, R.; Okike, I.; Blümmel, M. Cowpea and groundnut haulms fodder trading and its lessons for multidimensional cowpea improvement for mixed crop livestock systems in West Africa. Front. Plant Sci. 2017, 8, 30. [Google Scholar] [CrossRef] [Green Version]
  13. Boukar, O.; Belko, N.; Chamarthi, S.; Togola, A.; Batieno, J.; Owusu, E.; Haruna, M.; Diallo, S.; Umar, M.L.; Olufajo, O. Cowpea (Vigna unguiculata): Genetics, genomics and breeding. Plant Breed. 2019, 138, 415–424. [Google Scholar] [CrossRef] [Green Version]
  14. Yang, Z.; Nie, G.; Pan, L.; Zhang, Y.; Huang, L.; Ma, X.; Zhang, X. Development and validation of near-infrared spectroscopy for the prediction of forage quality parameters in Lolium multiflorum. PeerJ 2017, 5, e3867. [Google Scholar] [CrossRef] [PubMed] [Green Version]
  15. Asekova, S.; Han, S.-I.; Choi, H.-J.; Park, S.-J.; Shin, D.-H.; Kwon, C.-H.; Shannon, J.G.; Lee, J.D. Determination of forage quality by near-infrared reflectance spectroscopy in soybean. Turk. J. Agric. For. 2016, 40, 45–52. [Google Scholar] [CrossRef] [Green Version]
  16. Alamu, O.E.; Adesokan, M.; Maziya-Dixon, B. Calibration development for nutritional evaluation of Yam (Dioscorea sp.) using Near-Infrared Reflectance Spectrophotometry (NIRS). Cogent Chem. 2019, 5, 1565623. [Google Scholar] [CrossRef]
  17. Association of Official Analytical Chemists (AOAC). Protein (Crude) in Animal Feed, Combustion Method (990.03), 18th ed.; Official Methods of Analysis; ASA-SSA Inc.: Gaithersburg MD, USA, 2006. [Google Scholar]
  18. Shreve, B.; Thies, N.; Wolf, M. NFTA Method 2.1.4. Dry Matter by Oven Drying for 3 h at 105 °C; National Forage Testing Association: Omaha, NE, USA, 2006. [Google Scholar]
  19. ANKOM Technology. Neutral Detergent Fiber in Feeds-Filter Bag Technique (for A2000 and A2000I); ANKOM Technology: Macedon, NY, USA, 2017. [Google Scholar]
  20. Miller, R.O. Extractable chloride, nitrate, orthophosphate, and sulfate-sulfur in plant tissue: 2% acetic acid extraction. In Handbook of Reference Methods for Plant Analysis; Kalra, Y.P., Ed.; CRC Press: Boca Raton, FL, USA, 1998; pp. 115–118. [Google Scholar]
  21. Kovar, J.L. Method 6.3 Inductively coupled plasma spectroscopy. Recomm. Methods Matur. Anal. Publ. A 2003, 3769, 41–43. [Google Scholar]
  22. González-Martín, M.I.; Escuredo, O.; Revilla, I.; Vivar-Quintana, A.M.; Coello, M.C.; Palacios Riocerezo, C.; Wells Moncada, G. Determination of the mineral composition and toxic element contents of propolis by near infrared spectroscopy. Sensors 2015, 15, 27854–27868. [Google Scholar] [CrossRef] [Green Version]
  23. Cozzolino, D.; Acosta, Y.; Garcia, J. Application of Near Infrared Reflectance Spectroscopy (NIRS) to Forage Evaluation in Uruguay. In Proceedings of the XIX International Gr X International Grassland Congrassland Congress, São Pedro, Brazil, 11–21 February 2001; Available online: https://uknowledge.uky.edu/igc/19/9/7 (accessed on 13 June 2023).
  24. Almeida, F. Espectroscopia de Infravermelho Próximo com Transformada de Fourier (ft-nir) na Caracterização de Farinhas para Alimentação Pueril. Master’s Thesis, Instituto Siperior Técnico, Universidade de Lisboa, Lisboa, Portugal, 2009. [Google Scholar]
  25. Zhang, X.; Liu, F.; He, Y.; Gong, X. Detecting macronutrients content and distribution in oilseed rape leaves based on hyperspectral imaging. Biosyst. Eng. 2013, 115, 56–65. [Google Scholar] [CrossRef]
  26. Harris, P.A.; Nelson, S.; Carslake, H.B.; Argo, C.M.; Wolf, R.; Fabri, F.B.; Brolsma, K.M.; van Oostrum, M.J.; Ellis, A.D. Comparison of NIRS and wet chemistry methods for the nutritional analysis of haylages for horses. J. Equine Vet. Sci. 2018, 71, 13–20. [Google Scholar] [CrossRef]
  27. Williams, P.C.; Sobering, D.C. Comparison of commercial near infrared transmittance and reflectance instruments for analysis of whole grains and seeds. J. Near Infrared Spectrosc. 1993, 1, 25–32. [Google Scholar] [CrossRef]
  28. Lozano, R.R. Silica and lignin in grasses. In Grass Nutrition; Lozano, R.R., Ed.; Palibrio Press: Bloomington, IN, USA, 2015; pp. 57–66. [Google Scholar]
  29. Atalay, H.; Kahriman, F. Estimation of relative feed value, relative forage quality and net energy lactation values of some roughage samples by using near infrared reflectance spectroscopy. J. Istanb. Vet. Sci. 2020, 4, 109–118. [Google Scholar] [CrossRef]
  30. Baloyi, J.J.; Hamudikuwanda, H.; Berardo, N.; Ordoardi, M.; Ngongoni, N.T. Near infrared reflectance spectroscopy (NIRS) prediction of herbage quality from forage and browse legumes, and natural pasture grass grown in Zimbabwe. Afr. J. Agric. Res. 2013, 8, 868–871. [Google Scholar]
  31. Hermansen, C.; Norgaard, T.; de Jonge, L.W.; Moldrup, P.; Müller, K.; Knadel, M. Predicting glyphosate sorption across New Zealand pastoral soils using basic soil properties or Vis–NIR spectroscopy. Geoderma 2020, 360, 114009. [Google Scholar] [CrossRef]
  32. Lebot, V.; Champagne, A.; Malapa, R.; Shiley, D. NIR determination of major constituents in tropical root and tuber crop flours. J. Agric. Food Chem. 2009, 57, 10539–10547. [Google Scholar] [CrossRef] [PubMed]
  33. Fagan, C.C.; Everard, C.D.; McDonnell, K. Prediction of moisture, calorific value, ash and carbon content of two dedicated bioenergy crops using near-infrared spectroscopy. Bioresour. Technol. 2011, 102, 5200–5206. [Google Scholar] [CrossRef] [PubMed]
  34. Kim, J.H.; Lee, K.W.; Oh, M.; Choi, K.C.; Yang, S.H.; Kim, W.H.; Park, H.S. Evaluation of moisture and feed values for winter annual forage crops using near infrared reflectance spectroscopy. J. Korean Soc. Grassl. Forage Sci. 2019, 39, 114–120. [Google Scholar] [CrossRef]
  35. Rushing, J.B.; Saha, U.K.; Lemus, R.; Sonon, L.; Baldwin, B.S. Analysis of some important forage quality attributes of Southeastern Wildrye (Elymus glabriflorus) using near-infrared reflectance spectroscopy. Am. J. Anal. Chem. 2016, 7, 642. [Google Scholar] [CrossRef] [Green Version]
  36. García, J.; Cozzolino, D. Uso de la espectroscopía de reflectancia en el infrarrojo cercano (NIR) para predecir la composición química de forrajes en modelos de calibración amplia). Agric. Tec. 2006, 66, 41–47. [Google Scholar]
  37. Despal, D.; Sari, L.A.; Chandra, R.; Zahera, R.; Permana, I.G.; Abdullah, L. Prediction accuracy improvement of Indonesian dairy cattle fiber feed compositions using near-infrared reflectance spectroscopy local database. Trop. Anim. Sci. J. 2020, 43, 263–269. [Google Scholar] [CrossRef]
  38. Hoffman, P.C.; Brehm, N.M.; Bauman, L.M.; Peters, J.B.; Undersander, D.J. Prediction of laboratory and in situ protein fractions in legume and grass silages using near-infrared reflectance spectroscopy. J. Dairy Sci. 1999, 82, 764–770. [Google Scholar] [CrossRef]
  39. Almanjahie, I.M.; Ahmad, I.; Chikr, E.Z.; Laksaci, A. Modern Statistical analysis of forage quality assessment with NIR spectroscopy. Appl. Ecol. Environ. Res. 2019, 17, 14333–14346. [Google Scholar] [CrossRef]
  40. Haruna, S.A.; Li, H.; Wei, W.; Geng, W.; Adade, S.Y.-S.S.; Zareef, M.; Ivane, N.M.A.; Chen, Q. Intelligent evaluation of free amino acid and crude protein content in raw peanut seed kernels using NIR spectroscopy paired with multivariable calibration. Anal. Methods 2022, 14, 2989–2999. [Google Scholar] [CrossRef] [PubMed]
  41. Okonya, J.S.; Maass, B.L. Protein and iron composition of cowpea leaves: An evaluation of six cowpea varieties grown in eastern Africa. Afr. J. Food Agric. Nutr. Dev. 2014, 14, 2129–2140. [Google Scholar] [CrossRef]
  42. Ono, K.; Terashima, I.; Watanabe, A. Interaction between nitrogen deficit of a plant and nitrogen content in the old leaves. Plant Cell Physiol. 1996, 37, 1083–1089. [Google Scholar] [CrossRef] [Green Version]
  43. Towett, E.K.; Alex, M.; Shepherd, K.D.; Polreich, S.; Aynekulu, E.; Maass, B.L. Applicability of near-infrared reflectance spectroscopy (NIRS) for determination of crude protein content in cowpea (Vigna unguiculata) leaves. Food Sci. Nutr. 2013, 1, 45–53. [Google Scholar] [CrossRef] [PubMed] [Green Version]
  44. Williams, P.C. Implementation of near-infrared technology. In Near-Infrared Technology in the Agricultural and Food Industries; American Association of Cereal Chemists: St. Paul, MN, USA, 2001; pp. 145–169. [Google Scholar]
  45. Stuth, J.; Jama, A.; Tolleson, D. Direct and indirect means of predicting forage quality through near infrared reflectance spectroscopy. Field Crops Res. 2003, 84, 45–56. [Google Scholar] [CrossRef]
  46. Kumar, R.; Kumar, D.; Datt, C.; Makarana, G.; Yadav, M.R.; Meel, B. Forage Yield and Nutritional Characteristics of Cultivated Fodders as Affected by Agronomic Interventions: A Review. Indian J. Anim. Nutr. 2018, 35, 373. [Google Scholar] [CrossRef] [Green Version]
  47. Padhi, S.R.; John, R.; Bartwal, A.; Tripathi, K.; Gupta, K.; Wankhede, D.P.; Mishra, G.P.; Kumar, S.; Rana, J.C.; Riar, A.; et al. Development and optimization of NIRS prediction models for simultaneous multi-trait assessment in diverse cowpea germplasm. Front. Nutr. 2022, 9, 1001551. [Google Scholar] [CrossRef]
  48. Iqbal, M.A. Agronomic management strategies elevate forage sorghum yield: A Review. J. Adv. Bot. Zoo 2015, 3, 1–6. [Google Scholar]
  49. Alla, W.H.; Shalaby, E.M.; Dawood, R.A.; Zohry, A.A. Effect of cowpea (Vigna sinensis L.) with maize (Zea mays L.) intercropping on yield and its components. Int. J. Agric. Biosyst. Eng. 2015, 8, 1258–1264. [Google Scholar]
  50. Ba, S. The role of intercropping maize (Zea mays L.) and cowpea (Vigna unguiculata L.) on yield and soil chemical properties. Afr. J. Agric. Res. 2010, 5, 631–636. [Google Scholar]
  51. Awad, O.A.; Ahmed, A.B. Effect of chemical fertilizers on yield and nutritive value of intercropped Sudan grass (Sorghum Sudanense) and cowpea (Vigna unguiculata L. Walp) forages grown in an adverse environment of western Saudi Arabia. Afr. J. Microbiol. Res. 2012, 6, 3485–3491. [Google Scholar]
  52. Yadav, M.R.; Singh, M.; Kumar, R.; Kumar, D.; Kumar Meena, R.; Ram, H.; Makarana, G. Integrated nutrient management in maize-cowpea intercropping system is an attractive option to improve the fodder productivity and quality. Commun. Soil Sci. Plant Anal. 2022, 53, 3045–3059. [Google Scholar] [CrossRef]
  53. Hasan, M.R.; Akbar, M.A.; Khandaker, Z.H.; Rahman, M.M. Effect of nitrogen fertilizer on yield contributing character, biomass yield and nutritive value of cowpea forage. Bangladesh J. Anim. Sci. 2010, 39, 83–88. [Google Scholar] [CrossRef] [Green Version]
Figure 1. Near infrared spectroscopy (NIR) spectra of 120 forage cowpea samples. Colors in the chart indicate the wavelength of their respective color, i.e., blue 450–495, green 500–570, orange 585–620 nanometers, etc.
Sustainability 15 12155 g001
Figure 2. Measured vs. predicted crude protein (CP) concentration. RMSE, root mean square error.
Sustainability 15 12155 g002
Figure 3. Measured vs. predicted concentration of (a) acid detergent fiber (ADF), (b) neutral detergent fiber (NDF), (c) calcium (Ca), (d) phosphorus (P), (e) potassium (K), and (f) iron (Fe). RMSE, root mean square error.
Sustainability 15 12155 g003
Figure 4. Interaction effect of fertilizer and management on ADF concentration. Bars with the same letter or with no letter are not significantly different (p < 0.05). Small letters compare across fertilizer types and capital letters compare within a fertilizer among cropping systems.
Sustainability 15 12155 g004
Figure 5. Three-way interaction effect of cropping system × fertilizer × genotype on P concentration. In (a) sole crop cowpea and (b) intercropped cowpea.
Sustainability 15 12155 g005
Table 1. List of the different varieties used in the 2021 trials in Bambey, Senegal.
Variety IDVariety NameTypeSource of Variety
C1YacineGrainISRA, Senegal
C2LeonaDual-purposeISRA, Senegal
C3ThieyeDual-purposeISRA, Senegal
C4KelleDual-purposeISRA, Senegal
C5MelakhGrainISRA, Senegal
C6LizardDual-purposeISRA, Senegal
C7SamDual-purposeISRA, Senegal
C8NdiambourGrainISRA, Senegal
C9PakawGrainISRA, Senegal
C10Bambey 21GrainISRA, Senegal
C11MourideGrainISRA, Senegal
C12DiongamaGrainISRA, Senegal
C1358-74FFodderISRA, Senegal
C14MougneGrainISRA, Senegal
C1566-35FFodderISRA, Senegal
C16E-BC4STR1Dual-use with forage dominanceUSA
C17E-BC4STR2Dual-use with forage dominanceUSA
C18E-BC4STR5Dual-use with forage dominanceUSA
C19E-BC4STR8Dual-use with forage dominanceUSA
C20E-BC4STR11Dual-use with forage dominanceUSA
Table 2. Descriptive statistics of forage nutrient value of cowpea samples measured using reference wet chemistry methods for the full, calibration, and prediction sets.
VariablesFull Set (n = 120)Calibration Set (n = 50)Prediction Set (n = 70)
RangeMean RangeMean RangeMean
CP (%)5.7–19.313.5 ± 2.55.7–18.913.6 ± 2.88.7–19.313.5 ± 2.3
ADF (%)35.6–67.152.9 ± 6.035.6–67.153.4 ± 7.139.5–63.752.6 ± 5.1
NDF (%)43.4–83.959.8 ± 6.243.4–83.959.8 ± 7.949.7–72.359.7 ± 4.7
Ca (%)1.2–3.82.3 ± 0.51.2–3.52.3 ± 0.61.4–3.82.4 ± 0.5
P (%)0.1–0.60.4 ± 0.10.1–0.60.4 ± 0.10.2–0.60.4 ± 0.1
K (%)0.2–1.90.8 ± 0.30.2–1.90.8 ± 0.30.3–1.60.8 ± 0.3
Fe (ppm)180–2168581 ± 350193–2168672 ± 473180–1062517 ± 206
Table 3. Descriptive statistics of forage nutrient value of cowpea samples measured with the NIRS prediction equation for the full, calibration, and prediction sets.
VariablesFull Set (n = 120)Calibration Set (47–50) Prediction Set (n = 70)
RangeMean RangeMean RangeMean
CP (%)5.3–18.713.7 ± 2.45.3–17.913.6 ± 2.79.1–18.713.8 ± 2.1
ADF (%)38.6–69.953.3 ± 6.938.6–69.953.3 ± 6.943.5–66.553.3 ± 4.3
NDF (%)44.5–87.960.1 ± 7.246.0–82.059.9 ± 7.844.5–87.960.4 ± 6.8
Ca (%)1.0–3.32.3 ± 0.41.0–3.32.3 ± 0.51.6–3.12.4 ± 0.3
P (%)0.1–0.50.4 ± 0.10.1–0.50.4 ± 0.10.2–0.50.4 ± 0.1
K (%)0.1–1.50.8 ± 0.20.3–1.50.8 ± 0.30.1–1.20.8 ± 0.2
Fe (ppm)216–1774577 ± 272216–177463 ± 355239–973536 ± 184
n, number of samples; Range, minimum value–maximum value; Mean, mean ± standard deviation.
Table 4. Statistics of the NIRS calibration equation of the minerals for best fit and cross validation.
VariablesMath TreatmentNSECR2cSECVRPD1-VR
CP Weighted MSC 2,8,8,2 480.670.941.382.00.76
ADFNormal MSC 2,8,8,2481.920.933.572.00.76
NDFNormal MSC 1,4,4,1472.740.883.492.30.83
Ca Weighted MSC 1,4,4,1 500.340.630.451.20.36
P Normal MSC 2,8,8,2490.060.690.091.30.44
KDetrend 1,4,4,1490.090.870.191.40.54
FeNormal MSC 1,4,4,1480.090.940.202.00.84
N, number of samples; MSC, multiplicative scatter correction; SEC, standard error of calibration; R2c, coefficient of determination in calibration; SECV, standard error of cross-validation; RPD, ratio of performance to deviation, 1-VR, coefficient of correlation in cross validation.
Table 5. Analysis of variance of cowpea biomass yield and nutritional value content by management, genotype, and fertilization. Mean values within a column and treatment followed by the same letter or with no letter are not significantly different (p < 0.05).
Cowpea
Variety
FodderCPNDFADFCaFeKP
kg/ha%%%%ppm%%
Yacine400 c14.6 a58.1 cdef46.6 bc2.37 a486 a0.97 cd0.32 bc
Leona553 bc12.9 bcd60.8 abc46.9 bc2.12 a456 a1.03 bc0.35 ab
Thieye601 b13.9 ab57.5 def45.3 c2.27 a440 a1.06 bc0.37 a
Kelle440 bc13.5 abc58.7 bcde45.2 c2.20 a407 a1.07 ab0.35 ab
Melakh576 bc12.5 cd61.5 a50.3 a2.0 a372 a0.94 de0.32 bc
Lizard474 bc13.8 ab57.5 def44.1 c2.23 a422 a1.05 bc0.37 a
Sam508 bc13.4 abc59.9 abcd46.6 bc2.25 a464 a1.01 bcd0.35 ab
Ndiambour1130 a14.2 a55.6 f44.5 c2.17 a416 a1.00 bcd0.38 a
Pakaw626 b11.7 d60.9 ab49.7 ab2.15 a414 a0.87 e0.30 c
Bambey 21628 b14.2 a56.2 ef44.7 c2.15 a438 a1.15 a0.37 a
Fertilizer treatment
No fertilizer479 b13.7 ab57.4 a47.3 a2.23 a457 ab0.85 d0.37 a
30P517 b13.1 c58.7 a47.6 a2.24 a473 a0.92 c0.34 b
30N–30P–30K651 a13.0 c59.0 a46.2 a2.19 a425 b1.04 b0.34 b
15N–15P–15K676 a13.4 bc58.9 a46.5 a2.20 a431 ab1.01 b0.35 ab
Manure 30 NPK645 a14.1 a59.4 a44.4 b2.08 b371 c1.25 a0.34 b
Effect
Management (M)0.6250.7940.9100.5090.1150.3920.8100.546
Variety (V)<0.00010.0020.0010.0020.1770.398<0.00010.005
Fertilizer (F)<0.00010.0030.0770.0000.0200.001<0.00010.045
M × V0.2730.2900.7300.7250.5500.6610.5960.998
M × F0.1050.1900.0890.0420.7030.5880.7390.198
V × F0.5000.2000.3880.0710.4790.4640.4520.280
M × V × F0.1410.1440.0920.2680.1640.5730.3460.039
Disclaimer/Publisher’s Note: The statements, opinions and data contained in all publications are solely those of the individual author(s) and contributor(s) and not of MDPI and/or the editor(s). MDPI and/or the editor(s) disclaim responsibility for any injury to people or property resulting from any ideas, methods, instructions or products referred to in the content.

