1. Introduction
Aging is not merely a physiological process, but a concept shaped by the social and historical environment [
1]. According to the latest data from the Department of Aging of the National Health Commission of China in 2022, it is projected that the total number of individuals aged 60 and above will surpass 300 million during the “14th Five-Year Plan” period, representing over 20% of the population and signifying a stage of moderate aging. By approximately 2035, the elderly population aged 60 and above is expected to exceed 400 million, accounting for more than 30% of the total population, and entering a stage of severe aging [
2]. The situation and characteristics of China’s aging, characterized by a large population, rapid pace, significant disparities, and substantial challenges, necessitate the enhancement of age-friendly environment construction and quality in China. During the construction of age-friendly environment, establishing and maintaining a coordinated and harmonized relationship between supply and demand can generate positive effects, enhance the output and benefits of age-friendly environment provision, and ensure the continuous supply of high-quality age-friendly environments, thus creating a virtuous cycle. Conversely, if the supply and demand of age-friendly environment construction fail to establish a well-balanced and coordinated relationship, the lack of coordination and mismatch in terms of supply quantity, content, structure, and demand will impede the effective enhancement of output and value-added benefits in age-friendly environment construction, leading to a vicious cycle. Thus, it is of strategic importance to conduct accurate assessments of the current state of age-friendly environment construction, examine the supply-demand balance in age-friendly environment construction across different regions, elucidate the factors influencing the construction of age-friendly environments and their spatial spillover effects, and foster the coordinated development of the supply-demand relationship in age-friendly environment construction.
Theoretical research on aging has evolved from the concept of “successful aging” to “healthy aging,” and further to “active aging” [
3]. Active aging emphasizes the provision of optimal opportunities for older individuals to maintain their health, engage in meaningful activities, and ensure their security in old age. Drawing upon the principles of active aging, the World Health Organization (WHO) introduced the concept of “age-friendly city” in 2000, which encourages a positive perception of old age through the provision of supportive services, environments, and facilities, addressing the challenges associated with population aging. In response, China has progressively integrated the development of livable environments for older adults into its national planning. Therefore, in the current era characterized by rapid population aging and a growing aspiration for improved quality of life, the construction of age-friendly environments holds significant importance in addressing the challenges of population aging and fostering active aging [
4].
In recent years, scholars have focused on researching elderly-friendly cities and communities, with particular emphasis on evaluation methods and construction approaches. Regarding evaluation methods, some scholars extract evaluation indicators through interviews and theoretical analysis. Jelokhani-Niaraki et al. employ multi-criteria decision analysis and public participation GIS to assess the age-friendliness of cities by integrating the weight criteria determined by the elderly with information collected from ordinary citizens [
5]. Lak et al. identified key influencing factors through grounded theory and semi-structured interviews to determine the needs and preferences of elderly individuals regarding public open spaces. Subsequently, the suitability of age-friendly public spaces is assessed through data analysis and model development [
6]. Additionally, many scholars utilize statistical analysis to establish an index system for assessing the level of construction. As an example, Bhuyan et al. conducted a qualitative analysis of data from older Singaporeans and key informants in elder-care communities. Based on this analysis, they proposed a framework for developing elder-care environments that address inclusion, social environment, physical environment, sense of place, and safety [
7]. Taking the perspective of older individuals, Morowatisharifabad et al. utilized questionnaire survey data and conducted SPSS analysis and
T-tests to establish an index system for age-friendly cities, covering social, communication, culture, entertainment, and healthcare aspects [
8]. Xu Jixiang et al. conducted a large-scale survey and exploratory factor analysis to evaluate the construction of age-friendly communities across five dimensions: housing, transportation, community environment, social participation, and community and health services [
9].
Regarding construction approaches, the focus of age-friendly cities and communities has shifted towards meeting the specific and specialized needs of older populations. This development mode emphasizes the importance of allocating age-friendly environments to meet these requirements [
10]. In terms of research on construction path strategies, Sun Zhongjun et al. began by examining the development process of the theory of active aging. They identify the elderly care needs that arise during the aging process and propose construction strategies for creating a friendly environment across three dimensions: policy, personal living environment, and social and cultural environment [
11]. Zhang et al. developed an evolutionary game model involving local governments, investors, and residents as construction stakeholders. This model presents a novel approach to enhancing the age-friendly environment through collaborative value co-creation among multiple entities [
12]. Building upon the theoretical framework of community capacity building, Zhang Jia’an put forth a construction strategy that emphasizes the active promotion of elderly participation and advocates for multi-subject and cross-departmental cooperation [
13]. Regarding specific measures along the construction path, Gaglione et al. utilized fuzzy technology to assess the safety and urban attributes of pedestrian networks and built environments. They suggested the classification of communities into regions based on favorable characteristics, thus enhancing elderly individuals’ access to urban services [
14]. Purnomo et al. employed qualitative methods including observation, in-depth interviews, and literature research, and presented strategies to improve the understanding of government and social deficiencies in construction. They underscored the importance of coordinated and collaborative efforts among multiple stakeholders, along with the implementation of pertinent laws and policies, to elevate Surabaya’s age-friendly city status [
15].
In summary, currently, domestic and foreign scholars primarily concentrate on evaluating and strategically researching the supply of age-friendly environments in specific cities or regions. However, there is a lack of studies examining the sources of regional development differences and the spatial correlation between the supply and demand for age-friendly environments. This research takes all 31 provinces in China as the research subject and employs the coupling coordination degree model and Theil Index to measure the level of coordination between the supply and demand of age-friendly environments. The aim is to objectively illustrate the trend of coordinated development and regional differences in age-friendly environment construction in each province. Additionally, the Moran’s I Index is used to verify spatial correlation. The paper explores the spatial spillover effect of influencing factors using the spatial Durbin model with double fixed effects. Finally, it proposes countermeasures and suggestions to achieve supply and demand equilibrium in age-friendly environment construction across provinces and reduce interprovincial disparities.
3. Results
3.1. Coupling Coordination Degree Analysis
Illustrated in
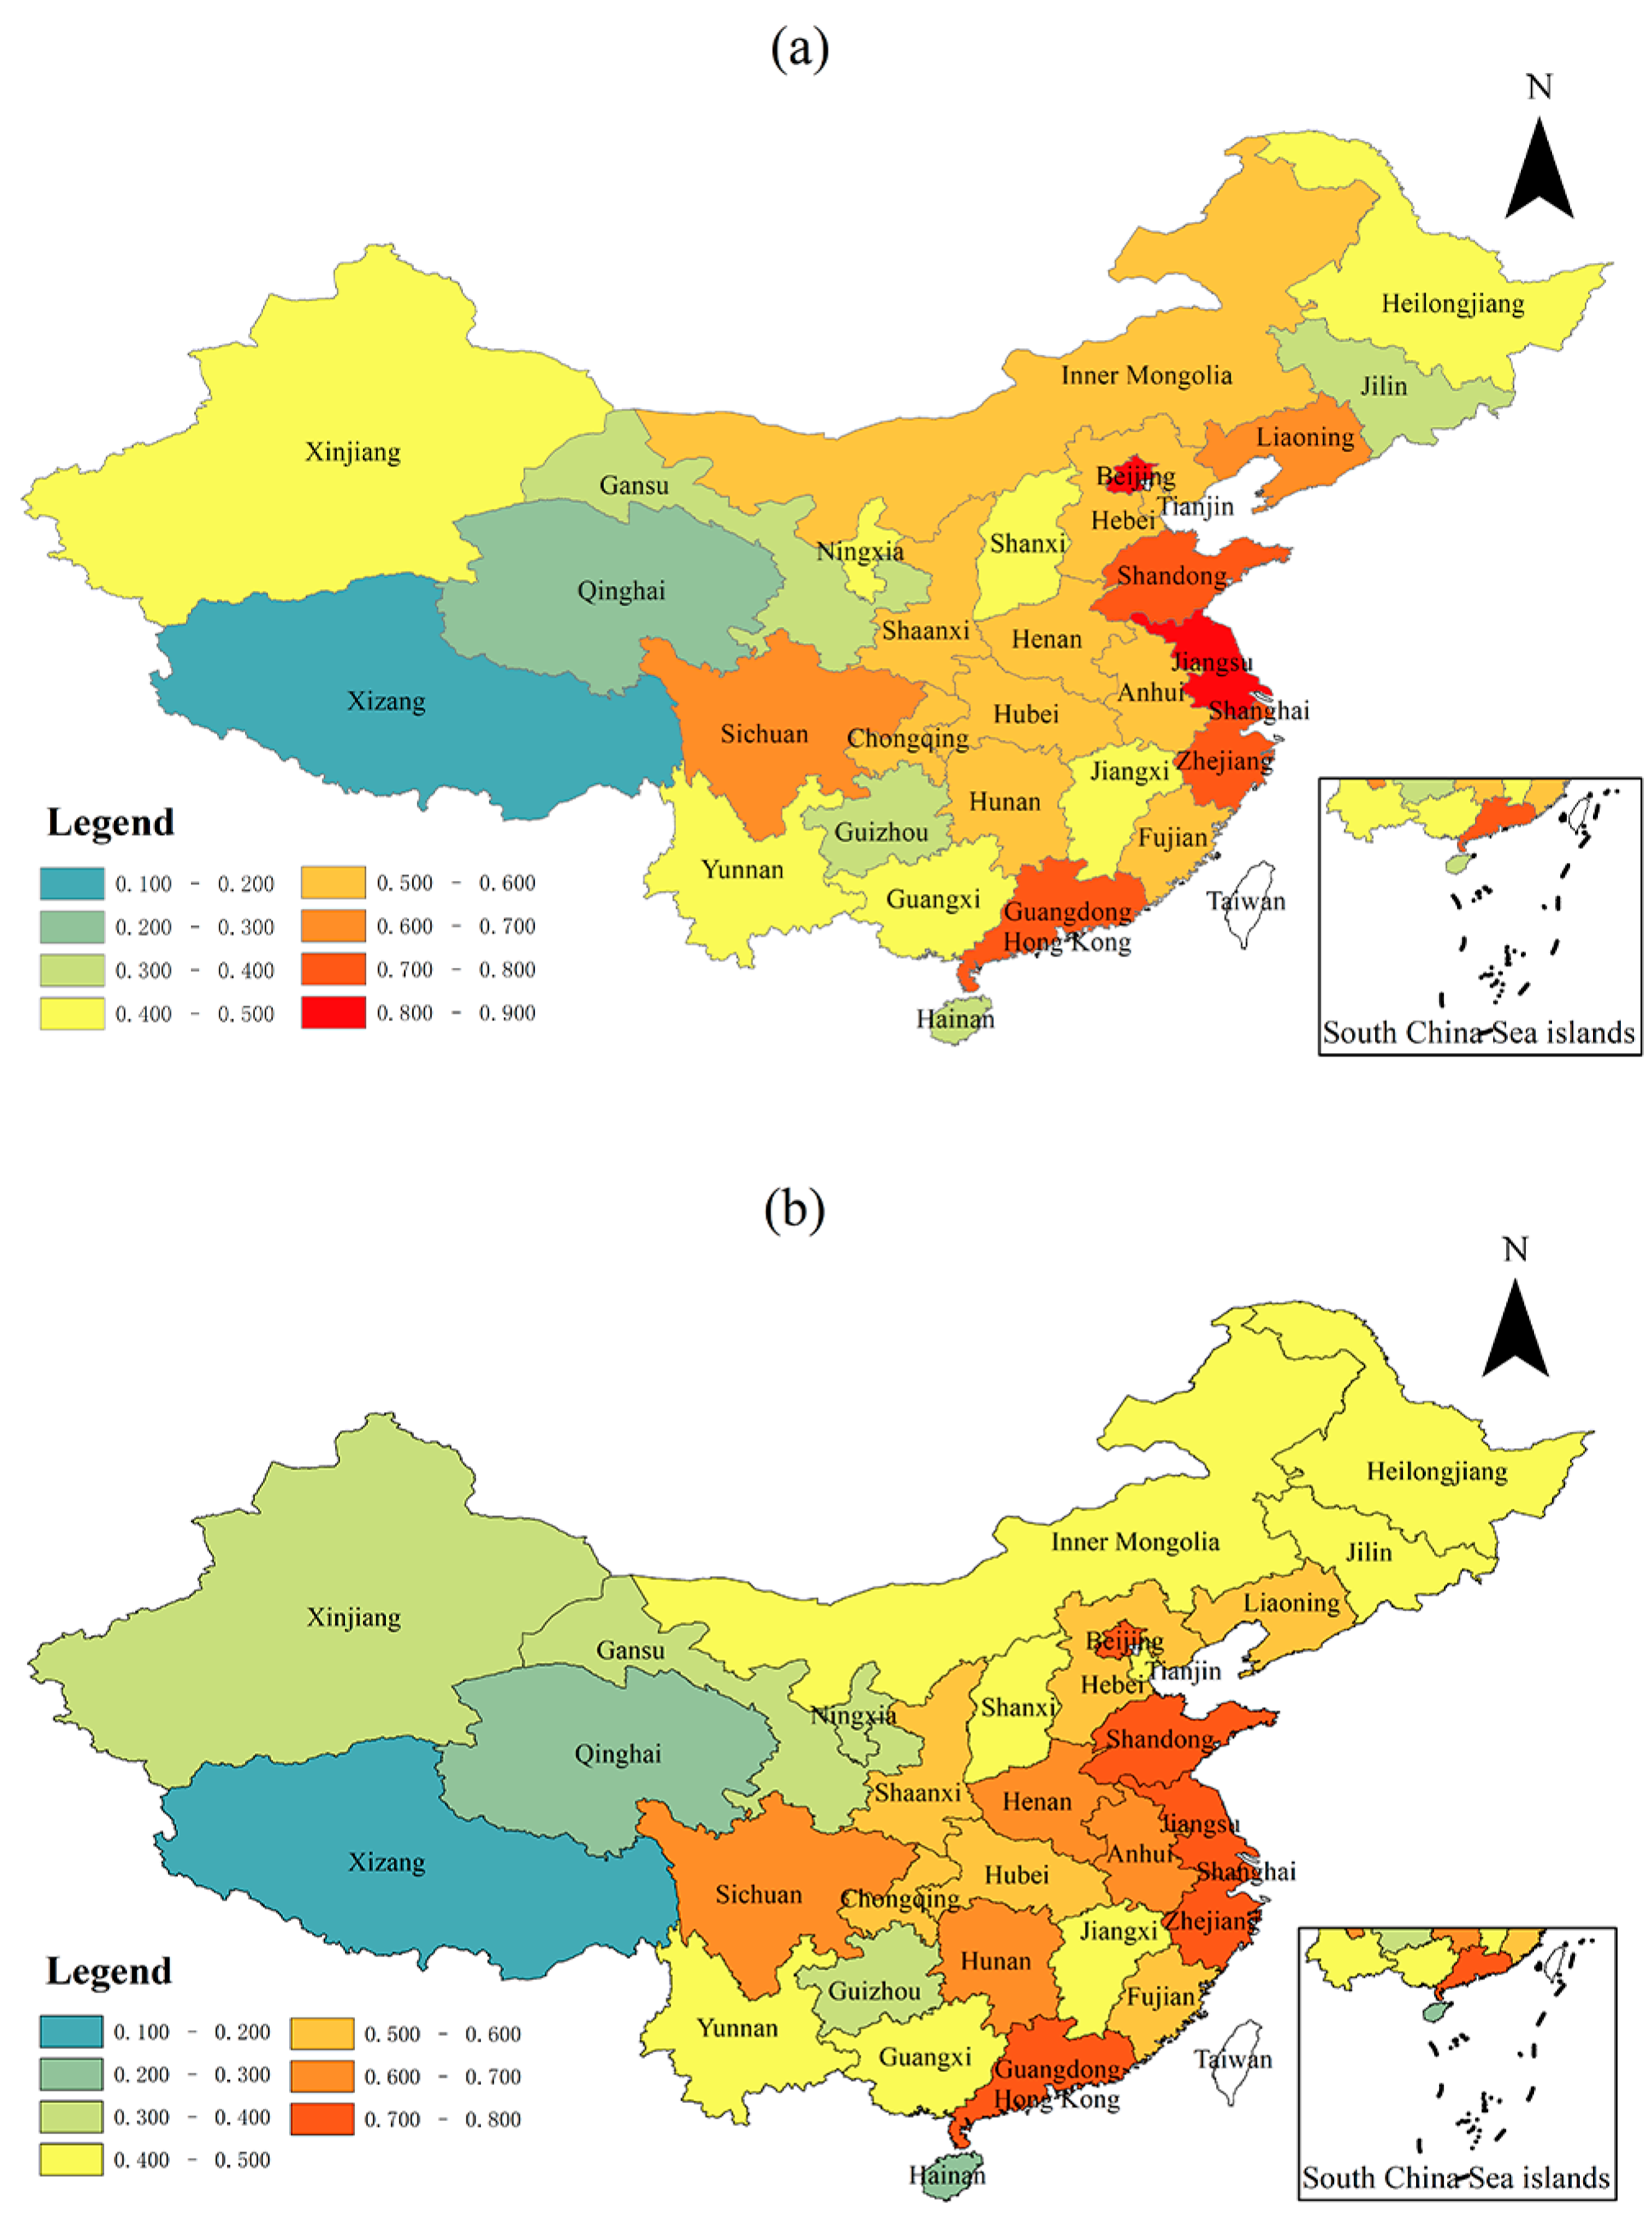
Figure 1, when considering the entire country, the coupling coordination degree of the age-friendly environments supply and demand system exhibited an inverted U-shaped development trend from 2014 to 2020, indicating a consistent state of weak coordination. This indicates that there has not been a significant change in the development of China’s age-friendly environment supply and demand system. Specifically, regarding the time aspect, the coupling coordination degree increased from 0.531 to 0.545 between 2014 and 2016 but decreased from 0.547 to 0.516 between 2017 and 2020. This demonstrates that the coordination between the supply and demand of China’s age-friendly environment is still characterized by a mismatch and mutual hindrance during the development process. In terms of spatial distribution, noticeable variations are observed, exhibiting a pattern of “higher in the southeast and lower in the northwest” (
Figure 2).
Considering the regional perspective, there are variations in the development level among different regions, although the development trend is similar. Specifically, in terms of time, the coupling coordination degree in Northeast China exhibits a declining trend, indicating an overall state of unbalanced development in the region. The coupling coordination degree in the eastern region, except for the decline in Hainan in 2015, does not exhibit a noticeable trend. It has an average value of 0.663, surpassing the national average of 0.534, indicating a stable primary coordinated development state. In the central region, there was a 3.34% increase in the coupling coordination degree between 2014 and 2020. The coupling coordination degree in the western region is the lowest among the regional plates, with an average value of only 0.421, indicating a significant gap compared to the national average and the development level of more advanced regions. With the exception of Hainan, all eastern regions are experiencing coordinated development, and 60% of the provinces are in an intermediate stage of coordinated development. All central regions, except for Jiangxi, are undergoing coordinated development, with 50% of them in the primary coordinated development state. However, Northeast China is approaching a state of unbalanced development. Approximately 58.3% of the western region is experiencing dysfunctional development, particularly Tibet, which has reached a stage of severe dysfunctional development. Consequently, the western region is the only region within the regional plate with provinces facing significant dysfunction.
Looking at the provincial units, the eastern region is predominantly represented by provinces with the highest average coupling coordination degree from 2014 to 2020. Shanghai and Jiangsu demonstrate good coordination, while Beijing, Zhejiang, Shandong, and Guangdong exhibit primary coordination. Additionally, 12 provinces, including Anhui, Henan, and Sichuan, demonstrate basic coordination. Eight provinces, including Jiangxi, Heilongjiang, and Guangxi, are approaching a state of unbalanced development. The remaining 6 provincial units are experiencing varying degrees of dysfunctional development. In 2020, 12 provinces witnessed changes in the degree of coupling coordination compared to 2014. Among them, Henan, Anhui, and Hunan demonstrated an improved coupling coordination degree, transitioning from a barely coordinated degree to a primarily coordinated degree. On the other hand, Jiangsu and Beijing experienced a decrease in the coupling coordination degree, transitioning from a good coordination degree to an intermediate coordination degree. Inner Mongolia and Tianjin are approaching an imbalanced state from barely coordinated, whereas Xinjiang and Ningxia have transitioned from near disorder to mild disorder. The number of regions categorized as experiencing dysfunctional development increased from 13 in 2014 to 15 in 2020. This indicates that while the supply of age-friendly environments is consistently improving, the pressure generated by population aging intensification has led to a reverse development in the coupling coordination degree of supply and demand.
3.2. Theil Index Analysis
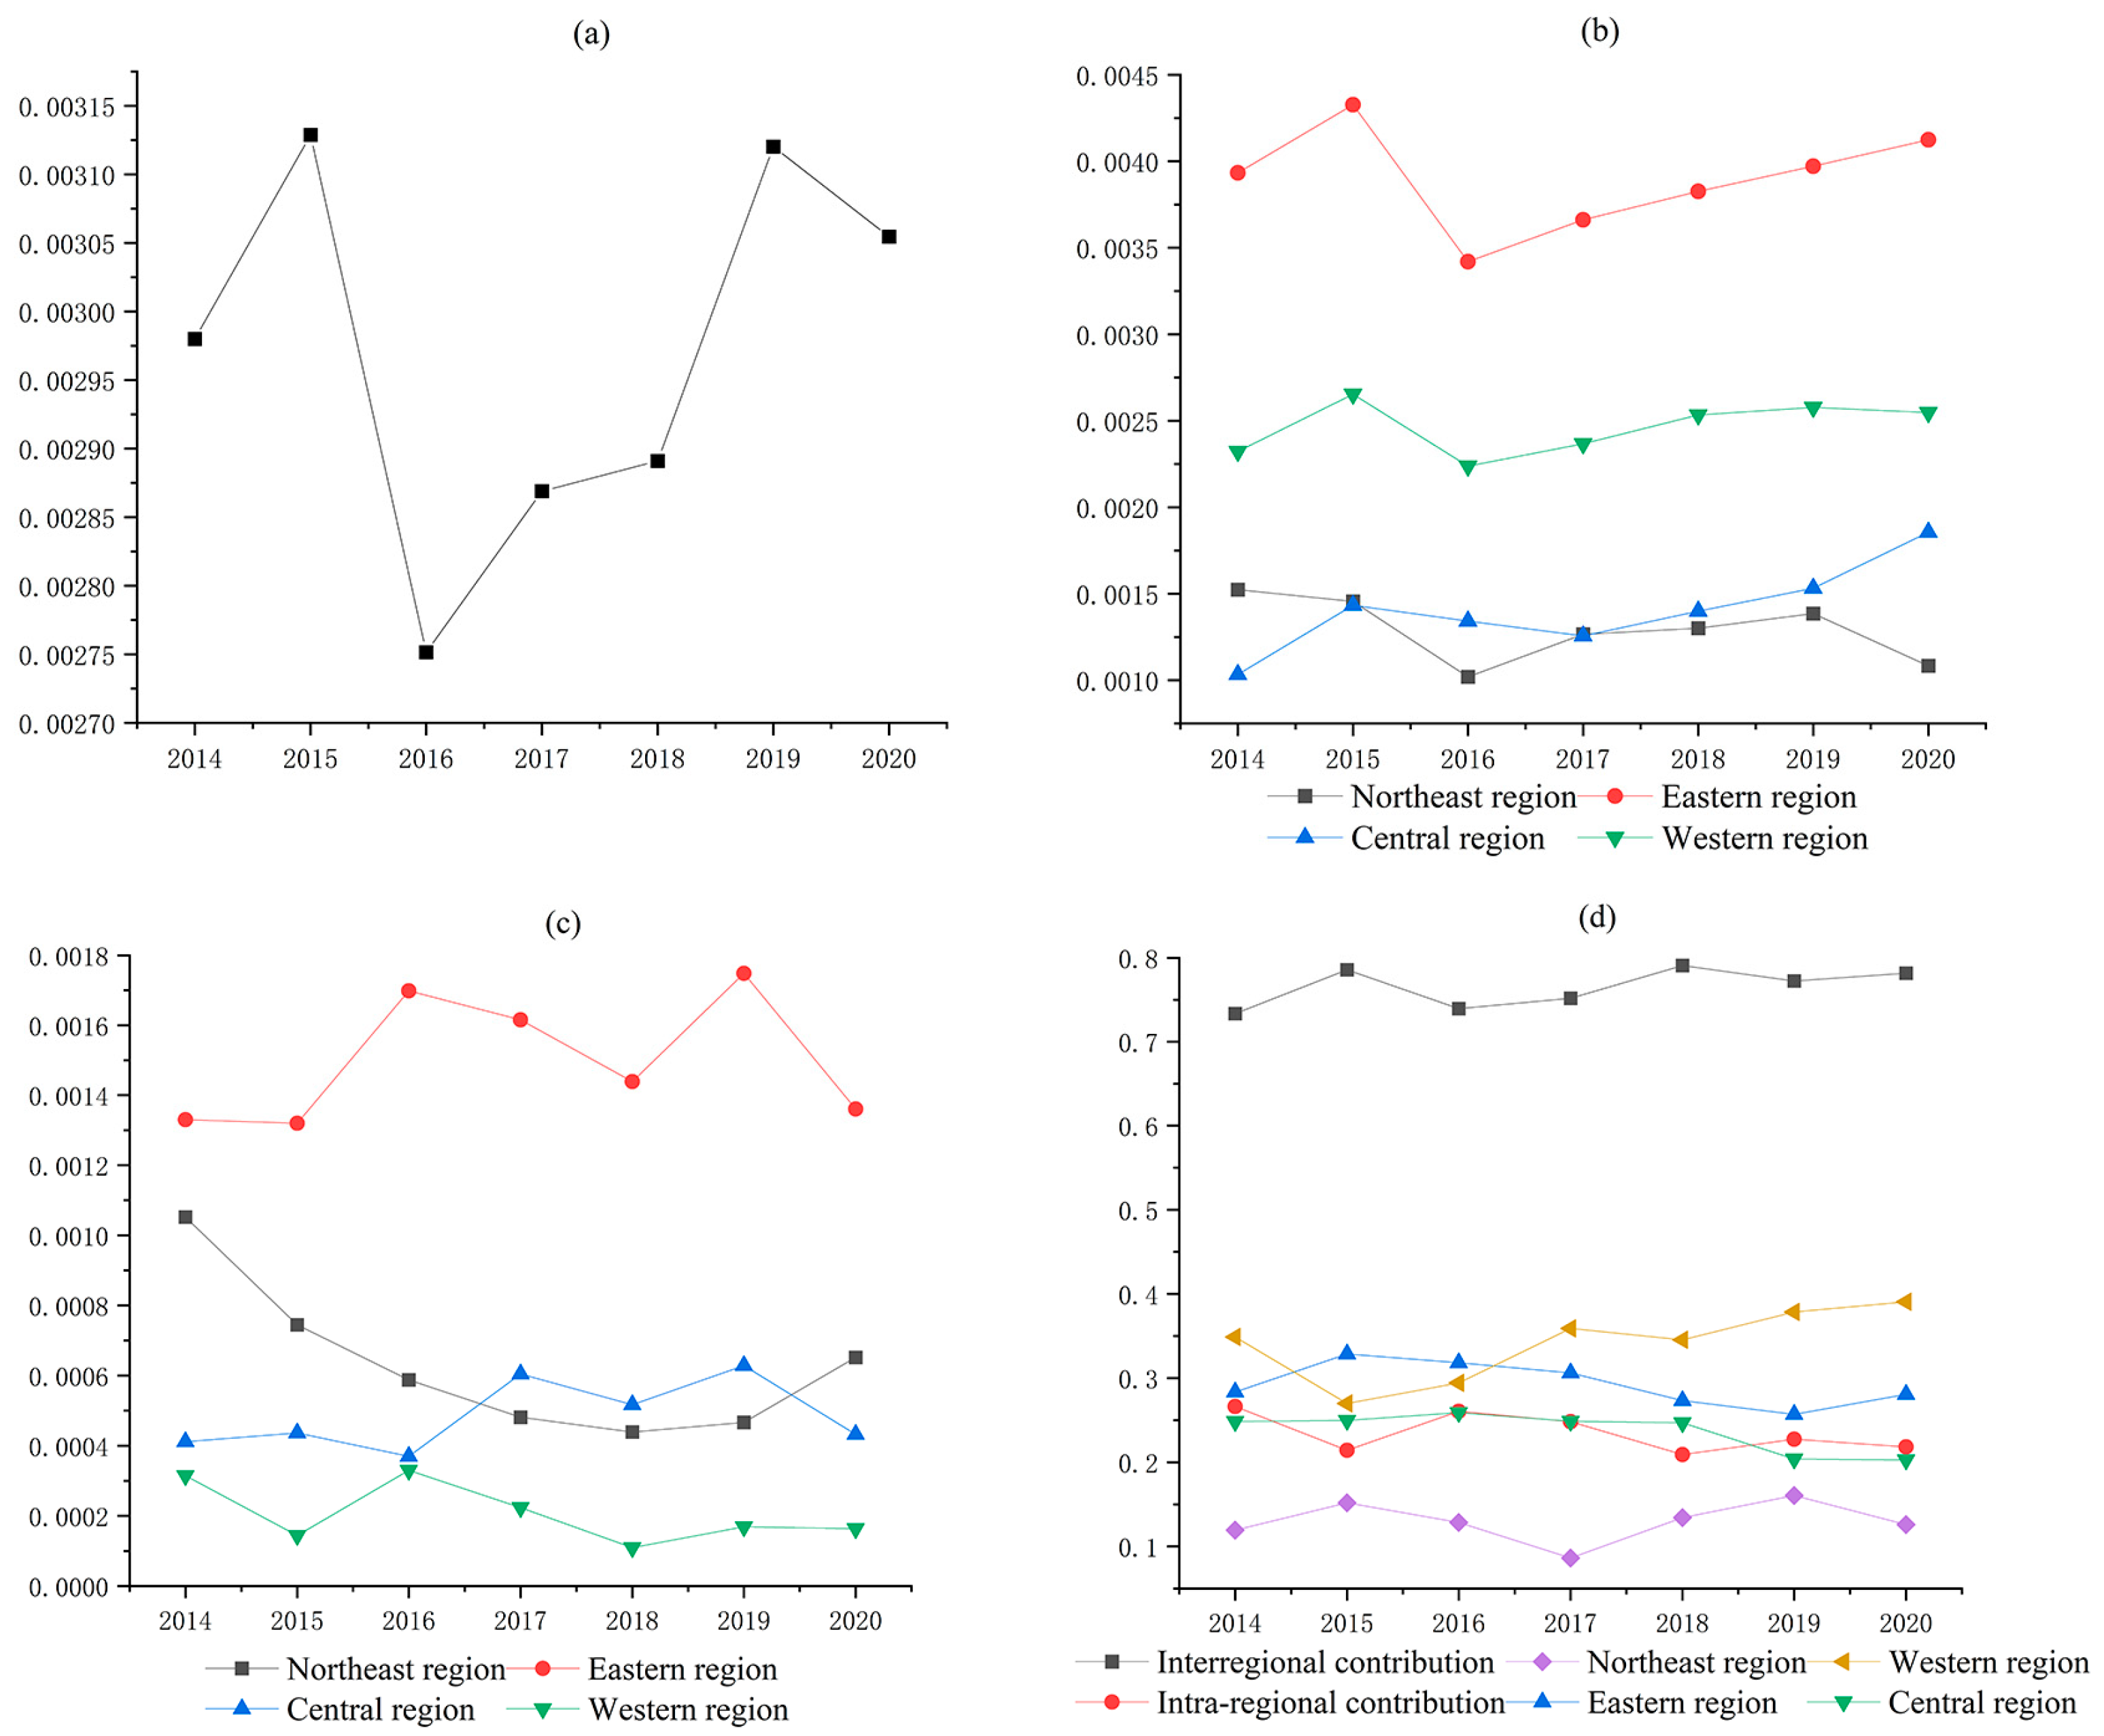
To further analyze the underlying factors influencing the supply-demand coupling coordination degree of China’s age-friendly environment, the Thiel index was employed to assess regional development disparities. The magnitude of the Theil index reflects the regional disparity in the supply-demand coupling coordination degree of China’s age-friendly environment. As depicted in
Figure 3, the overall difference exhibits a phased fluctuation pattern over time. Between 2014 and 2016, a fluctuating trend was observed, with the overall Thiel index declining from 0.00298 to 0.00275. Between 2017 and 2020, a pattern of “sharp increase followed by a slight decrease” emerged, resulting in an overall rise of the Thiel index from 0.00287 to 0.00306. It can be observed that while the overall Thiel index demonstrates a generally increasing trend, the magnitude of change remains limited. This suggests that the regional disparities in the supply-demand coupling coordination degree of China’s age-friendly environment are growing, but the overall difference is currently not substantial. Regarding regional disparities, the eastern region exhibits the highest discrepancy, with an average Theil index value of 0.00389, significantly surpassing the inter-regional average of 0.00226. However, the disparities between the northeast and central regions are relatively smaller. In terms of regional difference contribution, the inter-regional disparity makes a considerably greater contribution compared to the intra-regional disparity. Between 2014 and 2020, the contribution of inter-regional disparities increased from 73.37% to 78.17%, with the western region accounting for 34.09%, becoming the primary contributor to the total difference. In contrast, the contribution of intra-regional disparities decreased from 26.63% to 21.83%. In recent years, inter-regional disparities in development status and resource allocation have progressively widened, constituting the primary factor contributing to the overall difference, whereas intra-regional disparities in provincial and municipal development have diminished. Therefore, in enhancing the balance of the coupling coordination degree, it is crucial not only to address the development imbalance between provinces and cities but also to emphasize regional balance.
3.3. Spatial Autocorrelation Analysis
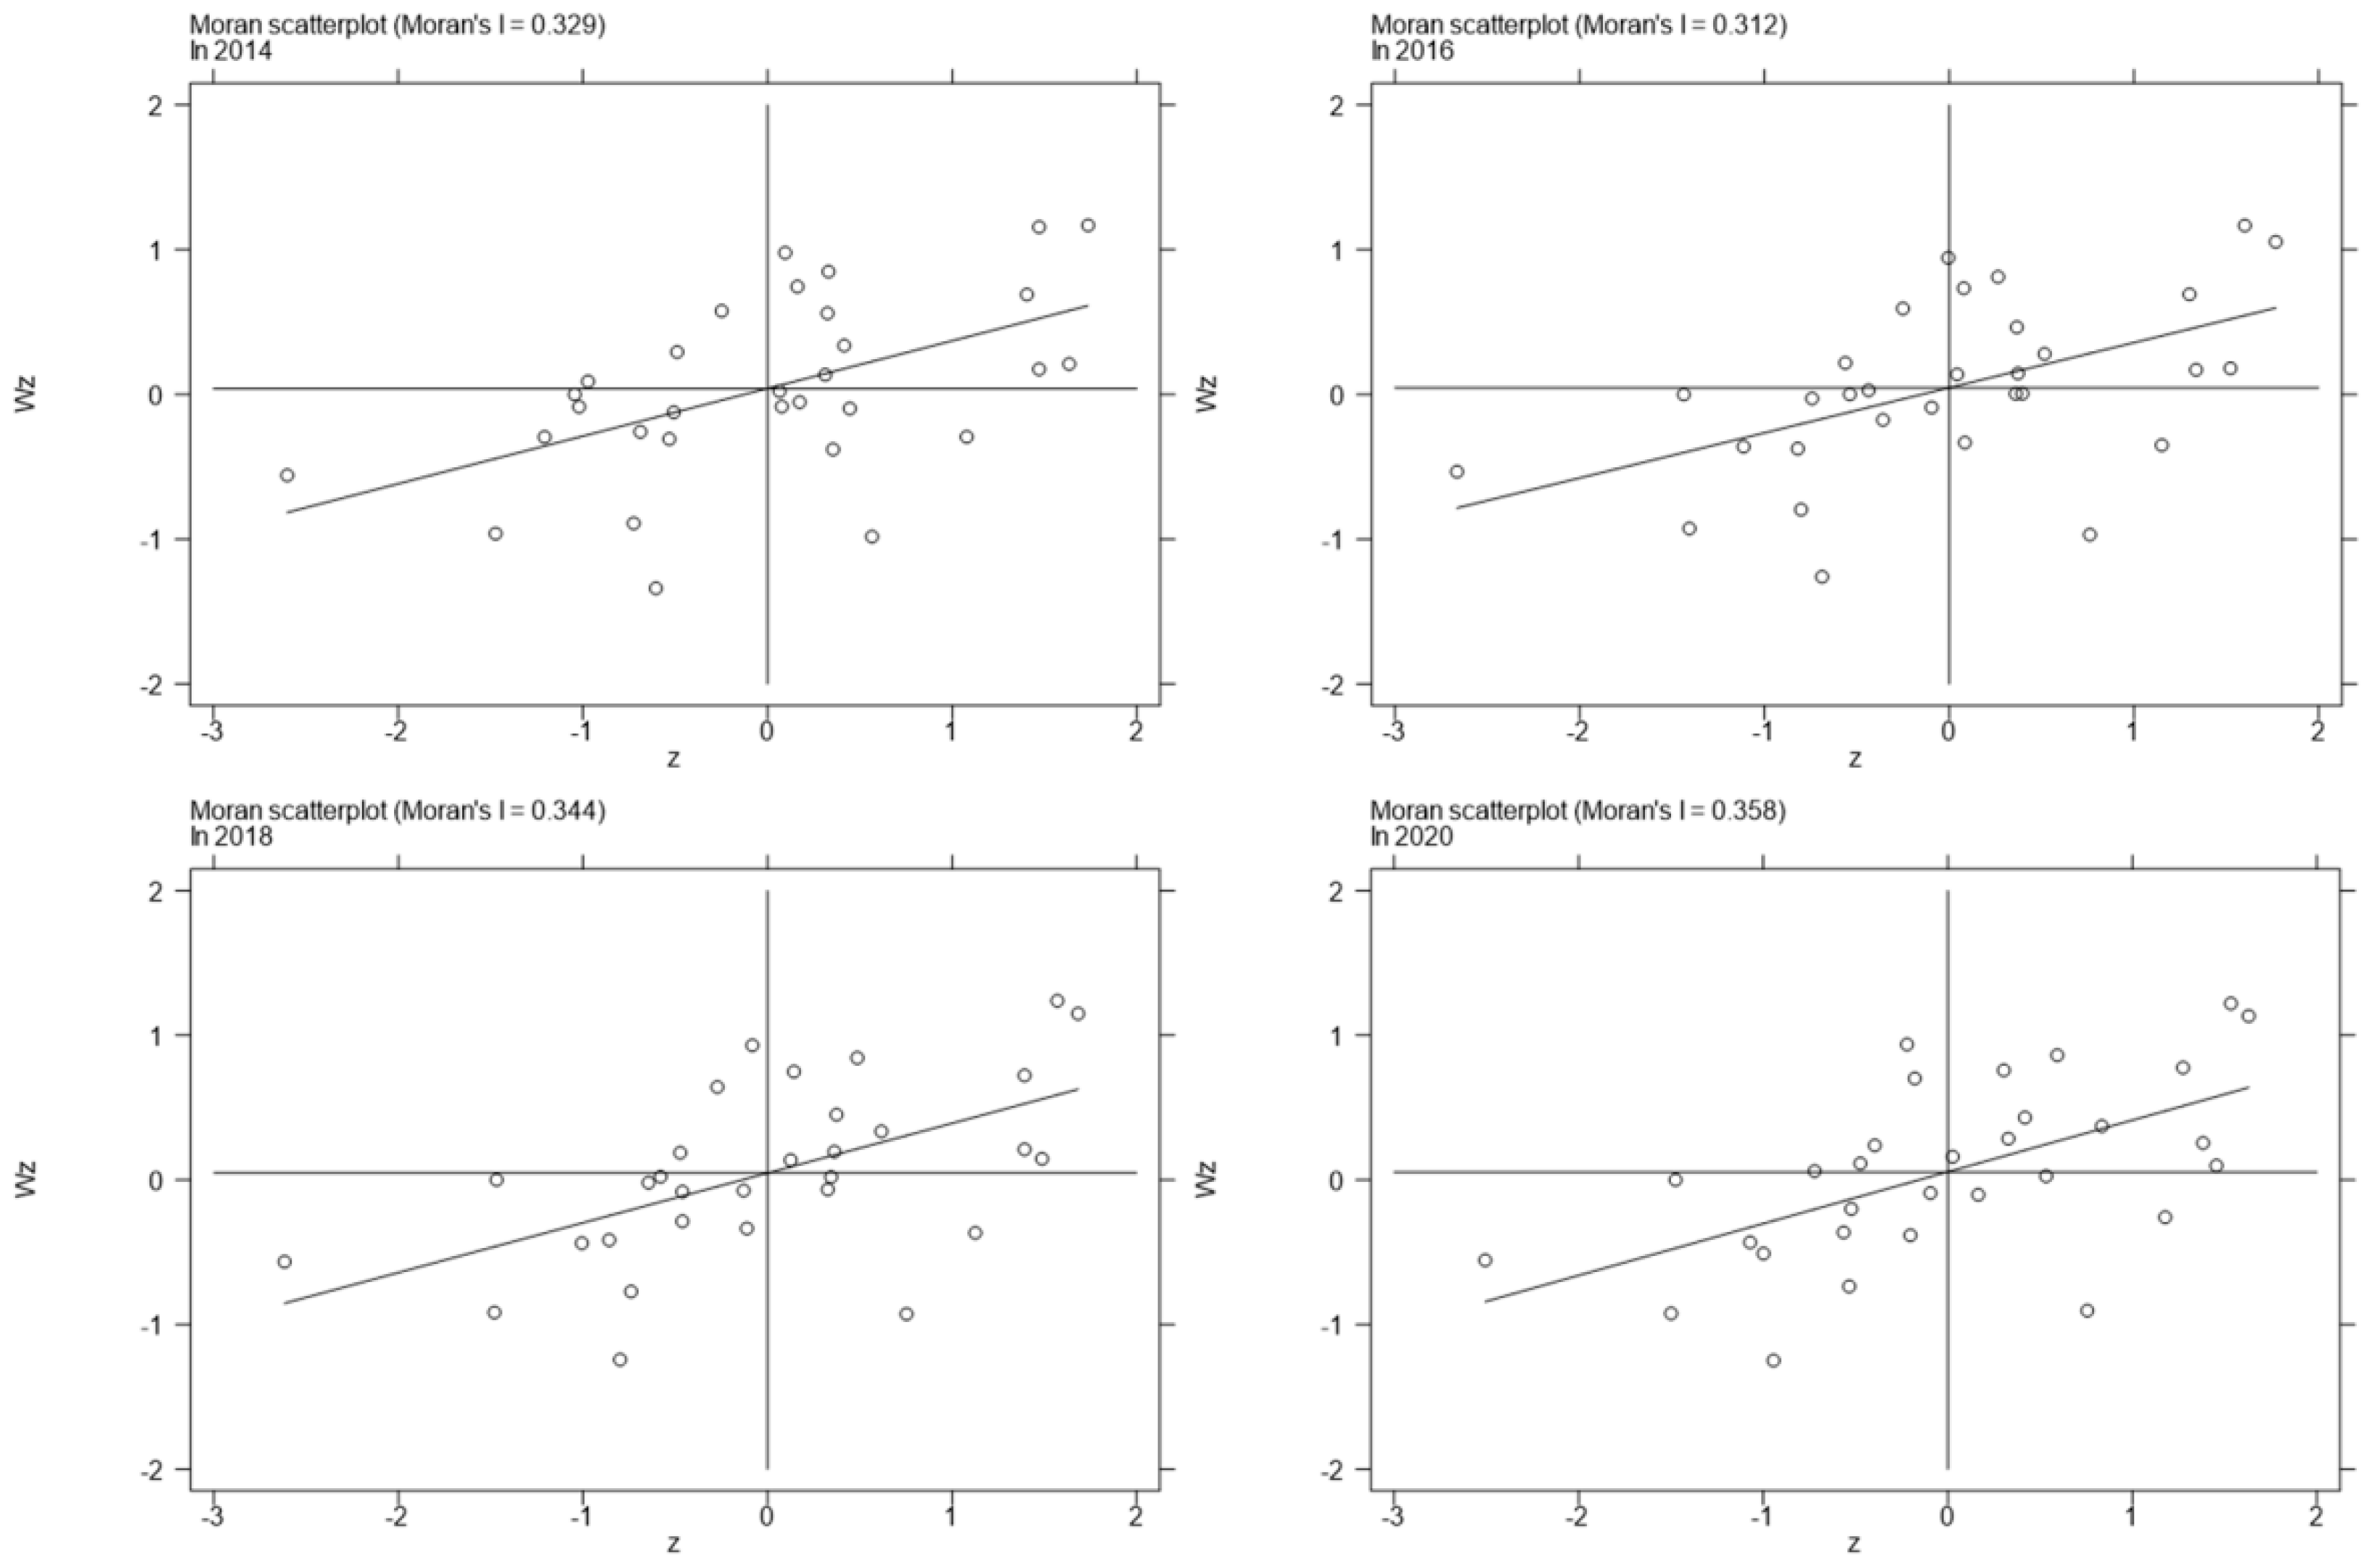
Between 2014 and 2020, a positive spatial autocorrelation (index value ranging from 0.34 to 0.37) was observed in the agglomeration level of the age-friendly environments coupling coordination degree in China (
Table 4). The results indicated a year-by-year increase in the global spatial correlation of the coupling coordination degree of the age-friendly environment in China during the study period. Additionally, all
p-values of the global Moran index from 2014 to 2020 were below 0.01, indicating a significant positive spatial correlation in the agglomeration.
The results of the global Moran Index confirm the presence of a global spatial autocorrelation in the coupled coordination degree of the age-friendly environment for the elderly in China. To gain a deeper understanding of the spatial agglomeration patterns in the local regions of the provinces regarding the coupled coordination degree of the age-friendly environment for the elderly, the agglomeration values for the sample provinces are selected for the first and last years, as well as the middle years of the research interval. Specifically, the data for the years 2014, 2016, 2018, and 2020 were utilized to create a scatter plot of the local Moran Index distribution using stata17.0. The corresponding results are presented in
Figure 4 and
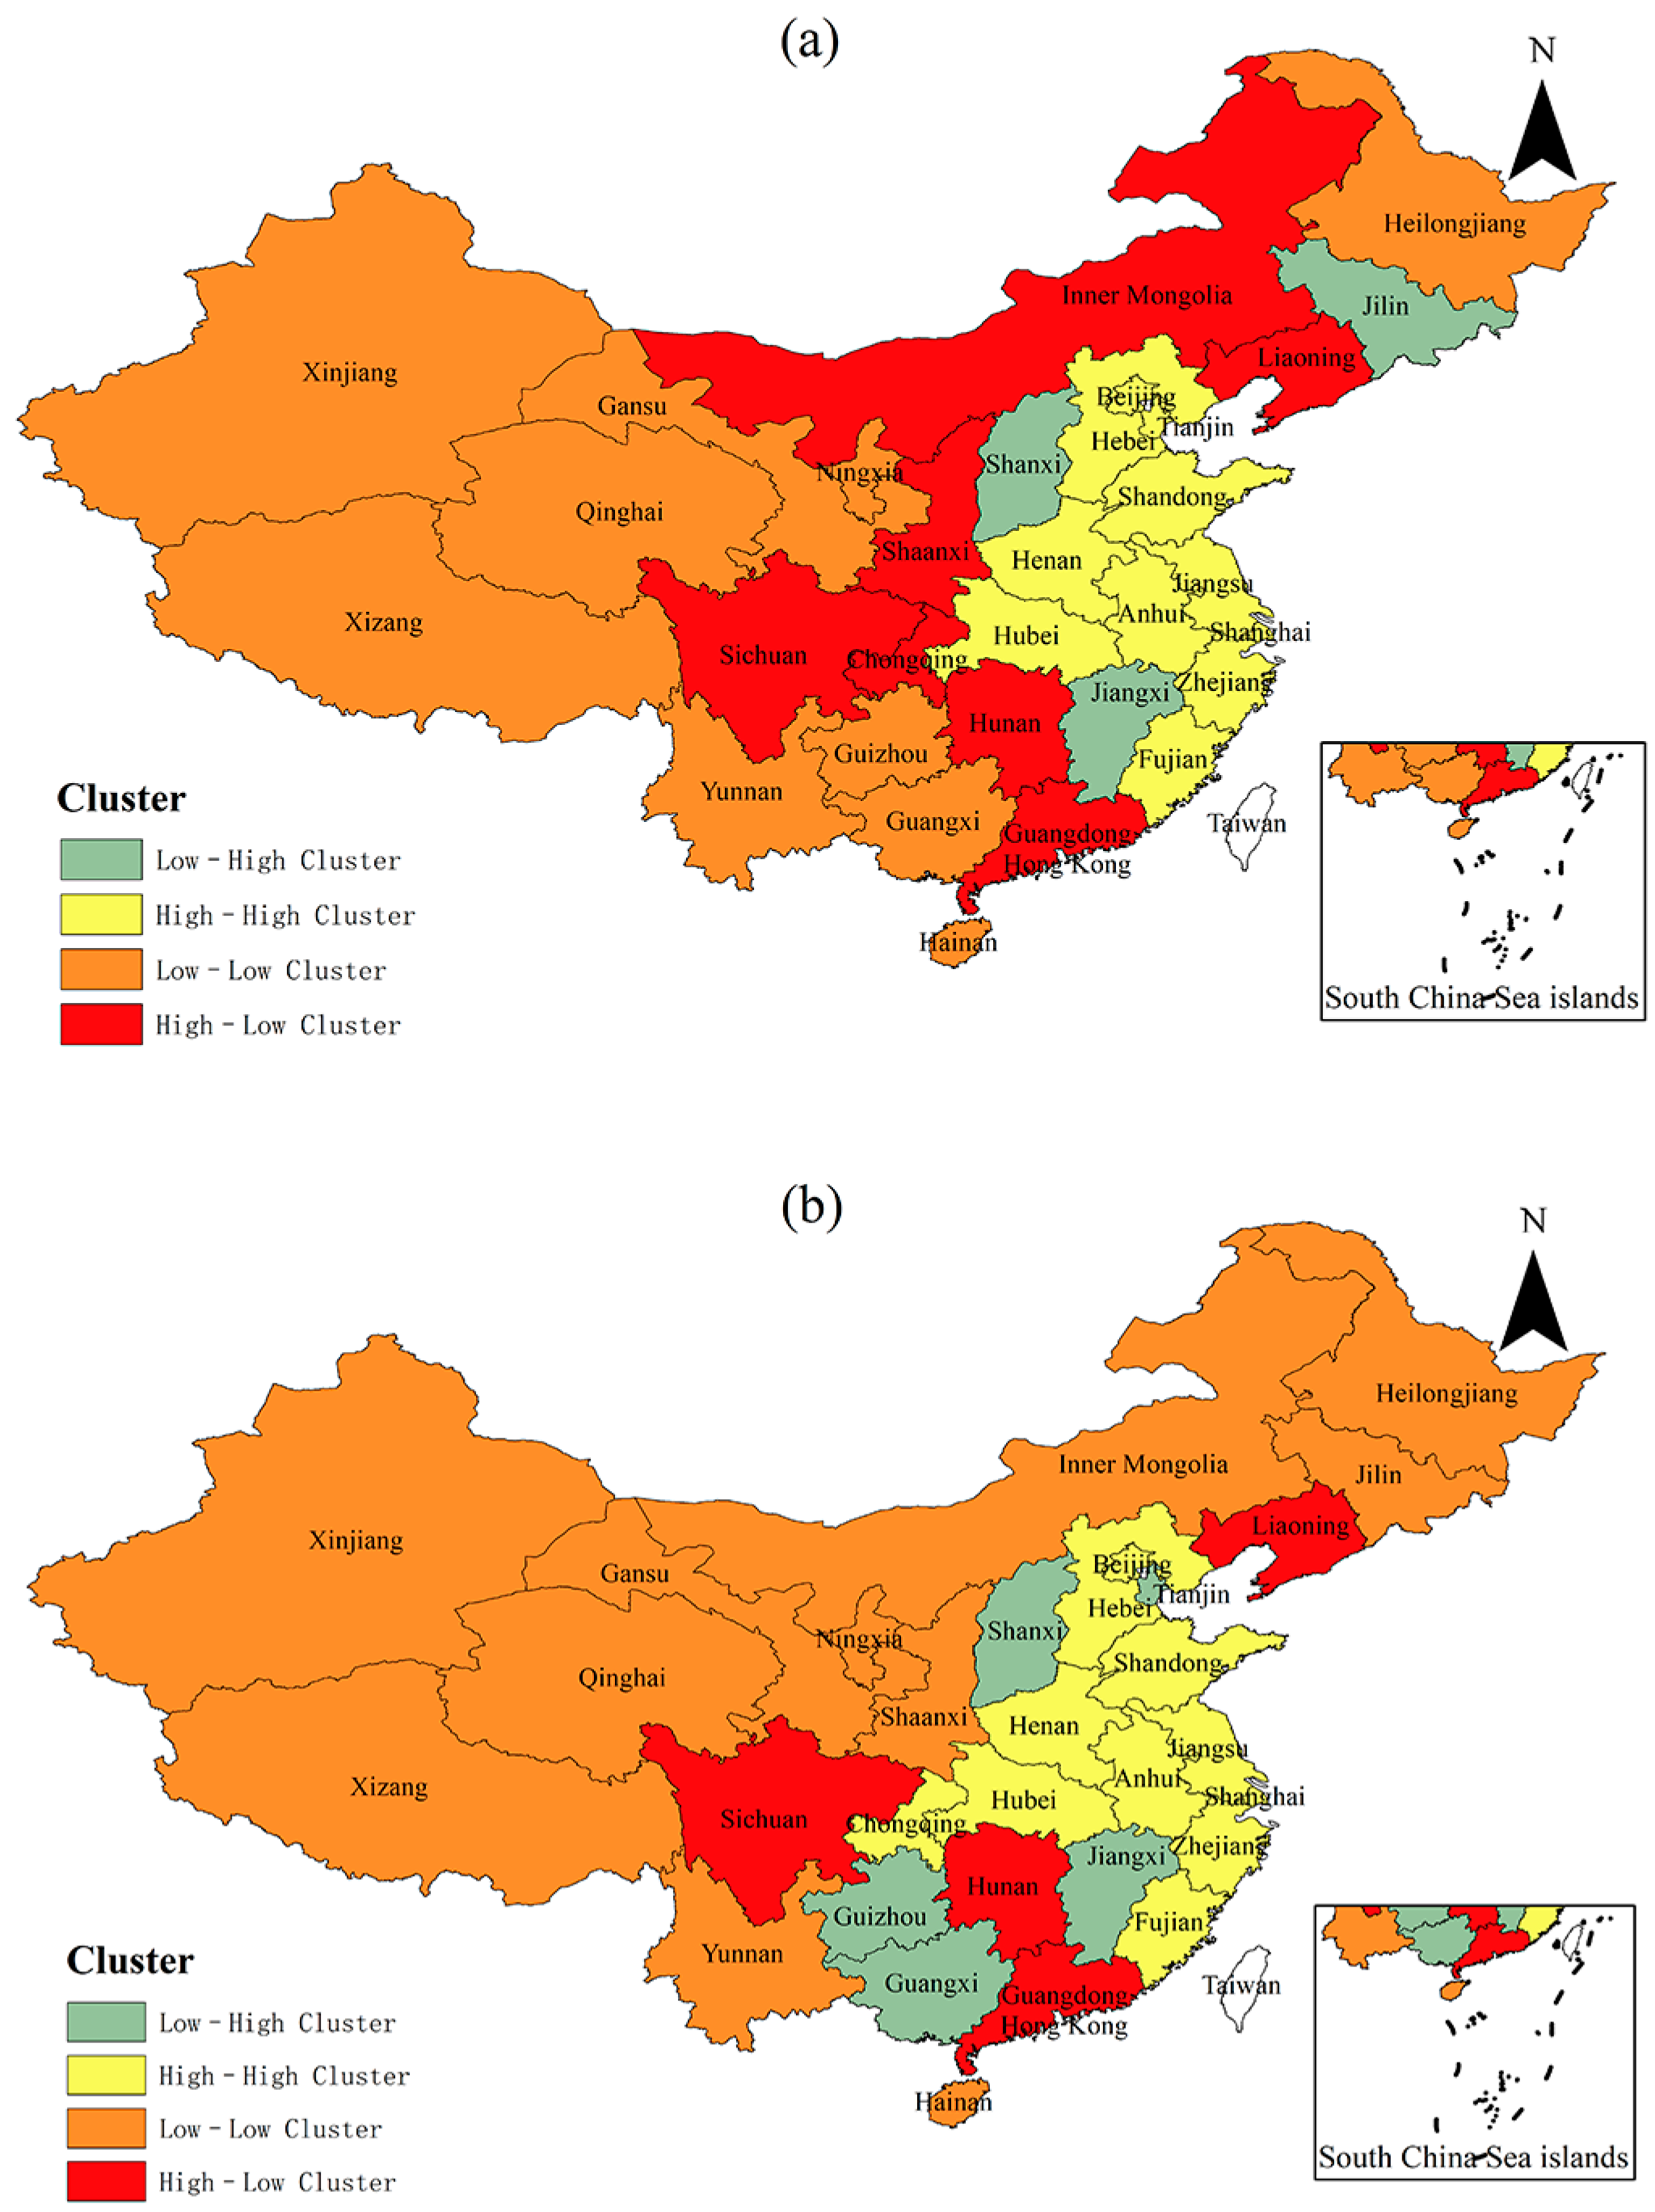
Table 5. Additionally, ArcGIS was employed to visually represent the spatial distribution of the Moran Index in 2014 and 2020 (refer to
Figure 5).
In general, the coupling coordination degree of the middle-aged and elderly-friendly environment varies across the four years, but most of them exhibit a trend of “L-L” agglomeration and “H-H” agglomeration. During the period from 2014 to 2020, the number of provinces in the first quadrant was 11, while the number of provinces in the third quadrant increased from 10 to 13. These findings suggest a clear coupling and coordination of age-friendly environments among provinces in China, accompanied by a significant positive spatial correlation. Put differently, the coupling coordination degree between the supply side and demand side in the age-friendly environment system exhibits a clear spatial spillover effect.
In 2020, compared to 2014, the eastern coastal areas including Beijing, Shanghai, Jiangsu, Zhejiang, and Shandong enjoyed improved geographical advantages, resulting in relatively high coupling coordination degrees. The surrounding areas also exhibited high coupling coordination, forming an “H-H” cluster. Shanxi and Jiangxi exhibit a low level of coupling coordination. Despite being adjacent to regions with high coupling coordination levels, they demonstrate poor correlation with the surrounding areas. Therefore, efforts are needed to enhance their ability for coordinated development with the surrounding regions, placing them in the “L-H” cluster. Heilongjiang, Yunnan, Hainan, Tibet, Gansu, Qinghai, Ningxia, and Xinjiang exhibit a low level of coupling coordination. Their adjacent regions also display low coupling coordination levels, categorizing them as part of the “L-L” cluster. The coupling coordination levels of Liaoning, Hunan, Guangdong, and Sichuan regions are higher than those of the surrounding regions. However, they do not exhibit a radiating role in driving the development of the surrounding regions, placing them in the “H-L” cluster with spatial heterogeneity. Over the course of six years, certain regions have experienced cluster transitions influenced by radiation effects from the surrounding areas. For instance, Guangxi and Guizhou have shifted from the “L-L” cluster to the “L-H” cluster. Similarly, Tianjin has transitioned from an “H-H” cluster to an “L-H” cluster, while Inner Mongolia and Shaanxi have changed from an “H-L” cluster to an “L-L” cluster.
3.4. Analysis of Regression Results of Spatial Econometric Model
Enhancing the supply level of an age-friendly environment can stimulate demand development, while the development of demand, in turn, contributes to further improving the supply output of an age-friendly environment. Consequently, establishing and maintaining a coordinated and mutually supportive relationship between the two can yield positive social and economic outcomes. However, in studying the relationship between variables, it is important to consider their spatial interdependence. The supply-demand balance of the age-friendly environment in a particular area can be influenced by the surrounding regions, and this influence has a reciprocal effect. Consequently, this violates the assumption of the classical least squares method, necessitating the establishment of a spatial econometric model to analyze the data. By testing and analyzing the spatial econometric model, we can gain further insights into the influencing factors and spatial effects of the age-friendly environment.
3.4.1. Model Test
The LM test results (
Table 6) indicate that in the spatial error model test, the Moran index, LM, and Robust LM exhibit significance within the 1% confidence interval. Similarly, in the spatial lag model test, LM and Robust LM show significance within the 5% confidence interval. To gain further clarity on selecting the spatial measurement model for age-friendly environment coupling coordination, the subsequent step involves conducting an LR test to determine whether the spatial Durbin model reduces to a spatial error model or a spatial lag model.
Both the LR test and Wald test yield a
p-value of 0.000, indicating significance within the 1% confidence interval (
Table 7). This confirms that the spatial Durbin model does not degenerate into a spatial error model or a spatial lag model. Furthermore, based on the Horsman test, the
p-value of 0 indicates significance. This rejects the hypothesis that the explanatory variable is independent of the individual effect, confirming that the fixed effect surpasses the random effect [
31]. Secondly, according to the LR test, the dual fixed effect outperforms the individual and time-fixed effects. Therefore, this study ultimately selects the dual fixed effect spatial Durbin model to analyze the coupling coordination degree of the age-friendly environment.
3.4.2. Spatial Spillover Effect Analysis
To examine the impact of each variable on the coupling coordination degree of the age-friendly environment and explore their causal pathways, this study employs a bidirectional fixed spatial Durbin model to analyze the spatial spillover effect of each variable (
Table 8). Overall, different factors exhibit distinct influences on the coupling coordination degree of the age-friendly environment in the region, leading to varying degrees of spatial spillover to the surrounding areas. In terms of overall impact, factors such as per capita green park area (X4), the green coverage rate of built-up areas (X5), gross regional product per capita (X10), and the number of individuals aged 65 and above (X11) significantly influence the coupling coordination degree of the age-friendly environment. Specifically, the direct effect coefficient of the gross regional product per capita (X10) is 0.110, which is statistically significant at the 1% level, while the indirect effect coefficient is positive but not statistically significant. This indicates that gross regional product per capita has a positive effect on promoting the coupling coordination degree of the age-friendly environment within the province. However, due to variations in provincial policies, there is a lag in the implementation of construction investment in neighboring provinces. The direct effect coefficient of the number of elderly people over 65 years old (X11) is 0.137, which is statistically significant at the 1% level, while the indirect effect coefficient is negative but not statistically significant. This is because the size of the elderly population directly influences the demand level for an age-friendly environment, which, in turn, affects its development level. However, due to the accelerated aging process of the population, the influence of population spatial agglomeration is concentrated within the province, and the neighboring provinces have limited driving capacity. Furthermore, the effect decomposition of the number of beds per 1000 elderly people (X3) and the number of nursing beds per 1000 elderly (X8) also exhibit a similar pattern, with direct positive significance and indirect insignificance. This indicates that enhancing the level of service supply directly associated with the age-friendly environment has a positive influence on improving the overall coupling coordination degree. However, the spillover effect is not significant, which could be attributed to the negative impact of the service competition mechanism.
3.4.3. Regional Heterogeneity Analysis
Related variables may also have spillover effects on neighboring provinces when influencing the coupling coordination degree of the age-friendly environment in different regions. To further investigate the varying impact levels of different influencing factors on the development of the age-friendly environment in different regions, based on the aforementioned spatial correlation analysis, specific analysis is conducted on the provinces situated in two agglomeration areas, high-high and low-low, in terms of their age-friendly environment coupling coordination degree. The results are presented in
Table 9.
The results revealed that in the high-high agglomeration region, the direct coefficient of the gross regional product per capita (X10) level was significantly positive (0.214 ***) and the indirect effect coefficient was significantly negative (−0.257 ***). This suggests that in the high-high agglomeration region, gross regional product per capita directly promotes the enhancement of the coupling coordination degree of the age-friendly environment in the province. Conversely, neighboring provinces experience a counteractive inhibition effect due to resource factor demands. The size coefficients of the elderly population (X11) are all significantly positive in the high-high agglomeration area, indicating that the growth of the elderly population has a positive promoting effect on the coupling coordination degree of the age-friendly environment in the province and neighboring provinces. This suggests that there is a significantly positive spatial spillover effect in this region. In the low-low agglomeration area with a low age-friendly environment coupling coordination degree, the direct coefficient of the gross regional product per capita (X10) level is significantly positive (0.218 **), while the indirect effect is not significant (0.167). This indicates that in the low agglomeration area, gross regional product per capita promotes the enhancement of the age-friendly environment coupling coordination degree in the province. However, it does not significantly promote the coupling coordination degree of the age-friendly environment in neighboring provinces. The size coefficient of the elderly population (X11) is not significant, suggesting that in low-low agglomeration areas, the expansion of the elderly population size still has room for development, as both their own provinces and neighboring provinces have relatively low development levels. Consequently, it does not directly impact the overall development level.
In conclusion, the same influencing factors have varying effects on the improvement of the coupling coordination degree of age-friendly environments in different regions. Consequently, different regions prioritize and tend to improve the coupling coordination degree of age-friendly environments differently, and policy recommendations should consider this heterogeneity.
4. Conclusions and Suggestions
Using panel data from 2014 to 2020 encompassing 31 provinces in China, we constructed an evaluation index system for age-friendly environments under the guidance of the active aging theory. Furthermore, we empirically analyzed the coupling and coordination relationship between the supply and demand of age-friendly environments, considering factors such as development characteristics, regional differences, influencing factors, and spatial effects. The study yielded the following conclusions:
Firstly, with respect to time, the overall coupling coordination degree exhibits an inverted U-shaped development trend from 2014 to 2020, characterized by a “rise and fall” pattern. Specifically, among the four regions, only the central region demonstrated a gradual upward trend, while the remaining regions exhibited a decline. From the perspective of provincial units, the eastern regions, including Jiangsu, Shanghai, Shandong, Beijing, and other provinces, exhibit the highest level of coupling coordination. Owing to the demand pressure resulting from the intensifying aging population, the coupling coordination degree between supply and demand exhibits a reversed development pattern, leading to an increase in the number of imbalanced development categories from 13 in 2014 to 15 in 2020. Spatially, the coupling coordination is higher in the southeast and lower in the northwest. Specifically, the distribution pattern is as follows: Eastern region > Central region > Northeast region > Western region.
Secondly, considering the regional disparities in coupling coordination degree, the overall Thiel index exhibits a slight upward trend, and the regional gaps are gradually widening, albeit not substantial at present. Regarding inter-regional development disparities, the pattern is evident. The gap between the eastern and western regions is relatively substantial, whereas the gap between the central and western regions is relatively narrower. In terms of intra-regional development disparities, the eastern, central, and western regions exhibit fluctuating downward trends, whereas the northeast region demonstrates a sustained, slight upward trend.
Lastly, the coupling coordination degree exhibits substantial spatial correlation and spatial spillover effects. The level of agglomeration in age-friendly environment coupling coordination demonstrated positive spatial autocorrelation, exhibiting a gradual and continuous upward trend and displaying noteworthy spatial interdependence. Regarding comprehensive influence, factors such as per capita green park area, the green coverage rate of built-up areas, per capita gross regional product, and the number of elderly individuals over 65 years old exert a noteworthy impact on the coupling coordination degree of the age-friendly environment. Concerning regional spillover effects, the impact of the same influencing factor (e.g., gross regional product per capita) on the coupling coordination degree of the age-friendly environment varies between H-H agglomeration areas and L-L agglomeration areas.
Considering the current situation and challenges in achieving coordinated development between the age-friendly environment and the regional economic level, the following suggestions are proposed:
Firstly, achieving a balance between supply and demand and promoting balanced development are imperative. It is crucial to elucidate the features of coordinated development within the supply and demand subsystem. In regions where supply surpasses demand, leveraging intelligent tools such as big data to precisely identify the needs of the elderly population and fine-tune the scale and content of supply is essential. In regions where demand exceeds supply, issues will be identified and addressed through pilot demonstration projects focused on age-friendly cities and livable communities, ensuring timely access for a greater number of elderly individuals to the outcomes of constructing age-friendly living environments.
Secondly, fostering a balanced development through regional coordination. Taking into account the existing spatial pattern and distribution characteristics, it is important to harness the influence of regions and provinces with higher levels of development. Enhance regional cooperation, adopt the development model of metropolitan areas and network structures, leverage the resource influence of the Beijing-Tianjin-Hebei region and the eastern coastal region, and achieve mutual benefit and win-win outcomes. Strengthen scientific and technological support, utilize digital technology, intelligent operations, overcome regional administrative barriers, and mitigate disorderly inter-regional competition.
Lastly, advancing high-quality development through the cultivation of supporting industries. The development of age-friendly environmental infrastructure in China is not keeping up with the rapid pace of population aging. Hence, it is crucial to mobilize social forces, stimulate market vitality, and enhance the construction level of the elderly care environment. Expedite policy formulation and support, and encourage and guide enterprises and markets to actively engage in the development of an age-friendly environment. The “silver economy” will be integrated with new urban development, healthcare, financial services, and other market opportunities to nurture the “silver economy,” stimulate silver consumption, and drive industrial upgrading.


