
Low-Carbon City Building and Green Development: New Evidence from Quasi Natural Experiments from 277 Cities in China

Abstract
:1. Introduction
2. Literature Review
2.1. Definition of the Concept of Green Development
2.2. Relationship between Low-Carbon City Construction and Green Development
2.3. Mechanisms of Influence between Low-Carbon City Construction and Green Development
2.4. Research Gaps and Possible Marginal Contributions
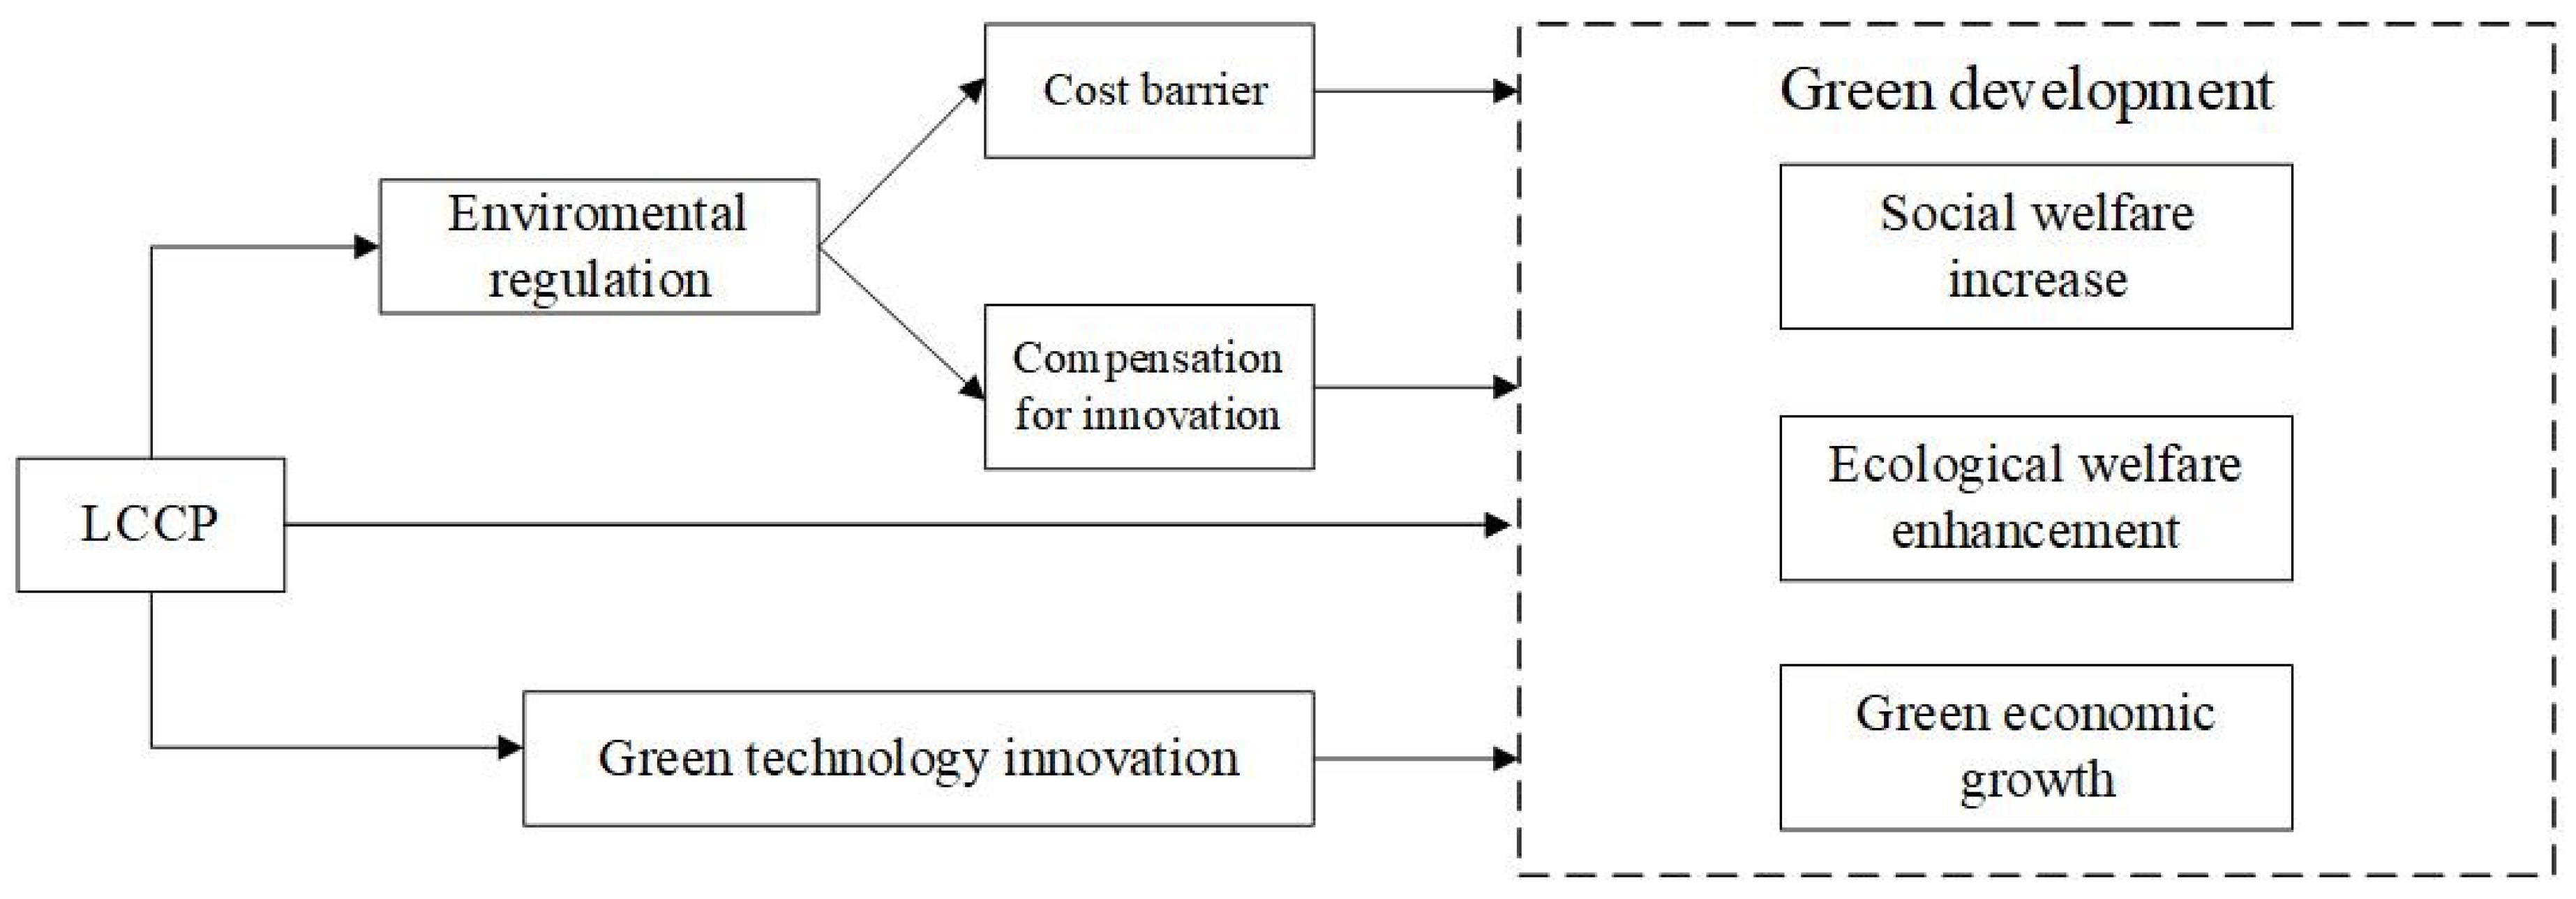
3. Mechanism Analysis
3.1. Policy Background
3.2. Interrelationships between Economic-Social-Ecological Systems
3.3. Mechanism Analysis and Hypothesis
4. Methodology and Data
4.1. Model Established
4.1.1. Multi-Period Difference-in-Differences Method
4.1.2. A Mechanistic Model of the Role of Environmental Regulation and Green Technology Innovation
4.2. Variables
4.2.1. Explained Variable: Green Development
4.2.2. Core Explanatory Variables
4.2.3. Control Variables
4.2.4. Mediating Variables
4.3. Data Sources and Descriptive Analysis
5. Empirical Results and Discussion
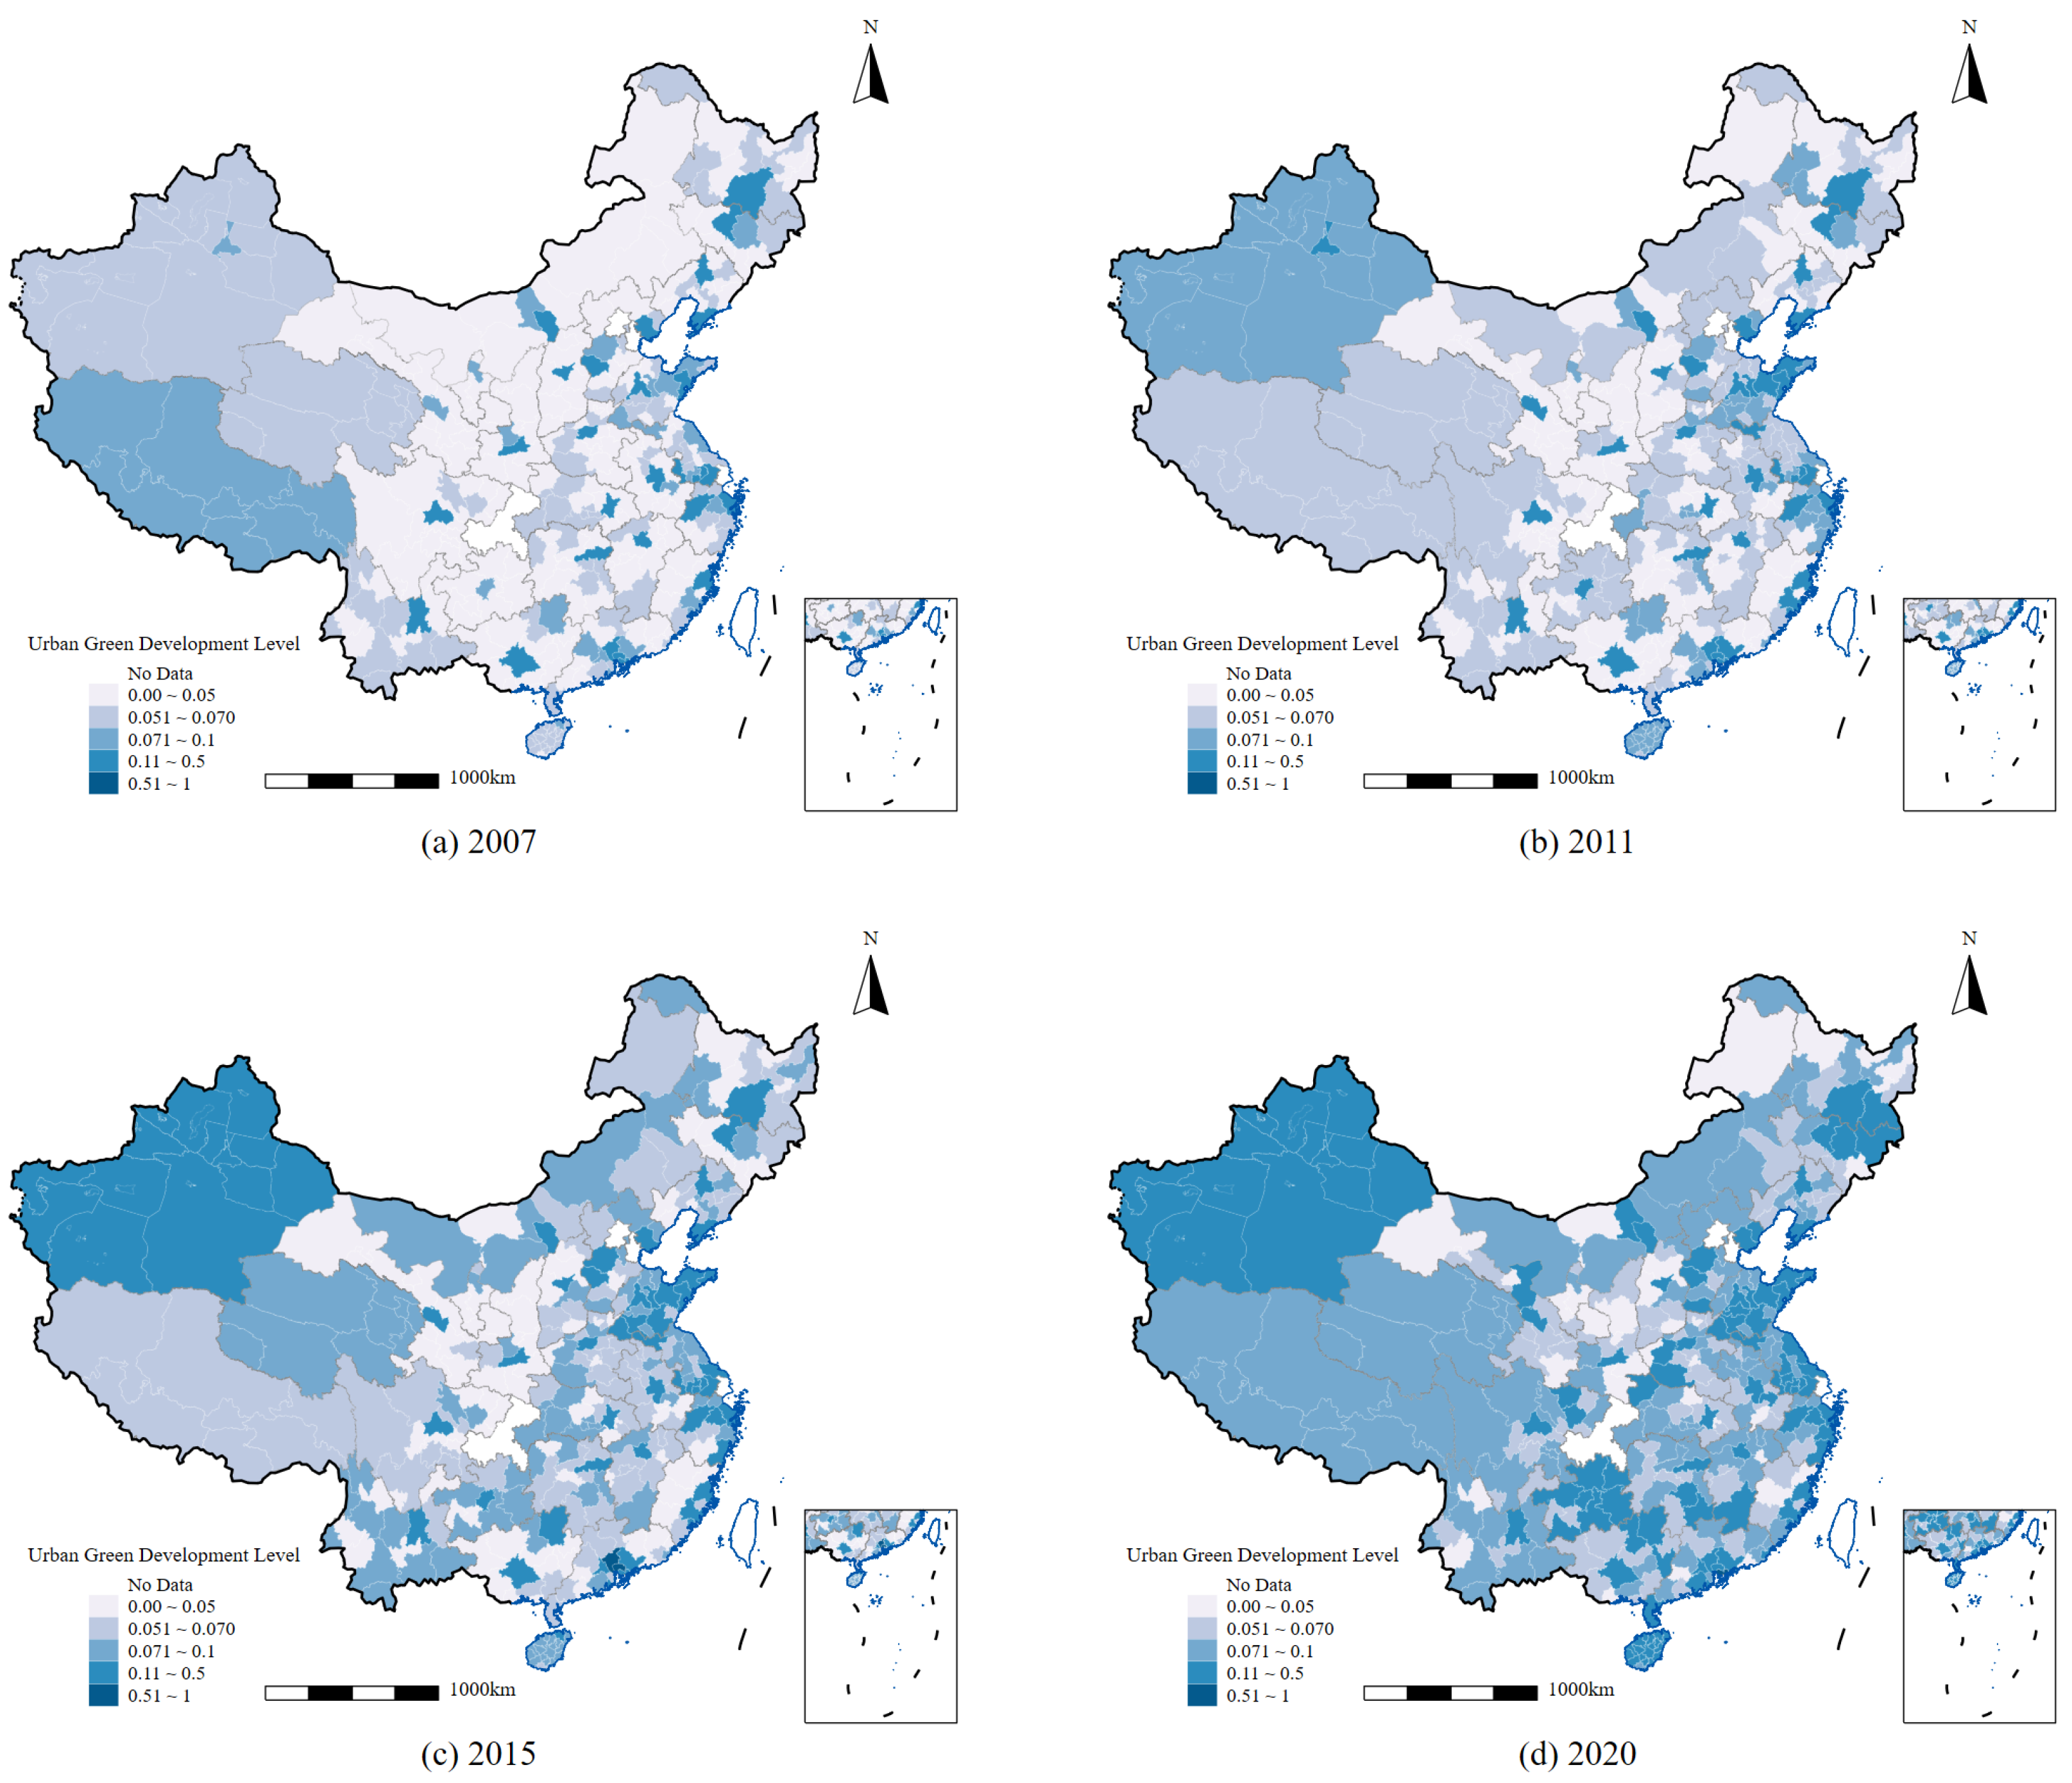
5.1. Assessment of Green Development Level
5.2. Pearson Correlation Coefficient Results
5.3. Benchmark Regression Results
5.4. Robustness Test
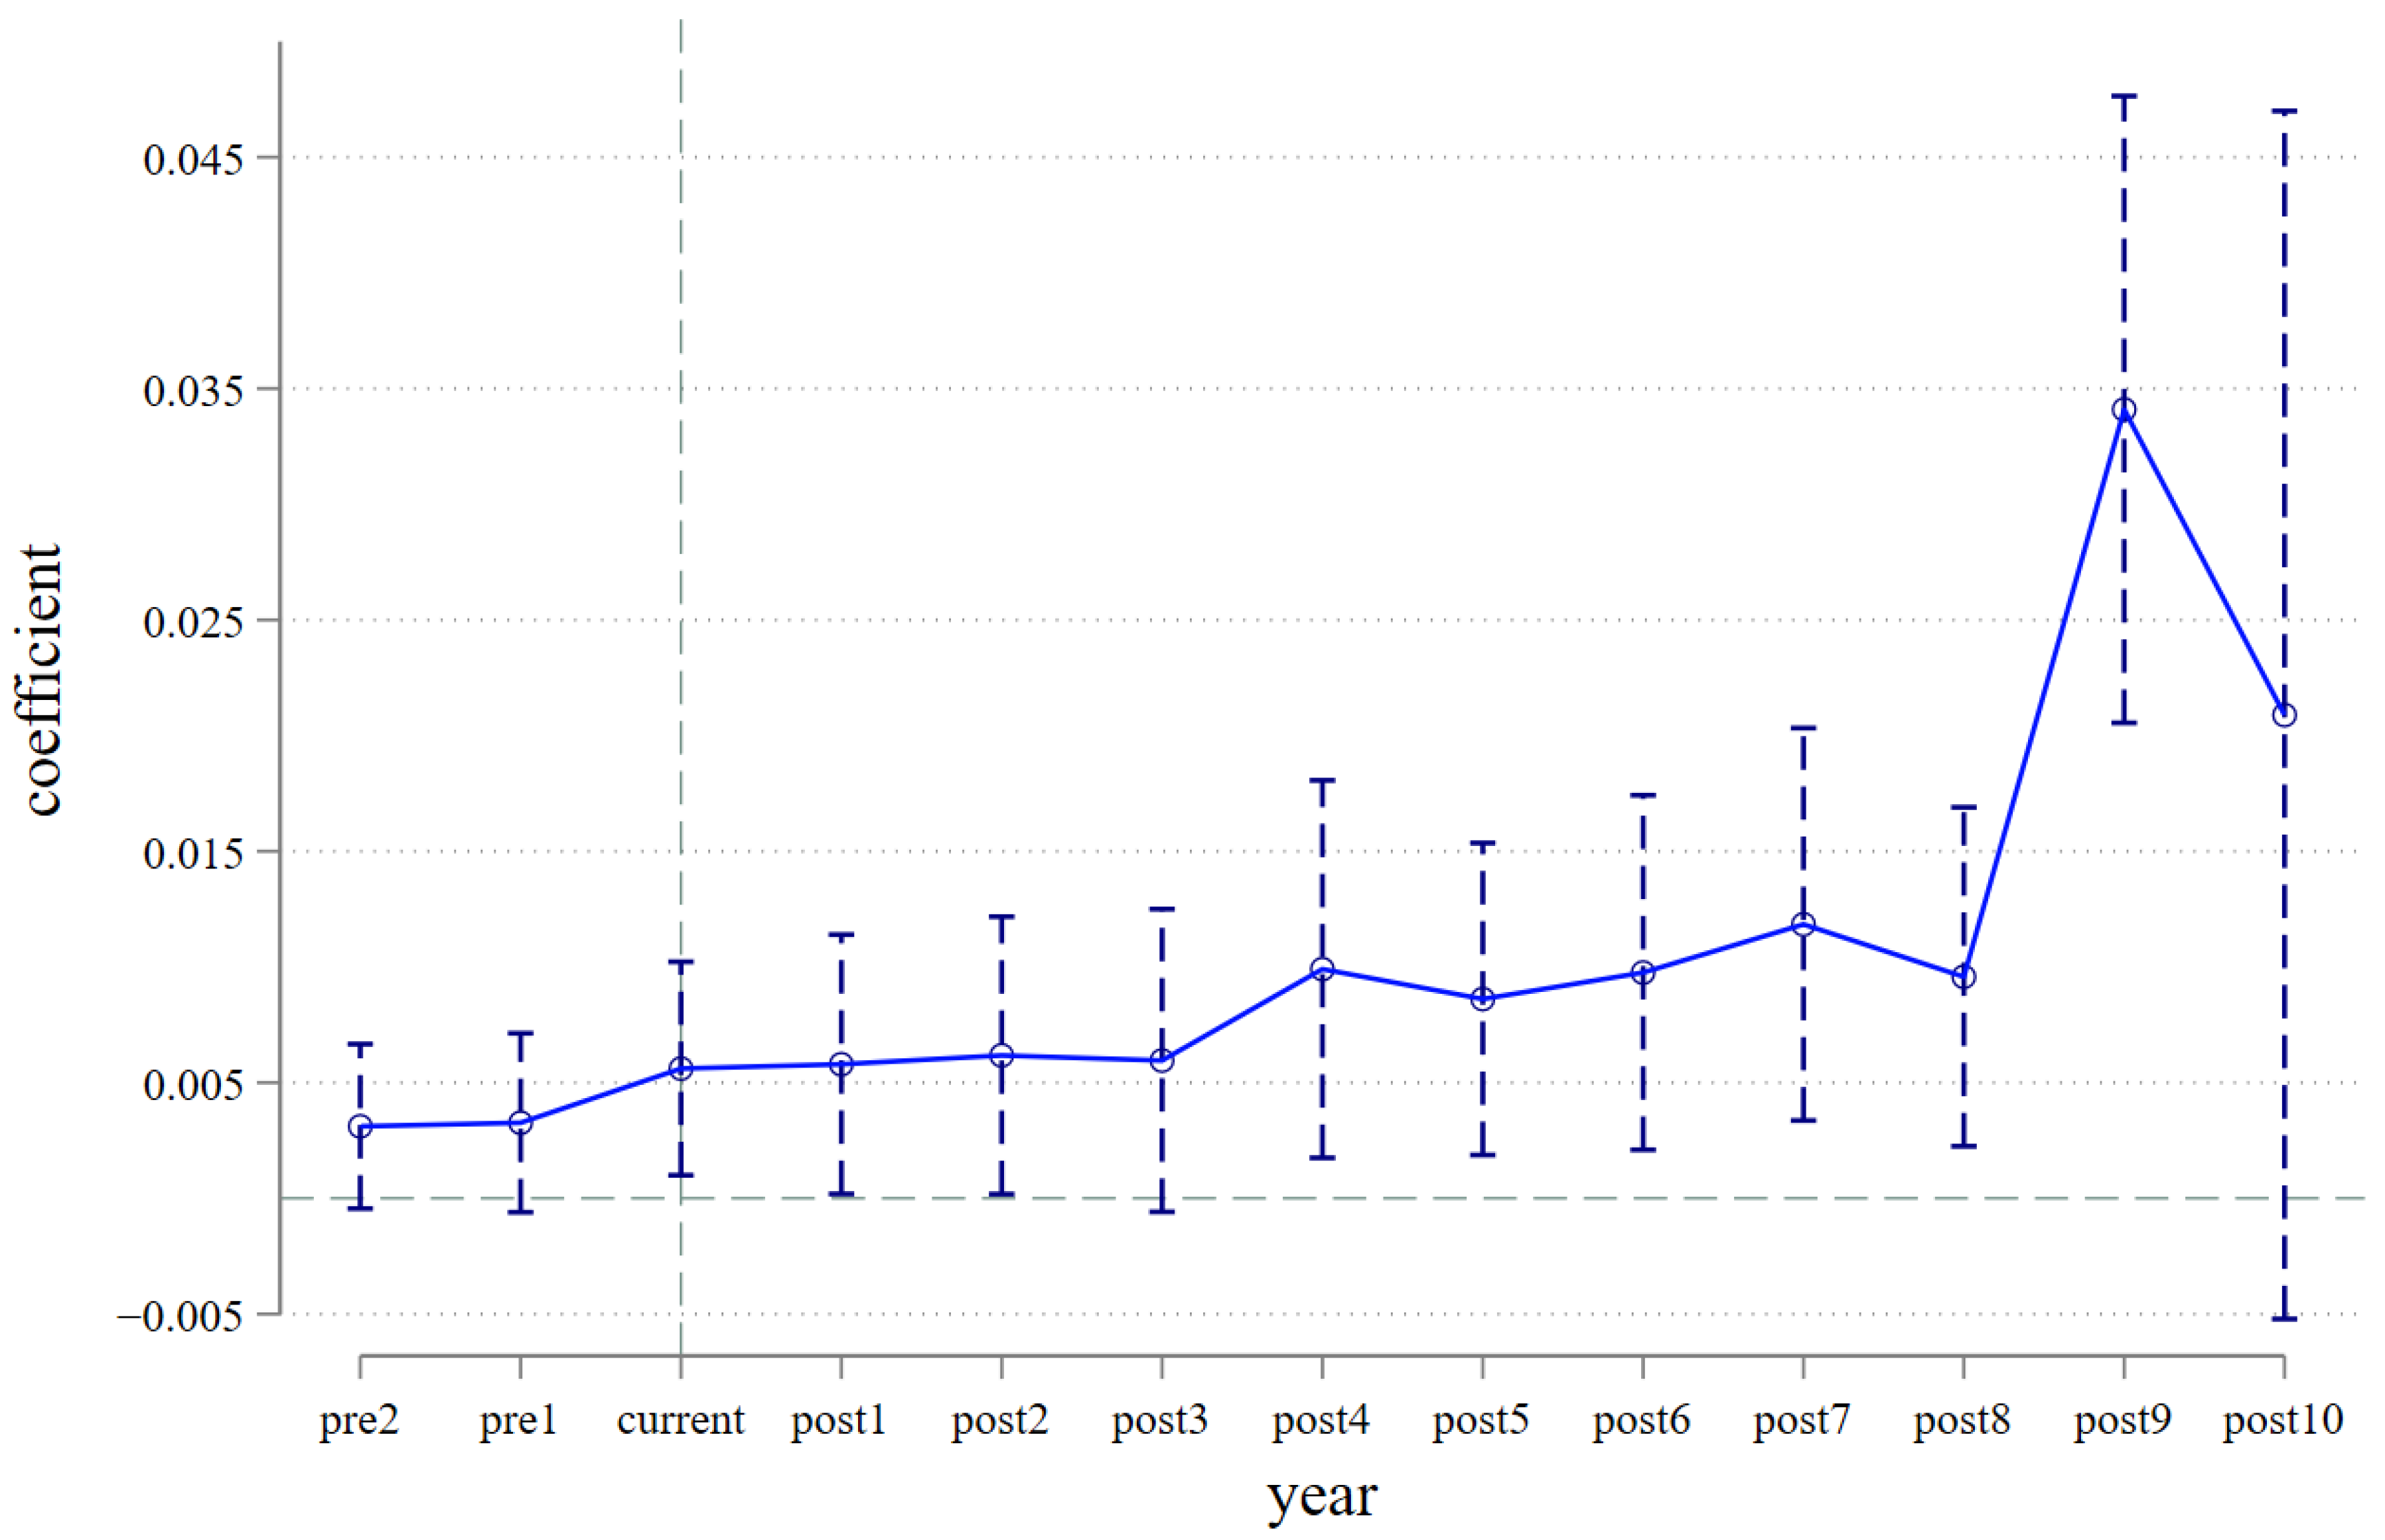
5.4.1. Parallel Trend Test
5.4.2. PSM-DID Test
5.4.3. Delete Special Samples
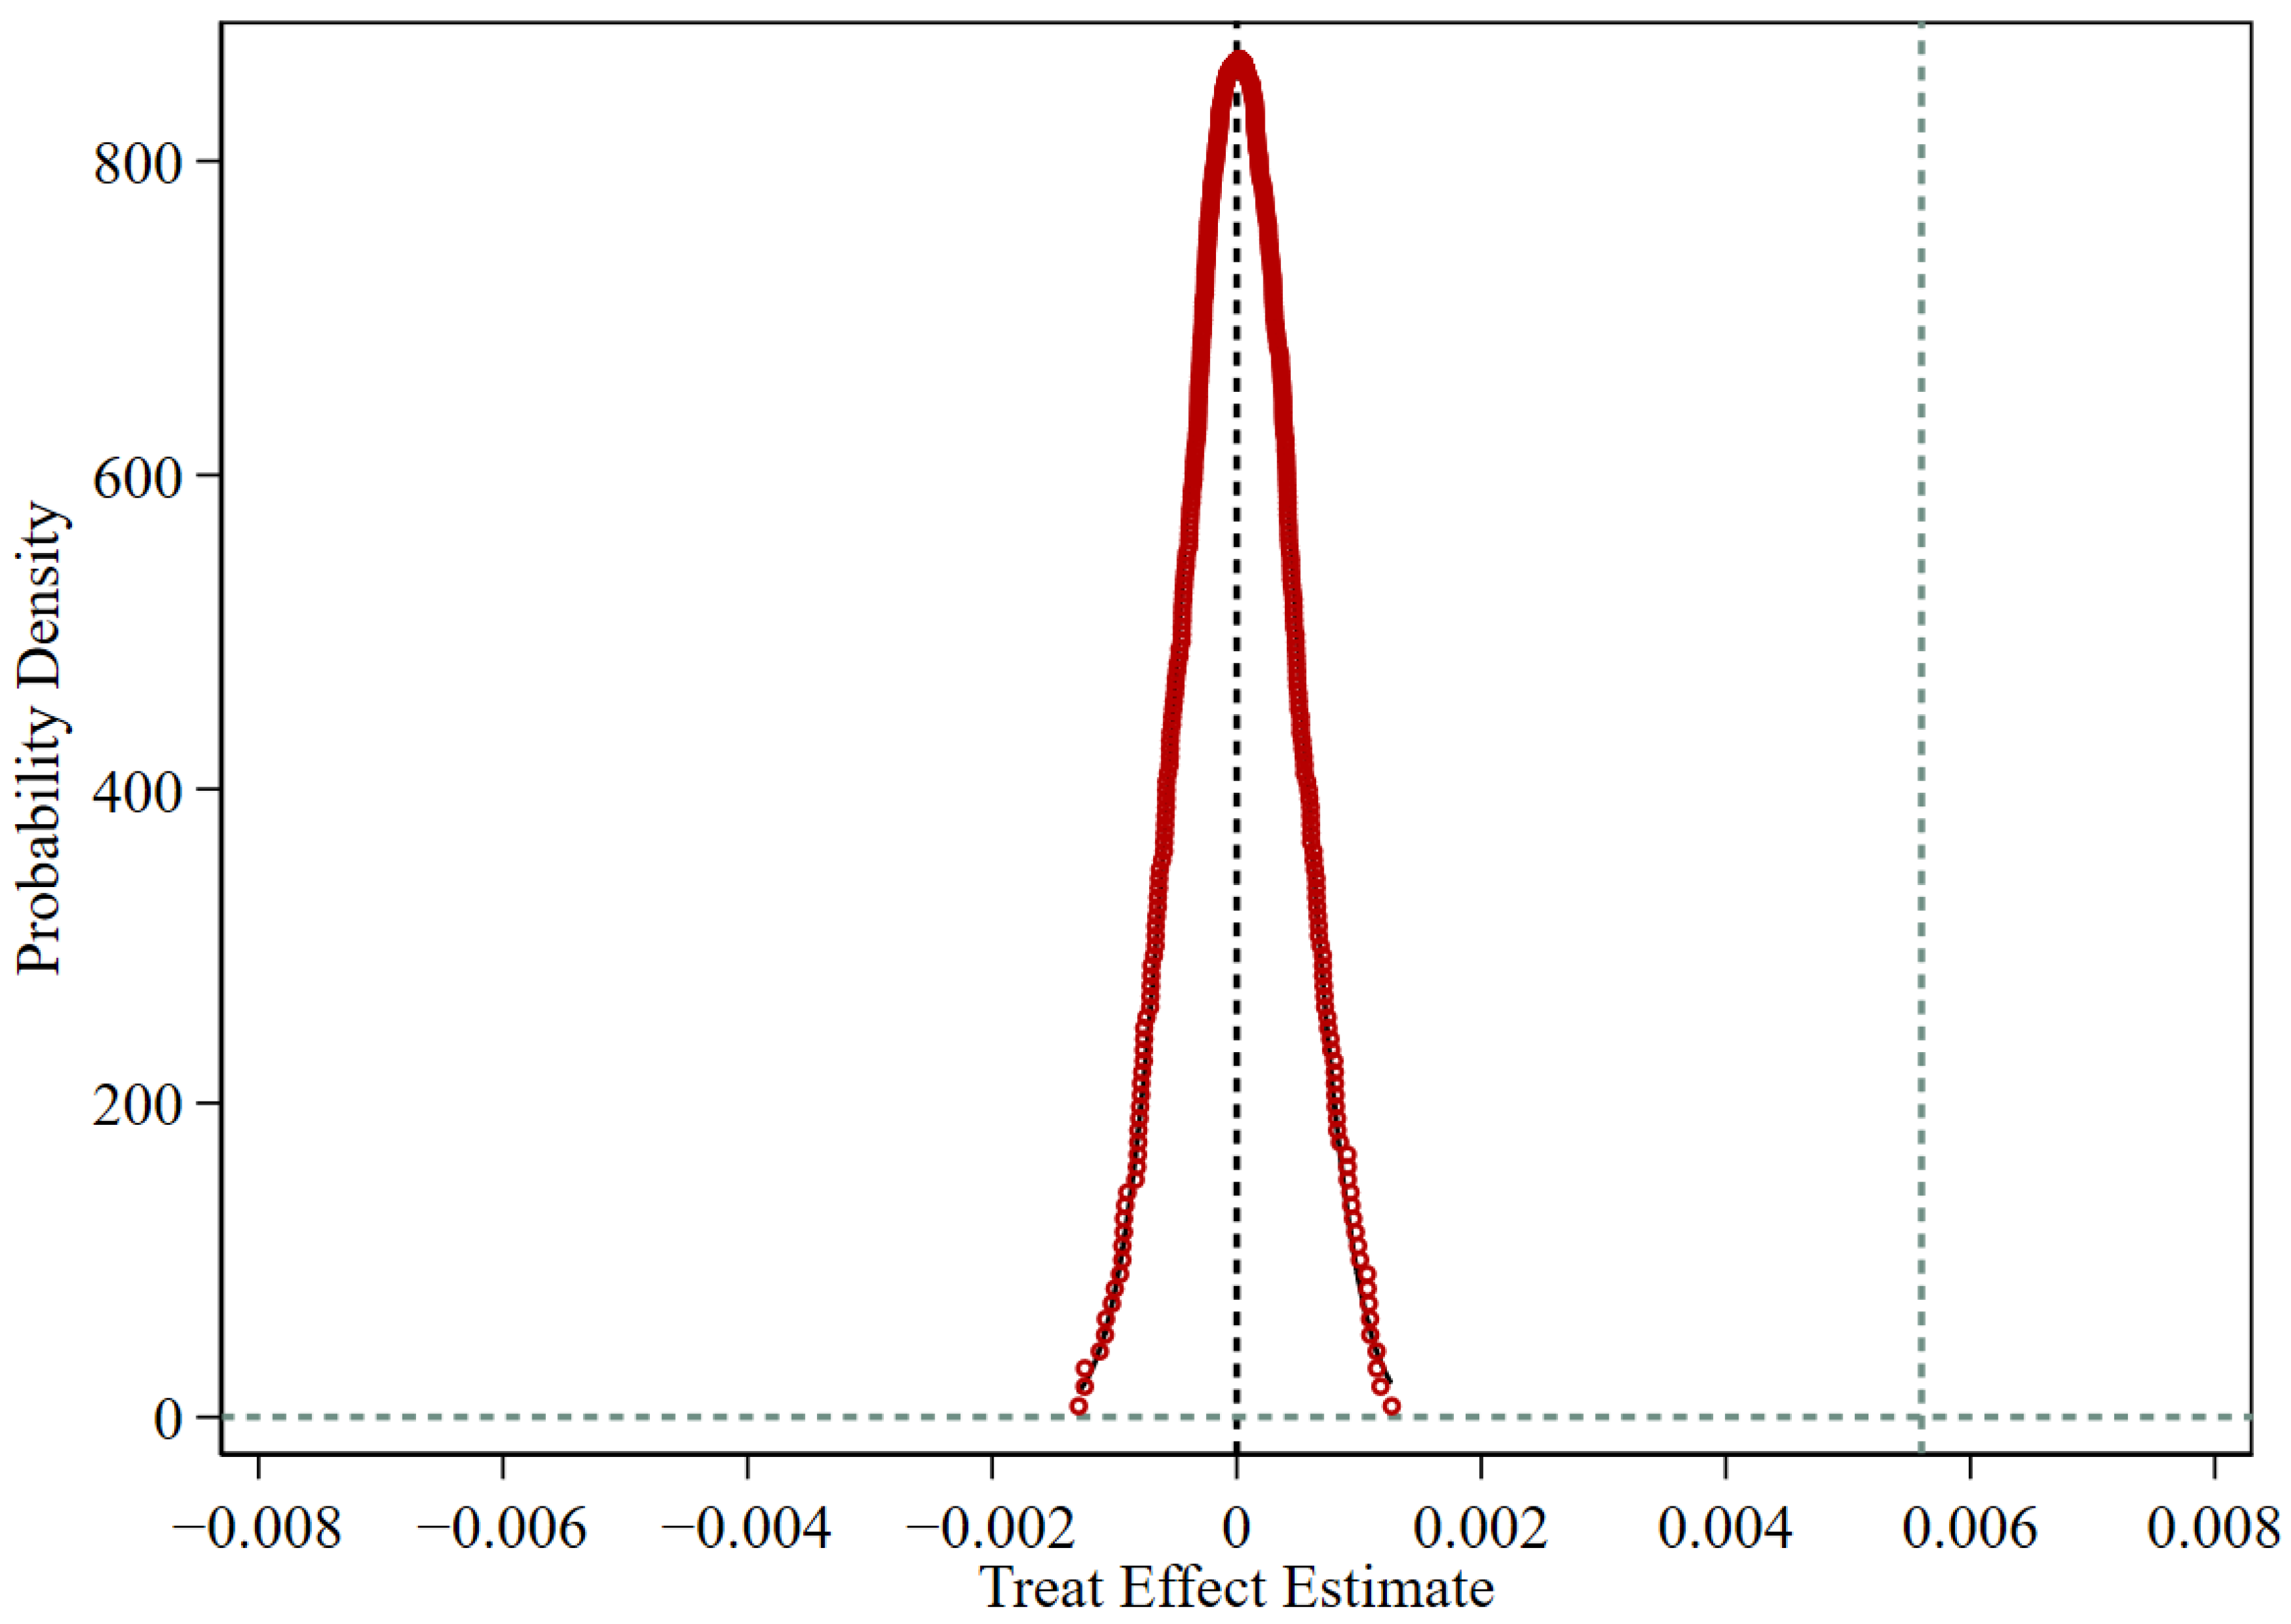
5.4.4. Placebo Test
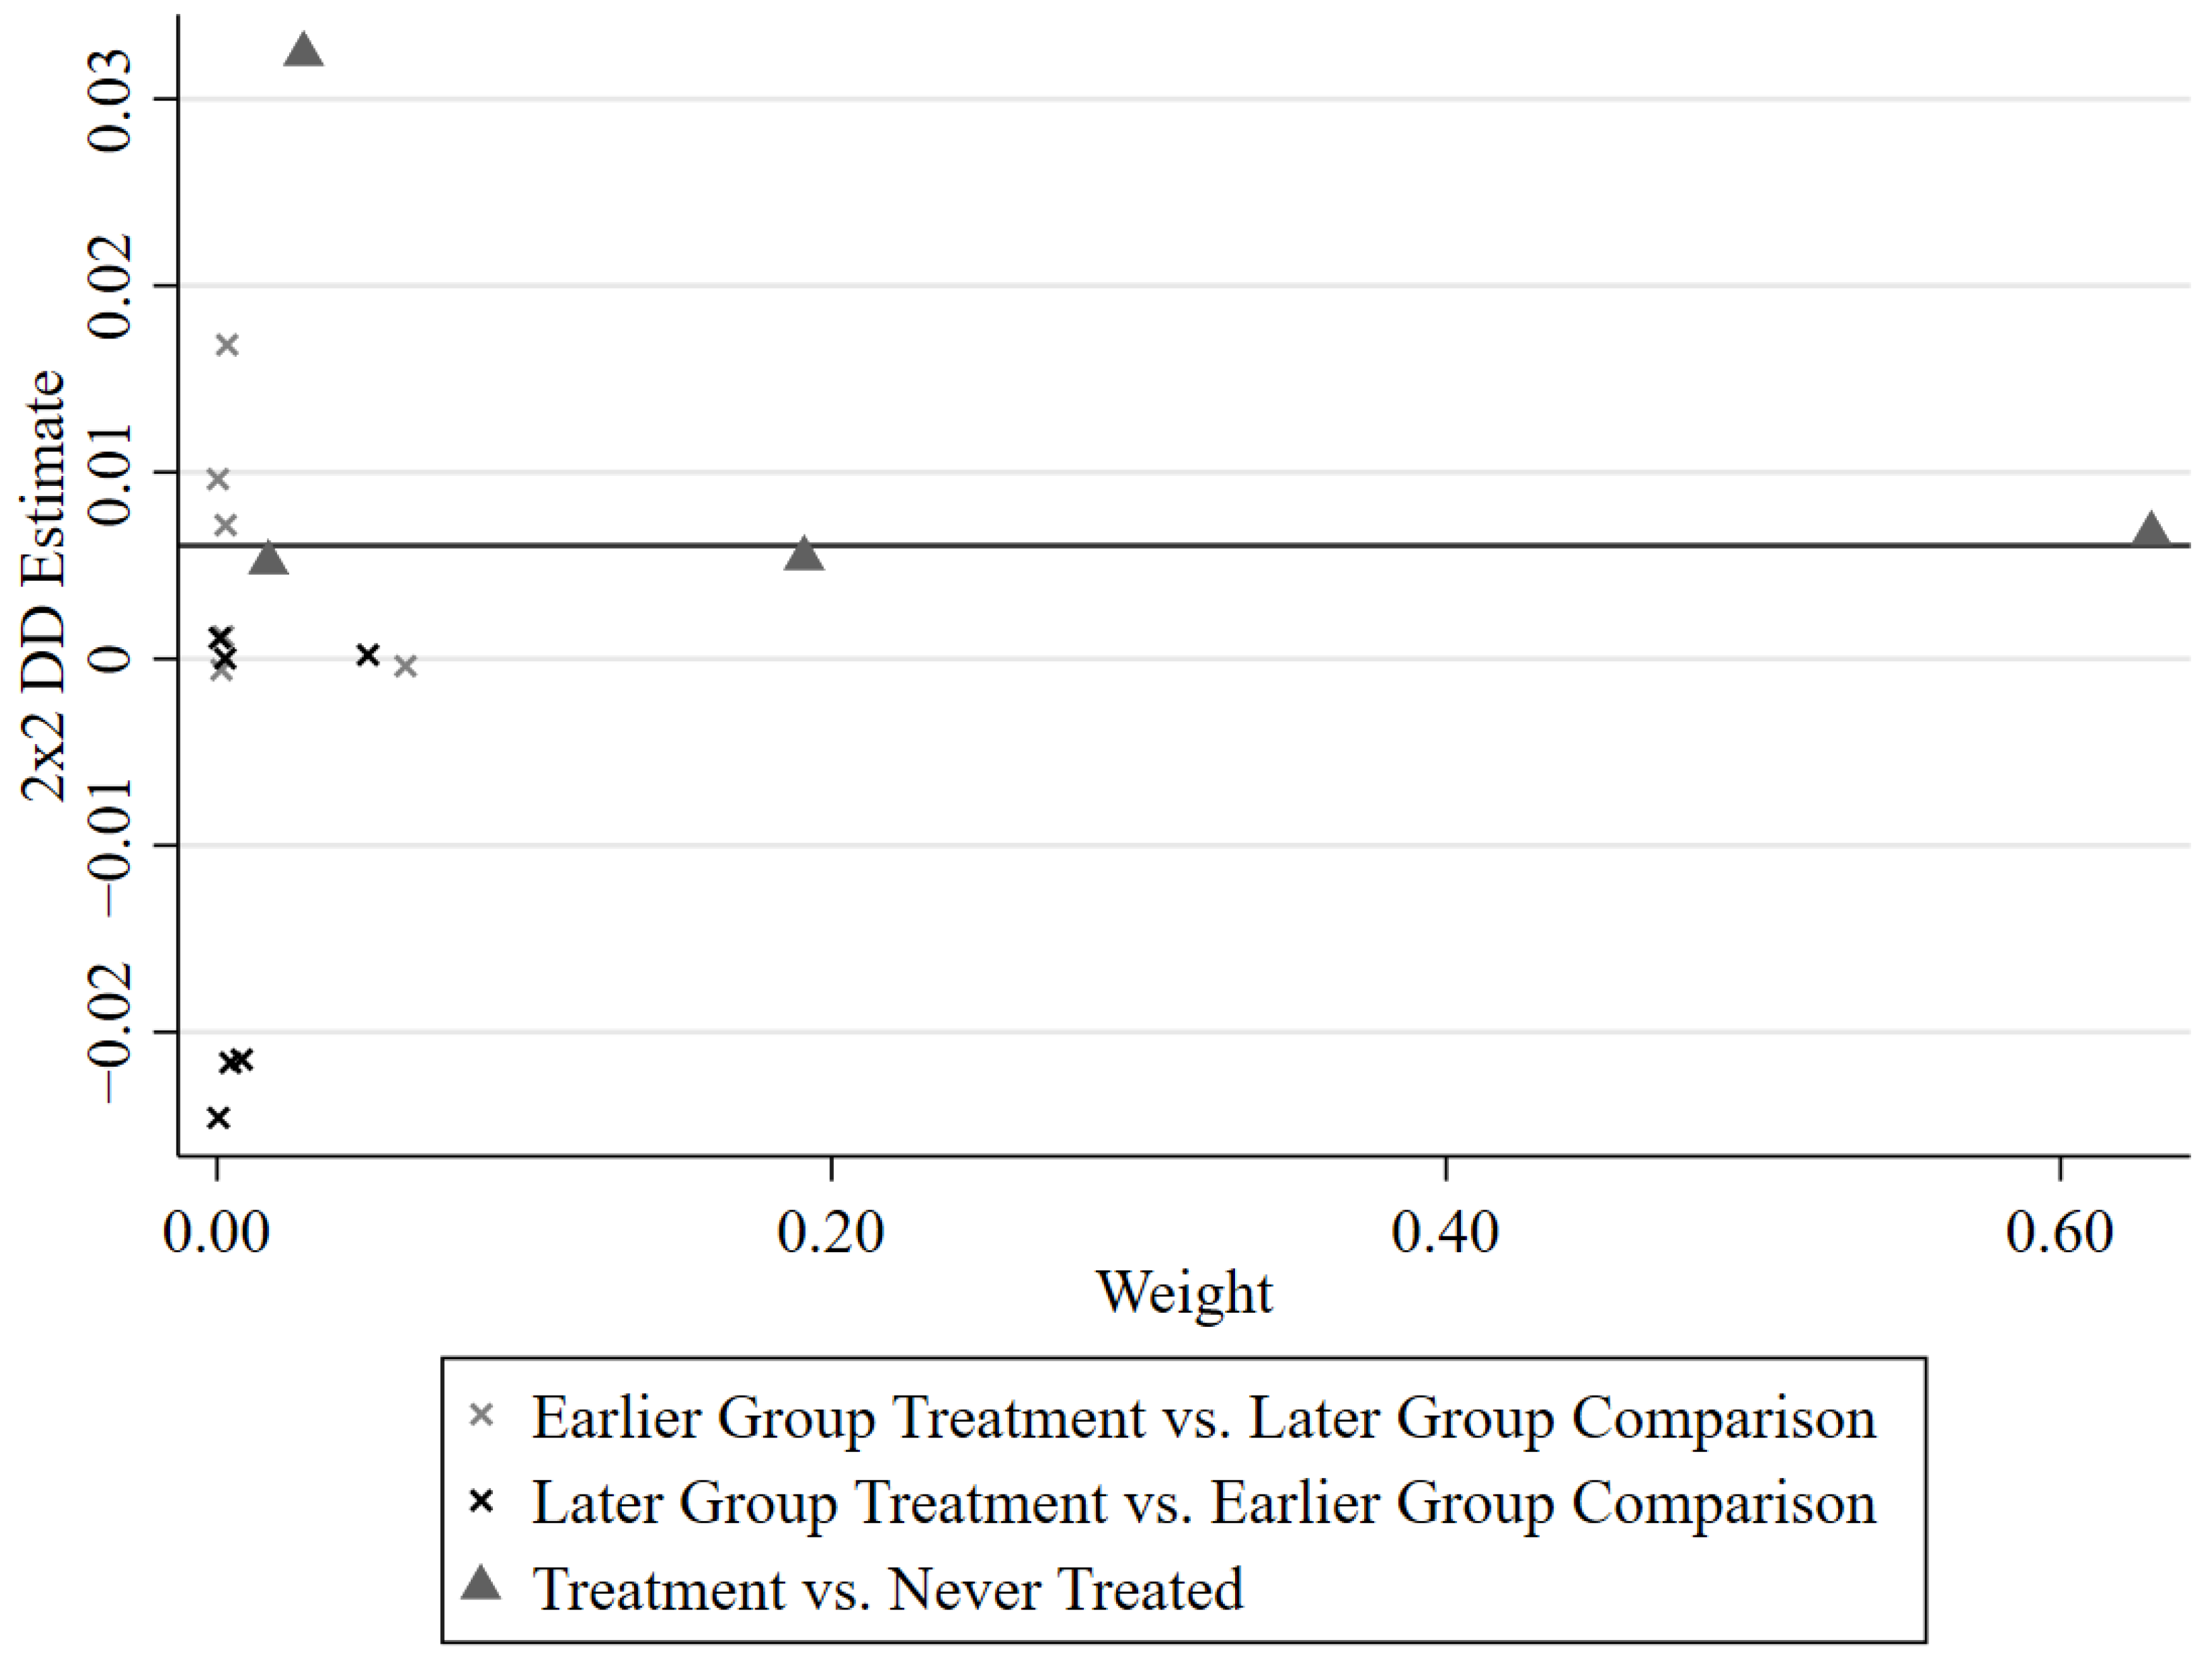
5.4.5. Bacon Breakdown
6. Mechanism Testing and Heterogeneity Analysis
6.1. Mechanism Testing Results
6.2. Heterogeneity Analysis
6.2.1. Heterogeneity Analysis of Different Geographical Locations
6.2.2. Heterogeneity Analysis of Different Resource Endowments
6.2.3. Analysis of the Heterogeneity of Different Urban Agglomerations
7. Conclusions and Implications
Author Contributions
Funding
Data Availability Statement
Conflicts of Interest
Abbreviations
| LCCP | Low-carbon city pilot policy |
| NDRC | National Development and Reform Commission |
| ED | Economic green growth |
| GD | Ecological welfare enhancement |
| density | population density |
| fix | Fixed asset investment ratio |
| ind | The level of industrialization |
| DID | Difference-in-Difference Method |
| gov | The size of local governments |
| fid | Fiscal decentralization |
| fdp | Financial development |
| Ginov | green technology innovation |
| Ginov1 | the number of green inventions applied for in the year |
| Ginov2 | the number of green utility models applied in the same year |
| ER | environmental regulation |
| Gdevelopment | City Green Development Index |
References
- Shen, L.; Yang, Y.; Bao, H.D.X.; Du, X.; He, H. Residents’ Perceptions on the Urban Resources Environment in Chinese Large Cities. SSRN Electron. J. 2023, 100, 107080. [Google Scholar] [CrossRef]
- Ramzan, M.; Abbasi, K.R.; Salman, A.; Dagar, V.; Alvarado, R.; Kagzi, M.M. Towards the dream of go green: An empirical importance of green innovation and financial depth for environmental neutrality in world’s top 10 greenest economies. Technol. Forecast. Soc. Chang. 2023, 189, 122370. [Google Scholar] [CrossRef]
- Xu, G.; Chang, H.P.; Meng, L.; Marma, K.J.S. Green development level, resource utilization, and ecological protection across China from 2006 to 2017: Based on the national standard indicator system. Environ. Dev. 2022, 44, 100776. [Google Scholar]
- Ji, Q.; Li, C.; Jones, P.J. New green theories of urban development in China. Sustain. Cities Soc. 2017, 30, 248–253. [Google Scholar] [CrossRef]
- Tian, Y.; Wang, R.; Liu, L.; Ren, Y. A spatial effect study on financial agglomeration promoting the green development of urban agglomerations. Sustain. Cities Soc. 2021, 70, 102900. [Google Scholar] [CrossRef]
- Cheng, Z.; Wang, L.; Zhang, Y.W. Does smart city policy promote urban green and low-carbon development? J. Clean. Prod. 2022, 379, 134780. [Google Scholar] [CrossRef]
- Wang, Z.; Liang, F.; Li, C.; Xiong, W.; Chen, Y.; Xie, F. Does China’s low-carbon city pilot policy promote green development? Evidence from the digital industry. J. Innov. Knowl. 2023, 8, 100339. [Google Scholar] [CrossRef]
- Song, Q.; Qin, M.; Wang, R.; Qi, Y. How does the nested structure affect policy innovation? Empirical research on China’s low-carbon pilot cities. Energy Policy 2020, 144, 111695. [Google Scholar] [CrossRef]
- Zhang, H.; Feng, C.; Zhou, X. Going carbon-neutral in China: Does the low-carbon city pilot policy improve carbon emission efficiency? Sustain. Prod. Consum. 2022, 33, 312–329. [Google Scholar] [CrossRef]
- Yadav, A. A review of green and innovative technology for a sustainable environment. Sustain. Environ.-Clean 2021, 1, 71–83. [Google Scholar]
- Zhong, Z.; Chen, Z. Urbanization, green development and residents’ happiness: The moderating role of environmental regulation. Environ. Impact Assess. Rev. 2022, 97, 106900. [Google Scholar] [CrossRef]
- D’Amato, D.; Droste, N.; Allen, B.S.; Kettunen, M.; Lähtinen, K.; Korhonen, J.E.; Leskinen, P.; Matthies, B.D.; Toppinen, A. Green, circular, bio economy: A comparative analysis of sustainability avenues. J. Clean. Prod. 2017, 168, 716–734. [Google Scholar] [CrossRef]
- Loiseau, E.; Saikku, L.; Antikainen, R.; Droste, N.; Hansjürgens, B.; Pitkänen, K.; Leskinen, P.; Kuikman, P.J.; Thomsen, M. Green economy and related concepts: An overview. J. Clean. Prod. 2016, 139, 361–371. [Google Scholar] [CrossRef]
- Li, Y.; Chen, Y.; Li, Q. Assessment analysis of green development level based on S-type cloud model of Beijing-Tianjin-Hebei, China. Renew. Sustain. Energy Rev. 2020, 133, 110245. [Google Scholar] [CrossRef]
- Xiao, Y.; Chen, J.; Wang, X.; Lu, X. Regional green development level and its spatial spillover effects: Empirical evidence from Hubei Province, China. Ecol. Indic. 2022, 143, 109312. [Google Scholar] [CrossRef]
- Mondejar, M.E.; Avtar, R.; Diaz, H.L.B.; Dubey, R.K.; Esteban, J.; Gómez-Morales, A.; Hallam, B.J.; Mbungu, N.T.; Okolo, C.C.; Prasad, K.A.; et al. Digitalization to achieve sustainable development goals: Steps towards a Smart Green Planet. Sci. Total Environ. 2021, 794, 148539. [Google Scholar] [CrossRef] [PubMed]
- Chen, H.; Qi, S.; Zhang, J. Towards carbon neutrality with Chinese characteristics: From an integrated perspective of economic growth-equity-environment. Appl. Energy 2022, 324, 119719. [Google Scholar] [CrossRef]
- Zhou, Y.; Li, G.; Zhou, S.; Hu, D.; Zhang, S.; Kong, L. Spatio-temporal differences and convergence analysis of green development efficiency of marine economy in China. Ocean. Coast. Manag. 2023, 238, 106560. [Google Scholar] [CrossRef]
- Li, W.; Zhang, Y.; Yang, C.; Gong, W.; Wang, C.; Zhang, R. Does producer services agglomeration improve urban green development performance of the Yangtze River Economic Belt in China? Ecol. Indic. 2022, 145, 109581. [Google Scholar] [CrossRef]
- Ge, T.; Li, C.; Li, J.; Hao, X. Does neighboring green development benefit or suffer from local economic growth targets? Evidence from China. Econ. Model. 2022, 120, 106149. [Google Scholar] [CrossRef]
- Huo, W.; Qi, J.; Yang, T.; Liu, J.; Liu, M.; Zhou, Z. Effects of China’s pilot low-carbon city policy on carbon emission reduction: A quasi-natural experiment based on satellite data. Technol. Forecast. Soc. Chang. 2022, 175, 121422. [Google Scholar] [CrossRef]
- Zeng, S.; Jin, G.; Tan, K.; Liu, X. Can low-carbon city construction reduce carbon intensity? Empirical evidence from low-carbon city pilot policy in China. J. Environ. Manag. 2023, 332, 117363. [Google Scholar] [CrossRef] [PubMed]
- Cheng, J.; Yi, J.; Dai, S.; Xiong, Y. Can low-carbon city construction facilitate green growth? Evidence from China’s pilot low-carbon city initiative. J. Clean. Prod. 2019, 231, 1158–1170. [Google Scholar] [CrossRef]
- Qiu, S.; Wang, Z.; Liu, S. The policy outcomes of low-carbon city construction on urban green development: Evidence from a quasi-natural experiment conducted in China. Sustain. Cities Soc. 2021, 66, 102699. [Google Scholar] [CrossRef]
- Zheng, J.; Shao, X.; Liu, W.; Kong, J.; Zuo, G. The impact of the pilot program on industrial structure upgrading in low-carbon cities. J. Clean. Prod. 2021, 290, 125868. [Google Scholar] [CrossRef]
- Lan, T.; Shao, G.; Xu, Z.; Tang, L.; Dong, H. Considerable role of urban functional form in low-carbon city development. J. Clean. Prod. 2023, 392, 136256. [Google Scholar] [CrossRef]
- Du, M.; Feng, R.; Chen, Z. Blue sky defense in low-carbon pilot cities: A spatial spillover perspective of carbon emission efficiency. Sci. Total. Environ. 2022, 846, 157509. [Google Scholar] [CrossRef]
- Wen, S.; Jia, Z.; Chen, X. Can low-carbon city pilot policies significantly improve carbon emission efficiency? Empirical evidence from China. J. Clean. Prod. 2022, 346, 131131. [Google Scholar] [CrossRef]
- Pan, A.; Zhang, W.; Shi, X.; Dai, L. Climate policy and low-carbon innovation: Evidence from low-carbon city pilots in China. Energy Econ. 2022, 112, 106129. [Google Scholar] [CrossRef]
- Zou, C.; Huang, Y.; Wu, S.; Hu, S. Does “low-carbon city” accelerate urban innovation? Evidence from China. Sustain. Cities Soc. 2022, 83, 103954. [Google Scholar] [CrossRef]
- Gao, L.; Li, C.; Wang, C.; Zhao, Z. Factors facilitating the development of low-carbon cities: Evidence from China’s pilot cities. Heliyon 2022, 8, e11445. [Google Scholar] [CrossRef]
- Zhou, Q.; Cui, X.; Ni, H.; Gong, L. The impact of environmental regulation policy on firms’ energy-saving behavior: A quasi-natural experiment based on China’s low-carbon pilot city policy. Resour. Policy 2022, 76, 102538. [Google Scholar] [CrossRef]
- Zhou, D.; Yuan, S.L.; Xie, D. Voluntary environmental regulation and urban innovation: Evidence from low-carbon pilot cities program in China. Technol. Forecast. Soc. Chang. 2022, 175, 121388. [Google Scholar] [CrossRef]
- Mehmood, S.; Zaman, K.; Khan, S.; Ali, Z.; ur Rashid Khan, H. The Role of Green Industrial Transformation in Mitigating Carbon Emissions: Exploring the Channels of Technological Innovation and Environmental Regulation. Energy Built Environ. 2023, in press. [CrossRef]
- Xu, Y.; Dong, Z.; Wu, Y. The spatiotemporal effects of environmental regulation on green innovation: Evidence from Chinese cities. Sci. Total Environ. 2023, 876, 162790. [Google Scholar] [CrossRef]
- Danish; Ulucak, R.; Baloch, M.A. An empirical approach to the nexus between natural resources and environmental pollution: Do economic policy and environmental-related technologies make any difference? Resour. Policy 2023, 81, 103361. [Google Scholar]
- Stucki, T.; Woerter, M. Green Inventions: Is Wait-and-see a Reasonable Option? Energy J. 2017, 38, 43–71. [Google Scholar] [CrossRef] [Green Version]
- Song, Y.; Wei, Y.; Zhu, J.; Liu, J.T.; Zhang, M. Environmental regulation and economic growth: A new perspective based on technical level and healthy human capital. J. Clean. Prod. 2021, 318, 128520. [Google Scholar] [CrossRef]
- Ye, F.; Quan, Y.; He, Y.; Lin, X. The impact of government preferences and environmental regulations on green development of China’s marine economy. Environ. Impact Assess. Rev. 2021, 87, 106522. [Google Scholar] [CrossRef]
- Lv, C.; Shao, C.; Lee, C. Green technology innovation and financial development: Do environmental regulation and innovation output matter? Energy Econ. 2021, 98, 105237. [Google Scholar] [CrossRef]
- Tian, Z.; Tian, Y.; Chen, Y.; Shao, S. The economic consequences of environmental regulation in China: From a perspective of the environmental protection admonishing talk policy. Bus. Strategy Environ. 2020, 29, 1723–1733. [Google Scholar] [CrossRef]
- Zheng, H.; Zhang, L.; Zhao, X. How does environmental regulation moderate the relationship between foreign direct investment and marine green economy efficiency: An empirical evidence from China’s coastal areas. Ocean. Coast. Manag. 2022, 219, 106077. [Google Scholar] [CrossRef]
- Yu, H.Z.; Wang, J.; Hou, J.; Yu, B.; Pan, Y. The effect of economic growth pressure on green technology innovation: Do environmental regulation, government support, and financial development matter? J. Environ. Manag. 2023, 330, 117172. [Google Scholar] [CrossRef]
- Yang, M.; Chen, H.; Long, R.; Sun, Q.; Yang, J. How does government regulation promote green product diffusion in complex network? An evolutionary analysis considering supply side and demand side. J. Environ. Manag. 2022, 318, 115642. [Google Scholar] [CrossRef] [PubMed]
- Guo, M.; Wang, H.; Kuai, Y. Environmental Policy and Green Innovation: Evidence from Heavily Polluting Firms in China. Financ. Res. Lett. 2022, 53, 103624. [Google Scholar] [CrossRef]
- Acemoglu, D.; Akcigit, U.; Hanley, D.; Kerr, W.R. Transition to Clean Technology. J. Political Econ. 2014, 124, 52–104. [Google Scholar] [CrossRef] [Green Version]
- Peng, Y.; Bai, X. Experimenting towards a low-carbon city: Policy evolution and nested structure of innovation. J. Clean. Prod. 2018, 174, 201–212. [Google Scholar] [CrossRef] [Green Version]
- Ouyang, X.; Li, Q.; Du, K. How does environmental regulation promote technological innovations in the industrial sector? Evidence from Chinese provincial panel data. Energy Policy 2020, 139, 111310. [Google Scholar] [CrossRef]
- Rubashkina, Y.; Galeotti, M.; Verdolini, E. Environmental Regulation and Competitiveness: Empirical Evidence on the Porter Hypothesis from European Manufacturing Sectors. SRPN Prod. Issues (Topic) 2014, 83, 288–300. [Google Scholar] [CrossRef]
- Wang, J.; Wei, X.; Guo, Y. A three-dimensional evaluation model for regional carrying capacity of ecological environment to social economic development: Model development and a case study in China. Ecol. Indic. 2018, 89, 348–355. [Google Scholar] [CrossRef]
- Wang, D.; Wang, P.; Chen, G.; Liu, Y. Ecological–social–economic system health diagnosis and sustainable design of high-density cities: An urban agglomeration perspective. Sustain. Cities Soc. 2022, 87, 104177. [Google Scholar] [CrossRef]
- Cheng, J.; Zhang, X.; Gao, Q. Analysis of the spatio-temporal changes and driving factors of the marine economic–ecological–social coupling coordination: A case study of 11 coastal regions in China. Ecol. Indic. 2023, 153, 110392. [Google Scholar] [CrossRef]
- Wang, X.; Wang, G.; Chen, T.; Zeng, Z.; Heng, C.K. Low-carbon city and its future research trends: A bibliometric analysis and systematic review. Sustain. Cities Soc. 2022, 2022, 104381. [Google Scholar]
- Zhang, J.; Zheng, T. Can dual pilot policy of innovative city and low-carbon city promote green lifestyle transformation of residents? J. Clean. Prod. 2023, 405, 136711. [Google Scholar] [CrossRef]
- Yang, X.; Yan, J.; Tian, K.; Yu, Z.; Li, R.Y.; Xia, S. Centralization or decentralization? the impact of different distributions of authority on China’s environmental regulation. Technol. Forecast. Soc. Chang. 2021, 173, 121172. [Google Scholar] [CrossRef]
- Weiss, J.F.; Stephan, A.; Anisimova, T. Well-designed environmental regulation and firm performance: Swedish evidence on the Porter hypothesis and the effect of regulatory time strategies. J. Environ. Plan. Manag. 2019, 62, 342–363. [Google Scholar] [CrossRef]
- Milani, S. The Impact of Environmental Policy Stringency on Industrial R&D Conditional on Pollution Intensity and Relocation Costs. Environ. Resour. Econ. 2017, 68, 595–620. [Google Scholar]
- Mackinnon, D.P.; Krull, J.L.; Lockwood, C.M. Equivalence of the Mediation, Confounding and Suppression Effect. Prev. Sci. 2000, 1, 173–181. [Google Scholar] [CrossRef]
- Jezdovic, I.; Popović, S.; Radenković, M.; Labus, A.; Bogdanović, Z. A crowdsensing platform for real-time monitoring and analysis of noise pollution in smart cities. Sustain. Comput. Inform. Syst. 2021, 31, 100588. [Google Scholar] [CrossRef]
- Wang, J.; Deng, K. Impact and mechanism analysis of smart city policy on urban innovation: Evidence from China. Econ. Anal. Policy 2021, 73, 574–587. [Google Scholar] [CrossRef]
- Zhao, C.; Wang, K.J.; Dong, K. How does innovative city policy break carbon lock-in? A spatial difference-in-differences analysis for China. Cities 2023, 136, 104249. [Google Scholar] [CrossRef]
- Yu, Y.; Zhang, N. low-carbon city pilot and carbon emission efficiency: Quasi-experimental evidence from China. Energy Econ. 2021, 96, 105125. [Google Scholar] [CrossRef]
- Yu, X. An Assessment of the Green Development Efficiency of Industrial Parks in China: Based on Non-Desired Output and Non-Radial DEA Model. SSRN Electron. J. 2023, 66, 81–88. [Google Scholar] [CrossRef]
- Preacher, K.J.; Hayes, A.F. Asymptotic and resampling strategies for assessing and comparing indirect effects in multiple mediator models. Behav. Res. Methods 2008, 40, 879–891. [Google Scholar] [CrossRef]
- Geng, Q.; Wang, Y.; Wang, X. The impact of natural resource endowment and green finance on green economic efficiency in the context of COP26. Resour. Policy 2023, 80, 103246. [Google Scholar] [CrossRef]
- Wang, F.; Wu, M.; Wang, J. Can increasing economic complexity improve China’s green development efficiency? Energy Econ. 2022, 117, 106443. [Google Scholar] [CrossRef]
- Wang, L.; Zhou, Z.; Yang, Y.; Wu, J. Green efficiency evaluation and improvement of Chinese ports: A cross-efficiency model. Transp. Res. Part D-Transp. Environ. 2020, 88, 102590. [Google Scholar] [CrossRef]
- Yang, T.; Zhou, K.; Zhang, C. Spatiotemporal patterns and influencing factors of green development efficiency in China’s urban agglomerations. Sustain. Cities Soc. 2022, 85, 104069. [Google Scholar] [CrossRef]
- Dong, B.; Ma, X.; Zhang, Z.; Zhang, H.; Chen, R.; Song, Y.; Shen, M.; Xiang, R. Carbon emissions, the industrial structure and economic growth: Evidence from heterogeneous industries in China. Environ. Pollut. 2020, 262, 114322. [Google Scholar] [CrossRef]
- Liang, D.; Lu, H.; Guan, Y.; Feng, L. Drivers for decoupling carbon footprint pressure from economic growth in China’s provinces. Geogr. Sustain. 2022, 3, 258–267. [Google Scholar] [CrossRef]
- Xie, P.; Gong, N.; Sun, F.; Li, P.; Pan, X. What factors contribute to the extent of decoupling economic growth and energy carbon emissions in China? Energy Policy 2023, 173, 113416. [Google Scholar] [CrossRef]
- Wang, Z.; Jia, X. Analysis of energy consumption structure on CO2 emission and economic sustainable growth. Energy Rep. 2022, 8, 1667–1679. [Google Scholar] [CrossRef]
- Venter, Z.S.; Figari, H.; Krange, O.; Vegard, G. Environmental justice in a very green city: Spatial inequality in exposure to urban nature, air pollution and heat in Oslo, Norway. Sci. Total Environ. 2022, 858, 160193. [Google Scholar]
- Pan, Y.; Qiu, L.; Wang, Z.; Zhu, J.; Cheng, M. Unravelling the association between polycentric urban development and landscape sustainability in urbanizing island cities. Ecol. Indic. 2022, 143, 109348. [Google Scholar] [CrossRef]
- Das, R.C.; Chatterjee, T.; Ivaldi, E. Co-movements of income and urbanization through energy use and pollution: An investigation for world’s leading polluting countries. Ecol. Indic. 2023, 153, 110381. [Google Scholar]
- Das, R.C.; Chatterjee, T.; Ivaldi, E. Revisiting policy combinations under IS–LM–EE framework introducing capacity utilization. Qual. Quant. 2023, 2023, 1–30. [Google Scholar] [CrossRef]
- Das, R.C.; Ivaldi, E. Is Pollution a Cost to Health? Theoretical and Empirical Inquiry for the World’s Leading Polluting Economies. Int. J. Environ. Res. Public Health 2021, 18, 6624. [Google Scholar] [CrossRef]
- Brendler, P. Rising Earnings Inequality and Optimal Income Tax And Social Security Policies. J. Monet. Econ. 2022, 134, 35–52. [Google Scholar] [CrossRef]
- Beck, T.; Levine, R.; Levkov, A. Big Bad Banks? The Winners and Losers from Bank Deregulation in the United States. Bank. Financ. Inst. J. 2009, 65, 1637–1667. [Google Scholar] [CrossRef] [Green Version]
- Sun, Y.; Gao, P.; Razzaq, A. How does fiscal decentralization lead to renewable energy transition and a sustainable environment? Evidence from highly decentralized economies. Renew. Energy 2023, 206, 1064–1074. [Google Scholar] [CrossRef]
- Yang, L.; Ni, M. Is financial development beneficial to improve the efficiency of green development? Evidence from the “Belt and Road” countries. Energy Econ. 2021, 105, 105734. [Google Scholar] [CrossRef]
- Chen, Z.; Kahn, M.E.; Liu, Y.; Wang, Z. The Consequences of Spatially Differentiated Water Pollution Regulation in China. NBER Work. Pap. Ser. 2016, 88, 468–485. [Google Scholar]
- Zhang, J.; Chen, S. Financial Development, Environmental Regulation and Green Economic transformation. Financ. Res. 2021, 47, 78–93. [Google Scholar]
- Goodman-Bacon, A. Difference-in-Differences with Variation in Treatment Timing. Econom. Mult. Equ. Model. J. 2018, 225, 254–277. [Google Scholar]
- Du, M.; Zhang, Y. The impact of producer services agglomeration on green economic development: Evidence from 278 Chinese cities. Energy Econ. 2023, 124, 106769. [Google Scholar]
- Cheng, X.; Yao, D.; Qian, Y.; Wang, B.; Zhang, D. How does fintech influence carbon emissions: Evidence from China’s prefecture-level cities. Int. Rev. Financ. Anal. 2023, 87, 102655. [Google Scholar]
- Qu, F.; Xu, L.; He, C. Leverage effect or crowding out effect? Evidence from low-carbon city pilot and energy technology innovation in China. Sustain. Cities Soc. 2023, 91, 104423. [Google Scholar]


| Tier 1 Indicators | Secondary Indicators | Specific Indicator Measurements | Indicator Attributes |
|---|---|---|---|
| Economic green growth (ED) | Economic growth rate (ED1 ) | Regional GDP growth rate | + |
| Structure of Economic Growth (ED2 ) | Industrial structure | + | |
| Cost of Economic Growth (ED3 ) | Energy consumption per unit of GDP | − | |
| Economic Growth Drivers (ED4 ) | Intensity of financial science and technology support | + | |
| Ecological welfare enhancement (GD) | Eco-safety (GD1 ) | Environmental Pollution Index | − |
| Ecological Construction (GD2 ) | Calculated through entropy method | + | |
| Social welfare increase (SD) | Income distribution equity achieved (SD1 ) | Calculated by Theil index | − |
| Infrastructure Development (SD2 ) | Calculated through entropy method | + | |
| Level of social security (SD3 ) | Social security and employment expenditure/general budget expenditure | + |
| Environmental Protection Dimension | Select a Word | Number |
|---|---|---|
| Objectives | Environmental protection, environmental protection, green, clean, blue sky, green water, green hills | 8 |
| Environmental factors | Ecology, air, climate | 3 |
| Environmental pollution | pollution, sulfur dioxide, chemical oxygen demand, haze, particulate matter, carbon dioxide, energy consumption, loose coal, coal burning, emissions, emissions theft, tailpipe | 12 |
| Measures | Energy saving, emission reduction, desulphurization, denitrification | 4 |
| Variable | Mean | SD | Min | Max | N |
|---|---|---|---|---|---|
| low-carbon City Pilot Policy | 0.237 | 0.4253 | 0.000 | 1.000 | 3878 |
| City Green Development Index | 0.078 | 0.0691 | 0.020 | 0.631 | 3878 |
| Population density | 424.432 | 325.385 | 4.824 | 2927.291 | 3878 |
| Level of industrialization | 0.405 | 0.1229 | 0.028 | 0.887 | 3878 |
| Local government size | 0.192 | 0.1296 | 0.043 | 2.349 | 3878 |
| Financial decentralization | 0.458 | 0.227 | 0.046 | 1.541 | 3878 |
| Fixed asset investment ratio | 0.83 | 2.2473 | 0.062 | 82.066 | 3878 |
| Financial Development | 0.928 | 0.6075 | 0.075 | 9.622 | 3878 |
| Level of green technology innovation | 4.719 | 1.7564 | 0.693 | 10.275 | 3878 |
| Environmental regulation intensity | 0.020 | 0.020 | 0.000 | 0.124 | 3878 |
| LCCP | Gdevelopment | ldensity | ind | gov | fid | fix | fdp | |
|---|---|---|---|---|---|---|---|---|
| LCCP | 1 | |||||||
| Gdevelopment | 0.242 *** | 1 | ||||||
| ldensity | 0.061 *** | 0.355 *** | 1 | |||||
| ind | −0.125 *** | −0.147 *** | 0.174 *** | 1 | ||||
| gov | 0.018 *** | −0.210 *** | −0.420 *** | −0.459 *** | 1 | |||
| fid | 0.078 *** | 0.520 *** | 0.423 *** | 0.385*** | −0.538 *** | 1 | ||
| fix | −0.015 *** | −0.014 *** | −0.063 *** | −0.076 *** | 0.055 *** | −0.058 *** | 1 | |
| fdp | 0.227 *** | 0.448 *** | 0.019 *** | −0.379 *** | 0.162 *** | 0.198 *** | 0.025 *** | 1 |
| (1) | (2) | (3) | (4) | |
|---|---|---|---|---|
| Gdevelopment | Gdevelopment | Gdevelopment | Gdevelopment | |
| LCCP | 0.0253 *** | 0.0061 *** | 0.0153 *** | 0.0056 *** |
| (24.35 ) | (6.01) | (15.02) | (5.77) | |
| ldensity | 0.0329 *** | 0.0219 *** | ||
| (4.65) | (3.71) | |||
| fix | 0.0001 | −0.0001 *** | ||
| (1.21) | (−2.99) | |||
| ind | −0.0865 *** | −0.0419 *** | ||
| (−13.91) | (−7.81) | |||
| gov | 0.0098 * | −0.0157 *** | ||
| (1.96) | (−3.13) | |||
| fid | −0.0044 | −0.0005 | ||
| (−1.18) | (−0.14) | |||
| fdp | 0.0089 *** | 0.0023 ** | ||
| (4.63) | (2.37) | |||
| _cons | 0.0722 *** | 0.0768 *** | −0.0865 ** | −0.0301 |
| (200.30) | (238.47) | (−2.12) | (−0.88) | |
| Time fixed effects | No | YES | No | YES |
| City fixed effects | YES | YES | YES | YES |
| Observations | 3878 | 3878 | 3878 | 3878 |
| R-squared | 0.9472 | 0.9665 | 0.9611 | 0.9683 |
| F-test | 592.905 | 36.104 | 194.335 | 16.414 |
| (1) | (2) | (3) | (4) | |
|---|---|---|---|---|
| Gdevelopment | Gdevelopment | Gdevelopment | Gdevelopment | |
| LCCP | 0.0254 *** | 0.0062 *** | 0.0146 *** | 0.0055 *** |
| (24.25) | (6.05) | (14.99) | (5.71) | |
| _cons | 0.0723 *** | 0.0769 *** | −0.0870 ** | −0.0318 |
| (199.05) | (236.77) | (−2.12) | (−0.92) | |
| Control variables | NO | NO | YES | YES |
| Time fixed effects | NO | YES | NO | YES |
| City fixed effects | YES | YES | YES | YES |
| Observations | 3855 | 3855 | 3855 | 3855 |
| R-squared | 0.9474 | 0.9665 | 0.9620 | 0.9684 |
| F-test | 588.082 | 36.645 | 191.592 | 17.034 |
| (1) | (2) | |
|---|---|---|
| Gdevelopment | Gdevelopment | |
| LCCP | 0.0075 *** | 0.0067 *** |
| (6.31) | (6.18) | |
| _cons | 0.0736 *** | −0.0414 |
| (201.93) | (−1.10) | |
| Control variables | NO | YES |
| Time fixed effects | YES | YES |
| City fixed effects | YES | YES |
| Observations | 3463 | 3463 |
| R-squared | 0.9653 | 0.9680 |
| F-test | 39.806 | 15.334 |
| Total DID Estimate | 0.006 | |
|---|---|---|
| Category | Weighting | Average DID Estimate |
| Process first vs. process later | 0.070 | 0.001 |
| Post-processing vs. | 0.064 | −0.004 |
| Handled vs. Never Handled | 0.865 | 0.007 |
| (1) | (2) | (3) | (4) | |
|---|---|---|---|---|
| Ginov | Gdevelopment | ER | Gdevelopment | |
| LCCP | 0.0604 ** | 0.0054 *** | 0.0058 *** | 0.0062 *** |
| (1.99) | (5.69) | (9.77) | (6.31) | |
| Ginov | 0.0022 *** | |||
| (5.73) | ||||
| ER | −0.1095 *** | |||
| (−4.50) | ||||
| ldensity | 0.1614 | 0.0215 *** | −0.0015 | 0.0217 *** |
| (1.62) | (3.70) | (−0.67) | (3.73) | |
| fix | 0.0006 | −0.0001 *** | 0.0001 | −0.0001 *** |
| (0.35) | (−3.10) | (1.60) | (−2.62) | |
| ind | 1.0332 *** | −0.0442 *** | 0.0080 ** | −0.0410 *** |
| (4.94) | (−8.08) | (2.54) | (−7.69) | |
| gov | −0.8391 *** | −0.0139 *** | −0.0009 | −0.0158 *** |
| (−2.70) | (−2.89) | (−0.41) | (−3.16) | |
| fid | 0.0403 | −0.0006 | 0.0038 * | −0.0001 |
| (0.31) | (−0.17) | (1.86) | (−0.02) | |
| fdp | −0.0129 | 0.0024 ** | 0.0009 * | 0.0024 ** |
| (−0.41) | (2.42) | (1.69) | (2.42) | |
| _cons | 3.5103 *** | −0.0379 | 0.0219 | −0.0277 |
| (5.90) | (−1.13) | (1.64) | (−0.82) | |
| Time fixed effects | Yes | Yes | Yes | Yes |
| City fixed effects | Yes | Yes | Yes | Yes |
| Observations | 3878 | 3878 | 3878 | 3878 |
| R-squared | 0.9387 | 0.9685 | 0.8181 | 0.9684 |
| F-test | 10.098 | 16.602 | 16.215 | 16.233 |
| East | Central | Western | Resource-Based Cities | Non-Resource-Based Cities | |
|---|---|---|---|---|---|
| Gdevelopment | Gdevelopment | Gdevelopment | Gdevelopment | Gdevelopment | |
| LCCP | 0.0014 | 0.0057 *** | 0.0065 *** | −0.0038 *** | 0.0079 *** |
| (0.84) | (3.02) | (3.94) | (−2.94) | (2.99) | |
| _cons | −0.1753 | 0.0333 | 0.0048 | 0.0099 | −0.0264 |
| (−1.23) | (1.53) | (0.13) | (0.33) | (−0.29) | |
| Control variables | YES | YES | YES | YES | YES |
| Time fixed effects | YES | YES | YES | YES | YES |
| City fixed effects | YES | YES | YES | YES | YES |
| N | 1330 | 1386 | 1162 | 1554 | 2324 |
| R-squared | 0.9622 | 0.9798 | 0.9626 | 0.9206 | 0.9706 |
| F-test | 3.577 | 3.934 | 6.953 | 7.173 | 4.648 |
| Beijing, Tianjin and Hebei | Yangtze River Delta | Pearl River Delta | |
|---|---|---|---|
| Gdevelopment | Gdevelopment | Gdevelopment | |
| LCCP | 0.0253 *** | 0.0040 | 0.0114 |
| (4.82) | (1.54) | (0.55) | |
| _cons | −0.1631 | −0.1334 | −0.7853 ** |
| (−1.10) | (−1.29) | (−2.94) | |
| Control variables | YES | YES | YES |
| Time fixed effects | YES | YES | YES |
| City fixed effects | YES | YES | YES |
| N | 154 | 364 | 182 |
| R-squared | 0.9725 | 0.9775 | 0.5855 |
Disclaimer/Publisher’s Note: The statements, opinions and data contained in all publications are solely those of the individual author(s) and contributor(s) and not of MDPI and/or the editor(s). MDPI and/or the editor(s) disclaim responsibility for any injury to people or property resulting from any ideas, methods, instructions or products referred to in the content. |
© 2023 by the authors. Licensee MDPI, Basel, Switzerland. This article is an open access article distributed under the terms and conditions of the Creative Commons Attribution (CC BY) license (https://creativecommons.org/licenses/by/4.0/).
Share and Cite
Chen, W.; Liu, J.; Ning, X.; Du, L.; Zhang, Y.; Wu, C. Low-Carbon City Building and Green Development: New Evidence from Quasi Natural Experiments from 277 Cities in China. Sustainability 2023, 15, 11609. https://doi.org/10.3390/su151511609
Chen W, Liu J, Ning X, Du L, Zhang Y, Wu C. Low-Carbon City Building and Green Development: New Evidence from Quasi Natural Experiments from 277 Cities in China. Sustainability. 2023; 15(15):11609. https://doi.org/10.3390/su151511609
Chicago/Turabian StyleChen, Wanzhe, Jiaqi Liu, Xuanwei Ning, Lei Du, Yang Zhang, and Chengliang Wu. 2023. "Low-Carbon City Building and Green Development: New Evidence from Quasi Natural Experiments from 277 Cities in China" Sustainability 15, no. 15: 11609. https://doi.org/10.3390/su151511609