1. Introduction
Businesses are constantly seeking ways to improve their profits or gain a competitive advantage to enhance the sustainability of their organization [
1,
2,
3]. The long-term well-being of the company by conducting business operations and managing resources effectively is crucial in business sustainability. According to Research and Markets [
4,
5], the global sales revenue of mobile phone accessories reached as high as 62.72 billion US dollars in 2016, with the Asia–Pacific region accounting for 47% of the overall market. While the European market has the highest average annual growth rate, mobile phone accessory sales in North America are predicted to reach 14% of the global market by 2023. Research and Markets [
4,
5] also reported that various smartphone companies have integrated innovative technology into mobile phones to gain a competitive edge in recent years, such as developing Bluetooth and wireless charging, which has created new demand for mobile phone accessories among consumers. The overall compound annual growth rate of the mobile phone accessory market is predicted to reach 4% by 2023. The development of mobile phone accessories, along with advancements in AI and IoT technologies, has further promoted the use of wireless accessories such as Bluetooth headsets and smart, wearable accessories, leading to increased market development.
The smartphone market has become saturated to a certain extent. Most companies are striving to increase their market share and attract new customers in the existing consumer market. However, there is still much room for growth in the accessory market. The constant upgrading of smartphones has also led to the emergence of new accessories. Therefore, companies are looking to tap into the accessory market to make up for the slowdown in mobile phone sales and generate higher revenue. For instance, Apple’s revenue report for the third quarter of 2019 showed that sales were nearly
$5.4 billion lower than the previous year, but revenue from wearables, home devices, and accessories increased by
$2.297 billion by 28 September 2019, which was 1.54 times higher than the same quarter the previous year [
6]. The demand for mobile phone accessories is often closely tied to the sales volume of mobile phones. Many phone cases, for example, have even surpassed mobile phones in terms of sales profits due to their low production cost and huge demand. As an example, Shenzhen Jame Technology Co., Ltd., a Shenzhen OEM and ODM firm [
7], sold over 60 million mobile device protective case accessories in 2018, generating nearly 500 million RMB in revenue, an increase of 43.51% compared to sales in 2017. Its operating income in 2018 was approximately 642 million RMB, and its net profit soared to 61.2954 million RMB. The sales profit margin was nearly 10% [
7], which was much higher than Apple’s profit margin in the same year (4.68%).
Mobile phone accessories can be categorized into several types, including batteries, earbuds/headphones, portable amplifiers, rechargeable devices, memory cards, power banks, and rechargeable phone cases [
5]. This market segment has witnessed significant growth in recent years, owing to the increasing demand for smartphone accessories. To capitalize on this trend, many mobile phone companies have started manufacturing their own complementary accessories. Apple, for instance, has expanded its product portfolio to include phone cases, charging cases, smart Bluetooth audio HomePods, and various wearable devices. In 2016, Apple launched the AirPods, its first smart Bluetooth earphones, following the removal of the 3.5 mm headphone jack from its iPhone models. Despite the iPhone series offering support for wireless charging through the creation of more than five functions, Apple has yet to launch a wireless charging device. On the other hand, Samsung has taken a different approach by introducing a wide range of accessories tailored to its smartphones’ characteristics, including wireless charging, Bluetooth headsets, and wearable devices that support the phones’ functionalities. Samsung is continuously developing new wireless accessories to meet the evolving needs of consumers, in a bid to stay ahead of the competition with Apple in the smartphone market.
The previous studies on complementary products and complementary effects do not align with the relationship between main products and accessory products. Most research on complementary firms has focused on factors such as channel decision making, product quality, firm performance, and pricing decisions under asymmetric information (e.g., [
8,
9,
10]). However, there is a gap in the literature when it comes to market entry decisions by main product firms. This study aims to fill that gap.
When it comes to dominant product firms entering the accessory market, the decisions made by companies are not always the same. For example, Apple and Samsung, two competing mobile phone firms, both sell phone cases, Bluetooth headsets, wearable devices, and other accessories. However, neither of them has ventured into the photography-related accessory markets. Only Samsung has entered the wireless charging market and continues to develop new wireless charging devices, while Apple mainly sells wireless charging accessories from third-party firms. This research focuses on how main product firms make optimal decisions and discusses the equilibrium decision of whether firms should invest in the accessory market under a monopoly. The market demand for accessories is affected by the main product prices, and the game model of the demand function proposed by Raju et al. [
11] is used as a research tool. This model reflects the main product firms and accessory firms under different competition conditions and equilibrium. After analyzing the impact of monopolizing the accessory market and the optimal pricing strategy for competition, this study further investigates the influence of the main product firm on existing accessory firms and the market size after it enters the accessory market. This study also explores the impact and changes in the profit of accessory firms after the main product firms enter the accessory market, and how external parameters affect the decision making of each firm.
2. Literature Review
In the past, it was believed that the main product had a complementary effect on the accessory product, so a literature review was carried out on complementary products. For firms, the existence of complementary products increases the value of their products, thereby improving product performance, consumer satisfaction, and the overall value of the business, and enhancing the firm’s competitive advantage. Cournot [
12] was the first to analyze the interaction between firms of complementary goods, and many related studies followed suit. In this chapter, we divided the literature on complementary goods into channel strategies, the influence of information asymmetry, and the value of complementary goods.
2.1. Access Strategy for Complementary Products
Concerning the channel strategy of complementary firms, Xia et al. [
13] explored whether a firm producing two complementary products faces a distribution channel decision of whether to sell their products through wholesale or to license their production through other firms, and the factors influencing the firm’s adoption of dual paths. The study found that the availability of complementary products is an important influencing factor for existing firms’ channel decisions. If the complementary effect between two products is asymmetric, then it affects existing firms’ distribution channel decisions. A complementary product with a higher complementary effect reduces a firm’s incentive to add an indirect channel for the product. However, if two products have a symmetrical complementary relation, then the optimal profit margin of the main product is the complementary effect of the potential entrant who starts to produce the complementary product.
Li [
14] studied the decision making regarding optimal investment in information security for complementary firms and how cooperation and non-cooperation strategies increase optimal investment. He et al. [
15] examined how suppliers of complementary products on digital platforms sustain cooperation via repeated interactions in a supply chain. Mamoudan et al. [
16] analyzed the demand and pricing of perishable food and its complementary products and found that independent procurement provides retailers with higher profit. The competition and supply-chain strategies between electric and gasoline-based vehicles were addressed in Rasti-Barzoki and Moon’s study [
17]. Li et al. [
18] analyzed green innovation and strategies for operating a collaborative partnership between the firm and the supplier.
In addition, Wei et al. [
19] discussed the integration strategies of firms and retailers for the supply chain of complementary goods, and compared upstream, downstream, and vertical integration strategies for members’ decision making, profit, and performance in the supply chain based on full integration or decentralization. The results showed that with the increase in integrated firms, the optimal retail price of complementary products decreases, albeit the retail price of the vertical integration strategy is the lowest, and the retail price of upstream and downstream integration strategies is the same when the number of integrated firms is the same.
Different from past studies, this study focuses on whether a firm whose product has a complementary effect on another product enters another market, and its product decisions regarding producing two products at the same time.
2.2. Complementary Products and Information Asymmetry
Regarding the influence of information asymmetry on the decision making of complementary firms, Vives [
20] studied the decision making of dual occupancy with the Bertrand and Cournot models at the same juncture and indicated that the Bertrand model is more efficient for the analysis of complementarity than the Cournot model in the case of information asymmetry. To follow up, Yue et al. [
21] used the Bertrand model to discuss the firms’ pricing decisions of two complementary commodities under information asymmetry and compared three different scenarios. Notably, consumers often need to purchase more than one product from varying suppliers to obtain the full benefits of these products, so the concept of “bundled products (Mixed Bundle)” appears. Asad el al. [
1] and Asif et al. [
2] discussed knowledge management for the sustainable performance of SMEs. However, firms must make their own decisions based on their respective forecast needs in an uncertain market where the information is incomplete. The study pointed out that sharing information is not always the best strategy for firms, and further proposed the conditions for information sharing to be established. If firms form a strategic alliance, then they make decisions based on the maximization of overall outputs, so the profits obtained are the highest of the three cases. In addition, it is easier to implement than information sharing when the profits of the strategic alliance are distributed according to the individual product pricing.
These studies mainly explored the impact of information-sharing strategies on the forecasted profits, and the pricing strategies of firms without the consideration of information asymmetry among firms. The market size was set as an exogenous variable, both the main product firm and the accessory firm had the same information, and the Bertrand model was used to analyze the firm’s optimal decision. This study does not continue the concept of “bundled products”, but rather products with one-way complementary effects.
2.3. Product Value of Complementary Goods
Based on the product value of complementary products, various firms may make different decisions regarding the quality of complementary products due to varied internal and external conditions. Past studies have only discussed value creation and acquisition between complementary products. Chen and Nalebuff [
22] studied only one-way and necessary complementary products. To use one product, the other product must exit, and vice versa. Just like operating systems and applications, applications can work within an operating system, but the operating system can work alone without the application. The study explored whether a firm of essential goods should capture the value between two complementary products by charging a firm of non-essential goods or by producing non-essential goods themselves. Yalcin et al. [
23] explored the problems of value creation, acquisition, and competition in complementary products caused by firms’ decision making when two strictly complementary products were produced by different firms. Generally speaking, among hardware firms and software developers, it is common that one firm can collect royalties from the other firm, but this may cause the latter to reduce the quality of its products, thereby creating value and reducing the overall product quality. The research results showed that despite royalty accumulation being a means of value creation, it also alleviates the problem of value acquisition between two firms.
Most studies on the value of complementary products have focused on exploring the quality decisions of firms, and most of them have considered the profit distribution and value creation caused by one firm charging royalties to another. Different from past studies, this study does not focus on the quality and value of complementary products, nor does it discuss the impact of royalties on the profits and pricing of main product firms and accessory firms. In line with Chen and Nalebuff’s [
22] study on the complementary effects of accessory products that can only be used when the main product exists, we further discuss the main product firm’s decision to enter the accessory market.
Most studies have focused on strictly complementary products in which consumers must obtain two or more products at the same time in order to obtain positive consumer utility. These two or more products are called strictly complementary products. The products with two-way complementary effects have been discussed in depth, yet no research has been conducted on one-way complementary effects that mainly focus on product value. No study has been performed to understand the main product firm’s decision making regarding whether to enter an accessory market under one-way complementary effects. In order to fill this gap, this research focuses on the impact of products with one-way complementary effects on the market entry decision of main product firms, as well as the impact on the overall market.
Game theory is applied to construct a mathematical model to explore the equilibrium decision of firms regarding whether to enter different accessory markets under the conditions of monopoly and competition. This chapter explains the basic model and the game sequence. This study assumes that there are two markets (1, 2) in the model. The commodities in the market are the main product and the accessory, which are not strictly complementary products. The price of the main product has an impact on the demand for accessories, but the price of the accessory does not affect the demand for the main product. The basic model is divided into a monopoly model and a competitive model for discussion.
In this study, the complementary relationship between the main product and the accessory product is not the same as that of the general complementary product, but more like the relationship between the main products and accessory products such as printers and toner cartridges, in which consumers often consider the price of the printer toner before purchasing a printer. Consumers may not necessarily buy accessories such as Bluetooth headsets from the same mobile brand. For example, when Apple launched AirPods, many consumers who did not use iPhones also chose to buy AirPods. Therefore, the accessory products introduced by all firms are interchangeable with each other in this model.
3. Model Settings
3.1. Monopoly Model Setting
The market is simplified as having only one firm in each market—firm A, which produces the main product, and firm C, which produces accessory products—and we compare the prices and profits of the two firms before and after firm A’s participation in the accessory market. To distinguish between different scenarios in the subsequent analysis, the superscript N is used as the expression when firm A chooses not to enter the accessory market. On the contrary, if firm A chooses to enter the accessory market, then the superscript Y is used as the expression, i.e., and . Some subscript numbers are used to represent the market, i.e., 1 represents the main product, 2 represents the accessory product, and A and C represent the firms. In this study, the original size of the accessory market is set as α (α > 0), the complementary effect is set as θ (θ > 0), and the cross-demand elasticity of consumers is b (b ∈ [0, 1]). Compared with the production cost of the main product, the cost of accessories is usually relatively low, so the production cost of the accessories is normalized to 0 in the model, and the unit production cost of the main product is set as c and c (c ∈ [0, 1]). If firm A chooses not to join the accessory market, then firms A and C decide the product price on the basis of maximizing their own profits. If firm A chooses to enter the accessory market, then it pays an additional fixed cost F for entering.
When firm A does not enter the accessory market, the demand functions are
q and
, and the firm’s profit formulas are
, and
. If firm A chooses to enter the accessory market, then this study extends the demand functions proposed by Raju et al. [
11], and the main product and accessory are
,
and
, while the profit formulas are
and
. Firm A first decides whether to join the accessory production and firm A has different profits according to its different decisions. At this time, the two firms decide their pricing for the main product and accessory to maximize their own interests.
3.2. Competitive Model Setting
There is a competitor B in the main product market who compares the prices and profits of the main product of firms (A, B) before and after their joining the accessory market. The accessory market is the same as in the monopoly model where originally there is firm C. The competition model is divided into three scenarios for the equilibrium analysis and comparison. When the main product firms A and B do not enter the market, the strategy adopted by the firms is called NN. When only one firm enters the market, it can be divided into the YN strategy and NN strategy. Finally, when both enter the accessory market, it is called the YY strategy. In the follow-up research and analysis, the superscript indicates the equilibrium of various strategies, and the subscript indicates different markets and different firms, i.e., , and . The external parameters in the competition model are mostly the same as those in the monopoly model, but there are competitors in the main product market in the competition model, so in the competition model, the cross-demand elasticity of consumers of the main product is set as a (a > 0). If the main product firm chooses not to join the accessory market, then each firm decides , and on the basis of maximizing their own profits. If the main product firm chooses to join the accessory market, then it needs to pay an additional fixed cost for entering the market F. In order to facilitate the subsequent analysis, the influence of the two main product firms on the demand for accessory products is set to be the same in this study and is calculated by the average price of the two.
Since there are four scenarios in the competition model, in this section only the YY strategy is used as an example, and with reference to Raju et al. [
11], the firm’s demand function is as follows:
Taking the YY strategy as an example, the profit formulas of the three firms are
, and
. For each scenario in the monopoly and competitive models to be valid, the prices and demand for the main product and accessory products in the monopoly model must be positive, that is,
,
,
,
, and
must all be greater than zero. By synthesizing the settings of the two models,
Table 1 below summarizes the extrinsic parameters.
In the competition model, the decision sequence can also be divided into two stages. First, the main product firms (A, B) decide whether to join the accessory market for production. Different profit functions then take place according to the decision of the main product firm. In practice, firms’ pricing fluctuates flexibly. In this study, it is assumed that the main product firms A and B and accessory firm C decide the prices of the main products and accessory product at the same time. In this setting, the decision equilibrium means that no firm has any incentive to unilaterally change its pricing. We use the Backward Introduction to analyze the optimal pricing and profit corresponding to firms’ different strategies under different competitive scenarios, and then analyze firms’ equilibrium decisions for entering the market.
4. Monopoly Model Analysis
4.1. The Equilibrium Result of the Main Product Firm Not Participating in the Accessory Market
We solve for the optimal pricing and profit of the corresponding firm when the main product firm chooses not to join. If firm A monopolizes and chooses not to join the market, then the market demand for the main product is only affected by its own price, whereas accessories have a one-way complementary effect. The market demand for accessories is not only affected by their own prices but also partially by the price of the main product. Therefore, the demand functions of the two firms are and .
When other conditions remain unchanged, given the main product price and accessory product price , the profit formulas of firm A and firm C are and . The optimal prices of the two firms that are obtained after the first-order condition are and .
4.2. The Equilibrium Result of Main Product Firms Entering the Accessory Market
This section solves the optimal pricing and profit of the corresponding firm when the main product firm chooses to join the accessory market. When firm A chooses to invest in the accessory market for production, the market demand function of the main product remains unchanged, but competition takes place in the accessory market and the market demand is divided into two, in which two firms provide the supply. The demand for the accessory products of each firm is affected by the pricing of the other. The demand functions of the two firms are , and .
Based on the previous cost setting, if firm A chooses to invest in the accessory market, then a fixed cost F takes place. When other conditions remain unchanged, given the main product price and accessory product prices and , the profit formulas of the two firms are and . The firms’ optimal prices obtained by the first condition (, , ) are , and .
4.3. Different Decisions by Firms
4.3.1. The Total Profit of the Two Firms When Firm A Adopts Different Strategies
Proposition 1. When , firm A has an incentive to join accessory production.
If the total profit after participation is greater than the total profit before participation, then firm A has the incentive to join the accessory market, so the fixed participation cost for the main product firm is less than , and the optimal decision of firm A is to join the market. In other words, a fixed cost exists when the main product firm chooses to join the accessory market. As long as the total profit obtained after the entry is higher than before, the optimal decision of the main product firm is to join the accessory market.
When the market demand (α) for accessory products is greater, the market has more potential, which gives the main product firms extra profits and increases the participation willingness.
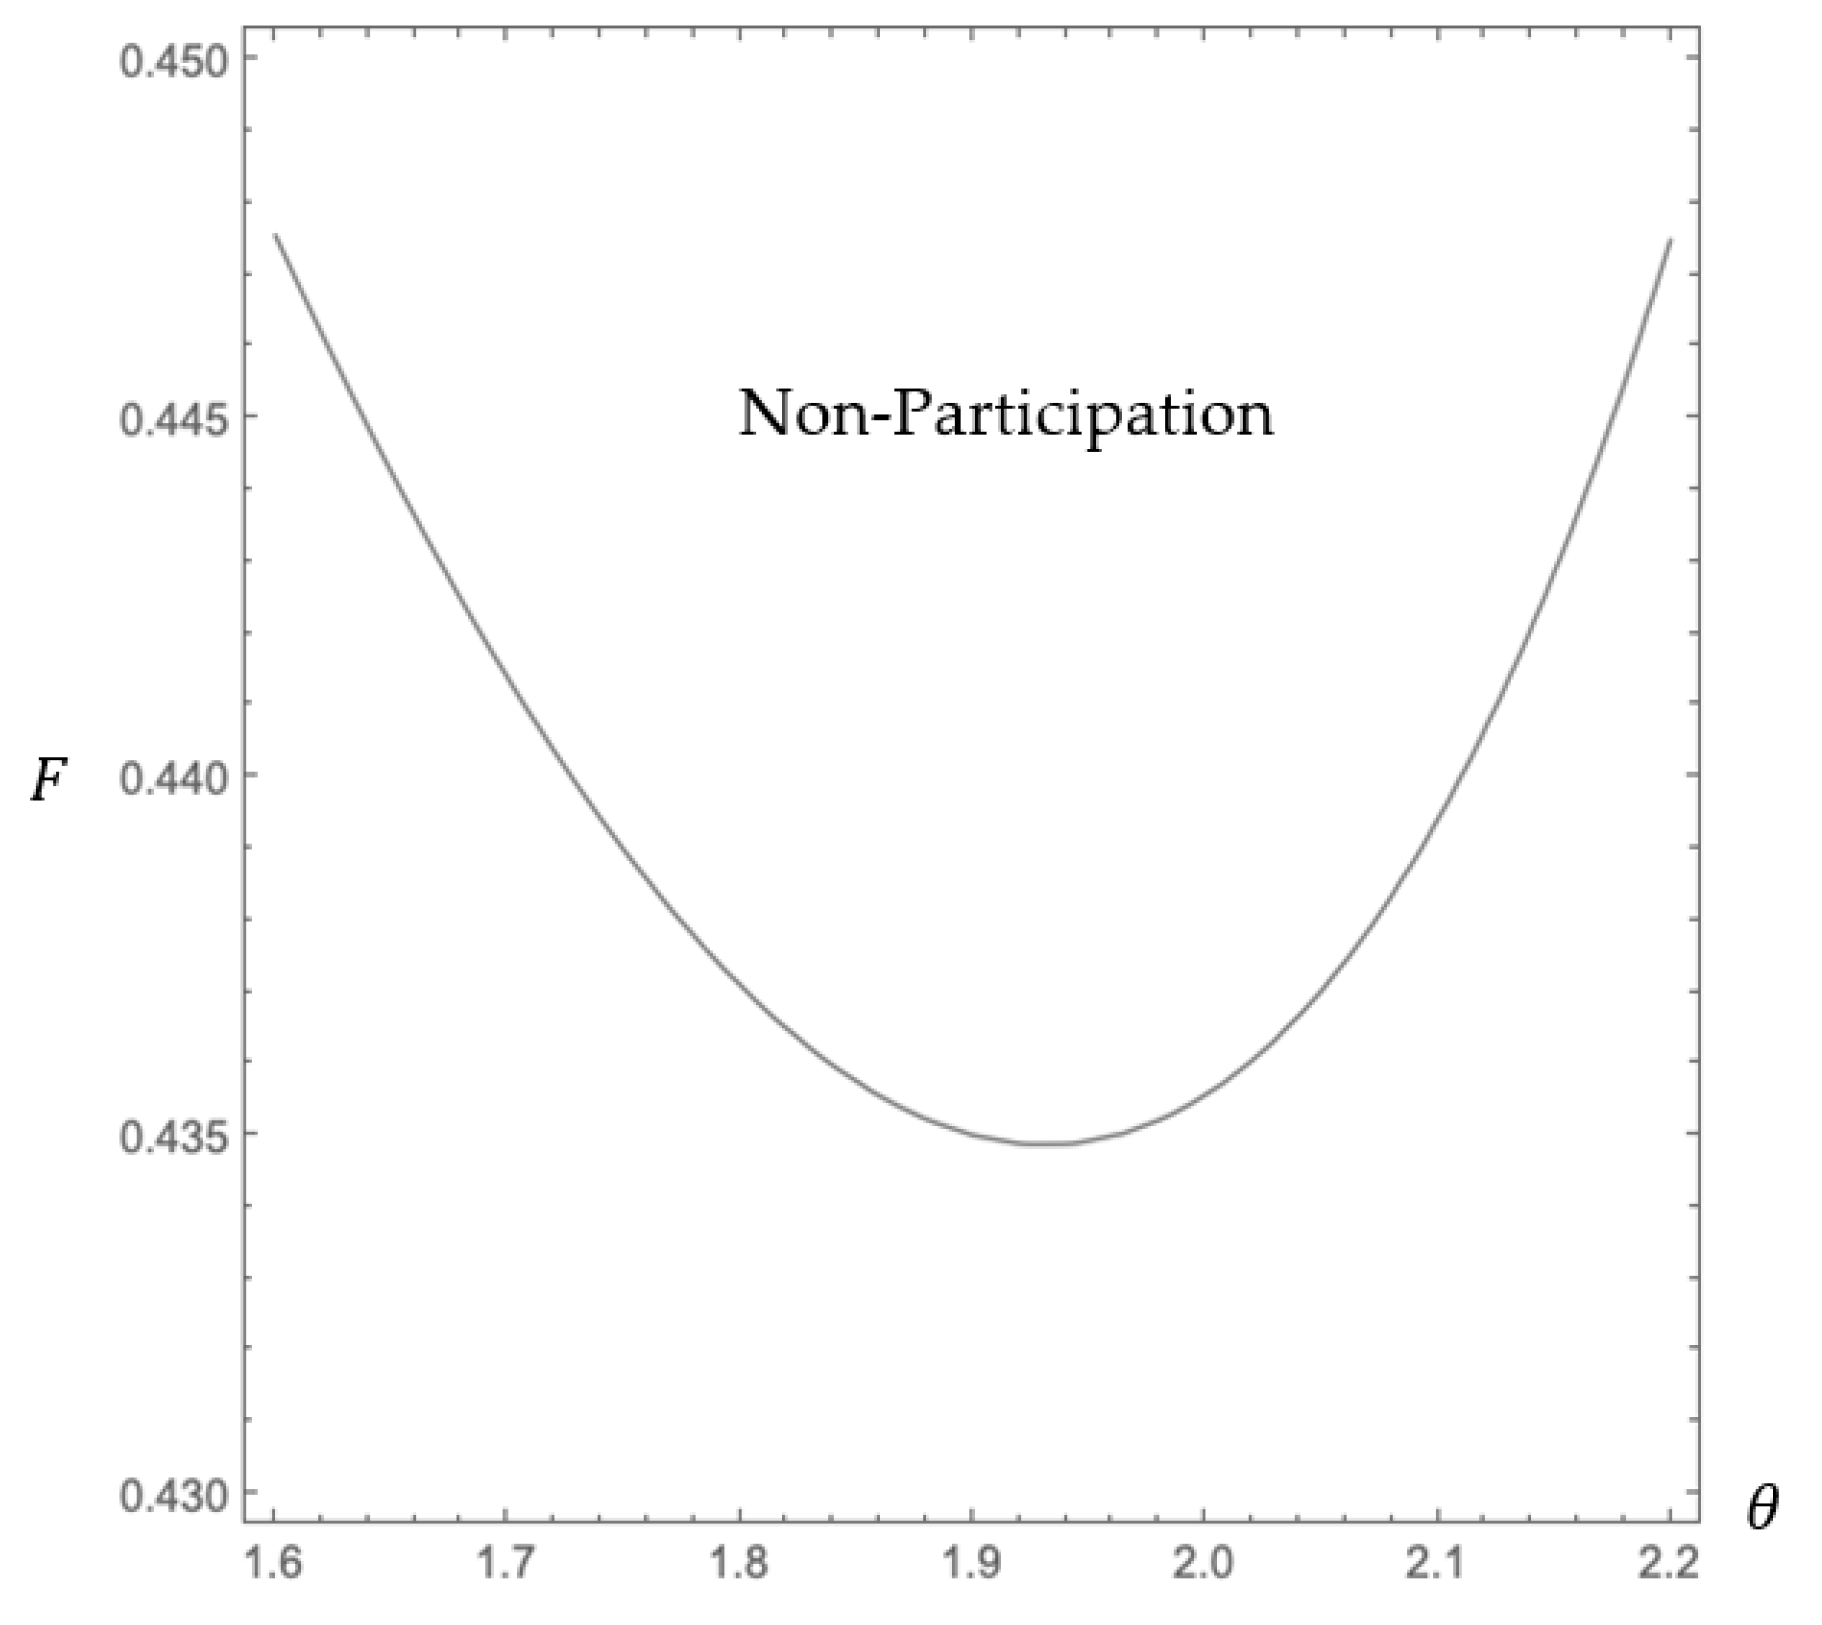
In terms of production cost, the lowered production cost (c) by the main product firm helps expand the profit gap before and after entering the market. In other words, the overall profits that rise in line with the lowered unit production cost of the main product increase the main product firms’ participation willingness. The market competition takes place after the main product firm joins the accessory market. If the competition is more intense, then the consumer price sensitivity (b) is higher and the profit that the main product firm can make in the accessory market shrinks. Thus, the reduced profit reduces the incentive for market participation; on the contrary, the overall profits of main product firms that are more positive with fewer price wars increase their participation willingness. In addition, the complementary effect (θ) has a non-constant positive effect on firms’ participation willingness as shown in the figure:
Corollary 1. Under , the larger θ gives the main product firms more incentives to join the accessory market; conversely, under , the larger θ gives the main product firms fewer incentives to join.
Followed in
Figure 1, the participation willingness of main product firms increases with the increase in complementary effects, whereas the participation willingness first decreases and then increases. If the basic demand α in the accessory market is too small, then due to the limitation of the complementary effect θ in this study, it only shows an increase in the complementary effect in the initial stage, which is the downward slash on the left side of
Figure 1, which weakens the willingness to join the market. When the basic demand for accessory products
, the main product has a greater impact on the demand for accessories and the firms are more willing to join to produce and sell on their own. On the contrary, the increase in the one-way complementary effect that the main product has on the accessories shrinks the profit gap before and after the main product firms’ participation. That is to say, as long as the basic demand for accessory products reaches a certain level, the increase in the complementary effect increases the profit after entering the market, making them more willing to join. However, if the basic demand for accessory products is not sufficient, then the increase in the complementary effect that actually erodes consumers’ demand for accessory products causes main product firms to be unable to offset the loss from the main product price cuts with the revenue from accessories. The overall profit of their participation in the accessory market declines, and this weakens the participation willingness of main product firms.
4.3.2. Comparison of the Optimal Pricing of the Main Product and Accessory Products under Different Strategies Adopted by Firm A
Proposition 2. When firm A chooses to join the accessory market, the price of the main product is lower than when firm A does not produce accessories (i.e., ).
When comparing the main product price
before and
after firm A joins the accessory market, the price of the main product goes down after firm A enters the accessory market. After entering the market, its profit increases from the original single main product to two products, the main product and the accessory product. At this point, the main product firm has an incentive to lower the main product price, which results in a profit loss, but it also gains extra profits from the sales of accessories. The loss and gain are offset by each other. The detailed calculations can be found in
Appendix A.
Proposition 3. Under the condition of , after the main product firm joins the accessory market, the total profit of the accessory firm increases (i.e., when ).
The accessory competition increases after the main product firm joins the market. Intuitively speaking, the profits of the original firm C in the accessory market are divided and reduced. However, comparing the profits of the accessory firm before and after the participation of the main product firm, when
, the profit of accessory firm C increases due to firm A’s participation. The detailed calculations can be found in
Appendix B. As mentioned in Proposition 2, after the main product firm enters the accessory market, the increase in profit sources gives an incentive to lower the price of the main product to increase the demand for the accessory product. If the complementary effect of the main product is exponentially large, then the main product firm’s price reduction of its main product increases the sales of accessories, which is beneficial to the accessory firm. By observing the inequality, when b is smaller, this condition is easier to hold, that is to say, when the degree of competition in the market is smaller, the price competition between firms is also reduced. The main product firm’s participation in the accessory market increases the possibility of the total profit of the accessory firm.
Corollary 2. When , after the main product firm joins the accessory market, the accessory firm increases the product prices (i.e., when , ).
Comparing the product pricing of firm C before and after firm A joins the market, when
, the accessory firm C increases the price of accessories because of the entry of main product firm A. The detailed calculations can be found in
Appendix C. On the contrary, accessory firm C reduces the accessory price when firm A joins the accessory market. The reason is the same as the result of Proposition 3. After the main product firm enters the accessory market, the price of the main product is reduced due to the increase in profit sources. When the complementary effect is large enough, the accessory firm is more profitable because of the price reduction of the main product and obtains more profits by further increasing the selling prices of its own accessories.
5. Competitive Model Analysis
Taking the monopoly model as the research benchmark to observe the real situation in which there is more than one firm in the main product market, this study further analyzes the competition model and uses the backward introduction method to calculate the equilibrium results of different strategies by main product firms A and B. Then, we compare the firms’ equilibrium profits of the four strategies to further understand whether the main product firms have different decision-making choices when there are competitors in the main product market. In the case of competition, we know how the external variables affect the participation willingness of main product firms to join the accessory market. The two main firms can choose a different or the same decision, so the decisions can be divided into four sub-games that are presented in the normal form in the
Table 2 below:
5.1. The Equilibrium Result When Neither Main Product Firm A nor B Participates in the Accessory Market
The optimal pricing and profit of the corresponding firms are resolved here when two main product firms choose not to join the accessory market at the same time. There are competitors in the main product market when the main product firm chooses not to join the accessory market. The demand for the main product is not only affected by its own price but also the rival’s pricing and the sensitivity of consumers to price differences, such as . In addition, because the main product has a one-way complementary effect on accessories, the market demand for accessories is not only affected by the accessory prices but also partially affected by the price of the main product. Therefore, the demand functions of the three firms are , and . When other conditions remain unchanged, given the main product prices and and the accessory product price, the profit formulas of the three firms are and after the first-order condition.
5.2. The Equilibrium Result of Participation in the Accessory Market of Both Main Product Firms A and B
When other conditions remain unchanged, given the main product prices
and
and the accessory product prices
,
and
, the profit formulas of the three firms are
, and
. After substituting the profit formulas of the three firms into the aforementioned demand functions, we obtain the optimal pricing of all firms by making a first-order condition of their prices in the following compiled
Table 3:
5.3. The Equilibrium Result of Participation of One Firm and Non-Participation of the Other in the Accessory Market
When firm A chooses to join and firm B chooses not to join, the demand functions of the three firms are as follows:
With other conditions unchanged, given the main product prices and and accessory product prices and , the profit formulas of the three firms are , and . After the first-order condition of the profit formulas of the three, we obtain the optimal pricing of all firms as . As mentioned in Proposition 2, after entering the market, the main product firm chooses to lower the price of the main product and make up for its losses through the revenue from accessories. If there is competition in the main product market, then Proposition 4 regarding different strategies is put forward when choosing whether to join the accessory market.
Proposition 4. When there are two firms competing in the main product market,the two firms choose different strategies for whether to join the accessory market. The price of the main product set by the main product firm who chooses to join the accessory market is lower than that of the main product firm that does not participate (i.e., ).
After subtracting the calculated
and
under the YN strategy chosen by the two main product firms who choose different strategies, the set price of the main product of the firm that joins the accessory market is lower than the price of the firm that does not participate. This result echoes Proposition 2 in the monopoly model. After joining the accessory market, the source of profit for the main product firm increases, and the accessory demand is affected by the price of the main product. Therefore, the main product firm chooses to reduce the price of the main product to stimulate the demand for accessory products, and the profits obtained from the accessory market can make up for the firm’s loss of lowering the price of the main product. The detailed calculations can be found in
Appendix D.
5.4. Equilibrium Decision-Making Analysis of Main Product Firms
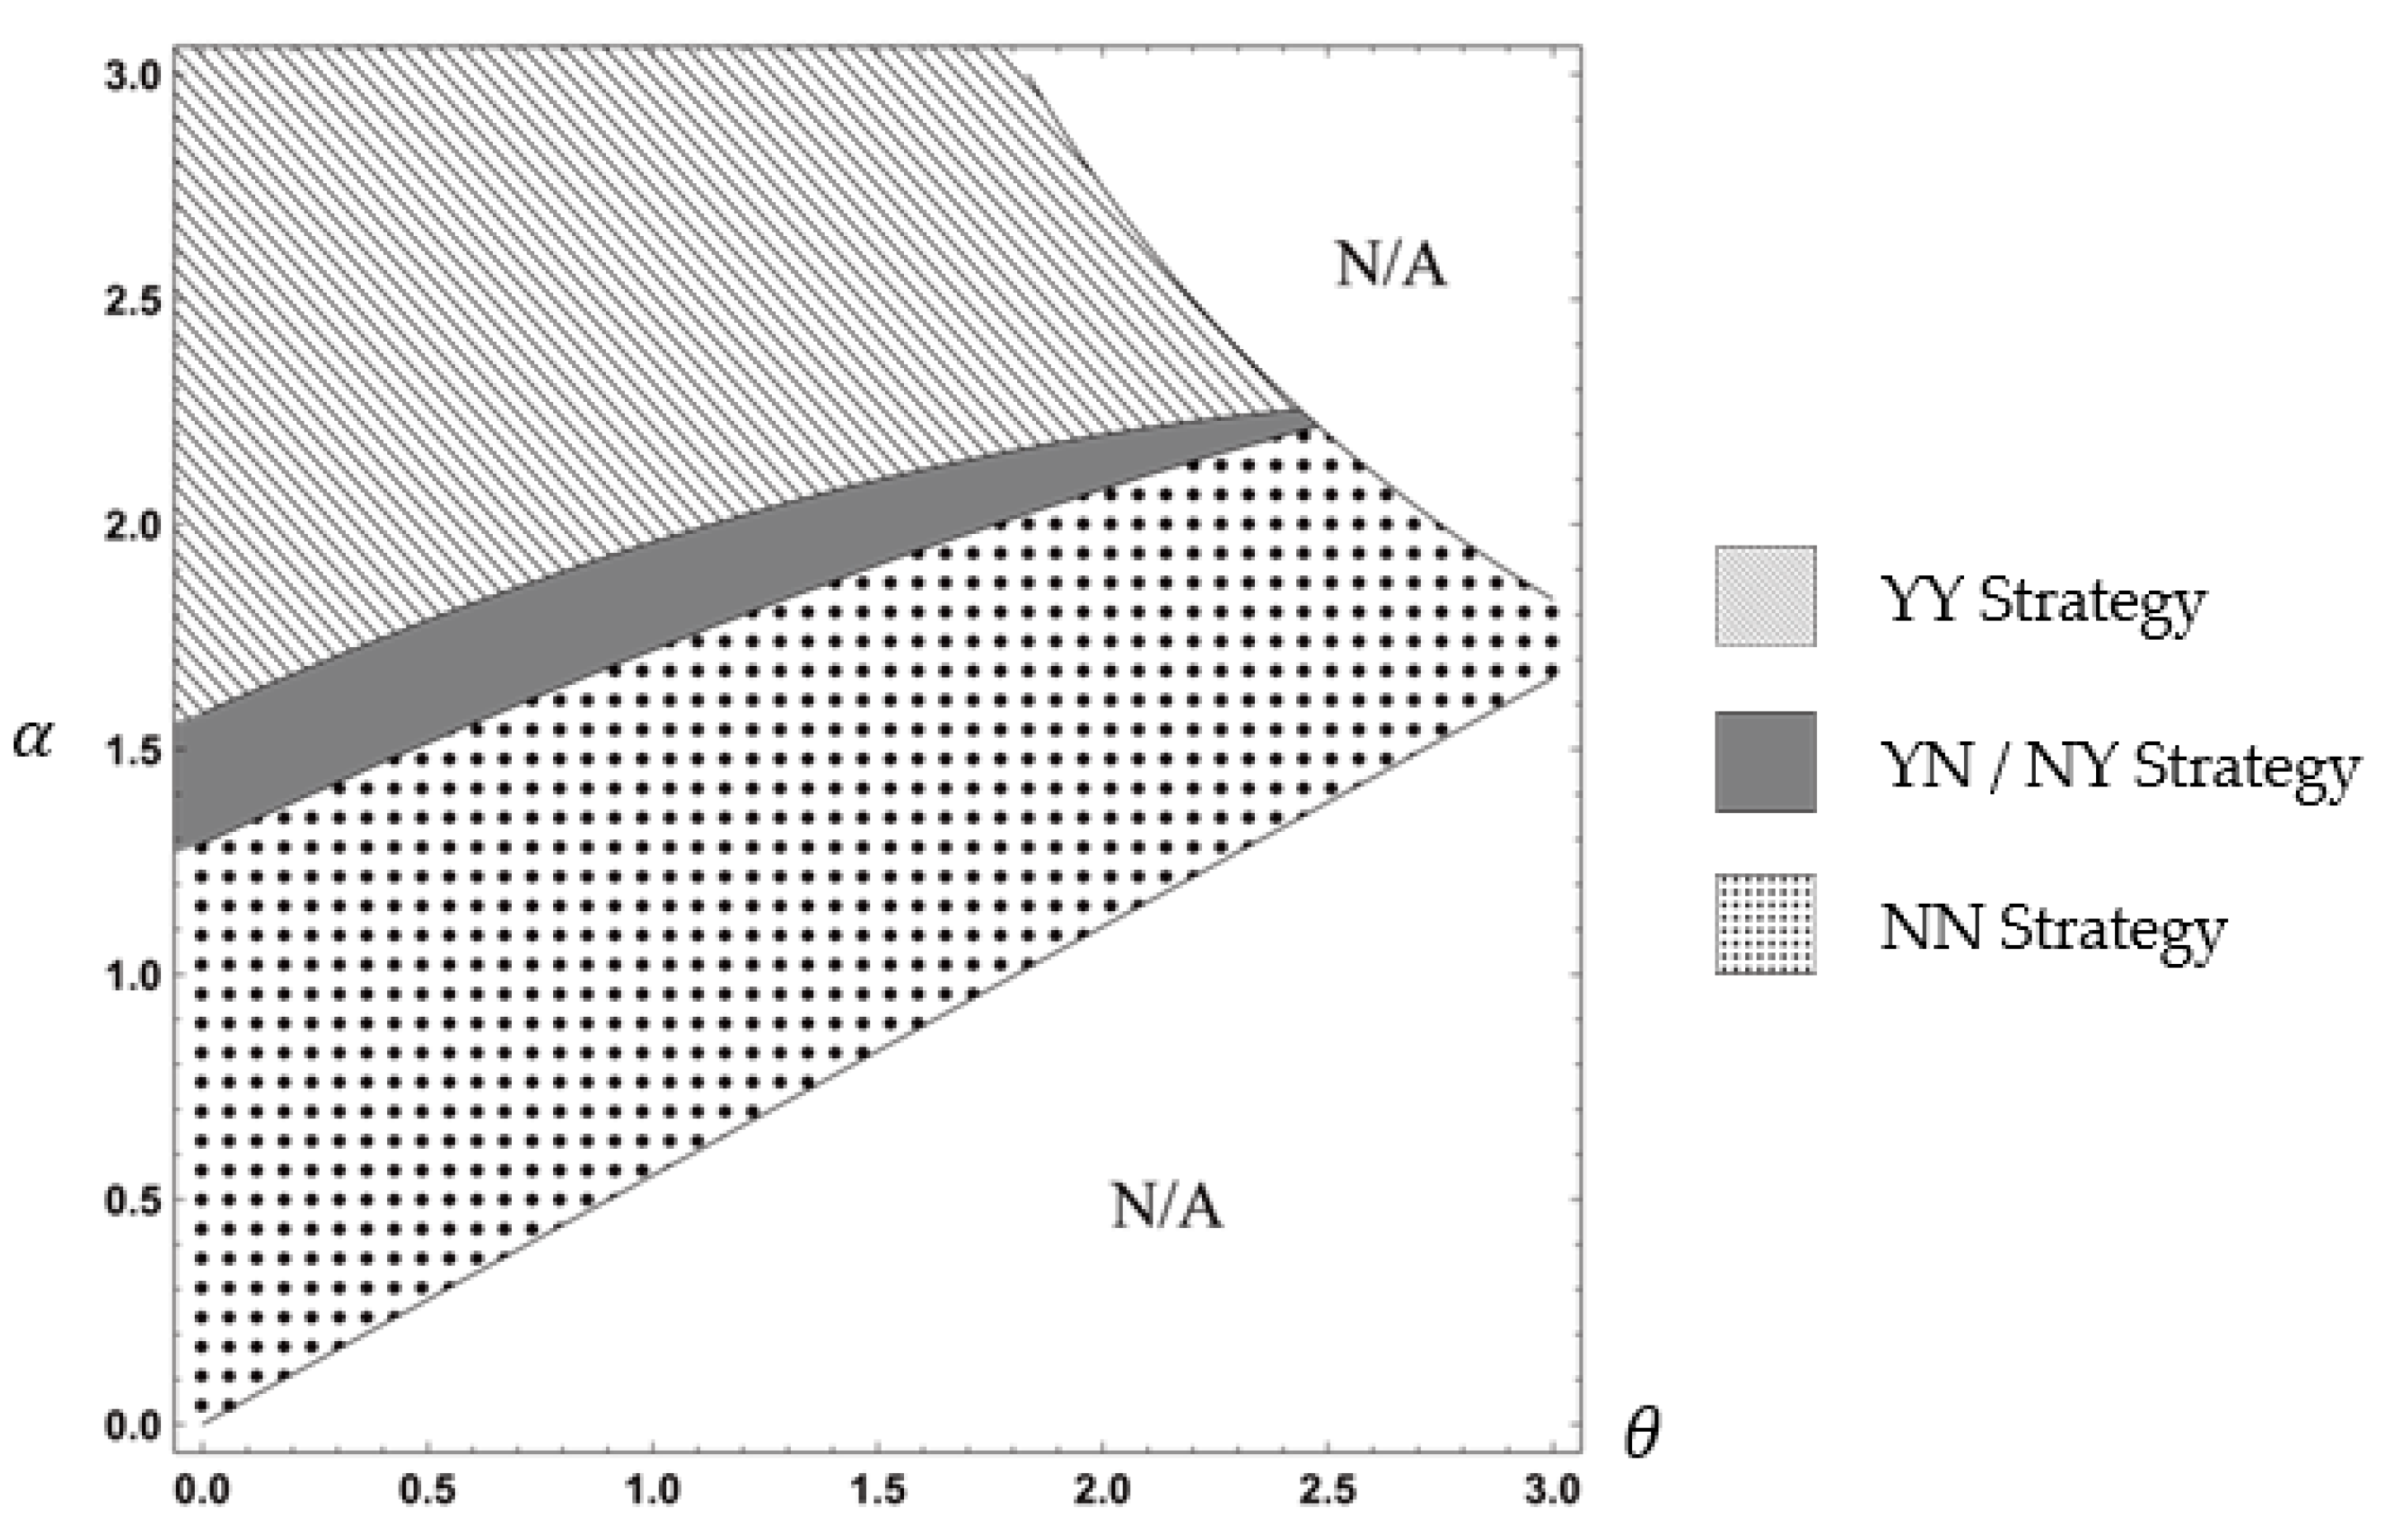
Proposition 5. Under the condition of (equivalent to ), both main product firms A and B choose to join the accessory market (YY strategy, which is superior to other strategies). When (equivalent to ), it is an equilibrium decision not to join (NN strategy) for the two main product firms. However, when , the two main product firms adopt different strategies (YN strategy or NY strategy) as their equilibrium decisions.
To explain further, the pricing and demand for all firms must be positive, and there are research restrictions on θ, so two N/A blocks in the upper right and lower right take place. In the case of the YY strategy as the main product firm’s equilibrium decision, the profits of the two main product firms must be greater than the profits of the other party’s participation, but not theirs. After subtracting their profits, it is found that if the fixed cost of joining the accessory market is small enough, then the main product firms A and B both have incentives to join the market, which is the oblique block in
Figure 2. When the fixed cost F of joining the accessory market is too large, neither main product firm is willing to join the accessory market, which is represented by dotted blocks in
Figure 2. When the fixed cost is between the above two, the equilibrium of the main product firm is also the strategy when only one joins, which is the gray block in
Figure 2. Additionally, when α is fixed, the equilibrium decision of the main product firm to enter the accessory market changes from the YY strategy to the NN strategy as θ increases. Given the main product price, if the complementary effect is greater, then the main product price has a greater impact on the demand for accessories, and the effect is negative, decreasing the main product firms’ incentives to join. If
is fixed, then the equilibrium decision of the main product firm changes from the NN strategy to the YY strategy as θ increases. Given that the main product has a complementary effect on accessories, when the accessory demand is greater, the main product firms share more profits when entering the accessory market, so the willingness to join increases.
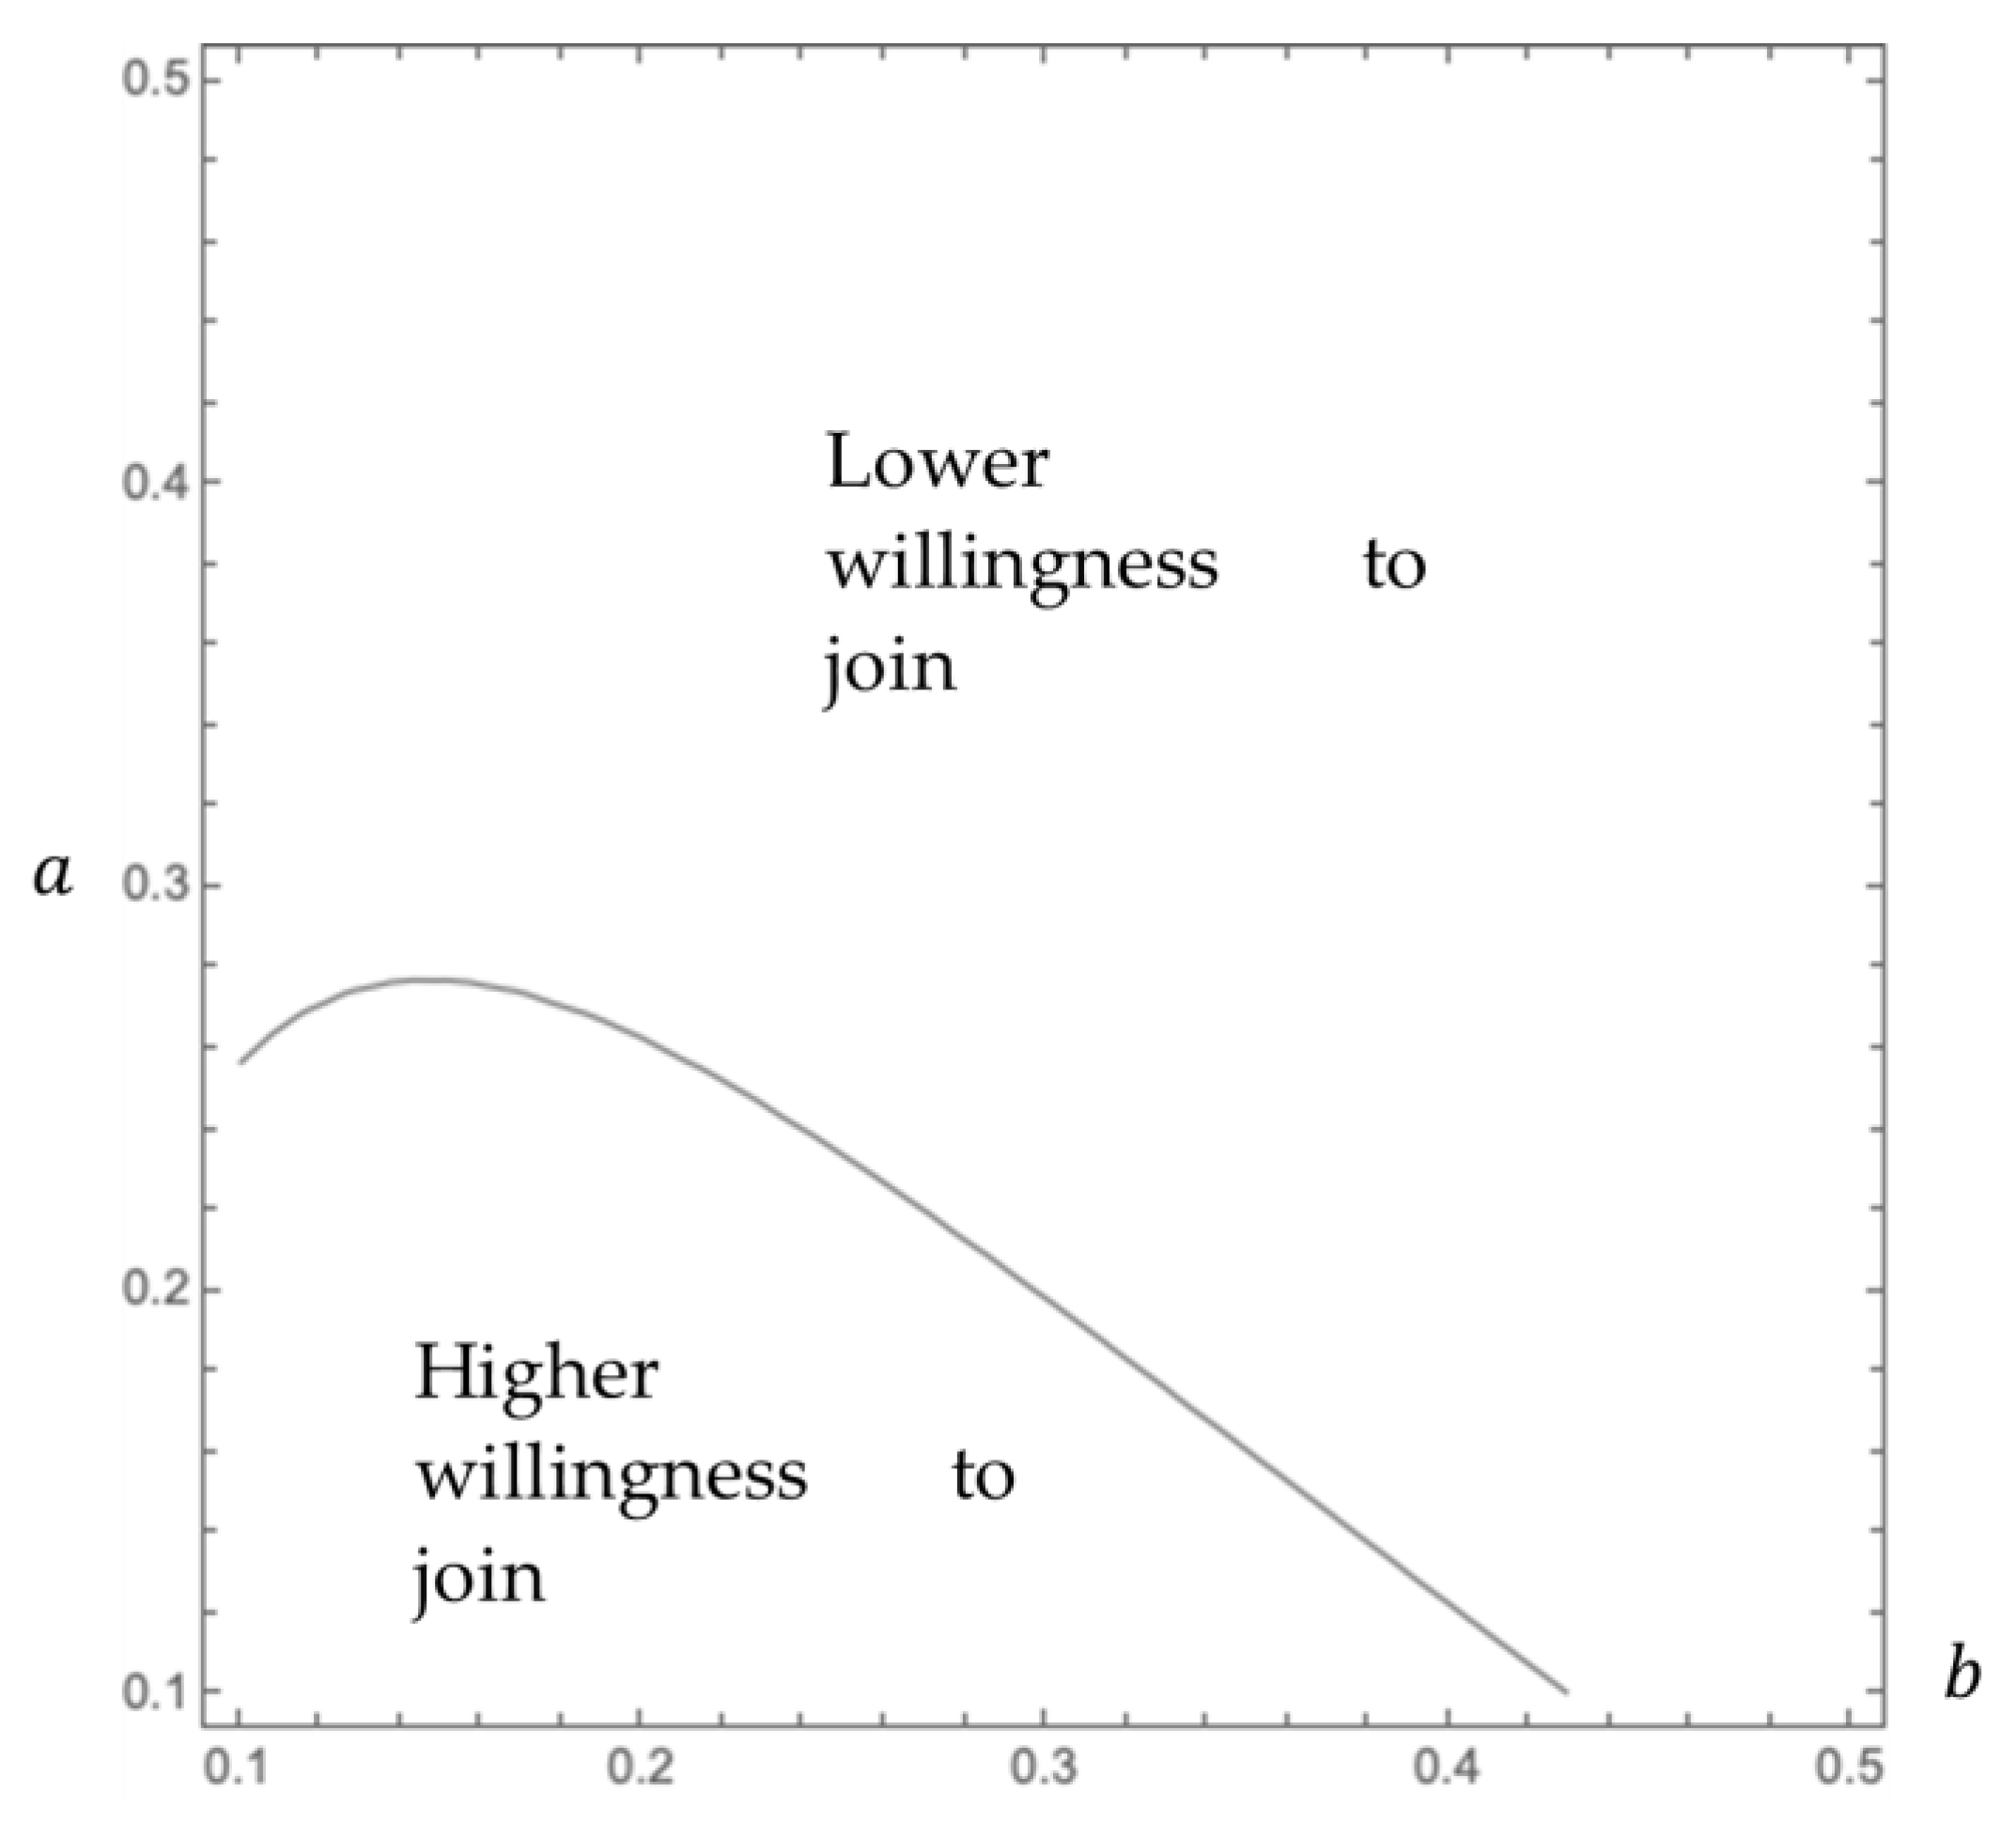
Proposition 6. When is relatively small and is also relatively small oris relatively large, the entry of competitors into the accessory market increases the main product firms’ incentive to also enter the market.
In order to understand whether the main product firms have different willingness to join the accessory market under different circumstances, we compare how profit increases when the main product firm chooses to join before or after its competitors and use this as a measure of firms’ willingness to join. After subtracting the two, the result is shown in the figure below.
When competitors are already in the accessory market, the main product firm’s willingness to join is lower, but this is not always the case after our calculation. For further illustration in
Figure 3, the upper right of the slash indicates the low willingness of the main product firm to join with competitors in the market; the lower left indicates the opposite scenario. According to
Figure 3, when the competition between the main product market and the accessory market is low, even if the competitor is already in the accessory market, the firm still has a high participation incentive. When the basic demand for the accessory market is greater, a higher probability of this scenario occurs.
Proposition 7. As the number of main product firms that enter the accessory market increases, the total accessory profit that increases due to the participation of main product firms is lower.
To further illustrate, we compare the profits of accessory firms under the three scenarios. According to the number of main product firms that enter the accessory market, we subtract the profits of the accessory firm under the YN strategy and the NN strategy and subtract the profits of the accessory firm under the YY strategy and the YN strategy. We calculate the total profit of the accessory firm in the two cases that increase and find that the accessory firm can benefit from more participating main product firms, and it is less likely to increase its total profit. Although main product firms reduce the selling price of their main products after joining the accessory market, the demand for accessory products increases due to complementary effects. However, the degree of competition in the accessory market gradually increases in line with the number of main product firms, and the market share divided by each firm is limited. Unless the main product price has a sufficient impact on the demand for accessory products, the profits of the accessory firm decrease with the increase in those of the main product firms. The detailed calculations can be found in
Appendix E.
6. Extended Model
We assume the two main product firms A and B have different market forces and have different influences on consumers and compare how the willingness of the main product firms to join the accessory market changes under different market influences. In the extended model, main product firm A is a strong firm, while firm B is a weak firm. According to the research setting by [
11], the demand degree of the main product of the weak firm is set as
(
). With a larger
β, the weaker firm has a greater demand for the main product. If
, then the demand for the main product of the two firms is the same, and the demand function is set as follows:
Regardless of the size of
β, the total demand for the overall main product market remains at 1. The game decision sequence in the model is consistent with the basic model where the main product firm first decides whether to join the accessory market and then all firms decide their product prices at the same time. To continue the setting of the basic model and the aforementioned variables, the accessory demand functions of main product firms A and B and accessory firm C taking the YY strategy as an example are proposed as follows:
Given the main product prices and and accessory product prices , , and , the profit formulas of the three firms are , , and . The optimal pricing of all firms is obtained by making the first-order condition of the profit and price. The optimal demand quantity of each firm can be obtained by substituting the optimal pricing into the demand function, and then the optimal profit of the three can be obtained by substituting it into firms’ profit formula. Equilibrium results can be obtained in the same way in other strategies. All the equilibrium results are used to calculate the equilibrium decision analysis of the main product firm in different competitive scenarios.
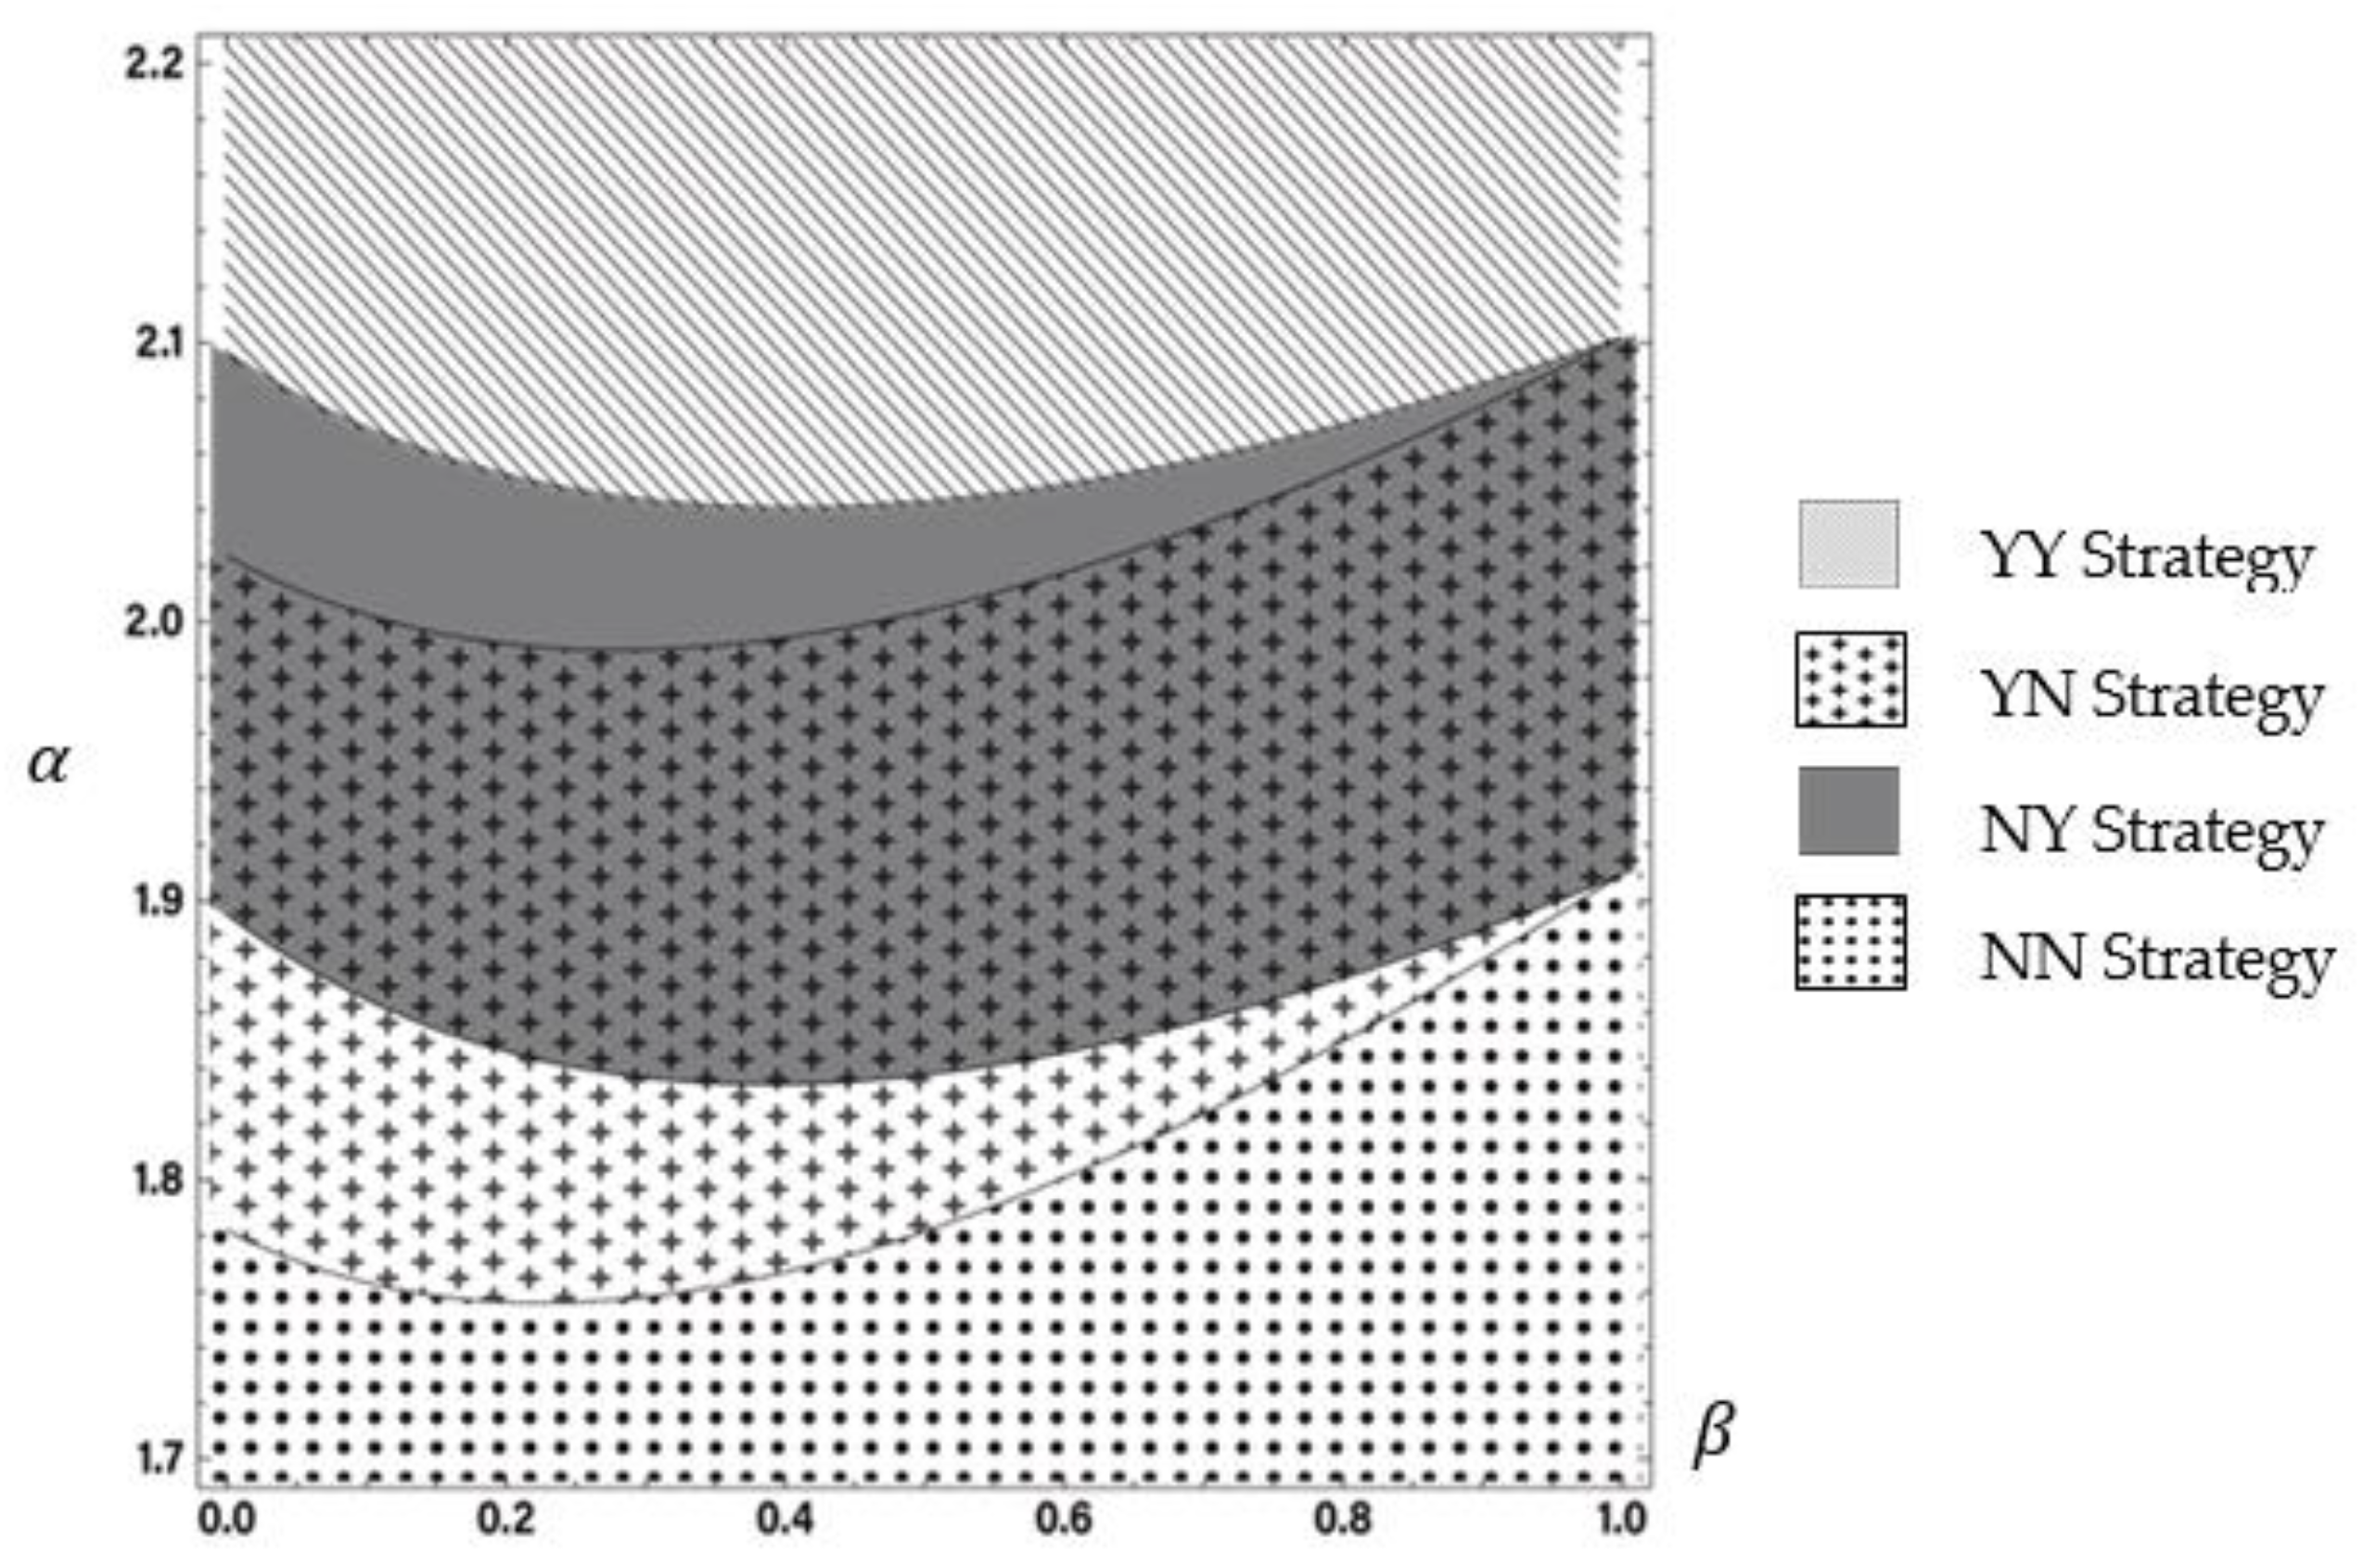
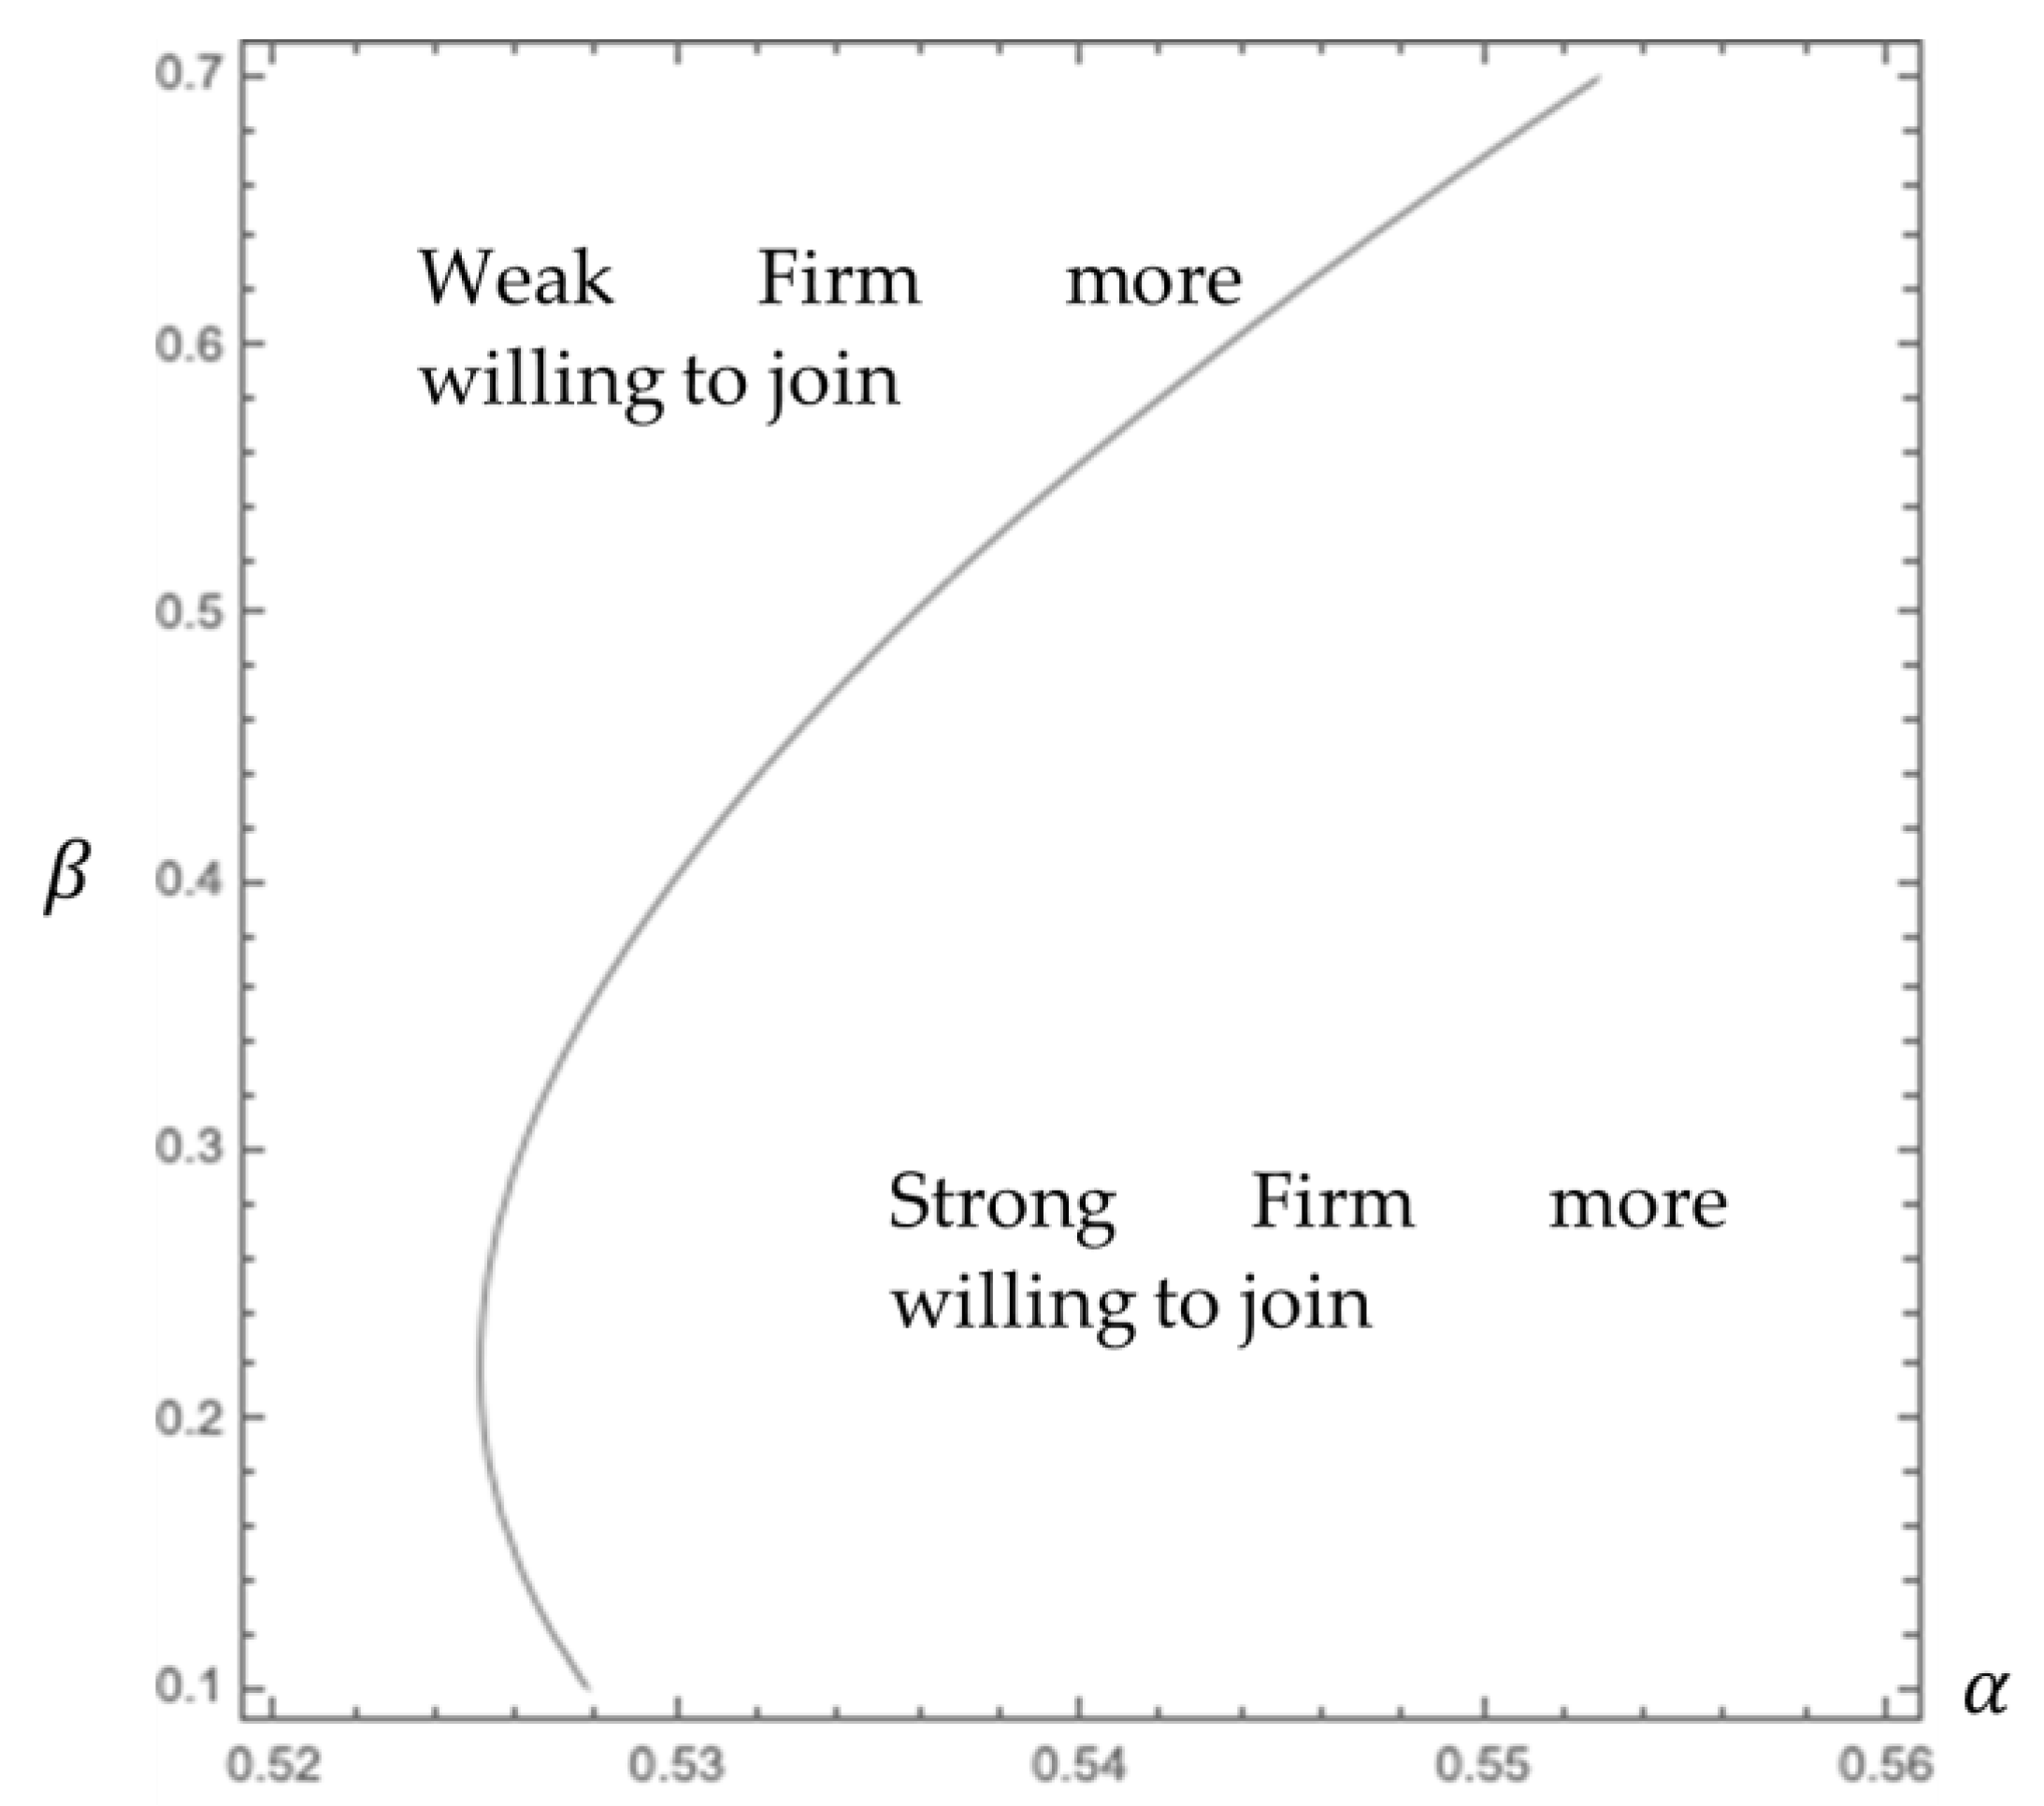
Proposition 8. When is small, all the main product firms are unwilling to join the market. If is large enough, then all firms enter the accessory market. However, when is moderate, the larger β makes it less likely for the main product firm to join.
According to
Figure 4, the accessory market is so large that it is still profitable even if both main product firms enter the accessory market. The YY strategy is an equilibrium decision regardless of the power of the two firms. On the contrary, when the market is too small, the incentives of both are insufficient, so the NN strategy is always an equilibrium solution, and when the market is moderate in size, as the weaker firms are more attractive to consumers in the main product market, the main product firms are less willing to join the accessory market. In addition, the overlapping of the YN strategy and the NY strategy indicates that both the YN strategy and the NY strategy are the equilibrium decisions of the firm. To understand the impact of the market power of the main product firm on the equilibrium decision, when the market power of the weaker firm (firm B) is similar to that of the strong firm (firm A), the YN strategy and the NY strategy are more indistinguishable. If the basic demand for the accessory market is not large enough, then the increased complementary effect erodes the market share of firms in the accessory market, so the willingness of firms to join then decreases. For further analysis, the following propositions are put forward to explain in detail.
Proposition 9. Before the two main product firms enter the accessory market, asincreases, the strong firms have more incentives to enter the market than the weak firms.
According to
Figure 5, the basic size of the accessory market has a significant impact on the participation willingness of the two firms. When
is relatively small, the incentive of the weak firm to join the market is greater than that of the strong firm. On the contrary, if
is large, then the participation willingness of strong firms is higher than that of weak firms. The reason behind this is that strong firms are more attractive in the main product market, and they have an advantage in setting higher prices than weaker firms. According to the proposition results of the basic model, the entry of main product firms into the market reduces the price of their main products. However, when the accessory demand is small, the extra profits gained by the strong firms from the accessory market cannot make up for the losses caused by lowering the price of the main product to join the accessory market. This thus reduces their participation willingness in the accessory market. The weak firms are in the opposite scenario. Given the high accessory market demand, if strong firms choose to join the market, then the profits they earn in the accessory market can cover the losses caused by the price reduction of the main products, so the participation willingness of strong firms in the accessory market increases.
7. Conclusions and Implications
When a dominant product company enters the accessory market, it opens up avenues for diversifying its profit sources by lowering the price of its main product. Surprisingly, this price reduction may not adversely impact the profitability of the accessory firm, thanks to the complementary relationship between the main product and the accessory. In fact, it could even create an opportunity for the accessory firm to raise its product prices. Nevertheless, as more companies enter the accessory market, the profit potential for accessory firms may diminish. However, the decision of main product companies to enter the accessory market is not solely based on the strength of their main product. The existence of complementary effects does not necessarily discourage firms from venturing into the accessory market as long as the demand for accessories remains robust.
Before diving into the accessory market, main product companies should carefully consider adjusting the design and functionality of their main product to align with the demands of accessories. Additionally, lowering their product prices becomes crucial. In reality, when phone companies introduce new products, they typically enhance the main product, and the price reductions may not be immediately apparent. As the wireless charger market is still in its early stages and demand is relatively moderate, it is more likely for weaker firms to enter this market compared to stronger ones. Nonetheless, stronger firms can stimulate consumer demand for accessories through innovative product design, thereby making the accessory market more enticing to enter. A perfect example of this strategy is Apple’s decision to remove the headphone jack from their new product and subsequently launch AirPods, successfully generating greater consumer demand for the Bluetooth headset accessory market.


