

Opuntia ficus-indica L. Fruits Cold Storage Using Different Packaging Materials


Abstract
:1. Introduction
2. Materials and Methods
2.1. Material
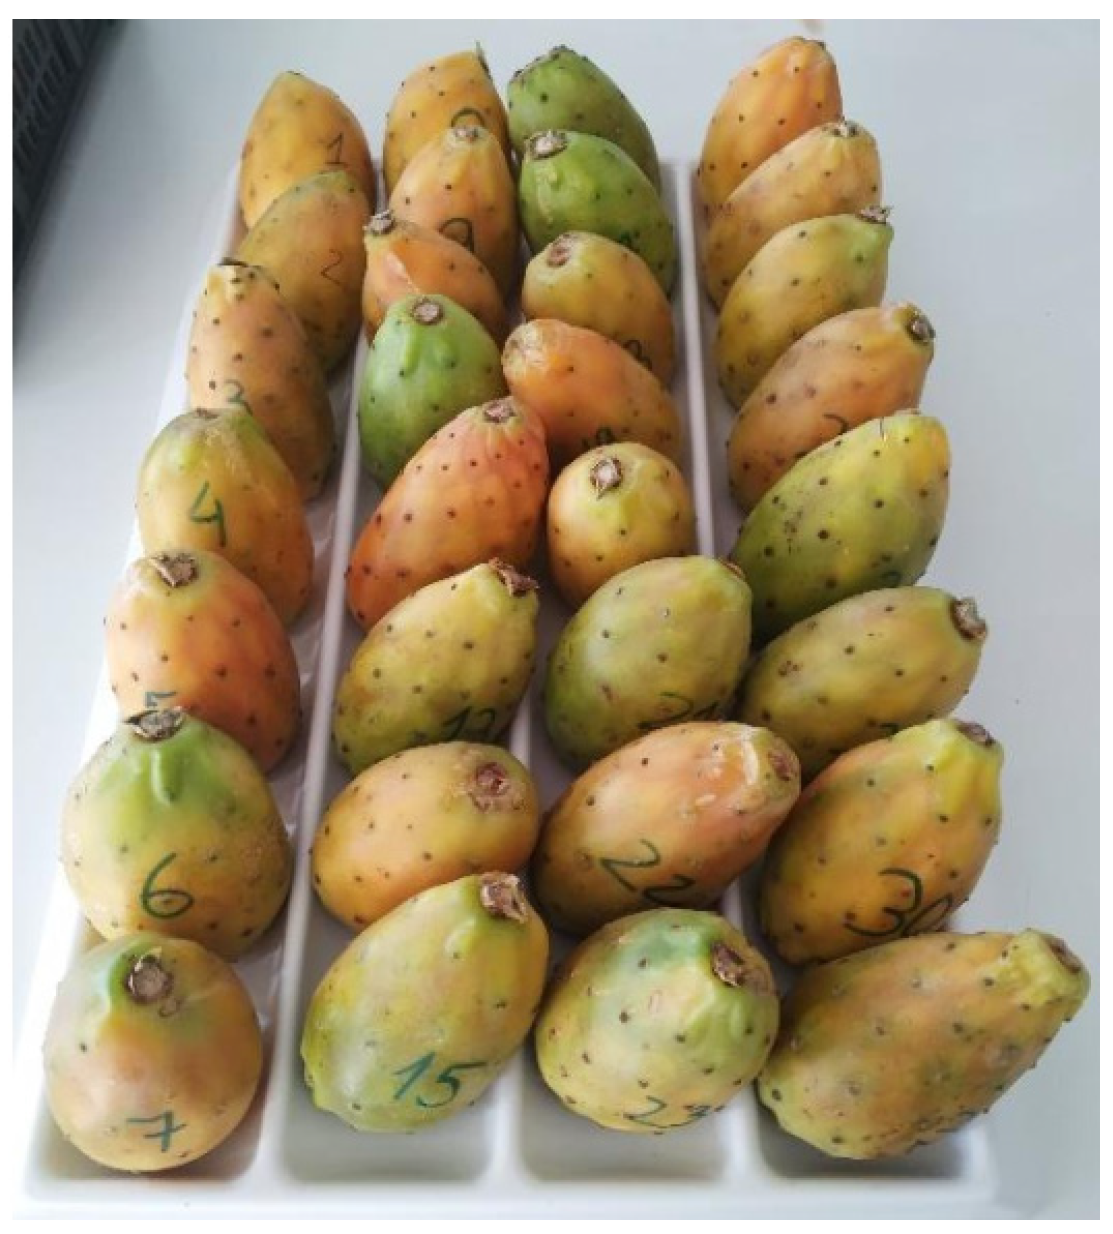
2.1.1. Fruits
2.1.2. Packaging Material and Chemicals
2.2. Methods
2.2.1. Experimental Design
2.2.2. Weight Loss
2.2.3. Color
2.2.4. Texture
2.2.5. Total Soluble Solids
2.2.6. Titratable Acidity
2.2.7. Phenolic Content
2.2.8. Antioxidant Activity
2.2.9. Mineral Analysis
2.2.10. Statistical Analysis
3. Results
3.1. Mineral Analysis
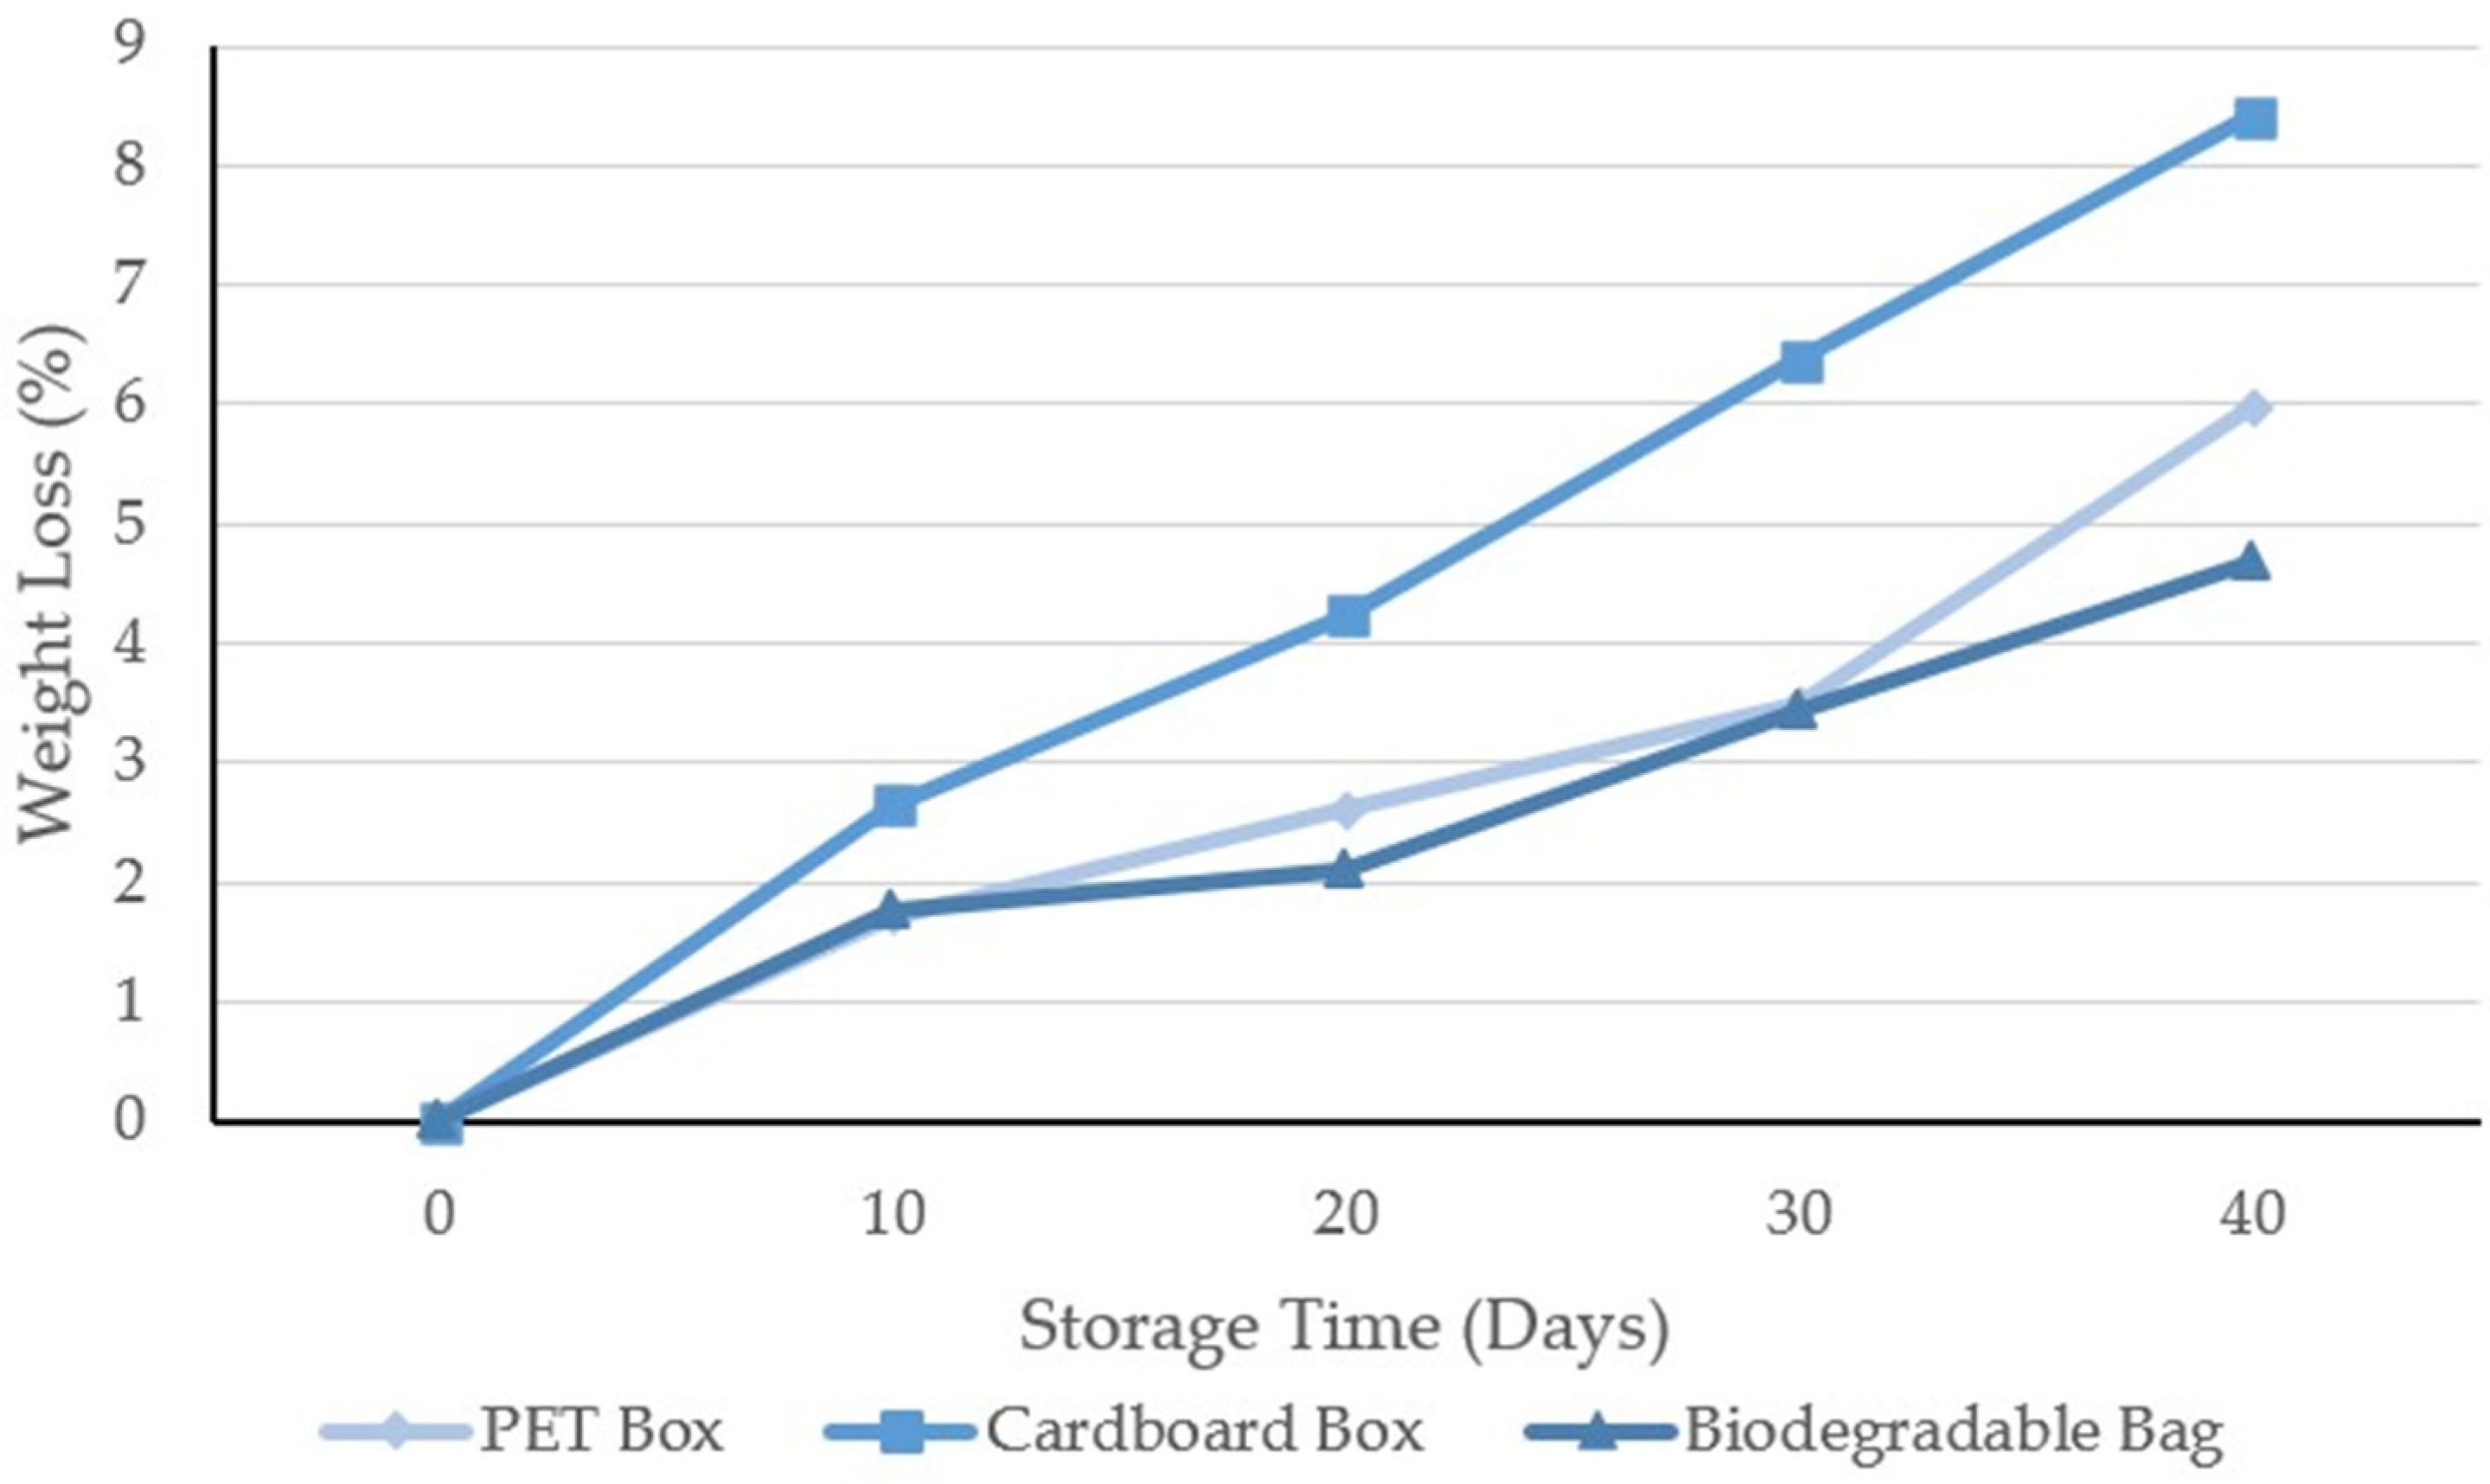
3.2. Weight Loss
3.3. Color
3.4. Texture
3.5. Total Soluble Solids and Titratable Acidity
3.6. Phenolic Content and Antioxidant Activity
4. Conclusions
Author Contributions
Funding
Institutional Review Board Statement
Informed Consent Statement
Data Availability Statement
Conflicts of Interest
References
- Davis, S.C.; Simpson, J.; Gil-Vega, K.d.C.; Niechayev, N.A.; van Tongerlo, E.; Castano, N.H.; Dever, L.V.; Búrquez, A. Undervalued potential of crassulacean acid metabolism for current and future agricultural production. J. Exp. Bot. 2019, 70, 6521–6537. [Google Scholar] [CrossRef] [PubMed] [Green Version]
- Drennan, P.M.; Nobel, P.S. Responses of CAM species to increasing atmospheric CO2 concentrations. Plant Cell Environ. 2000, 23, 767–781. [Google Scholar] [CrossRef] [Green Version]
- Hultine, K.R.; Hernández-Hernández, T.; Williams, D.G.; Albeke, S.E.; Tran, N.; Puente, R.; Larios, E. Global change impacts on cacti (Cactaceae): Current threats, challenges and conservation solutions. Ann. Bot. 2023, mcad040. [Google Scholar] [CrossRef] [PubMed]
- Reis, C.M.G.; Gazarini, L.C.; Ribeiro, M.M. Fruit production from Opuntia ficus-indica ecotypes in comparison to commercial Italian clones. Hortic. Sci. 2018, 45, 92–100. [Google Scholar] [CrossRef] [Green Version]
- Arcas Lario, N. Sistemas agroalimentarios sostenibles, innovadores e inclusivos para una sociedad en transformación. In Proceedings of the XIII Congreso de Economía Agroalimentaria, Cartagena, Colombia, 1–3 September 2021; pp. 253–256. [Google Scholar]
- Ciriminna, R.; Chavarría-Hernández, N.; Rodríguez-Hernández, A.I.; Pagliaro, M. Toward unfolding the bioeconomy of nopal (Opuntia spp.). Biofuels Bioprod. Biorefining 2019, 13, 1417–1427. [Google Scholar] [CrossRef] [Green Version]
- Patel, S. Opuntia cladodes (nopal): Emerging functional food and dietary supplement. Med. J. Nutr. Metab. 2014, 7, 11–19. [Google Scholar] [CrossRef]
- Silva, M.A.; Albuquerque, T.G.; Pereira, P.; Ramalho, R.; Vicente, F.; Oliveira, M.B.P.P.; Costa, H.S. Opuntia ficus-indica (L.) Mill.: A Multi-Benefit Potential to Be Exploited. Molecules 2021, 26, 951. [Google Scholar] [CrossRef]
- Gómez-Maqueo, A.; Steurer, D.; Welti-Chanes, J.; Cano, M.P. Bioaccessibility of antioxidants in prickly pear fruits treated with high hydrostatic pressure: An application for healthier foods. Molecules 2021, 26, 5252. [Google Scholar] [CrossRef]
- Allegra, A.; Sortino, G.; Miciletta, G.; Riotto, M.; Fasciana, T.; Inglese, P. The influence of harvest period and fruit ripeness at harvest on minimally processed cactus pears (Opuntia ficus-indica L. Mill.) stored under passive atmosphere. Postharvest Biol. Technol. 2015, 104, 57–62. [Google Scholar] [CrossRef]
- Aruwa, C.E.; Amoo, S.O.; Kudanga, T. Opuntia (Cactaceae) plant compounds, biological activities and prospects—A comprehensive review. Food Res. Int. 2018, 112, 328–344. [Google Scholar] [CrossRef]
- Juhaimi, F.A.; Ghafoor, K.; Uslu, N.; Mohamed Ahmed, I.A.; Babiker, E.E.; Özcan, M.M.; Fadimu, G.J. The effect of harvest times on bioactive properties and fatty acid compositions of prickly pear (Opuntia ficus-barbarica A. Berger) fruits. Food Chem. 2020, 303, 125387. [Google Scholar] [CrossRef] [PubMed]
- Andreu-Coll, L.; Noguera-Artiaga, L.; Carbonell-Barrachina, Á.A.; Legua, P.; Hernández, F. Volatile composition of prickly pear fruit pulp from six Spanish cultivars. J. Food Sci. 2020, 85, 358–363. [Google Scholar] [CrossRef] [PubMed]
- Hahn-Schlam, F.; Valle-Guadarrama, S.; Jenkins, T. Robotic cactus pear cryocauterization increases storage life. Postharvest Biol. Technol. 2019, 147, 132–138. [Google Scholar] [CrossRef]
- Hertog, M.L.A.T.M.; Uysal, I.; McCarthy, U.; Verlinden, B.M.; Nicolaï, B.M. Shelf life modelling for first-expired-first-out warehouse management. Philos. Trans. R. Soc. A Math. Phys. Eng. Sci. 2014, 372, 20130306. [Google Scholar] [CrossRef]
- Kader, A.A.; Zagory, D.; Kerbel, E.L.; Wang, C.Y. Modified atmosphere packaging of fruits and vegetables. Crit. Rev. Food Sci. Nutr. 1989, 28, 1–30. [Google Scholar] [CrossRef]
- Ward, G. Modified Atmosphere Packaging for Extending Storage Life of Fresh Fruits and Vegetables. In Reference Module in Food Science; Elsevier: Amsterdam, The Netherlands, 2016. [Google Scholar]
- Gomes, B.A.F.; Alexandre, A.C.S.; de Andrade, G.A.V.; Zanzini, A.P.; de Barros, H.E.A.; Ferraz e Silva, L.M.d.S.; Costa, P.A.; Boas, E.V.d.B.V. Recent advances in processing and preservation of minimally processed fruits and vegetables: A review—Part 2: Physical methods and global market outlook. Food Chem. Adv. 2023, 2, 100304. [Google Scholar] [CrossRef]
- Zegbe, J.A.; Serna-Pérez, A.; Mena-Covarrubias, J. Irrigation enhances postharvest performance of «Cristalina» cactus pear fruit. Acta Hortic. 2015, 1067, 417–422. [Google Scholar] [CrossRef]
- Cruz-Bravo, R.K.; Guzmán-Maldonado, S.H.; Araiza-Herrera, H.A.; Zegbe, J.A. Storage alters physicochemical characteristics, bioactive compounds and antioxidant capacity of cactus pear fruit. Postharvest Biol. Technol. 2019, 150, 105–111. [Google Scholar] [CrossRef]
- Andreu-Coll, L.; García-Pastor, M.E.; Valero, D.; Amorós, A.; Almansa, M.S.; Legua, P.; Hernández, F. Influence of Storage on Physiological Properties, Chemical Composition, and Bioactive Compounds on Cactus Pear Fruit (Opuntia ficus-indica (L.) Mill.). Agriculture 2021, 11, 62. [Google Scholar] [CrossRef]
- Liguori, G.; Gaglio, R.; Greco, G.; Gentile, C.; Settanni, L.; Inglese, P. Effect of Opuntia ficus-indica Mucilage Edible Coating on Processed Cactus Pear Fruits. Agron. Artic. 2021, 11, 9976052. [Google Scholar]
- Díaz-Delgado, G.L.; Rodríguez-Rodríguez, E.M.; Dorta, E.; Lobo, M.G. Effects of Peeling, Film Packaging, and Cold Storage on the Quality of Minimally Processed Prickly Pears (Opuntia ficus-indica L. Mill.). Agriculture 2022, 12, 281. [Google Scholar] [CrossRef]
- Shumye Adilu, G.; Woldetsadik, K.; Fitiwi, I. Postharvest Changes in Weight and Sugar Content of Cactus Pear [Opuntia Ficus-indica (L.) Mill.] Fruit under Integrated Handling Practices. Int. J. Fruit Sci. 2020, 20, S1862–S1875. [Google Scholar] [CrossRef]
- Trivium Packaging. Global Buying Green Report: Sustainable Packaging in a Year of Unparalleled Disruption; Trivium Packaging: Chicago, IL, USA, 2021. [Google Scholar]
- European Commission. European Green Deal: Putting an End to Wasteful Packaging, Boosting Reuse and Recycling; European Commission: Brussels, Belgium, 2022. [Google Scholar]
- Sánchez-Rangel, J.C.; Benavides, J.; Heredia, J.B.; Cisneros-Zevallos, L.; Jacobo-Velázquez, D.A. The Folin-Ciocalteu assay revisited: Improvement of its specificity for total phenolic content determination. Anal. Methods 2013, 5, 5990–5999. [Google Scholar] [CrossRef]
- Kim, M.J.; Jun, J.G.; Park, S.Y.; Choi, M.J.; Park, E.; Kim, J.I.; Kim, M.J. Antioxidant activities of fresh grape juices prepared using various household processing methods. Food Sci. Biotechnol. 2017, 26, 861–869. [Google Scholar] [CrossRef] [PubMed]
- Antunes, P.; Miguel-Pintado, C.; Paulo, L. Major and minor minerals of «Sweetheart» cherry stone from Cova da Beira. Acta Hortic. 2017, 1161, 677–680. [Google Scholar] [CrossRef]
- United States Department of Agriculture Agricultural Research Service, Food Data Central. Prickly Pears Raw, (SR Legacy 167750), Fruit and Fruit Juices Basic Report: 09037. Available online: https://fdc.nal.usda.gov/fdc-app.html#/food-details/167750/nutrients (accessed on 23 May 2023).
- Barba, F.J.; Garcia, C.; Fessard, A.; Munekata, P.E.S.; Lorenzo, J.M.; Aboudia, A.; Ouadia, A.; Remize, F. Opuntia Ficus Indica Edible Parts: A Food and Nutritional Security Perspective. Food Rev. Int. 2022, 38, 930–952. [Google Scholar] [CrossRef]
- Lufu, R.; Ambaw, A.; Opara, U.L. Water loss of fresh fruit: Influencing pre-harvest, harvest and postharvest factors. Sci. Hortic. 2020, 272, 109519. [Google Scholar] [CrossRef]
- Riva, S.C.; Opara, U.O.; Fawole, O.A. Recent developments on postharvest application of edible coatings on stone fruit: A review. Sci. Hortic. 2020, 262, 109074. [Google Scholar] [CrossRef]
- Kader, A.A. Quality parameters of fresh-cut fruit and vegetable products. Fresh-Cut Fruits Veg. Sci. Technol. Mark. 2002, 30, 11–20. [Google Scholar]
- Ochoa-Velasco, C.E.; Guerrero-Beltrán, J.Á. The effects of modified atmospheres on prickly pear (Opuntia albicarpa) stored at different temperatures. Postharvest Biol. Technol. 2016, 111, 314–321. [Google Scholar] [CrossRef]
- Kahramanoğlu, İ. Preserving postharvest storage quality of fresh loquat fruits by using different bio-materials. J. Food Sci. Technol. 2020, 57, 3004–3012. [Google Scholar] [CrossRef]
- Kader, A.A. Postharvest biology and technology: An overview. In Postharvest Technology of Horticultural Crops; University of California: Riverside, CA, USA, 1992; pp. 15–20. [Google Scholar]
- Rezaiyan Attar, F.; Sedaghat, N.; Pasban, A.; Yeganehzad, S.; Hesarinejad, M.A. Modified atmosphere packaging with chitosan coating to prevent deterioration of fresh in-hull Badami’s pistachio fruit. Chem. Biol. Technol. Agric. 2023, 10, 1–18. [Google Scholar] [CrossRef]
- Kramer, P.J.; Boyer, J.S. Water Relations of Plants and Soils; Academic Press: Cambridge, MA, USA, 1995; ISBN 0124250602. [Google Scholar]
- Fenn, M.A.; Giovannoni, J.J. Phytohormones in fruit development and maturation. Plant J. 2021, 105, 446–458. [Google Scholar] [CrossRef] [PubMed]
- González González, R.; Morales, O.T.; Olivares Sáenz, E.; Aranda, R.J.; Gallegos Vázquez, C. Conservación de una variedad de tuna (Burrona) bajo diferentes manejos poscosecha. Cienc. UANL 2001, 4, 322–329. [Google Scholar]
- Wang, D.; Ding, C.; Feng, Z.; Ji, S.; Cui, D. Recent advances in portable devices for fruit firmness assessment. Crit. Rev. Food Sci. Nutr. 2023, 63, 1143–1154. [Google Scholar] [CrossRef] [PubMed]
- Corrales-García, J.; Andrade-Rodríguez, J. Response of Six Cultivars of Tuna Fruits to Cold Storage. J. Prof. Assoc. Cactus Dev. 1997, 2, 160–168. [Google Scholar]
- Xu, S.; Lu, H.; Ference, C.; Zhang, Q. Visible/near infrared reflection spectrometer and electronic nose data fusion as an accuracy improvement method for portable total soluble solid content detection of orange. Appl. Sci. 2019, 9, 3761. [Google Scholar] [CrossRef] [Green Version]
- Gurrieri, S.; Miceli, L.; Maria Lanza, C.; Tomaselli, F.; Bonomo, R.P.; Rizzarelli, E. Chemical characterization of sicilian prickly pear (Opuntia ficus indica) and perspectives for the storage of its juice. J. Agric. Food Chem. 2000, 48, 5424–5431. [Google Scholar] [CrossRef]
- Alzaeem, I.; Ebrahim, K. Evaluation of Quality of Storage of Prickly Pear (Opuntia Ficus Indica (L.)) Using Two Packaging Methods. Online J. Anim. Feed. Res. 2023, 5, 19–28. [Google Scholar]
- Kotani, A.; Kusu, F.; Takamura, K.; Hakamata, H. Review—A Portable Voltammetric Sensor for Determining Titratable Acidity in Foods and Beverages. J. Electrochem. Soc. 2020, 167, 037517. [Google Scholar] [CrossRef]
- Reda, T.H.; Atsbha, M.K. Nutritional composition, antinutritional factors, antioxidant activities, functional properties, and sensory evaluation of cactus pear (Opuntia ficus-indica) seeds grown in Tigray Region, Ethiopia. Int. J. Food Sci. 2019, 2019, 5697052. [Google Scholar] [CrossRef] [PubMed] [Green Version]
- Cao, H.; Saroglu, O.; Karadag, A.; Diaconeasa, Z.; Zoccatelli, G.; Conte-Junior, C.A.; Gonzalez-Aguilar, G.A.; Ou, J.; Bai, W.; Zamarioli, C.M.; et al. Available technologies on improving the stability of polyphenols in food processing. Food Front. 2021, 2, 109–139. [Google Scholar] [CrossRef]
- Cefola, M.; Renna, M.; Pace, B. Marketability of ready-to-eat cactus pear as affected by temperature and modified atmosphere. J. Food Sci. Technol. 2014, 51, 25–33. [Google Scholar] [CrossRef] [Green Version]
- Ochoa-Velasco, C.E.; Guerrero-Beltrán, J.Á. Postharvest quality of peeled prickly pear fruit treated with acetic acid and chitosan. Postharvest Biol. Technol. 2014, 92, 139–145. [Google Scholar] [CrossRef]
- Pérez-Lamela, C.; Franco, I.; Falqué, E. Impact of high-pressure processing on antioxidant activity during storage of fruits and fruit products: A review. Molecules 2021, 26, 5265. [Google Scholar] [CrossRef]
- Piga, A.; D’Aquino, S.; Agabbio, M.; Emonti, G.; Farris, G.A. Influence of Storage Temperature on Shelf-life of Minimally Processed Cactus Pear Fruits. LWT—Food Sci. Technol. 2000, 33, 15–20. [Google Scholar] [CrossRef]
- Stintzing, F.C.; Carle, R. Cactus stems (Opuntia spp.): A review on their chemistry, technology, and uses. Mol. Nutr. Food Res. 2005, 49, 175–194. [Google Scholar] [CrossRef] [PubMed]
- Rouxinol, M.I. Characterization of Grape Extracts from Vitis vinifera L. Varieties Grown in Alentejo: Phenolic and Biochemical Assessment. Ph.D. Thesis, Departamento de Química e Bioquímica, Universidade de Évora, Évora, Portugal, 2023. [Google Scholar]


| Parameter | Result |
|---|---|
| Calcium (mg/100 g) | 65.0 |
| Potassium (mg/100 g) | 18.8 |
| Sodium (mg/100 g) | <LQ |
| Copper (mg/100 g) | 0.044 |
| Iron (mg/100 g) | 0.143 |
| Phosphorus (mg/100 g) | 16.77 |
| Manganese (mg/100 g) | <LQ |
| Magnesium (mg/100 g) | 37.7 |
| Zinc (mg/100 g) | 0.127 |
| Humidity (%) | 84.54 |
| Weight Loss (%) | ||||
|---|---|---|---|---|
| Factors and levels | Mean ± SD | F (p) | ||
| Storage time (day) | 0 | 0 ± 0 a | 305.03 (0.000) | |
| 10 | 2.04 ± 0.51 b | |||
| 20 | 2.98 ± 1.09 c | |||
| 30 | 4.43 ± 1.6 d | |||
| 40 | 6.30 ± 1.85 e | |||
| Packaging modality | Cardboard Box | 2.83 ± 3.09 a | 68.13 (0.000) | |
| PET Box | 1.97 ± 2.22 b | |||
| Biodegradable Bag | 1.56 ± 1.68 c | |||
| Interaction | 0 | Cardboard Box | 0 ± 0 a | 11.23 (0.000) |
| 0 | PET Box | 0 ± 0 a | ||
| 0 | Biodegradable Bag | 0 ± 0 a | ||
| 10 | Cardboard Box | 2.65 ± 0.37 bc | ||
| 10 | PET Box | 1.72 ± 0.14 b | ||
| 10 | Biodegradable Bag | 1.76 ± 0.18 b | ||
| 20 | Cardboard Box | 4.23 ± 0,90 d | ||
| 20 | PET Box | 2.60 ± 0.45 bc | ||
| 20 | Biodegradable Bag | 2.10 ± 0.12 b | ||
| 30 | Cardboard Box | 6.37 ± 0.27 e | ||
| 30 | PET Box | 3.48 ± 1.10 cd | ||
| 30 | Biodegradable Bag | 3.44 ± 0.15 cd | ||
| 40 | Cardboard Box | 8.41 ± 1.16 f | ||
| 40 | PET Box | 5.98 ± 1.53 e | ||
| 40 | Biodegradable Bag | 4.69 ± 0.37 dg | ||
| L* | a* | b* | ||||||
|---|---|---|---|---|---|---|---|---|
| Factors and levels | Mean ± SD | F (p) | Mean ± SD | F (p) | Mean ± SD | F (p) | ||
| Storage time (day) | 0 | 58.97 ± 2.83 a | 24.97 (0.000) | 2.94 ± 2.28 a | 42.998 (0.000) | 38.55 ± 3.10 a | 15.28 (0.000) | |
| 10 | 56.31 ± 5.01 b | 10.10 ± 3.26 b | 36.70 ± 4.85 ab | |||||
| 20 | 56.77 ± 2.57 b | 10.51 ± 4.29 b | 35.46 ± 3.61 b | |||||
| 30 | 51.99 ± 3.58 c | 8.80 ± 4.18 b | 36.26 ± 3.96 ab | |||||
| 40 | 55.02 ± 3.28 b | 5.75 ± 4.67 c | 31.99 ± 4.50 c | |||||
| Packaging modality | Cardboard Box | 55.91 ± 4.54 a | 4.10 (0.020) | 5.78 ± 4.30 | 3.00 (0.052) | 36.29 ± 4.14 | 0.39 (0.679) | |
| PET Box | 57.18 ± 3.99 a | 6.27 ± 4.80 | 36.77 ± 4.77 | |||||
| Biodegradable Bag | 56.95 ± 3.75 a | 6.95 ± 5.05 | 36.59 ± 4.23 | |||||
| Interaction | 0 | Cardboard Box | 58.97 ± 2.88 | 1.72 (0.097) | 2.94 ± 2.41 a | 2.81 (0.006) | 38.55 ± 3.14 | 0.72 (0.671) |
| 0 | PET Box | 58.97 ± 2.88 | 2.94 ± 2.41 a | 38.55 ± 3.14 | ||||
| 0 | Biodegradable Bag | 58.97 ± 2.88 | 2.94 ± 2.41 a | 38.55 ± 3.14 | ||||
| 10 | Cardboard Box | 52.88 ± 4.83 | 10.92 ± 3.81 bc | 35.05 ± 3.74 | ||||
| 10 | PET Box | 58.43 ± 5.26 | 10.32 ± 2.38 bcd | 38.22 ± 6.73 | ||||
| 10 | Biodegradable Bag | 57.63 ± 3.23 | 9.06 ± 3.50 bcde | 36.85 ± 3.41 | ||||
| 20 | Cardboard Box | 57.18 ± 2.55 | 9.62 ± 4.47 bcd | 36.44 ± 3.21 | ||||
| 20 | PET Box | 56.75 ± 3.03 | 11.72 ± 4.34 c | 35.38 ± 3.83 | ||||
| 20 | Biodegradable Bag | 56.37 ± 2.34 | 10.19 ± 4.30 bcd | 34.58 ± 3.92 | ||||
| 30 | Cardboard Box | 50.77 ± 3.88 | 5.76 ± 2.12 abde | 35.34 ± 3.38 | ||||
| 30 | PET Box | 53.07 ± 3.43 | 8.60 ± 3.84 bcde | 37.19 ± 3.74 | ||||
| 30 | Biodegradable Bag | 52.11 ± 3.44 | 12.03 ± 3.89 c | 36.24 ± 4.85 | ||||
| 40 | Cardboard Box | 53.97 ± 3.16 | 5.07 ± 3.31 ade | 31.81 ± 4.67 | ||||
| 40 | PET Box | 55.26 ± 3.35 | 4.09 ± 4.38 ae | 31.16 ± 4.30 | ||||
| 40 | Biodegradable Bag | 55.83 ± 3.43 | 8.10 ± 5.55 bcde | 33.03 ± 4.84 | ||||
| Firmness of Epidermis (N) | Gradient (N/mm) | Firmness of Pulp (N) | ||||||
|---|---|---|---|---|---|---|---|---|
| Factors and levels | Mean ± SD | F(p) | Mean ± SD | F(p) | Mean ± SD | F(p) | ||
| Storage time (day) | 0 | 10.11 ± 1.35 a | 69.79 (0.000) | 5.05 ± 1.09 a | 80.94 (0.000) | 2.03 ± 0.73 a | 26.59 (0.000) | |
| 10 | 8.15 ± 1.32 bc | 4.19 ± 0.52 b | 1.28 ± 0.37 b | |||||
| 20 | 8.87 ± 1.33 b | 4.19 ± 0.60 b | 1.48 ± 0.56 b | |||||
| 30 | 7.15 ± 2.09 c | 3.45 ± 0.77 c | 1.35 ± 0.52 b | |||||
| 40 | 4.35 ± 2.19 d | 1.52 ± 0.83 d | 0.74 ± 0.41 c | |||||
| Packaging modality | Cardboard Box | 8.56 ± 2.44 | 1.09 (0.339) | 4.07 ± 1.47 | 0.37 (0.693) | 1.57 ± 0.78 | 0.08 (0.921) | |
| PET Box | 8.22 ± 2.90 | 3.99 ± 1.57 | 1.56 ± 0.76 | |||||
| Biodegradable Bag | 8.36 ± 2.25 | 4.10 ± 1.40 | 1.54 ± 0.70 | |||||
| Interaction | 0 | Cardboard Box | 10.11 ± 1.37 | 1.25 (0.271) | 5.05 ± 1.10 | 0.29 (0.969) | 2.03 ± 0.74 | 0.48 (0.873) |
| 0 | PET Box | 10.11 ± 1.37 | 5.05 ± 1.10 | 2.03 ± 0.74 | ||||
| 0 | Biodegradable Bag | 10.11 ± 1.37 | 5.05 ± 1.10 | 2.03 ± 0.74 | ||||
| 10 | Cardboard Box | 8.39 ± 1.78 | 4.13 ± 0.63 | 1.21 ± 0.33 | ||||
| 10 | PET Box | 8.04 ± 1.17 | 4.24 ± 0.37 | 1.49 ± 0.48 | ||||
| 10 | Biodegradable Bag | 8.03 ± 1.00 | 4.20 ± 0.57 | 1.15 ± 0.15 | ||||
| 20 | Cardboard Box | 9.23 ± 1.18 | 4.25 ± 0.79 | 1.69 ± 0.81 | ||||
| 20 | PET Box | 9.22 ± 1.54 | 4.22 ± 0.40 | 1.27 ± 0.37 | ||||
| 20 | Biodegradable Bag | 8.13 ± 1.03 | 4.09 ± 0.60 | 1.47 ± 0.35 | ||||
| 30 | Cardboard Box | 7.17 ± 2.59 | 3.57 ± 0.66 | 1.32 ± 0.53 | ||||
| 30 | PET Box | 7.09 ± 2.41 | 3.14 ± 0.92 | 1.39 ± 0.66 | ||||
| 30 | Biodegradable Bag | 7.2 ± 1.31 | 3.63 ± 0.69 | 1.33 ± 0.40 | ||||
| 40 | Cardboard Box | 4.93 ± 1.71 | 1.51 ± 0.64 | 0.75 ± 0.51 | ||||
| 40 | PET Box | 3.1 ± 2.28 | 1.32 ± 1.11 | 0.70 ± 0.41 | ||||
| 40 | Biodegradable Bag | 5.01 ± 2.19 | 1.73 ± 0.72 | 0.78 ± 0.34 | ||||
| SST (°Brix) | AT (% Citric Acid) | |||||
|---|---|---|---|---|---|---|
| Factors and levels | Mean ± SD | F (p) | Mean ± SD | F (p) | ||
| Storage time (day) | 0 | 11.98 ± 1.10 a | 30.03 (0.000) | 0.03 ± 0.01 a | 3.53 (0.013) | |
| 10 | 14.31 ± 10.6 b | 0.03 ± 0.01 a | ||||
| 20 | 13.67 ± 1.41 b | 0.02 ± 0.01 a | ||||
| 30 | 13.75 ± 1.45 b | 0.02 ± 0.01 a | ||||
| 40 | 13.93 ± 1.46 b | 0.04 ± 0.01 a | ||||
| Packaging modality | Cardboard Box | 13.45 ± 1.64 a | 7.31 (0.001) | 0.03 ± 0.01 | 1.73 (0.189) | |
| PET Box | 12.8 ± 1.43 b | 0.02 ± 0.01 | ||||
| Biodegradable Bag | 13.06 ± 1.60 ab | 0.03 ± 0.01 | ||||
| Interaction | 0 | Cardboard Box | 11.98 ± 1.12 | 1.92 (0.059) | 0.02 ± 0.01 | 0.46 (0.877) |
| 0 | PET Box | 11.98 ± 1.12 | 0.02 ± 0.01 | |||
| 0 | Biodegradable Bag | 11.98 ± 1.12 | 0.02 ± 0.01 | |||
| 10 | Cardboard Box | 14.94 ± 0.82 | 0.03 ± 0.02 | |||
| 10 | PET Box | 13.48 ± 1.15 | 0.02 ± 0.01 | |||
| 10 | Biodegradable Bag | 14.49 ± 0.64 | 0.03 ± 0.02 | |||
| 20 | Cardboard Box | 14.19 ± 1.33 | 0.03 ± 0.02 | |||
| 20 | PET Box | 13.84 ± 0.96 | 0.02 ± 0.01 | |||
| 20 | Biodegradable Bag | 12.98 ± 1.70 | 0.03 ± 0.02 | |||
| 30 | Cardboard Box | 14.59 ± 1.07 | 0.03 ± 0.01 | |||
| 30 | PET Box | 12.76 ± 1.23 | 0.02 ± 0.02 | |||
| 30 | Biodegradable Bag | 13.9 ± 1.48 | 0.02 ± 0.01 | |||
| 40 | Cardboard Box | 14.34 ± 0.76 | 0.04 ± 0.01 | |||
| 40 | PET Box | 13.48 ± 1.88 | 0.04 ± 0.01 | |||
| 40 | Biodegradable Bag | 13.96 ± 1.55 | 0.04 ± 0.00 | |||
| Phenolic Compounds (µg/mL) | Antioxidant Activity (%) | |||||
|---|---|---|---|---|---|---|
| Factors and levels | Mean ± SD | F (p) | Mean ± SD | F (p) | ||
| Storage time (day) | 0 | 266.04 ± 52.37 a | 73.99 (0.000) | 21.76 ± 17.17 a | 27.89 (0.000) | |
| 10 | 418.25 ± 56.88 b | 42.63 ± 4.99 b | ||||
| 20 | 508.10 ± 174.42 b | 48.46 ± 2.70 b | ||||
| 30 | 711.72 ± 181.42 c | 72.07 ± 4.14 c | ||||
| 40 | 702.71 ± 186.04 c | 52.45 ± 14.13 c | ||||
| Packaging modality | Cardboard Box | 426.44 ± 229.92 ab | 6.27 (0.004) | 35.28 ± 20.79 | 1.2 (0.309) | |
| PET Box | 408.71 ± 189.32 a | 41.46 ± 22.65 | ||||
| Biodegradable Bag | 472.38 ± 229.66 b | 40.49 ± 22.63 | ||||
| Interaction | 0 | Cardboard Box | 266.04 ± 54.51 a | 8.14 (0.000) | 21.76 ± 17.87 | 0.69 (0.698) |
| 0 | PET Box | 266.04 ± 54.51 a | 21.76 ± 17.87 | |||
| 0 | Biodegradable Bag | 266.04 ± 54.51 a | 21.76 ± 17.87 | |||
| 10 | Cardboard Box | 393.99 ± 46.32 ab | 39.16 ± 7.56 | |||
| 10 | PET Box | 395.89 ± 42.53 ab | 44.36 ± 1.74 | |||
| 10 | Biodegradable Bag | 464.85 ± 64.01 b | 44.37 ± 3.54 | |||
| 20 | Cardboard Box | 393.21 ± 14.91 ab | 48.33 ± 4.67 | |||
| 20 | PET Box | 406.39 ± 34.40 ab | 47.76 ± 0.94 | |||
| 20 | Biodegradable Bag | 724.70 ± 120.81 cd | 49.28 ± 2.18 | |||
| 30 | Cardboard Box | 791.63 ± 61.80 cd | 73.03 ± 1.37 | |||
| 30 | PET Box | 549.77 ± 223.20 bc | 70.68 ± 7.29 | |||
| 30 | Biodegradable Bag | 820.41 ± 4.88 d | 72.82 ± 1.06 | |||
| 40 | Cardboard Box | 881.60 ± 10.31 d | 33.02 ± 1.36 | |||
| 40 | PET Box | 710.81 ± 187.43 cd | 62.15 ± 7.42 | |||
| 40 | Biodegradable Bag | 511.65 ± 9.84 bc | 57.33 ± 0.78 | |||
Disclaimer/Publisher’s Note: The statements, opinions and data contained in all publications are solely those of the individual author(s) and contributor(s) and not of MDPI and/or the editor(s). MDPI and/or the editor(s) disclaim responsibility for any injury to people or property resulting from any ideas, methods, instructions or products referred to in the content. |
© 2023 by the authors. Licensee MDPI, Basel, Switzerland. This article is an open access article distributed under the terms and conditions of the Creative Commons Attribution (CC BY) license (https://creativecommons.org/licenses/by/4.0/).
Share and Cite
Trindade, S.; Rouxinol, M.I.; Agulheiro-Santos, A.C. Opuntia ficus-indica L. Fruits Cold Storage Using Different Packaging Materials. Sustainability 2023, 15, 11334. https://doi.org/10.3390/su151411334
Trindade S, Rouxinol MI, Agulheiro-Santos AC. Opuntia ficus-indica L. Fruits Cold Storage Using Different Packaging Materials. Sustainability. 2023; 15(14):11334. https://doi.org/10.3390/su151411334
Chicago/Turabian StyleTrindade, Sofia, Maria Inês Rouxinol, and Ana Cristina Agulheiro-Santos. 2023. "Opuntia ficus-indica L. Fruits Cold Storage Using Different Packaging Materials" Sustainability 15, no. 14: 11334. https://doi.org/10.3390/su151411334