

Determination of Energy Consumption and Technical Efficiency of Cotton Farms in Türkiye

Agricultural Faculty, Department of Agricultural Economics, Kahramanmaras Sutcu Imam University, Kahramanmaras 46050, Türkiye
Sustainability 2023, 15(14), 11194; https://doi.org/10.3390/su151411194
Submission received: 29 June 2023
/
Revised: 14 July 2023
/
Accepted: 15 July 2023
/
Published: 18 July 2023
(This article belongs to the Topic Novel Studies in Agricultural Economics and Sustainable Farm Management)
Abstract
:This study aimed to examine the efficiency of cotton farms and the energy requirements of the input and output of cotton in Türkiye. Data were collected from 657 cotton farms, and the results showed that the energy input of machinery (28.69%) had the most significant share in the total energy input, followed by electricity (22.79%) and nitrogen (20.75%). The total energy consumption of cotton was 83,869.49 MJ ha−1. In cotton production, the energy use efficiency, energy productivity, specific energy, and net energy were measured to be 0.87, 0.07, 17.31, and −23,043.92 MJ per hectare. Cotton plants consumed more indirect energy (51.99%) than direct energy (48.01%) and more non-renewable energy (89.96%) than renewable energy (10.04%). According to the data envelopment analysis results, the average technical efficiency of cotton farms was 0.84. Inefficient farms can reduce their inputs by approximately 16% without reducing the amount of cotton production. Allocative efficiency, pure technical efficiency, and scale efficiency of cotton farms were determined at 0.570, 0.539, and 0.640, respectively. Human labour, machinery, diesel, nitrogen, and phosphate energy use should be reduced for inefficient farms to become more efficient.
1. Introduction
Energy is one of the most critical inputs for the continuity of agricultural production. Agriculture uses energy to operate machinery and equipment, apply chemicals like pesticides and fertilizers, and heat and cool farm buildings [1]. In recent years, with the increase in the world population, the demand for food has grown, significantly increasing the amount of energy used in agriculture [2]. Thus, researchers’ interest in using energy in agriculture has increased [3].
The efficient use of energy in agriculture is essential for ensuring agricultural sustainability [4]; however, using fossil fuels to increase efficiency in agricultural production plays a crucial role in increasing greenhouse gases [5,6]. Many researchers in different parts of the world have reported that the world is significantly affected by environmental pollution because of energy inputs used in agriculture [7,8,9,10,11]. Some countries with large surface measurements (China and the USA) have given importance to research reducing the use of fossil fuels used as energy sources in agricultural production [3,12,13]. Using energy in the right place and time will minimize environmental damage [14] and contribute to sustainable agricultural production [15]. Energy analysis is the first step in ensuring the most effective use of energy inputs in crop production [16]. Conducting energy analyses of agricultural products determines when, where, how, and why energy is used [16,17]. The information obtained from this analysis plays a vital role in reducing the production costs of farms [18].
Although the calculations related to energy use on the farm are complex [19], many studies have been carried out on this subject [20,21,22,23,24,25,26,27]. When analysing agricultural input/output energy ratios, caution is required. Determining the best management strategies for farm products is related to calculating energy input data and many other factors [28]. Cotton requires the highest energy input among annual plants in agricultural production [29].
Cotton, the most produced natural fibre in the world, is known for its wide usage area [30]. World cotton production is approximately 73.7 million tons. The top five countries with the highest cotton production are China (17.4 million tons), India (17.2 million tons), the USA (11.2 million tons), Brazil (5.7 million tons), and Pakistan (4.1 million tons). These five countries produce 75.4% of the total cotton. Türkiye, ranking seventh in world cotton production, provides 3.1% of world production [31]. Considering that cotton cultivation requires high energy inputs, it is necessary to conduct research to increase energy efficiency in production. Studies on energy consumption in cotton have been carried out in various countries [32,33,34,35,36,37,38,39,40,41,42]; however, no study has investigated farms’ energy consumption and efficiency in the five provinces with the highest cotton production in Türkiye. In recent years, with the mechanisation of cotton agriculture, the production style has changed; accordingly, the number of inputs used in the production area has also changed. Manual harvesting has been replaced almost entirely by machine harvesting. Therefore, there have been significant changes in energy use in cotton agriculture as of 2021. The use of fossil fuels has increased, especially with the spread of mechanisation in cotton production. In this context, energy consumption analysis can be a useful indicator to ensure sustainable agricultural production, as it contains information about how much fossil fuel is consumed in production [43].
It may be helpful to measure farm-level economic, technical, and allocative efficiency and its determinants to develop suitable policy measures that will allow cotton farms to increase productivity through improved efficiency [44]. Many studies have been conducted to calculate the efficiency of farms [44,45,46,47,48,49,50,51,52,53,54]. Technical efficiency analysis comes first among the methods used to measure the productivity of businesses [55]. Technical efficiency analyses (TEA) are often used to measure the contribution of production technology and agricultural inputs to production [51]. Many different methodologies have been proposed for measuring the TEAs of farms [56,57,58]. Data envelopment analysis is one of the most widely used analyses in this field [51].
This study examined the energy needs of inputs and outputs in cotton production. In addition, values for energy use efficiency, energy productivity, net energy, specific energy, direct energy, indirect energy, renewable energy, and non-renewable energy were all calculated. Finally, the efficiency of the farms was found by using data envelopment analysis.
2. Material and Methods
2.1. Study Area
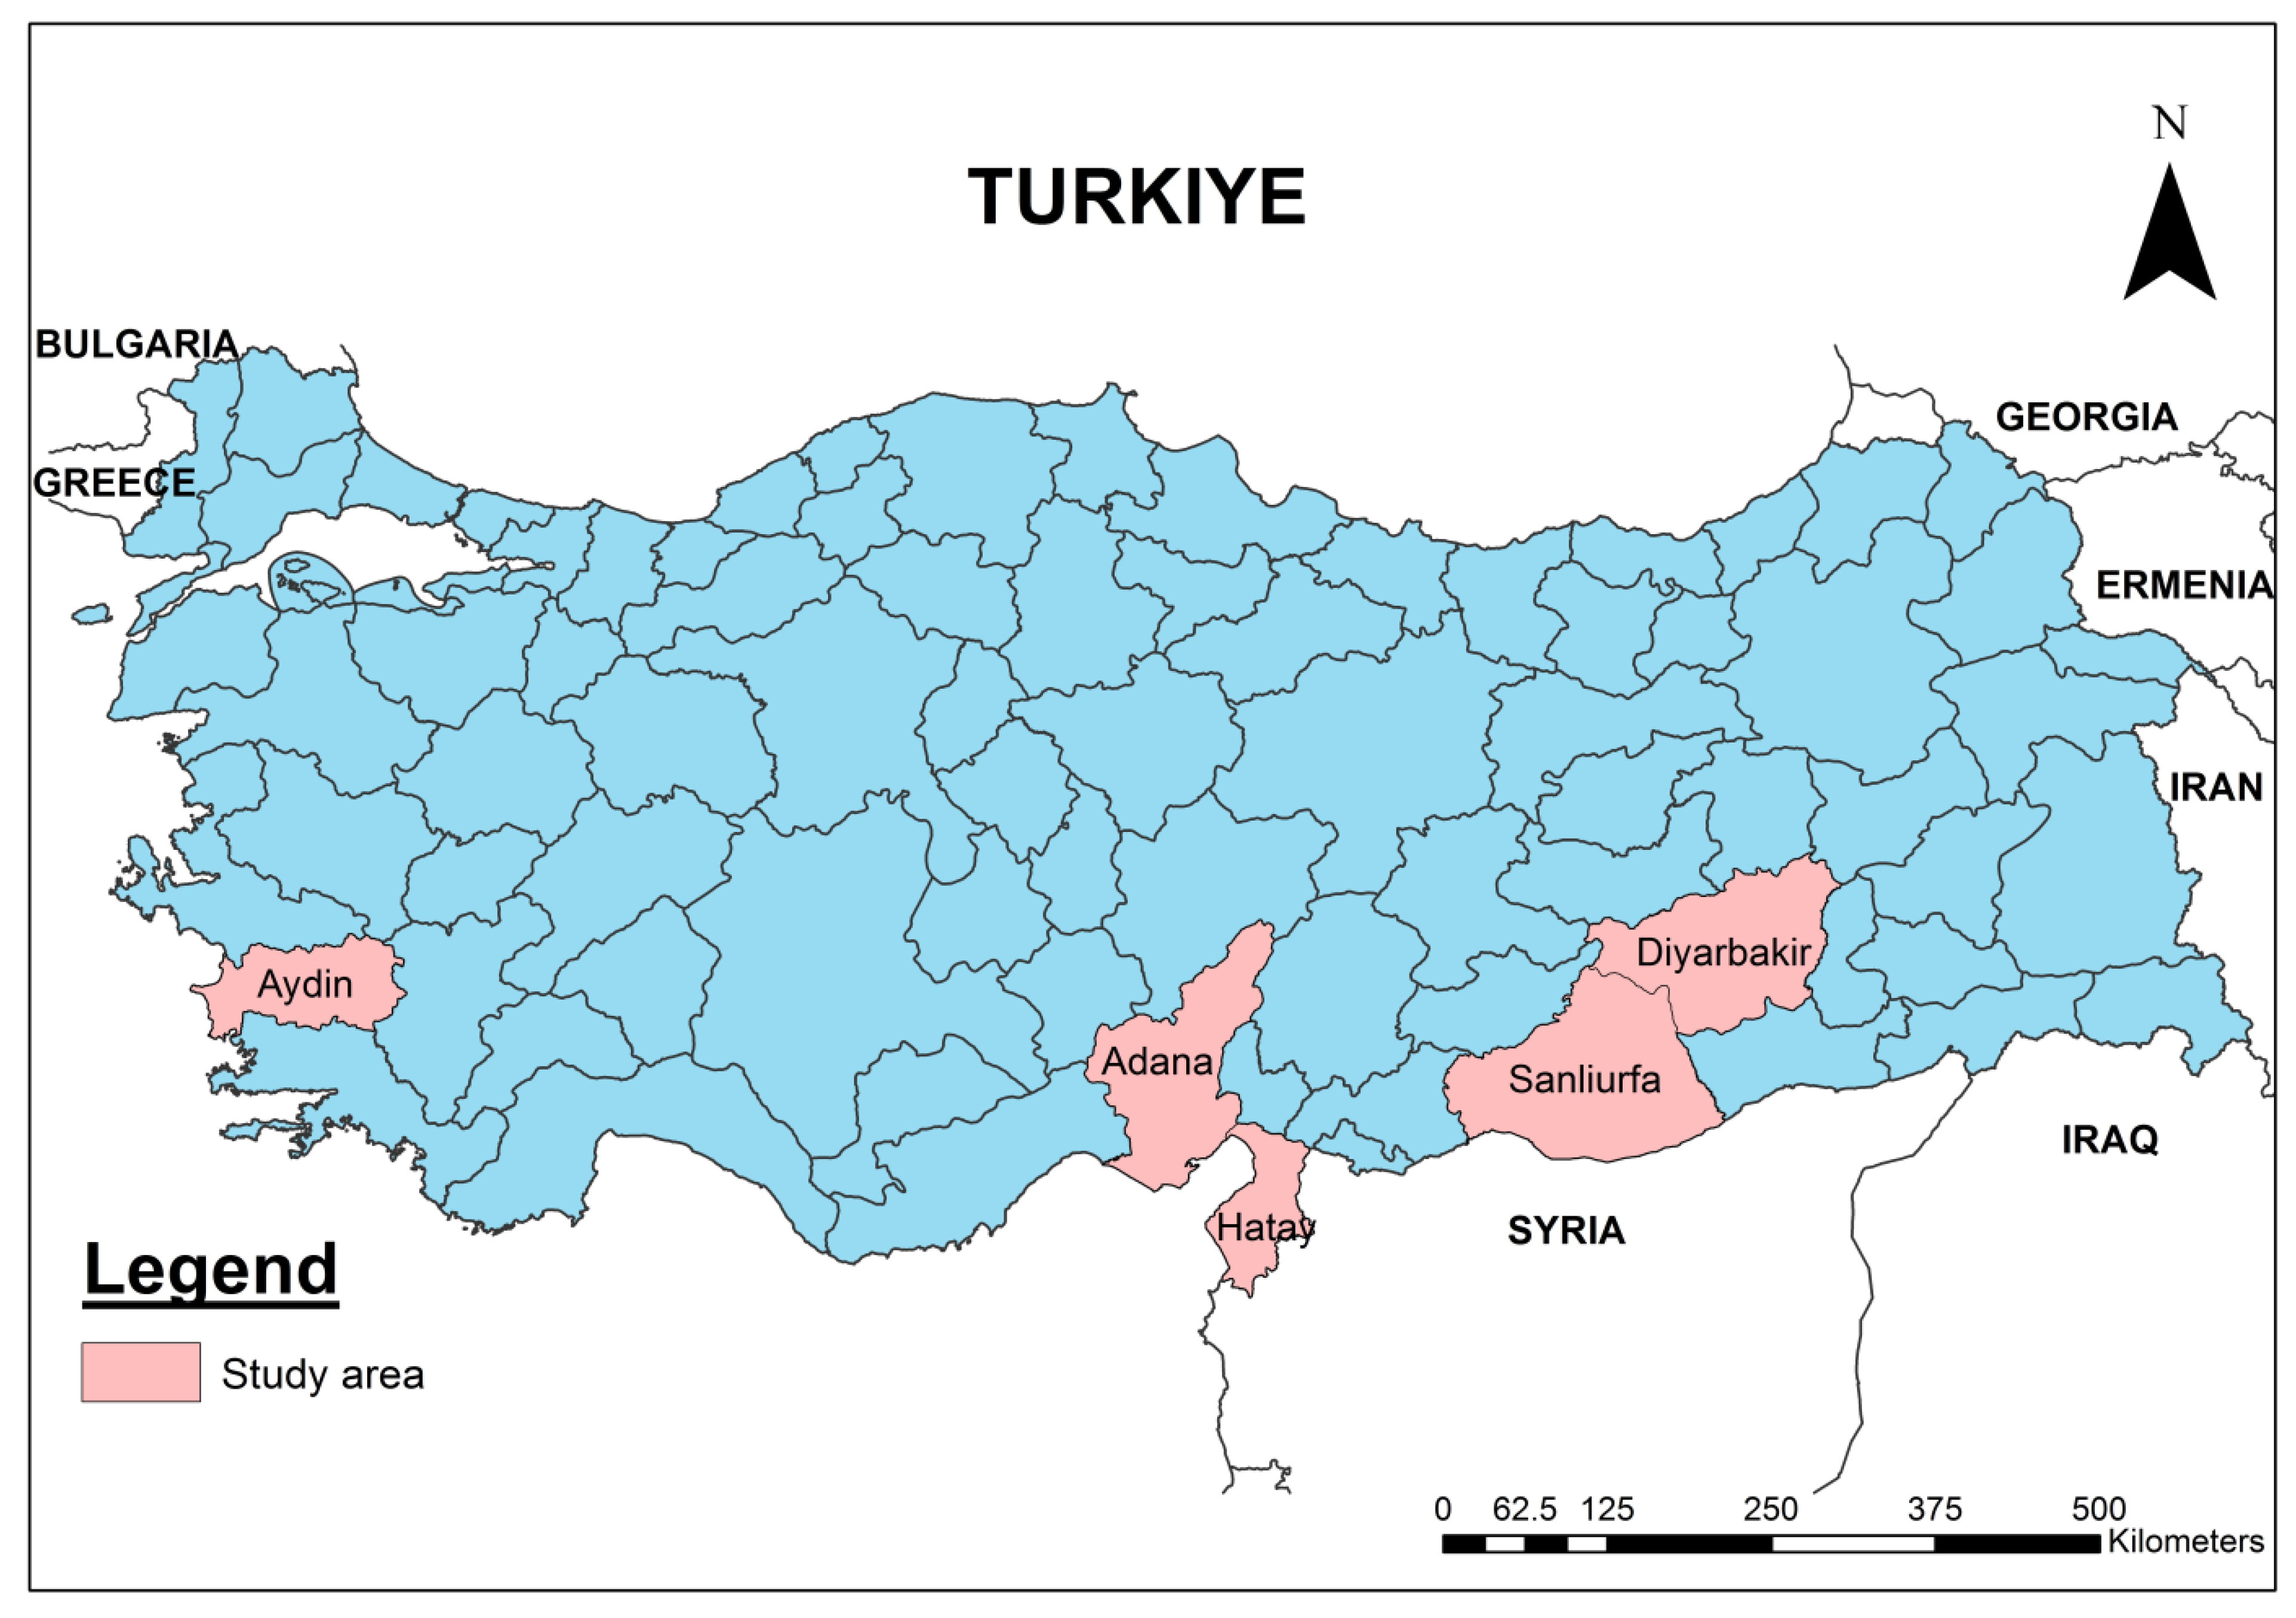
This study was conducted in the Sanliurfa, Aydin, Hatay, Diyarbakir, and Adana provinces, which account for 80% of the total cotton production in Türkiye (Figure 1). Sanliurfa province, located in the southeast of Türkiye, has a continental (terrestrial) climate; the summers are scorching and dry, and the winters are rainy and mild. The number of days with snow and frost is very few. Agricultural production is carried out on 56.2% of the province’s surface area and has 1.04 million decares of agricultural areas, constituting 4.45% of the total agricultural land in Türkiye. In this province, most of the agricultural land, accounting for 69.5%, is designated for producing cereals and other plant-based products. Additionally, 17.6% of the land is allocated for cotton production. Sanliurfa contains 42.4% of the cotton production in Türkiye. Diyarbakir province, located in the southeastern Anatolia region, has a flat structure in terms of landforms. It has a harsh continental climate, with hot and dry summers and cold and rainy winters. Along with the GAP project, many dams were built around Diyarbakir that contribute to the irrigation of agricultural areas. Diyarbakir contains 12.8% of the cotton production in Türkiye. In Aydin, where the Mediterranean climate dominates, summers are hot and dry, and winters are warm and rainy. Because it has a coast along the Aegean Sea, the warming effect of the sea and the winds that bring precipitation from the sea are dominant in the province. It is colder than the Mediterranean region due to northerly winds and the occasional snowfall. Aydin has 11.4% of the cotton production in Türkiye. Hatay has a bridge connecting Mesopotamia to the Mediterranean in the southern part of the country. The Mediterranean climate is dominant, with hot and dry summers and mild and rainy winters. Hatay agricultural production lands are about 54.7% of its total land area. The cotton production of Hatay meets around 9.1% of the total cotton production of Türkiye. The most important plain in the province is the Amik Plain, which is highly developed in agriculture. In Adana, influenced by the Mediterranean climate, the summers are hot and dry, and the winters are warm and rainy. Adana has 4.9 million decares of agricultural land. Seventy-three per cent of the Çukurova region is within the provincial borders of Adana, and it is very productive in agricultural production due to the alluvial soils carried by the Seyhan and Ceyhan rivers. Agricultural production is in 34.7% of the provincial area. The Adana province contains 5.1% of the cotton produced in Türkiye [59].
2.2. Sampling
The data used in this study were collected through face-to-face interviews with 657 cotton producers in the research region in the cotton production season of 2021 (Table 1). The sample number determined for the questionnaire was calculated with the proportional sampling method [60]. The sample size was calculated with a 99% confidence interval and a 5% margin of error (1):
where n is the sample size, N is the number of producers, σ2px is the variance of the ratio, and p is the ratio of cotton producers (p = 0.5 to reach the maximum sample size). The survey numbers are distributed proportionally to the number of producers in the provinces, as shown in Table 1.
The survey questions were prepared after focus group discussions with cotton farmers in five provinces. The survey questions included information regarding field preparation, seeds, use of machinery and equipment, irrigation, fertilization, pesticides, energy, harvesting, storage, and post-harvest transport.
2.3. Cotton Crop Management
Farmers in the study area use the triple rotation system in cotton production. They usually prepare the field for cotton planting after the wheat harvest. Forage crops are grown after cotton.
In soil preparation, firstly, crushing is performed with a crushing machine. This process happens between October and December. The first version with the plough and the second with the bottom boiler occurs in December. Following this, ploughing is performed with the cultivator from February to April before planting. Cotton is grown in the Çukurova region from late March to mid-April and in other areas from late April to May. Hand hoeing and tractor hoeing are performed between May and June to remove weeds. During the hoeing process, dilution also happens. The dilution and misfire processes occur between May and June when the cotton plants reach 10 centimetres in length to accelerate the plants’ development and maturation. One of the most critical applications to increase cotton yield is fertilization. This process happens between March and May. The second application is the spraying process between May and August [62]. In this study, they applied pesticides an average of 6.77 times. Cotton is a plant with a high need for water, and irrigation should be performed 4–5 times at intervals of 15–20 days between May and August. This study had an average of 6.34 irrigation. With the maturation of the cotton bolls, the harvest happens between September and November. Cotton is harvested by machine and by hand and then transported to ginning factories.
2.4. Energy Input–Output Analysis
Many studies have determined energy equivalents for various inputs. This study used equivalent energy inputs from related studies to calculate energy inputs for cotton production (Table 2). The energy consumed was calculated by multiplying the amount of input used by its energy equivalents. Energy productivity, energy use efficiency, specific energy, and net energy were calculated based on energy input and output.
The following formulas were used to calculate energy use efficiency (EUE), energy productivity (EP), net energy (NE), and specific energy (SE).
The ratio between energy output and input is EUE [65,66]. This process evaluated the system’s efficiency [67,68,69].
Specific energy (SE) is the ratio of the energy input consumed to the product yield [70,71]. The following equation helped calculate the SE:
Energy productivity (EP) is the ratio of the output consumed to energy input [72,73]. The following equation helped calculate the EP:
You find the net energy (NE) by subtracting the energy consumed in the input from the energy obtained from the output [69,72,73].
In addition, direct energy (human labour, diesel fuel, electricity, water), indirect energy (fertilisers, chemicals, machinery, seeds), renewable energy (human labour, seeds, water), and non-renewable energy (diesel fuel, electricity, chemicals, fertilisers, machinery) used in cotton production were calculated [35].
2.5. Data Envelopment Analysis (DEA)
Data from 657 farms were used to measure the efficiency of farms. In the research, data envelopment analysis (DEA), a non-parametric method, was used to measure the production efficiency of cotton farms. Because farms generally tend to control inputs, Farrell’s [74] input-oriented efficiency measures were used in this study.
The inputs (Xi) used in the model are seed (kg ha−1), N (kg ha−1), P (kg ha−1), irrigation (time), spraying (time), human labour (h ha−1), and machinery (h ha−1). It is assumed that cotton (yi) is produced using the Xi inputs. Therefore, a seven-input single-output model was created. The economic efficiency towards the input for each farm can be found by solving the following linear programming model:
In the equation, Wi is the vector of an input price; T is the transpose of function; and is the cost-minimizing vector of input quantities; the minimum cost of the input level, was calculated via linear programming for each farm. This equation shows the lowest cost to scale under constant returns.
The formula (EE) = / was used to calculate the economic efficiency of each farm. In other words, economic efficiency is the ratio of the lowest cost calculated under constant returns to scale to the observed cost for given input prices. The allocation efficiency was calculated with the formula AE = CE/TE [75]. The DEAP 2.1 program developed by Coelli [76] was used to estimate the efficiency measures. In comparison, for efficient and inefficient farms, farms with an efficiency coefficient between 0.90 and 1 were classified as efficient, and those lower than 0.90 were classified as ineffective [77]. The comparison of efficient and inefficient farms in terms of variables examined t-tests for continuous data.
3. Results and Discussion
3.1. Energy Consumption in Production
The quantity of input and output and total input and output energy (MJ ha−1) in cotton production is presented in Table 3. The total input energy used in cotton production was calculated at 83,869.49 MJ ha−1. Considering Türkiye, machinery had the highest share of energy consumption in cotton production (28.69%), followed by electricity (22.79%), nitrogen (20.75%), and diesel fuel (15.59%).
While producing cotton, a machine is needed at every stage, from planting preparation to harvest. Thanks to advanced machines, agricultural products are produced in a shorter time by consuming less energy [78]. In this study, the percentage of farmers harvesting cotton by machine was 91%. For this reason, machines are expected to have the highest use of energy in cotton farming.
Electrical energy is used in cotton production, tube well energizing, lighting, and irrigation. The use of electricity varies and mainly depends on the type of irrigation. Surface irrigation methods are generally used in cotton farming in Türkiye. When the drip irrigation method is used, electricity consumption will also decrease. This study stated that electrical energy consumed an average of 19110.11 MJ ha−1 for the cotton. Electricity use accounted for 22.79% of the total energy use in cotton production (Table 3). Another study stated that electricity (28%) consumed the most energy after fertilizer in cotton farming [34].
The use of chemical fertilizers has increased considerably in Türkiye, as well as in the world, to increase productivity. Previous researchers have reported that fertilizers account for most of the total energy input for cotton [35,36,37,40]. It was determined that 223.17 kg ha−1 fertilizer was used in cotton farming in Punjab [41], 120.8 kg ha−1 in Gorgan, and 164.61 kg ha−1 in Darab [40]. In the current study, the use of fertilizers was higher than in other countries. This result may be a way that cotton farmers resort to obtaining more products, or it may be due to the lack of knowledge about fertilization in cotton.
Chemicals are used in cotton production for plant growth and disease and pest control. In recent years, there has been an increase in diseases and pests in cotton fields. For this reason, pesticide applications have increased [79] in cotton farming areas. Herbicides are used in the control of narrow-leaved weeds in cotton production and in the fight against insects, such as aphids, green worms, and red spiders. Insecticides and plant growth regulators, including boll openers and defoliants, are used to ensure the homogeneous opening of maturing cotton bolls and the shedding of leaves. Chemicals covered 0.89% of energy consumption. Herbicides (380.59 MJ ha−1) were found to be the most energy-consuming of chemicals.
Diesel fuel is commonly used in cotton farming, from irrigation to fertilization to harvesting to processing. In the research area, 232.26 lt ha−1 of diesel was used during cotton cultivation. The energy value of this use was 13,078.52 MJ ha−1; the use of diesel accounted for 15.59% of the total energy consumption (Table 3). In a similar study, the average diesel fuel use per hectare in Pakistan was 78.35 lt ha−1 [41]. This result confirmed that using diesel fuel machines increased cotton farming in Türkiye.
In recent years, hand harvesting has left its place for machine harvesting in cotton production in Türkiye. The percentage of farmers harvesting cotton by hand was 9%. For this reason, it was expected that machines result in the highest use of energy in cotton farming. The energy output of cotton yield was 60,465.57 MJ ha−1. In other studies, the cotton energy output was calculated as 36,729 MJ ha−1, 95,800 MJ ha−1, 36,189 MJ ha−1, 36,882 MJ ha−1, 56,050 MJ ha−1, 33,314 MJ ha−1, and 65,984 MJ ha−1, respectively [35,36,38,39,40,41,42]. The average cotton yield in the study area was 5124.2 kg ha−1, higher than in other countries except for China [31]. In addition, the mechanization of cotton production in Türkiye in recent years has caused the output energy to be higher than in other studies [35,36,37,39].
In the study area, more furrow irrigation techniques were used in cotton farming. Sprinkler and drip irrigation systems were used less frequently [80]. Because of the less effective use of water consumption, drip and sprinkler irrigation methods consume less energy than furrow irrigation methods [81]. According to the study results, an average of 10,995.22 m3 ha−1 water was consumed in cotton production. The energy consumed for irrigation was 6926.99 MJ ha−1. It was 8.26% of the energy consumption in cotton agriculture (Table 3).
Intensive soil cultivation is carried out in cotton farming (ploughing, planting, hoeing, etc.). Rusu [82] and Lachuga [83] reported that tillage constitutes a significant part of energy costs. For this reason, in cotton farming, it is thought that energy consumption can be reduced by using minimal tillage methods (stubble sowing, tillage, seed sowing with a single tool, etc.) instead of traditional tillage.
3.2. Energy Indices of Cotton Production
Energy use efficiency, energy productivity, specific energy, and net energy in cotton production are presented in Table 4. The energy use efficiency of cotton production in Türkiye was calculated at 0.87. This value showed that the energy use in cotton farming is inefficient. Reducing agricultural inputs or increasing the cotton yield is necessary to increase energy efficiency [40]. This is supported by Yilmaz et al. [35], who stated that the EUE in cotton farms in the Antalya province of Türkiye was 0.74. Gokdogan et al. [39] reported that the EUE in cotton farms in the Aydin province of Türkiye was 1.92. The EUE of cotton farms in the Sanliurfa province of Türkiye was calculated at 2.52 [36] and 2.36 [37]. The main reason for this difference in results is that climatic conditions have an impact on energy use efficiency. In other studies, Khan et al. [84] in China, Zahedi et al. [38] in Isfahan, Kazemi et al. [40] in Darab, Kazemi et al. [40] in Gorgan, and Imran et al. [41] in Punjab calculated the energy use efficiency in cotton as 1.51, 0.70, 0.94, 1.11, and 0.70, respectively.
The energy productivity of cotton production in Türkiye was 0.07 kg MJ−1. According to this finding, 0.07 units of output were obtained per unit of energy. Previous studies have shown that the energy productivity of cotton production in Isfahan was 0.10 kg MJ−1 [38] and 0.04 in Punjab [41]. Kazemi et al. [40] reported that the energy productivity of cotton farms in Darab was 0.08 kg MJ−1 and 0.09 kg MJ−1 in Gorgan.
The specific energy was 17.31 MJ kg−1. This indicator was estimated at 12.53 MJ kg−1 for Darab and at 10.67 MJ kg−1 for Gorgan [40]. As for the rate of net energy, it was found to be −23,043.92 MJ ha−1. The negative value for net energy was also found by Zahedi et al. [38], Kazemi et al. [40], and Imran et al. [41] for cotton. Energy conservation in these fields can be improved by increasing energy efficiency and implementing new technologies. As long as the energy output per unit of energy input rises, net energy increases [40].
Total mean energy inputs as direct, indirect, renewable, and non-renewable are presented in Table 5. The results showed that cotton consumed more indirect energy (51.99%) than direct energy (48.01%). Similarly, Yilmaz et al. [35] and Zahedi et al. [38] found that cotton consumed more indirect energy than direct energy. However, Kazemi et al. [40] found the opposite result.
This study used human labour, seeds, and water as renewable energy sources. It was determined that renewable resources (10.04%) consumed less energy than non-renewable resources (89.96%). Yilmaz et al. [35] and Gokdogan et al. [39] also reported similar results. Because the energy consumption of renewable energy sources used in cotton production was low (Table 2), no significant energy savings are expected from these sources. However, considerable energy savings can be expected using non-renewable energy sources (machinery, diesel, nitrogen, etc.).
Information about the descriptive statistics of the variables used in the efficiency analysis is presented in Table 6. A seven-input and single-output model was created to measure the cotton production efficiency of farms with DEA. To obtain an average cotton yield of 5124.2 ha kg−1 of cotton during the cotton production season, an average of 29.16 kg ha−1 of seeds, 287.19 kg ha−1 of N, 95.84 kg ha−1 of P, 6.33 times of irrigation, 6.78 times of spraying, 585.94 h of labour, and 383.81 h of machine power are needed.
Economic, technical, allocation, scale, and pure technical efficiency values in cotton farms were estimated with DEA. The data obtained from the analysis are presented in Table 7. The economic efficiency in the examined cotton farms varied between 0.156 and 1, and the average was 0.479. According to the results, ineffective cotton farms should reduce their costs in the production process by approximately 52% to reach the level of effective cotton farms by producing in the minimum cost input composition. The main reason for the inefficiency in cotton farms was inadequate allocation efficiency. The allocation efficiency of the examined farms varied between 0.103 and 1, and the allocation efficiency coefficient was determined to be 0.570 on average. Cotton farms produced 43% more cost than the minimum cost input composition. This finding means that some cotton farms produce with the wrong input combination considering the current input prices and technology level.
The technical efficiency of cotton farms varied between 0.116 and 1, and the technical efficiency coefficient was determined to be 0.838 on average. This result shows that inefficient farms can reduce their inputs by approximately 16% without reducing cotton production. Pure technical efficiency and scale efficiency were used to determine the technical efficiency coefficient of the examined cotton farms, and they were determined to be 0.539 and 0.640, respectively. The main reason for the lack of technical efficiency in cotton farms was the technical inadequacy of cotton farmers’ agricultural knowledge and skills. Although most of the examined farms were of appropriate scale, they could not technically carry out their activities. According to the results of the scale efficiency analysis, 85.8% (564 farms) of the cotton farms in the research area had increasing returns to scale, and 7.9% of those (52 farms) had decreasing returns to scale. In comparison, the rate of cotton farms with fixed returns to scale was 6.3% (41 farms). Binici et al. [85], in their study of cotton farmers in the Harran Plain, determined that 70% of the farms were operated ineffectively. In similar research, technical efficiencies in cotton farms in the Hatay and Adana provinces ranged from 0.23 to 1.00, and the average technical efficiency was determined to be 0.79 [47]. This result indicates that there are some opportunities to increase resource use efficiency. For instance, they can reduce their input costs by 21% on average to produce the same yield in cotton farms [47]. Wei et al. [86] found the technical efficiency, economic efficiency, and allocation efficiency of cotton mills in Punjab to be 0.95, 0.66, and 0.70, respectively. In a study comparing the technical efficiency of irrigated and non-irrigated cotton producers, it was found that 80% of irrigated cotton producers are efficient, and 70% of non-irrigated cotton producers are efficient. Findings showed that in Texas, irrigated farms can reduce their expenditure on inputs by 10% on average while producing at the same level [45].
The energy consumption of technically efficient and inefficient farms is presented in Table 8. Farms with an efficiency coefficient of <0.90 were grouped as inefficient, and farms with ≥0.90 were grouped as efficient farms. For inefficient farms to be effective, energy consumption should be reduced in all other inputs except potassium. Statistically, for inefficient farms to become efficient farms, it is necessary to reduce the use of human labour, machinery, diesel fuel, nitrogen, and phosphate energy by 27.6%, 29.4%, 10%, 19%, and 32.6%, respectively (p < 0.01).
4. Conclusions
As a result of this study, it is seen that cotton farming requires high energy use (83,869.49 MJ ha−1), and most of the energy used is non-renewable energy, such as diesel fuel, electricity, chemicals, fertilizers, and machinery. In the research area, the energy use efficiency in cotton farming was found to be 0.87. According to economic efficiency findings, inefficient cotton farms should reduce their cost of production by approximately 52% to reach the level of cotton farms producing at the minimum cost input composition. Cotton farms generate 43% more costs than the minimum cost input composition. The technical efficiency coefficient was determined to be 0.838 on average.
Some suggestions have been presented to save energy in cotton production and to increase the efficiency of enterprises: (1) efforts to improve the energy use of cotton production in the surveyed area should focus on machinery, electricity, and nitrogen; (2) regarding water management, the wild irrigation method should be quit as soon as possible, and pressure irrigation methods should be selected; (3) the amount of fertilizer to be applied to the field should be determined by soil analysis.
This study provides researchers and relevant stakeholders with valuable data revealing the energy use in cotton production of Türkiye, one of the world’s largest cotton-producing countries. This study was carried out in three different regions of Türkiye. However, climatic conditions, soil characteristics, farmers’ sociodemographic characteristics, and business management structures differ between regions. Therefore, in future similar studies, it is recommended to examine the energy consumption of the regions separately to reveal the regional differences more clearly.
Funding
This study was supported by the Scientific and Technological Research Council of Türkiye (TUBITAK) (Project No: 220K068).
Institutional Review Board Statement
The study was conducted in accordance with the Declaration of Helsinki, and approved by the Ethics Committee of Kahramanmaras Sutcu Imam University Graduate School of Natural and Applied Sciences (protocol code: 92405296-108.01 and date of approval: 11 November 2019).
Informed Consent Statement
Informed consent was obtained from all subjects involved in the study.
Data Availability Statement
The data supporting this study’s findings are available from the corresponding author upon reasonable request.
Conflicts of Interest
The author declares no conflict of interest.
References
- Schnepf, R. Energy Use in Agriculture: Background and Issues; CRS Report for Congress; 2004. Available online: https://nationalaglawcenter.org/wp-content/uploads/assets/crs/RL32677.pdf (accessed on 15 March 2023).
- Tariq, G.H.; Ashraf, M.; Hasnain, U.S. Solar Technology in Agriculture, Technology in Agriculture; Ahmad, F., Sultan, M., Eds.; IntechOpen: London, UK, 2021. [Google Scholar] [CrossRef]
- Fu, X.; Niu, H. Key technologies and applications of agricultural energy internet for agricultural planting and fisheries industry. Inf. Process. Agric. 2022; in press. [Google Scholar] [CrossRef]
- Izadikhah, M.; Khoshroo, A. Energy management in crop production using a novel fuzzy data envelopment analysis model. RAIRO-Oper. Res. 2018, 52, 595–617. [Google Scholar] [CrossRef] [Green Version]
- Li, W.; Ou, Q.; Chen, Y. Decomposition of China’s CO2 emissions from agriculture utilizing an improved Kaya identity. Environ. Sci. Pollut. Res. 2014, 21, 13000–13006. [Google Scholar] [CrossRef] [PubMed]
- Liu, W.; Hussain, S.; Wu, L.; Qin, Z.; Li, X.; Lu, J.; Geng, M. Greenhouse gas emissions, soil quality, and crop productivity from a mono-rice cultivation system as influenced by fallow season straw management. Environ. Sci. Pollut. Res. 2016, 23, 315–328. [Google Scholar] [CrossRef]
- Ahmada, R.; Zulkiflib, S.A.M.; Hassanc, N.A.A.N.; Abdohd, W.M.Y.M. The impact of economic activities on CO2 emission. Int. Acad. Res. J. Soc. Sci. 2016, 2, 81–88. [Google Scholar]
- Tongwane, M.; Mdlambuzi, T.; Moeletsi, M.; Tsubo, M.; Mliswa, V.; Grootboom, L. Greenhouse gas emissions from different crop production and management practices in South Africa. Environ. Dev. 2016, 19, 23–35. [Google Scholar] [CrossRef] [Green Version]
- Khan, M.T.I.; Ali, Q.; Ashfaq, M. The nexus between greenhouse gas emission, electricity production, renewable energy and agriculture in Pakistan. Renew. Energy 2018, 118, 437–451. [Google Scholar] [CrossRef]
- Amjath-Babu, T.S.; Aggarwal, P.K.; Vermeulen, S. Climate action for food security in South Asia? Analyzing the role of agriculture in nationally determined contributions to the Paris agreement. Clim. Policy 2019, 19, 283–298. [Google Scholar] [CrossRef] [Green Version]
- Koondhar, M.A.; Li, H.; Wang, H.; Bold, S.; Kong, R. Looking back over the past two decades on the nexus between air pollution, energy consumption, and agricultural productivity in China: A qualitative analysis based on the ARDL bounds testing model. Environ. Sci. Pollut. Res. 2020, 27, 13575–13589. [Google Scholar] [CrossRef]
- Han, J.; Yang, Q.; Zhang, L. What are the priorities for improving the cleanliness of energy consumption in rural China? Urbanisation advancement or agriculture development? Energy Sustain. Dev. 2022, 70, 106–114. [Google Scholar] [CrossRef]
- American Farm Bureau Federation. Comprehensive US Energy Policy. 2023. Available online: https://www.fb.org/issue/energy (accessed on 13 July 2023).
- Yadav, G.S.; Lal, R.; Meena, R.S.; Datta, M.; Babu, S.; Das, A.; Saha, P. Energy budgeting for designing sustainable and environmentally clean/safer cropping systems for rainfed rice fallow lands in India. J. Clean. Prod. 2017, 158, 29–37. [Google Scholar] [CrossRef]
- Li, X.; Li, J.; Lu, J.; Xu, N.; Chen, C.; Min, X.; Zhu, J. Enhancement of interfacial solar vapor generation by environmental energy. Joule 2018, 2, 1331–1338. [Google Scholar] [CrossRef] [Green Version]
- Mohammadi, A.; Rafiee, S.; Mohtasebi, S.S.; Rafiee, H. Energy inputs-yield relationship and cost analysis of kiwifruit production in Iran. Renew. Energy 2010, 35, 1071–1075. [Google Scholar] [CrossRef]
- Elsoragaby, S.; Yahya, A.; Mahadi, M.R.; Nawi, N.M.; Mairghany, M. Energy utilization in major crop cultivation. Energy 2019, 173, 1285–1303. [Google Scholar] [CrossRef]
- Hatirli, S.A.; Ozkan, B.; Fert, C. Energy inputs and crop yield relationship in greenhouse tomato production. Renew. Energy 2006, 31, 427–438. [Google Scholar] [CrossRef]
- Yaldiz, O.; Ozturk, H.H.; Zeren, Y.; Bascetomcelik, A. Energy usage in production of field crops in Turkey. In Proceedings of the 5th International Congress on Mechanization and Energy Use in Agriculture, Kusadasi, Türkiye, 11–14 October 1993. [Google Scholar]
- Vural, H.; Efecan, I. An analysis of energy use and input costs for maize production in Turkey. J. Food Agric. Environ. 2012, 10 Pt 2, 613–616. [Google Scholar]
- Sánchez-Escobar, F.; Coq-Huelva, D.; Sanz-Cañada, J. Measurement of sustainable intensification by the integrated analysis of energy and economic flows: Case study of the olive-oil agricultural system of Estepa, Spain. J. Clean. Prod. 2018, 201, 463–470. [Google Scholar] [CrossRef]
- Oğuz, C.; Yener, A. The use of energy in milk production; a case study from Konya province of Turkey. Energy 2019, 183, 142–148. [Google Scholar] [CrossRef]
- Mostashari-Rad, F.; Nabavi-Pelesaraei, A.; Soheilifard, F.; Hosseini-Fashami, F.; Chau, K.W. Energy optimization and greenhouse gas emissions mitigation for agricultural and horticultural systems in Northern Iran. Energy 2019, 186, 115845. [Google Scholar] [CrossRef]
- Rao, N.D.; Poblete-Cazenave, M.; Bhalerao, R.; Davis, K.F.; Parkinson, S. Spatial analysis of energy use and GHG emissions from cereal production in India. Sci. Total Environ. 2019, 654, 841–849. [Google Scholar] [CrossRef]
- Fabiani, S.; Vanino, S.; Napoli, R.; Nino, P. Water energy food nexus approach for sustainability assessment at farm level: An experience from an intensive agricultural area in central Italy. Environ. Sci. Policy 2020, 104, 1–12. [Google Scholar] [CrossRef]
- Htwe, T.; Sinutok, S.; Chotikarn, P.; Amin, N.; Akhtaruzzaman, M.; Techato, K.; Hossain, T. Energy use efficiency and cost-benefits analysis of rice cultivation: A study on conventional and alternative methods in Myanmar. Energy 2021, 214, 119104. [Google Scholar] [CrossRef]
- Hrozencik, R.A.; Manning, D.T.; Suter, J.F.; Goemans, C. Impacts of block-rate energy pricing on groundwater demand in irrigated agriculture. Am. J. Agric. Econ. 2022, 104, 404–427. [Google Scholar] [CrossRef]
- Pimentel, D. CRC Handbook of Energy Utilization in Agriculture; CRC Press, Inc.: Boca Raton, FL, USA, 1980. [Google Scholar]
- Gerbens-Leenes, P.W.; Hoekstra, A.Y.; Van der Meer, T.H. The water footprint of energy from biomass: A quantitative assessment and consequences of an increasing share of bio-energy in energy supply. Ecol. Econ. 2009, 68, 1052–1060. [Google Scholar] [CrossRef]
- Bange, M.P.; Baker, J.T.; Bauer, P.J.; Broughton, K.J.; Constable, G.A.; Luo, Q.; Oosterhuis Osanai, Y.; Payton, P.; Tissue, D.T.; Reddy, K.R.; et al. Climate Change and Cotton Production in Modern Farming Systems; CABI: Wallingford, UK, 2016. [Google Scholar]
- FAOSTAT. Crops and Livestock Products. 2021. Available online: https://www.fao.org/faostat/en/#data/QCL (accessed on 1 December 2022).
- Tsatsarelis, C.A. Energy requirements for cotton production in central Greece. J. Agric. Eng. Res. 1991, 50, 239–246. [Google Scholar] [CrossRef]
- Singh, J.M. On Farm Energy Use Pattern in Different Cropping Systems in Haryana, India. Master’s Thesis, International Institute of Management, University of Flensburg, Flensburg, Germany, 2002. [Google Scholar]
- Singh, G.; Singh, S.; Singh, J. Optimization of energy inputs for wheat crop in Punjab. Energy Convers. Manag. 2004, 45, 453–465. [Google Scholar] [CrossRef]
- Yilmaz, I.; Akcaoz, H.; Ozkan, B. An analysis of energy use and input costs for cotton production in Turkey. Renew. Energy 2005, 30, 145–155. [Google Scholar] [CrossRef]
- Polat, R.; Copur, O.; Saglam, R.; Saglam, C. Energy use pattern and cost analysis of cotton agriculture: A case study for Sanliurfa, Turkey. Philipp. Agric. Sci. 2006, 89, 368–371. [Google Scholar]
- Dagistan, E.; Akcaoz, H.; Demirtas, B.; Yilmaz, Y. Energy usage and benefitcost analysis of cotton production in Turkey. Afr. J. Agric. Res. 2009, 4, 599–604. [Google Scholar]
- Zahedi, M.; Eshghizadeh, H.R.; Mondani, F. Energy use efficiency and economical analysis in cotton production system in an arid region: A case study for Isfahan province, Iran. Int. J. Energy Econ. Policy 2014, 4, 43–52. [Google Scholar]
- Gokdogan, O.; Erdogan, O.; Eralp, O.; Zeybek, A. Energy efficiency analysis of cotton production in Turkey: A case study from Aydin province. Fresenius Environ. Bull. 2016, 25, 4959–4964. [Google Scholar]
- Kazemi, H.; Shokrgozar, M.; Kamkar, B.; Soltani, A. Analysis of cotton production by energy indicators in two different climatic regions. J. Clean. Prod. 2018, 190, 729–736. [Google Scholar] [CrossRef]
- Imran, M.; Ozcatalbas, O.; Klahid, B. Estimation of energy efficiency and greenhouse gas emission of cotton crop in South Punjab, Pakistan. J. Saudi Soc. Agric. Sci. 2020, 19, 216–224. [Google Scholar] [CrossRef]
- Baran, M.F.; Gökdoğan, O.; Bayhan, Y. Determination of energy balance and greenhouse gas emissions (GHG) of cotton cultivation in Turkey: A case study from Bismil district of Diyarbakır province. Tekirdağ Ziraat Fakültesi Derg. 2021, 18, 322–332. [Google Scholar] [CrossRef]
- Wang, H.; Ren, H.; Han, K.; Li, G.; Zhang, L.; Zhao, Y.; Liu, P. Improving the net energy and energy utilization efficiency of maize production systems in the North China Plain. Energy 2023, 274, 127340. [Google Scholar] [CrossRef]
- Gunduz, O.; Ceyhan, V.; Esengun, K. Measuring the technical and economic efficiencies of the dry apricot farms in Turkey. J. Food Agric. Environ. 2011, 9, 319–324. [Google Scholar]
- Chakraborty, K.; Misra, S.; Johnson, P. Cotton farmers’ technical efficiency: Stochastic and nonstochastic production function approaches. Agric. Resour. Econ. Rev. 2002, 31, 211–220. [Google Scholar] [CrossRef] [Green Version]
- Bozoglu, M.; Ceyhan, V. Measuring the technical efficiency and exploring the inefficiency determinants of vegetable farms in Samsun province, Turkey. Agric. Syst. 2007, 94, 649–656. [Google Scholar] [CrossRef]
- Gul, M.; Koc, B.; Dagistan, E.; Akpinar, M.G.; Parlakay, O. Determination of technical efficiency in cotton growing farms in Turkey: A case study of Cukurova region. Afr. J. Agric. Res. 2009, 4, 944–949. [Google Scholar]
- Gunduz, O.; Sili, S.; Ceyhan, V. Farm level technical efficiency analysis and production costs in tomato growth: A case study from Turkey. Custos E Agronegocio 2016, 12, 26–38. [Google Scholar]
- Haq, U.S.; Ceyhan, V.; Boz, I.; Shahbaz, P. Effect of different crop management system on technical efficiency in sugarcane production in Faisalabad, Punjab region of Pakistan. J. Biol. Agric. Healthc. 2016, 6, 106–114. [Google Scholar]
- Turkten, H.; Yildirim, C.; Ceyhan, V.; Soytoprak, H. The effects of applying biological control measures in greenhouse cultivation on the production efficiency in Kaş district of Antalya province, Turkey. Eur. J. Sustain. Dev. 2017, 6, 1–10. [Google Scholar] [CrossRef]
- Moutinho, V.; Madaleno, M.; Macedo, P.; Robaina, M.; Marques, C. Efficiency in the European agricultural sector: Environment and resources. Environ. Sci. Pollut. Res. 2018, 25, 17927–17941. [Google Scholar] [CrossRef] [PubMed]
- Canan, S.; Ceyhan, V. The link between production efficiency and opportunity cost of protecting environment in TR83 region, Turkey. Environ. Sci. Pollut. Res. 2020, 27, 35112–35125. [Google Scholar] [CrossRef]
- Obi, A.; Ayodeji, B.T. Determinants of economic farm-size–efficiency relationship in smallholder maize farms in the Eastern Cape Province of South Africa. Agriculture 2020, 10, 98. [Google Scholar] [CrossRef] [Green Version]
- Yildirim, C.; Turkten, H.; Ulhaq, S.; Ceyhan, V. Effects of different types of labor hiring on economic performance and efficiency of farms in Kaş District of Antalya province, Turkey. J. Agric. Sci. Tech. 2022, 24, 247–259. [Google Scholar]
- Arita, S.; Leung, P. A technical efficiency analysis of Hawaii’s aquaculture industry. J. World Aquac. Soc. 2014, 45, 312–321. [Google Scholar] [CrossRef]
- Thiam, A.; Bravo-Ureta, B.E.; Rivas, T.E. Technical efficiency in developing country agriculture: A meta-analysis. Agric. Econ. 2001, 25, 235–243. [Google Scholar] [CrossRef]
- Dagar, V.; Khan, M.K.; Alvarado, R.; Usman, M.; Zakari, A.; Rehman, A.; Tillaguango, B. Variations in technical efficiency of farmers with distinct land size across agro-climatic zones: Evidence from India. J. Clean. Prod. 2021, 315, 128109. [Google Scholar] [CrossRef]
- Djuraeva, M.; Bobojonov, I.; Kuhn, L.; Glauben, T. The impact of agricultural extension type and form on technical efficiency under transition: An empirical assessment of wheat production in Uzbekistan. Econ. Anal. Policy 2023, 77, 203–221. [Google Scholar] [CrossRef]
- Turkstat. Turkish Statistical Institute, Agriculture. 2022. Available online: https://www.tuik.gov.tr/Home/Index (accessed on 10 December 2022).
- Newbold, P. Statistics for Business and Economics; Prentice-Hall International: Hoboken, NJ, USA, 1995; p. 867. [Google Scholar]
- TOB. Republic of Türkiye Ministry of Agriculture and Foresty. 2021. Available online: https://www.tarimorman.gov.tr/Sayfalar/EN/AnaSayfa.aspx (accessed on 10 December 2022).
- Aytop, Y.; Şahin, Z.; Akbay, C. Economic efficiency of cotton production in Turkey. Custos Agronegocio 2022, 18, 122. [Google Scholar]
- Ozkan, B.; Akcaoz, H.; Fert, C. Energy input–output analysis in Turkish agriculture. Renew. Energy 2004, 29, 39–51. [Google Scholar] [CrossRef]
- Canakci, M.; Topakci, M.; Akinci, I.; Ozmerzi, A. Energy use pattern of some field crops and vegetable production: Case study for Antalya Region, Turkey. Energy Convers. Manag. 2005, 46, 655–666. [Google Scholar] [CrossRef]
- Jones, M.R. Analysis of the use of energy in agriculture—Approaches and problems. Agric. Syst. 1989, 29, 339–355. [Google Scholar] [CrossRef]
- Kaur, N.; Vashist, K.K.; Brar, A.S. Energy and productivity analysis of maize based crop sequences compared to rice-wheat system under different moisture regimes. Energy 2021, 216, 119286. [Google Scholar] [CrossRef]
- Hülsbergen, K.J.; Feil, B.; Biermann, S.; Rathke, G.W.; Kalk, W.D.; Diepenbrock, W. A method of energy balancing in crop production and its application in a long-term fertilizer trial. Agriculture. Ecosyst. Environ. 2001, 86, 303–321. [Google Scholar] [CrossRef]
- Alluvione, F.; Moretti, B.; Sacco, D.; Grignani, C. EUE (energy use efficiency) of cropping systems for a sustainable agriculture. Energy 2011, 36, 4468–4481. [Google Scholar] [CrossRef]
- Macedo, I.; Terra, J.A.; Siri-Prieto, G.; Velazco, J.I.; Carrasco-Letelier, L. Rice-pasture agroecosystem intensification affects energy use efficiency. J. Clean. Prod. 2021, 278, 123771. [Google Scholar] [CrossRef]
- Ghorbani, R.; Mondani, F.; Amirmoradi, S.; Feizi, H.; Khorramdel, S.; Teimouri, M.; Aghel, H. A case study of energy use and economical analysis of irrigated and dryland wheat production systems. Appl. Energy 2011, 88, 283–288. [Google Scholar] [CrossRef]
- Ansari, M.A.; Saha, S.; Das, A.; Lal, R.; Das, B.; Choudhury, B.U.; Prakash, N. Energy and carbon budgeting of traditional land use change with groundnut based cropping system for environmental quality, resilient soil health and farmers income in eastern Indian Himalayas. J. Environ. Manag. 2021, 293, 112892. [Google Scholar] [CrossRef]
- Mandal, K.G.; Saha, K.P.; Ghosh, P.K.; Hati, K.M.; Bandyopadhyay, K.K. Bioenergy and economic analysis of soybean-based crop production systems in central India. Biomass Bioenergy 2002, 23, 337–345. [Google Scholar] [CrossRef]
- Mohammadi, A.; Omid, M. Economical analysis and relation between energy inputs and yield of greenhouse cucumber production in Iran. Appl. Energy 2010, 87, 191–196. [Google Scholar] [CrossRef]
- Farrell, M.J. The Measurement of Productive Efficiency. J. R. Stat. Soc. Assoc. 1957, 120, 253–281. [Google Scholar] [CrossRef]
- Coelli, T.; Rao, D.S.P.; Battese, G.E. An Introduction to Efficiency and Productivity Analysis; Kluwer Academic Publishers: Boston, MA, USA, 1998. [Google Scholar]
- Coelli, T. A Guide to DEAP Version 2.1: A Data Envelopment Analysis (Computer) Program, Cepa Working Paper 96/08; Department of Econometrics, University of New England: Armidale, Australia, 1996. [Google Scholar]
- Charnes, A.; Cooper, W.W.; Rhodes, E. Measuring the efficiency of decision making units. Eur. J. Oper. Res. 1978, 2, 429–444. [Google Scholar] [CrossRef]
- Schmer, M.R.; Vogel, K.P.; Mitchell, R.B.; Perrin, R.K. Net energy of cellulosic ethanol from switchgrass. Proc. Natl. Acad. Sci. USA 2008, 105, 464–469. [Google Scholar] [CrossRef] [PubMed]
- Memiş, S.; Özpınar, A. Manisa ili pamuk üreticilerinin bitki koruma uygulamaları. J. Adv. Res. Nat. Appl. Sci. 2021, 7, 60–70. [Google Scholar]
- Ibragimov, N.; Evett, S.R.; Esanbekov, Y.; Kamilov, B.S.; Mirzaev, L.; Lamers, J.P. Water use efficiency of irrigated cotton in Uzbekistan under drip and furrow irrigation. Agric. Water Manag. 2007, 90, 112–120. [Google Scholar] [CrossRef]
- Tagar, A.; Chandio, F.A.; Mari, I.A.; Wagan, B. Comparative Study of Drip and Furrow Irrigation Methods at Farmers Field in Umarkot. Int. J. Agric. Biosyst. Eng. 2012, 6, 788–792. [Google Scholar]
- Rusu, T. Energy efficiency and soil conservation in conventional, minimum tillage and no-tillage. Int. Soil Water Conserv. Res. 2014, 2, 42–49. [Google Scholar] [CrossRef] [Green Version]
- Lachuga, Y.; Akhalaya, B.; Shogenov, Y.; Meskhi, B.; Rudoy, D.; Olshevskaya, A. Energy-saving tillage with a combined unit with universal working bodies. In IOP Conference Series: Materials Science and Engineering; IOP Publishing: Tokyo, Japan, 2020; Volume 1001, p. 012121. [Google Scholar] [CrossRef]
- Khan, M.A.; Khan, S.; Mushtaq, S. Energy and economic efficiency analysis of rice and cotton production in China. Sarhad J. Agric. 2009, 25, 291–300. [Google Scholar]
- Binici, T.; Zulauf, C.R.; Kacira, O.O.; Karli, B. Assessing the efficiency of cotton production on the Harran Plain, Turkey. Outlook Agric. 2006, 35, 227–232. [Google Scholar] [CrossRef]
- Wei, W.; Mushtaq, Z.; Ikram, A.; Faisal, M.; Wan-Li, Z.; Ahmad, M.I. Estimating the economic viability of cotton growers in Punjab Province, Pakistan. Sage Open 2020, 10, 2158244020929310. [Google Scholar] [CrossRef]
Figure 1.
Study area location map.


Table 1.
Distribution of surveys.
| Region | Province | Number of Farmers | Number of Farmers Surveyed |
|---|---|---|---|
| Southeastern Anatolia | Sanliurfa | 28,613 | 377 |
| Aegean | Aydin | 8078 | 106 |
| Mediterranean | Hatay | 6142 | 81 |
| Southeastern Anatolia | Diyarbakir | 3660 | 48 |
| Mediterranean | Adana | 3396 | 45 |
| Total | 49,889 | 657 | |
Reference: [61].
Table 2.
Energy equivalents of inputs and outputs.
| Unit | Energy Equivalent (MJ Unit−1) | References | |
|---|---|---|---|
| A. Inputs | |||
| 1. Human labour | h | 1.96 | [19,35,41] |
| 2. Machinery | h | 62.70 | [33,40,63] |
| 3. Diesel fuel | L | 56.31 | [63] |
| 4. Fertilizers | |||
| (a) Nitrogen | kg | 60.60 | [33] |
| (b) Phosphate | kg | 11.10 | [33] |
| (c) Potassium | kg | 6.70 | [33] |
| 5. Chemicals | |||
| (a) Herbicides | kg | 238.00 | [33,35,64] |
| (b) İnsektisit | kg | 101.20 | [33,35,64] |
| (c) Defoliant | kg | 101.20 | [33,35,64] |
| 6. Electricity | kWh | 3.60 | [38] |
| 7. Water for irrigation | m3 | 0.63 | [19] |
| 8. Seed | kg | 11.80 | [33] |
| B. Outputs | |||
| 1. Cotton grain yield | kg | 11.80 | [33] |
Table 3.
Energy consumption of cotton.
| Unit | Energy Equivalent (MJ Unit−1) | Input Used per Hectare | Energy Value | Ratio (%) | |
|---|---|---|---|---|---|
| (Unit ha−1) | |||||
| A. Inputs | |||||
| 1. Human labour | h | 1.96 | 585.94 | 1148.44 | 1.37 |
| 2. Machinery | h | 62.7 | 383.81 | 24,064.88 | 28.69 |
| 3. Diesel fuel | L | 56.31 | 232.26 | 13,078.52 | 15.59 |
| 4. Fertilizers | 22.05 | ||||
| (a) Nitrogen | kg | 60.6 | 287.19 | 17,403.77 | 20.75 |
| (b) Phosphate | kg | 11.1 | 95.84 | 1063.79 | 1.27 |
| (c) Potassium | kg | 6.7 | 3.48 | 23.31 | 0.03 |
| 5. Chemicals | 0.84 | ||||
| (a) Herbicides | kg | 238.0 | 1.6 | 380.59 | 0.45 |
| (b) İnsektisit | kg | 101.2 | 2.07 | 209.10 | 0.25 |
| (c) Defoliant | kg | 101.2 | 1.15 | 116.38 | 0.14 |
| 6. Electricity | kWh | 3.6 | 5308.36 | 19,110.11 | 22.79 |
| 7. Water for irrigation | m3 | 0.63 | 10,995.22 | 6926.99 | 8.26 |
| 8. Seed | kg | 11.8 | 29.12 | 343.6 | 0.41 |
| Total inputs | 83,869.49 | 100.00 | |||
| B. Output | |||||
| 1. Cotton grain yield | kg | 11.8 | 5124.20 | 60,465.57 | 100.00 |
| Total output | 60,465.57 | 100.00 | |||
Table 4.
Energy indices of cotton production in Türkiye.
| Energy Indices | Mean |
|---|---|
| Energy use efficiency | 0.87 |
| Energy productivity (kg MJ−1) | 0.07 |
| Specific energy | 17.31 |
| Net energy (MJ ha−1) | −23,043.92 |
Table 5.
Total energy input in the form of direct, indirect, renewable, and non-renewable energy sources for cotton production in Türkiye (MJ ha−1).
Table 5.
Total energy input in the form of direct, indirect, renewable, and non-renewable energy sources for cotton production in Türkiye (MJ ha−1).
| MJ ha−1 | % | |
|---|---|---|
| Direct energy | 40,264.06 | 48.01 |
| Indirect energy | 43,605.43 | 51.99 |
| Renewable energy | 8419.03 | 10.04 |
| Non-renewable energy | 75,450.46 | 89.96 |
| Total input energy | 83,869.49 | 100.00 |
Table 6.
Descriptive statistics of the variables used in the efficiency analysis.
| Output and Inputs | Mean | Std. Dev. | Min | Max |
|---|---|---|---|---|
| Output | ||||
| Yield (kg ha−1) | 5124.20 | 962.56 | 1000.00 | 7800.00 |
| Inputs | ||||
| Seed (kg ha−1) | 29.16 | 5.47 | 10.00 | 6.00 |
| N (kg ha−1) | 287.19 | 90.99 | 0.01 | 934.00 |
| P (kg ha−1) | 95.84 | 56.94 | 0.01 | 330.00 |
| Irrigation (times ha−1) | 6.33 | 2.35 | 2.00 | 10.00 |
| Spraying (times ha−1) | 6.78 | 2.47 | 2.00 | 12.00 |
| Human labour (h ha−1) | 585.94 | 336.00 | 56.95 | 2748.90 |
| Machinery (h ha−1) | 383.81 | 214.04 | 36.95 | 2548.90 |
Table 7.
Efficiency analysis results of cotton farms.
| Efficiency | Mean | Std. Dvt. | Lower Limit | Upper Limit |
|---|---|---|---|---|
| Economic efficiency | 0.479 | 0.146 | 0.076 | 1.000 |
| Allocative efficiency | 0.570 | 0.141 | 0.103 | 1.000 |
| Technical efficiency | 0.838 | 0.116 | 0.572 | 1.000 |
| Scale efficiency | 0.640 | 0.297 | 0.003 | 1.000 |
| Pure technical efficiency | 0.539 | 0.275 | 0.002 | 1.000 |
Table 8.
The energy consumption of technically efficient and inefficient farms.
| Inefficient | Efficient | Difference | |||
|---|---|---|---|---|---|
| Mean | Std. Error | Mean | Std. Error | (%) | |
| A. Inputs | |||||
| 1. Human labour *** | 1233.28 | 32.37 | 966.59 | 38.54 | −27.59 |
| 2. Machinery *** | 25,941.11 | 692.61 | 20,043.11 | 627.58 | −29.43 |
| 3. Diesel fuel *** | 13,468.04 | 188.33 | 12,243.57 | 257.14 | −10.00 |
| 4. Fertilizers | |||||
| (a) Nitrogen *** | 18,336.09 | 257.78 | 15,405.30 | 352.89 | −19.02 |
| (b) Phosphate *** | 1154.01 | 26.72 | 870.42 | 49.75 | −32.58 |
| (c) Potassium | 22.55 | 3.81 | 24.96 | 5.90 | 9.66 |
| 5. Chemicals | |||||
| (a) Herbicides | 382.68 | 4.84 | 376.13 | 7.11 | −1.74 |
| (b) İnsektisit * | 210.01 | 1.33 | 207.15 | 0.98 | −1.38 |
| (c) Defoliant | 116.62 | 0.63 | 115.87 | 0.51 | −0.64 |
| 6. Electricity | 17,897.76 | 1382.50 | 21,708.85 | 2709.51 | 17.56 |
| 7. Water for irrigation *** | 7399.07 | 111.37 | 5915.07 | 205.98 | −25.09 |
| 8. Seed *** | 346.41 | 2.86 | 337.57 | 5.25 | −2.62 |
| Total inputs ** | 86,507.62 | 1870.60 | 78,214.57 | 3437.50 | −10.60 |
| B. Output | |||||
| 1. Cotton grain yield *** | 62,537.63 | 473.37 | 56,024.03 | 880.58 | −11.63 |
| Total output | 62,537.63 | 473.37 | 56,024.03 | 880.58 | −11.63 |
*** p < 0.01, ** p < 0.05, * p < 0.10.
Disclaimer/Publisher’s Note: The statements, opinions and data contained in all publications are solely those of the individual author(s) and contributor(s) and not of MDPI and/or the editor(s). MDPI and/or the editor(s) disclaim responsibility for any injury to people or property resulting from any ideas, methods, instructions or products referred to in the content. |
© 2023 by the author. Licensee MDPI, Basel, Switzerland. This article is an open access article distributed under the terms and conditions of the Creative Commons Attribution (CC BY) license (https://creativecommons.org/licenses/by/4.0/).
Share and Cite
MDPI and ACS Style
Aytop, Y. Determination of Energy Consumption and Technical Efficiency of Cotton Farms in Türkiye. Sustainability 2023, 15, 11194. https://doi.org/10.3390/su151411194
AMA Style
Aytop Y. Determination of Energy Consumption and Technical Efficiency of Cotton Farms in Türkiye. Sustainability. 2023; 15(14):11194. https://doi.org/10.3390/su151411194
Chicago/Turabian StyleAytop, Yeşim. 2023. "Determination of Energy Consumption and Technical Efficiency of Cotton Farms in Türkiye" Sustainability 15, no. 14: 11194. https://doi.org/10.3390/su151411194
Note that from the first issue of 2016, this journal uses article numbers instead of page numbers. See further details here.