
The Government’s Environmental Attention and the Sustainability of Environmental Protection Expenditure: Evidence from China

Abstract
:1. Introduction
- Is the Chinese provincial government’s environmental protection expenditure sustainable?
- Do fluctuations in government attention affect fluctuations in environmental protection expenditure?
- Does the relationship between fluctuations in government attention and environmental protection expenditures in provincial governments have heterogeneity?
2. Literature Review and Research Hypothesis
2.1. Government Attention
2.2. Budget Expenditure Sustainability
3. Methodology
3.1. Model Specification
3.2. Variables and Data Resource
3.2.1. Variables
3.2.2. Data Source
3.3. Descriptive Statistics
4. Empirical Results
4.1. Sustainability of Environmental Protection Expenditure
4.2. Benchmark Regression Results
4.3. Robustness Test
4.4. Moderating Effect Test of Government Fiscal Characteristic Variables
5. Conclusions
6. Prospects
Author Contributions
Funding
Institutional Review Board Statement
Informed Consent Statement
Data Availability Statement
Conflicts of Interest
References
- Wang, Q.; Tian, Y. Attention Changes of Chinese government Environmental Governance: Text analysis Based on the Government Work Reports of the State Council (1978–2021). J. Fujian Norm. Univ. 2021, 4, 74–84+170–171. [Google Scholar]
- Zhao, Y.; Zhang, X.; Wang, Y. Evaluating the effects of campaign-style environmental governance: Evidence from environmental protection interview in China. Environ. Sci. Pollut. Res. Int. 2020, 27, 28333–28347. [Google Scholar] [CrossRef] [PubMed]
- Sun, Y.; Guo, J. The operation process and genetic mechanism of Chinese campaign-style governance model: The case study of APEC blue. Am. J. Ind. Bus. Manag. 2017, 7, 372–385. [Google Scholar] [CrossRef] [Green Version]
- Luo, Z.; Hu, X.; Li, M.; Yang, J.; Wen, C. Centralization or decentralization of environmental governance—Evidence from China. Sustainability 2019, 11, 6938. [Google Scholar] [CrossRef] [Green Version]
- Wu, Z.D.; Zhang, C.M.; Li, Y.; Xu, C.; Wang, Y.; Chen, G. Environmental governance investment and Air Quality: Based on China’s provincial panel data. Front. Environ. Sci. 2022, 10, 977036. [Google Scholar] [CrossRef]
- Ocasio, W. Towards an attention-based view of the firm. Strateg. Manag. J. 1997, 18 (Suppl. S1), 187–206. [Google Scholar] [CrossRef]
- Simon, H.A. Designing Organizations for an Information-rich world. In Computers, Communication, and the Public Interest; Greenberger, M., Ed.; The Johns Hopkins Press: Baltimore, MD, USA, 1971; pp. 37–72. [Google Scholar]
- Jones, B.D.; Baumgartner, F.R.; Breunig, C.; Wlezien, C.; Soroka, S.; Foucault, M.; François, A.; Green-Pedersen, C.; Koski, C.; John, P.; et al. A general empirical law of public budgets: A comparative analysis. Am. J. Politi. Sci. 2009, 53, 855–873. [Google Scholar] [CrossRef]
- Simon, H.A. Administrative Behavior: A Study of Decision-Making Processes in Administrative Organizations; The Free Press: New York, NY, USA, 1947; p. 37. [Google Scholar]
- Baumgartner, F.R.; Jones, B.D. Agendas and Stability in American Politics; University of Chicago Press: Chicago, IL, USA, 1993; p. 23. [Google Scholar]
- Froio, C.; Bevan, S.; Jennings, W. Party mandates and the politics of attention: Party platforms, public priorities and the policy agenda in Britain. Party Politics 2017, 23, 692–703. [Google Scholar] [CrossRef] [Green Version]
- Howlett, M. Issue-Attention and Punctuated Equilibria Models Reconsidered: An Empirical Examination of the Dynamics of Agenda-Setting in Canada. J. Polit. Sci. Rev. Can. Sci. Polit. 1997, 30, 3–29. [Google Scholar] [CrossRef]
- Tao, P.; Christensen, T.; Liu, Y.; Chu, C. Power Structure, Issue Priorities and Attention Dynamics of Leaders from 2001 to 2017 in China. Public Organ. Rev. 2023, 23, 1–18. [Google Scholar] [CrossRef]
- Mortensen, P.B. Political attention and public spending in the United States. Policy Stud. J. 2009, 37, 435–455. [Google Scholar] [CrossRef]
- Jennings, W.; John, P. The dynamics of political attention: Public opinion and the Queen’s speech in the United Kingdom. Am. J. Polit. Sci. 2009, 53, 838–854. [Google Scholar] [CrossRef]
- Sagarzazu, I.; Klüver, H. Where Have All the Leaders Gone? Evaluating the Dynamics of Parties’ Issue Attention in Coalition Governments. Soc. Sci. Q. 2017, 98, 1045–1060. [Google Scholar] [CrossRef] [Green Version]
- Shi, C.; Shi, Q.; Guo, F. Environmental Slogans and Action: The Rhetoric of Local Government Work Reports in China. J. Clean. Prod. 2019, 238, 117886. [Google Scholar] [CrossRef]
- Jones, B.D.; Baumgartner, F.R. A model of choice for public policy. J. Public Adm. Res. Theory 2005, 15, 325–351. [Google Scholar] [CrossRef] [Green Version]
- Jordan, M.M. Punctuations and agendas: A new look at Local Government budget expenditures. J. Policy Anal. Manag. 2003, 22, 345–360. [Google Scholar] [CrossRef]
- Mortensen, P.B. Policy punctuations in Danish local budgeting. Public Adm. 2005, 83, 931–950. [Google Scholar] [CrossRef]
- Li, T.; Feiock, R.C. Explaining state budget punctuations: Policy transparency, political institutions, and electoral incentives. Policy Stud. J. 2020, 48, 926–952. [Google Scholar] [CrossRef]
- Ryu, J.E. Exploring the factors for budget stability and punctuations: A preliminary analysis of state government sub-functional expenditures. Policy Stud. J. 2009, 37, 457–473. [Google Scholar] [CrossRef]
- Robinson, S.E. Punctuated equilibrium, bureaucratization, and budgetary changes in schools. Policy Stud. J. 2004, 32, 25–39. [Google Scholar] [CrossRef]
- Flink, C.M. Rethinking punctuated equilibrium theory: A public administration approach to budgetary changes. Policy Stud. J. 2017, 45, 101–120. [Google Scholar] [CrossRef]
- Breunig, C.; Koski, C. Punctuated equilibria and budgets in the American states. Policy Stud. J. 2006, 34, 363–379. [Google Scholar] [CrossRef]
- Breunig, C. The more things change, the more things stay the same: A comparative analysis of budget punctuations. J. Eur. Public Policy 2006, 13, 1069–1085. [Google Scholar] [CrossRef]
- Baumgartner, F.R.; Foucault, M.; François, A. Punctuated equilibrium in French budgeting processes. J. Eur. Public Policy 2006, 13, 1086–1103. [Google Scholar] [CrossRef] [Green Version]
- Martin, M.H.; Streams, M. Punctuated equilibrium theory: An empirical investigation of its relevance for global health expenditure. Public Budg. Financ. 2015, 35, 73–94. [Google Scholar] [CrossRef]
- Sebók, M.; Berki, T. Incrementalism and punctuated equilibrium in Hungarian budgeting (1991–2013). J. Public Budg. Account. Financ. Manag. 2017, 29, 151–180. [Google Scholar] [CrossRef]
- Sebők, M.; Berki, T. Punctuated equilibrium in democracy and autocracy: An analysis of Hungarian budgeting between 1868 and 2013. Eur. Polit. Sci. Rev. 2018, 10, 589–611. [Google Scholar] [CrossRef]
- Van den Dool, A.; Li, J. What do we know about the punctuated equilibrium theory in China? A systematic review and research priorities. Policy Stud. J. 2023, 51, 283–305. [Google Scholar] [CrossRef]
- Yao, D.; Yan, W.; Zhu, Y. Budget structure discontinuity: Unveiling mechanism and connecting logic in China’s context. J. Chin. Polit. Sci. 2021, 26, 393–417. [Google Scholar] [CrossRef]
- Lam, W.F.; Chan, K.N. How authoritarianism intensifies punctuated equilibrium: The dynamics of policy attention in Hong Kong. Governance 2015, 28, 549–570. [Google Scholar] [CrossRef]
- Li, W. Does China’s Budget Change Follow Punctuated-Equilibrium logics?—Evidence from China’s Budget Data of 2007–2019. J. Public Adm. 2019, 12, 12–27 + 211. [Google Scholar]
- Lampton, D.M. Chinese politics: The bargaining treadmill. Issues Stud. 1987, 23, 11–41. [Google Scholar]
- Huang, S.; Ding, Y.; Failler, P. Does the Government’s Environmental Attention Affect Ambient Pollution? Empirical Research on Chinese Cities. Sustainability 2022, 14, 3242. [Google Scholar] [CrossRef]
- Akai, N.; Sakata, M. Fiscal decentralization contributes to economic growth: Evidence from state-level cross-section data for the United States. J. Urban Econ. 2002, 52, 93–108. [Google Scholar] [CrossRef]
- Hartley, T.; Russet, B. Public opinion and the common defense: Who governs military spending in the United States? Am. Polit. Sci. Rev. 1992, 86, 905–915. [Google Scholar] [CrossRef]
- Jones, B.D.; Baumgartner, F.R.; True, J.L. Policy punctuations: U.S. budget authority, 1947–1995. J. Polit. 1998, 60, 1–33. [Google Scholar] [CrossRef] [Green Version]
- Lin, J.Y.; Liu, Z. Fiscal decentralization and economic growth in China. Econ. Dev. Cult. Change 2000, 49, 1–21. [Google Scholar] [CrossRef]
- Esteller-Moré, A.; Otero, J.P. Fiscal transparency: Why does your Local Government respond? Public Manag. Rev. 2012, 14, 1153–1173. [Google Scholar] [CrossRef]


| Variable Name | Obs. | Mean | Std. Dev. | Min. | Max. |
|---|---|---|---|---|---|
| 300 | 0.004 | 0.168 | −0.365 | 0.761 | |
| 299 | 0.018 | 0.187 | −0.362 | 0.897 | |
| dpersug | 300 | 0.08 | 0.45 | −0.89 | 2.86 |
| FDecen | 300 | 0.999 | 0.419 | 0.536 | 2.366 |
| FPre | 300 | 7.33 | 0.664 | 5.476 | 8.665 |
| EIndust | 300 | 0.464 | 0.086 | 0.186 | 0.594 |
| FTrans | 300 | 3.422 | 0.438 | 2.639 | 4.353 |
| PUrban | 300 | 0.559 | 0.128 | 0.299 | 0.896 |
| PInc | 300 | 5.451 | 1.276 | 2.042 | 8.25 |
| PDen | 300 | 10.133 | 0.346 | 9.387 | 11.128 |
| Int | 300 | 6.892 | 1.023 | 3.492 | 9.006 |
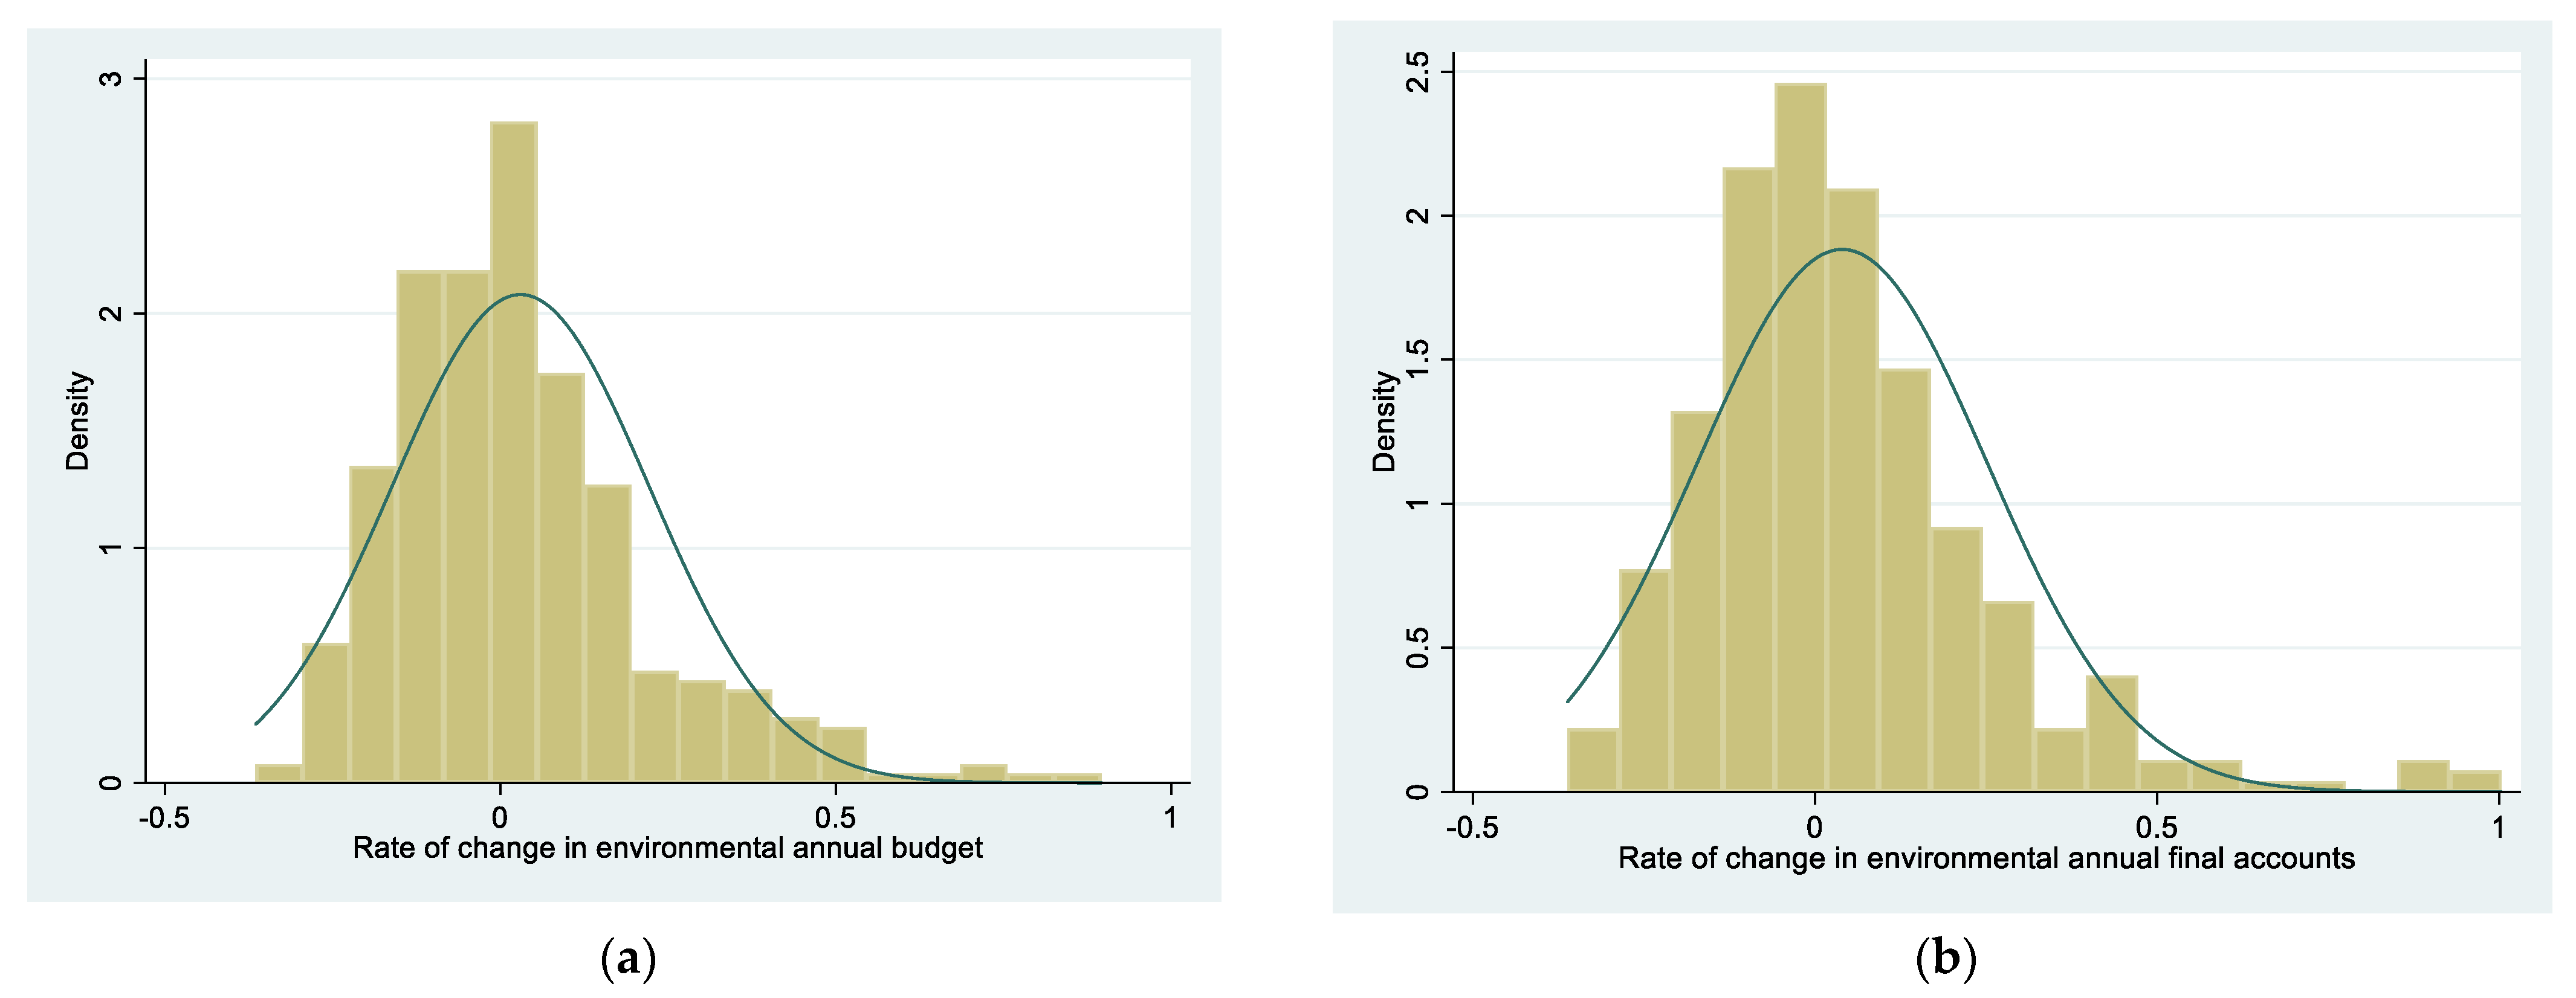
| CRE | Obs. | Mean | Std. Dev. | Kurtosis | Skewness | Shapiro–Wilk W | Shapiro–Francia W’ |
|---|---|---|---|---|---|---|---|
| CRE1 | 360 | 0.03 | 0.19 | 5.23 | 1.20 | 0.0000 *** | 0.0000 *** |
| CRE2 | 359 | 0.04 | 0.21 | 6.34 | 1.37 | 0.0000 *** | 0.0000 *** |
| (1) | (2) | (3) | (4) | (5) | (6) | |
|---|---|---|---|---|---|---|
| M1 | M2 | M3 | M4 | M5 | M6 | |
| dpersug | 0.0499 * | 0.0563 ** | 0.0531 ** | 0.0589 ** | 0.0578 ** | 0.0636 ** |
| (0.0246) | (0.0264) | (0.0238) | (0.0252) | (0.0253) | (0.0281) | |
| FDecen | 0.502 *** | 0.404 ** | 0.385 *** | 0.383 * | ||
| (0.101) | (0.166) | (0.137) | (0.191) | |||
| FPre | −0.310 *** | −0.146 * | −0.217 * | −0.144 * | ||
| (0.0798) | (0.0857) | (0.117) | (0.0770) | |||
| FTrans | −0.0245 | 0.0232 | ||||
| (0.0316) | (0.0390) | |||||
| EIndust | −0.127 | 0.438 | ||||
| (0.344) | (0.404) | |||||
| PUrban | 1.095 | −1.295 | ||||
| (0.816) | (0.964) | |||||
| PDen | −0.560 | −0.902 * | ||||
| (0.376) | (0.456) | |||||
| PInc | −0.0763 | 0.157 | ||||
| (0.238) | (0.290) | |||||
| Int | 0.0600 | 0.125 | ||||
| (0.0855) | (0.0894) | |||||
| Province | Yes | Yes | Yes | Yes | Yes | Yes |
| Year | Yes | Yes | Yes | Yes | Yes | Yes |
| Constant | −0.0154 | 0.0507 | 1.585 *** | 0.645 | 4.081 | 3.648 |
| (0.0343) | (0.0422) | (0.510) | (0.551) | (3.148) | (2.880) | |
| Obs. 1 | 296 | 295 | 296 | 295 | 296 | 295 |
| R-squared | 0.105 | 0.154 | 0.151 | 0.171 | 0.171 | 0.190 |
| (1) | (2) | (3) | (4) | (5) | (6) | |
|---|---|---|---|---|---|---|
| M7 | M8 | M9 | M10 | M11 | M12 | |
| dpersug | 0.0550 ** | 0.0573 ** | 0.0581 ** | 0.0649 ** | 0.0578 ** | 0.0636 ** |
| (0.0236) | (0.0277) | (0.0263) | (0.0282) | (0.0253) | (0.0281) | |
| Control variables | Yes | Yes | Yes | Yes | Yes | Yes |
| Province | Yes | Yes | Yes | Yes | Yes | Yes |
| Year | Yes | Yes | Yes | Yes | Yes | Yes |
| Constant | 7.302 ** | 2.737 | 4.638 | 4.695 | 4.081 | 3.648 |
| (3.157) | (3.858) | (3.061) | (2.878) | (3.148) | (2.880) | |
| Obs. | 256 | 256 | 296 | 295 | 296 | 295 |
| R-squared | 0.201 | 0.229 | 0.162 | 0.196 | 0.171 | 0.190 |
| (1) | (2) | (3) | (4) | (5) | (6) | |
|---|---|---|---|---|---|---|
| M13 | M14 | M15 | M16 | M17 | M18 | |
| dpersug | 0.0564 ** | 0.0601 ** | 0.0569 ** | 0.0551 ** | 0.0561 ** | 0.0626 * |
| (0.0249) | (0.0277) | (0.0264) | (0.0259) | (0.0254) | (0.0309) | |
| FDecen | 0.385 *** | 0.387 ** | 0.384 *** | 0.383 ** | 0.407 *** | 0.391 * |
| (0.137) | (0.175) | (0.137) | (0.174) | (0.136) | (0.193) | |
| FPre | −0.213 * | −0.136 | −0.217 * | −0.146 * | −0.231 * | −0.150 * |
| (0.122) | (0.0801) | (0.118) | (0.0788) | (0.114) | (0.0758) | |
| FTrans | −0.0247 | 0.0226 | −0.0244 | 0.0246 | −0.0217 | 0.0250 |
| (0.0317) | (0.0392) | (0.0314) | (0.0393) | (0.0313) | (0.0389) | |
| dpersug × FDecen | 0.0289 | 0.0713 | ||||
| (0.0546) | (0.0623) | |||||
| dpersug × Fpre | −0.00648 | −0.0614 | ||||
| (0.0497) | (0.0495) | |||||
| dpersug × Ftrans | 0.0911 ** | 0.0557 | ||||
| (0.0441) | (0.0522) | |||||
| Control variables | Yes | Yes | Yes | Yes | Yes | Yes |
| Province | Yes | Yes | Yes | Yes | Yes | Yes |
| Year | Yes | Yes | Yes | Yes | Yes | Yes |
| Constant | 4.283 | 4.148 | 4.138 | 4.196 | 4.122 | 3.667 |
| (3.007) | (2.625) | (3.180) | (2.807) | (3.242) | (2.931) | |
| Obs. | 296 | 295 | 296 | 295 | 296 | 295 |
| R-squared | 0.172 | 0.195 | 0.171 | 0.198 | 0.182 | 0.194 |
Disclaimer/Publisher’s Note: The statements, opinions and data contained in all publications are solely those of the individual author(s) and contributor(s) and not of MDPI and/or the editor(s). MDPI and/or the editor(s) disclaim responsibility for any injury to people or property resulting from any ideas, methods, instructions or products referred to in the content. |
© 2023 by the authors. Licensee MDPI, Basel, Switzerland. This article is an open access article distributed under the terms and conditions of the Creative Commons Attribution (CC BY) license (https://creativecommons.org/licenses/by/4.0/).
Share and Cite
Sun, J.; Hu, J.; Wang, H.; Shi, Y.; Wei, Z.; Cao, T. The Government’s Environmental Attention and the Sustainability of Environmental Protection Expenditure: Evidence from China. Sustainability 2023, 15, 11163. https://doi.org/10.3390/su151411163
Sun J, Hu J, Wang H, Shi Y, Wei Z, Cao T. The Government’s Environmental Attention and the Sustainability of Environmental Protection Expenditure: Evidence from China. Sustainability. 2023; 15(14):11163. https://doi.org/10.3390/su151411163
Chicago/Turabian StyleSun, Jing, Jienan Hu, Hongmei Wang, Yinfeng Shi, Ziru Wei, and Tangzhe Cao. 2023. "The Government’s Environmental Attention and the Sustainability of Environmental Protection Expenditure: Evidence from China" Sustainability 15, no. 14: 11163. https://doi.org/10.3390/su151411163