Article

Green Space at New Housing Estates: Flat Price Versus Accessibility to Good Quality Greenery

by
Magdalena Szczepańska
1,*,
Anna Gałecka-Drozda
2 and
Agnieszka Wilkaniec
2
1
Faculty of Human Geography and Planning, Adam Mickiewicz University in Poznań, 61-680 Poznań, Poland
2
Faculty of Agronomy, Horticulture and Bioengineering, Poznań University of Life Sciences, 60-995 Poznań, Poland
*
Author to whom correspondence should be addressed.
Sustainability 2023, 15(13), 9997; https://doi.org/10.3390/su15139997
Submission received: 30 May 2023 / Revised: 19 June 2023 / Accepted: 22 June 2023 / Published: 24 June 2023
(This article belongs to the Special Issue Urban Design for Sustainable Built Environment)

Abstract

:
Green areas positively affect human health. It applies in particular to greenery in a direct neighbourhood of the housing. We analysed new housing estates in Poznan, Poland. Greenery quality was assessed according to developed factors, based on data about the area of the greenery in comparison with the area covered by hardscapes within the site; pre-existing greenery inventories; new greenery inventories; green area functions and accessibility. In the second stage of research, we compared data about greenery quality to information concerning economic value of the statistic flat in the estate. The average area of greenery in relation to the area of the plot was 40.16% for prestigious investments and 41.62% for less prestigious ones. The median value of WU (‘Socialisation rate’ indicator designed for this research) for prestigious investments was 0.035 and for less prestigious investments it was 0.226. The research showed that the price of flats does not affect the quality of residential greenery. Less prestigious (cheaper) flats have the same or even better access and quality of greenery in the estate. Developers do not take actual actions in the field of environmental compensation, which leads to lowering of the quality of greenery and public space.

1. Introduction

Today, more than half of the world’s population lives in urban areas. By 2050, 75% of the human population is estimated to settle in cities. Urban green space (UGS) plays an important role in improving the quality and conditions of life in cities by providing a range of ecosystem services. Thus, UGS is an indispensable component of resilient and healthy cities. Nowadays, one of the most important driving forces in cities is developers, one of the actors responsible for shaping the city form [1], including open space between buildings. Thus, for some neighbourhoods, their role is decisive in whether the space is green and sustainable and adapts to climate change [2].
Many researchers focus on the social approach regarding place of living and access to urban vegetation. It has been proven that inequalities in this area are increasing. Studies conducted in the cities of the developed Global North show that populations with higher socio-economic status have greater access to ecosystem services provided by vegetation [3]. Statistical analysis of the socio-economic status of households and individuals shows differences in access to urban green space related to income, age, education and children in the household [4]. People living under different social conditions have different amounts of street greenery in their residential environment. Li et al. [5] indicate that higher-income people tend to live in areas with more street greenery. This problem was analysed at spatial microscales (i.e., urban blocks of flats, individual buildings) by Łaszkiewicz et al. [6] while studying residential segregation. Many studies on the differences in the UGS distribution focus on the area and temporal and spatial accessibility of designated formal open spaces (e.g., parks, forests, street greenery, squares). Meanwhile, the informal type of UGS is as important as the formal type and can contribute to better access to selected urban ecosystem services [7]. Studies in Mumbai and Jakarta found that neighbourhoods with lower land values had higher vegetation cover and density, mainly due to a large amount of undeveloped green space [8]. Inequalities in the availability of urban greenery are of a varied nature, depending on the type of greenery taken into account and the geographical location of the places where the research was carried out.
Many studies refer to the existing residential areas, focusing on their sustainability and spatial arrangement, combining data about greenery with buildings type, age and surroundings [9,10]. To date, little research has been devoted to differences in the availability and quality of residential greenery created as part of new housing developments and the relation between its quality and the price of housing. The observations so far allow us to conclude that greenery is integral to current promotional campaigns for new housing. More precisely, it is greenery inside the housing estate—mostly inaccessible to the urban community and available only to a selected few, i.e., those who have incurred extra costs for a ‘green view’ or ‘access to a garden, green terrace or roof’. This can be considered a manifestation of greenwashing [11] and capitalising on greenery or even creating exclusionary green enclaves. Referring to the above observation, it can be expected that more exclusive, more expensive residential complexes should offer more prestigious enclaves of greenery intended for their residents. However, the presentation of investments in advertising materials as green is not always associated with providing high-quality greenery. Our study proposes that even expensive housing does not necessarily have access to good quality green space, as the price is not a factor in making a housing estate greener. Residents may not have close and direct contact with good quality greenery despite the comparatively high price of the flat. Moreover, residual, seminatural, informal vegetation that can provide an alternative to amenity greenery is rapidly disappearing in developing cities due to strong urban pressure [12,13]. Given that the current UGS resource is being over-exploited, including in marketing strategies and naming of development projects, we believe that this is an opportune time to argue for the integration of greenery of newly developed housing estates into local housing policies and urban spatial planning. Although sufficient and equitable access to UGS is a key aspect of adequate living conditions and a healthy environment in urban areas, research on providing urban greenery at the household and housing unit level is scarce.
This study aimed to determine whether the quality and accessibility of greenery created as part of development projects increase with the prestige of the housing estate and the price of the flat. The area of greenery next to residential buildings partly results from the minimum requirements set by law, and above all, from the developer’s vision of the investment guided by the preferences of users and the profitability of the implemented solutions. This study reviewed the standards for greenery in multi-family housing developments. It also attempted to formulate indicators describing the quality of greenery. This study was conducted in Poznań, a large Polish city. It analysed 12 multi-family housing developments built between 2019 and 2020. The study was divided into two stages. The first stage involved assessing the quality of the greenery, and the second stage compared this assessment to the economic value of an average flat. The effect of greenery on the price of housing has been shown in many studies [5,14,15,16,17], but the way in which the price of housing determines the quality of residential greenery has not been the subject of much research. More expensive housing is frequently built near public green areas [18], but how do developers shape the residential greenery in such locations? There is a lack of reports describing this problem. Is there a relationship between the high price of a flat and the high quality of residential greenery on a development plot? Our study filled a research gap in the subject of residential greenery quality and its relationship with the price of flats.

1.1. Regulations and Shaping of Residential Greenery—Commentary on Polish Conditions

At present, Polish law does not guarantee the provision of publicly accessible green and recreational areas within residential development sites in local plans. The applicable law refers only to the development area, i.e., the plot intended for multi-family housing development. The Ordinance of the Minister of Infrastructure of 12 April 2002 on technical conditions for buildings and their location (2002) [19] requires that plots earmarked for multi-family development should have at least 25% of the plot area arranged as biologically vital areas (Ratio of Biologically Vital Areas—RBVA) if no other percentage results from the local spatial development plan (LSDP). According to the Ordinance, in a complex of multi-family buildings covered by a single building permit, playgrounds and accessible recreation areas should be provided, as appropriate to the use, with an RBVA of at least 30%, unless otherwise specified in separate regulations. At the same time, an RBVA is considered to be not only the native soil covered with vegetation and surface water within the building plot but also 50% of the sum of the surfaces of terraces and flat roofs covered with greenery with an area of not less than 10 m2. The area of a building plot in a multi-family housing development is not linked to the legislation to either the number of residents or the intensity of the development (number of storeys, development area).
As mentioned above, the RBVA is a very broad term. This legal situation implies an agreement to lower the quality standards of the residential environment. Consequently, green areas are often planned and created in a piecemeal form, limiting greenery to the statutory minimum. As a result, newly developed housing estates are increasingly devoid of concentrated green spaces. However, as numerous studies have shown, the concentration of green spaces in larger areas has significant health benefits. The concept of superiority of concentrated green areas emerged in the 1960s in Poland and was popularised by Czarnecki. According to him, at least 50% of housing estates should be planned and designed to form a densely green area of more than 1000 m2 [20]. During the communist period, a state housing program was in force; at that time, a record number of completed flats was reached. After 1990, the real estate market became dominated by private investors. The pursuit of profit contributed to the deterioration of the quality of public space, often to the appropriation of greenery [21].
Urban planning standards related to greenery are introduced to ensure publicly accessible green, recreation and sporting areas in the city, guarantee the appropriate share of residential greenery in residential development areas, determine the optimum relationship between the intensity of development (also related to population density) and the share of built-up area and green space [22]. Many cities are developing regulations when it comes to residential greenery. The authorities of individual cities in Poland strive to develop guidelines and parameters for existing and planned greenery. The Warsaw Housing Standard [23] defines the city’s expectations of future investors and meets the needs of residents. It provides transparency in the city’s housing policy. According to the document, the protection of the natural environment should be treated as a priority during development.
An analogous document, the Housing Policy of the City of Poznań for 2017–2027 [24], while noting the significant attachment of residents to green spaces (including the view that public green space should not be replaced by other types of RBVA, such as parking slabs with openings or green space on the roofs of buildings that is inaccessible to users), the guidelines for the design of green space accompanying housing development are very limited.
The answer could be top-down regulations related to the introduction of building standards and relevant LSDPs. An element supporting the improvement of the state of affairs in Poland is the ‘Green House’ certificate issued by the Polish Green Building Council [25]. The evaluation criteria include ‘landscaping’. In the certification process, it is necessary to carry out a wildlife survey (before the investment) and submit an ecologist’s report. The guidelines for landscaping the areas around buildings include, among other things, refraining from introducing ornamental plants, introducing habitat-appropriate species, drought-tolerant species, melliferous plants, new tall greenery of native species, preserving the ecosystem and establishing meadow lawns. In contrast, there is no indication of the share of a green area on a development site.
The liberal tree removal law exacerbates the poor greenery situation in Poland. Article 83 of the Nature Conservation Act (2013) [26] expanded the circumstances allowing the removal of trees or shrubs without a felling permit in 2017. Additionally, fees for removing trees and shrubs during the construction of public roads were repealed.

1.2. Green Space and Housing Developments

The quality of green space has been the subject of numerous studies and considerations from different perspectives. Many publications address the correlation between good green space quality and the health of urban dwellers [27,28,29]. Many factors, such as area, accessibility, location in the city, surroundings, amenities, maintenance, land cover, plant and animal diversity and a sense of security influence the quality of green space. Urban dwellers interact with green spaces on three levels, according to Pretty [30]. These three levels relate particularly to residents of multi-family housing developments. The first level of contact refers to views of greenery (the views from windows developers extol in their advertisements). The second level is contact with greenery when performing other activities, such as walking through the estate. The third, deepest level is the deliberate seeking of contact with nature, e.g., using the common part of the housing estate such as a green square. From the city residents’ mental health perspective, providing contact with nature on these three levels is essential.
The 3–30–300 rule by Konijnendijk [31] has received a lot of publicity. It is a simple guideline that asserts everyone should see at least three trees from their home, have 30% tree canopy cover in their neighbourhood and not live more than 300 m away from the nearest public green space. Housing greenery standards in urban planning exist in many European countries, especially in individual cities. For example, German standards stipulate that a playground for older children should be provided in addition to backyard recreation areas if the number of dwellings exceeds 50. If the number exceeds 75, access to sports areas for young people and adults should be provided with an area equivalent to a ratio of 5 m2 per dwelling [22,32]. In 2002, a local building law was passed in the city of Basel. It states that all new and renovated flat roofs must be built as green roofs. This requirement was reinforced in 2010 by an ordinance that mandated green roofing for all flat roofs if part of a building is retrofit and for all new buildings with flat roofs [33,34]. In Copenhagen, the access to close green areas is secured through high standards related to the extent of open spaces for housing, typically 60 m2 per 100 m2 of housing for new multi-family dwellings (parking facilities are most often under the buildings and not above ground). Green areas are created in existing housing by clearing courtyards, demolishing garages and parking spaces, etc. [35].
The actions undertaken by municipalities are intended to increase the number and area of green spaces for the recreational needs of residents. Urban development and population growth lead to the loss of contact between city dwellers and nature, thereby assigning more importance to the remaining urban green areas for the well-being of residents [36]. The increase in residents’ expectations of residential greenery was accelerated by the COVID-19 pandemic when importance began to be attached to opportunities for outdoor sports close to home and to enjoy passive recreation in a green environment [37]. Furthermore, green space next to high-density housing is particularly important for alleviating the stress of city life, a principle that works exceptionally well for older people [38]. Although green spaces in a residential environment are critical for less mobile people, after-work recreation and children’s healthy development, there has been relatively little research on them [39]. For greenery to positively impact the quality of life of city dwellers, it must be greenery of good quality [40].

2. Materials and Methods
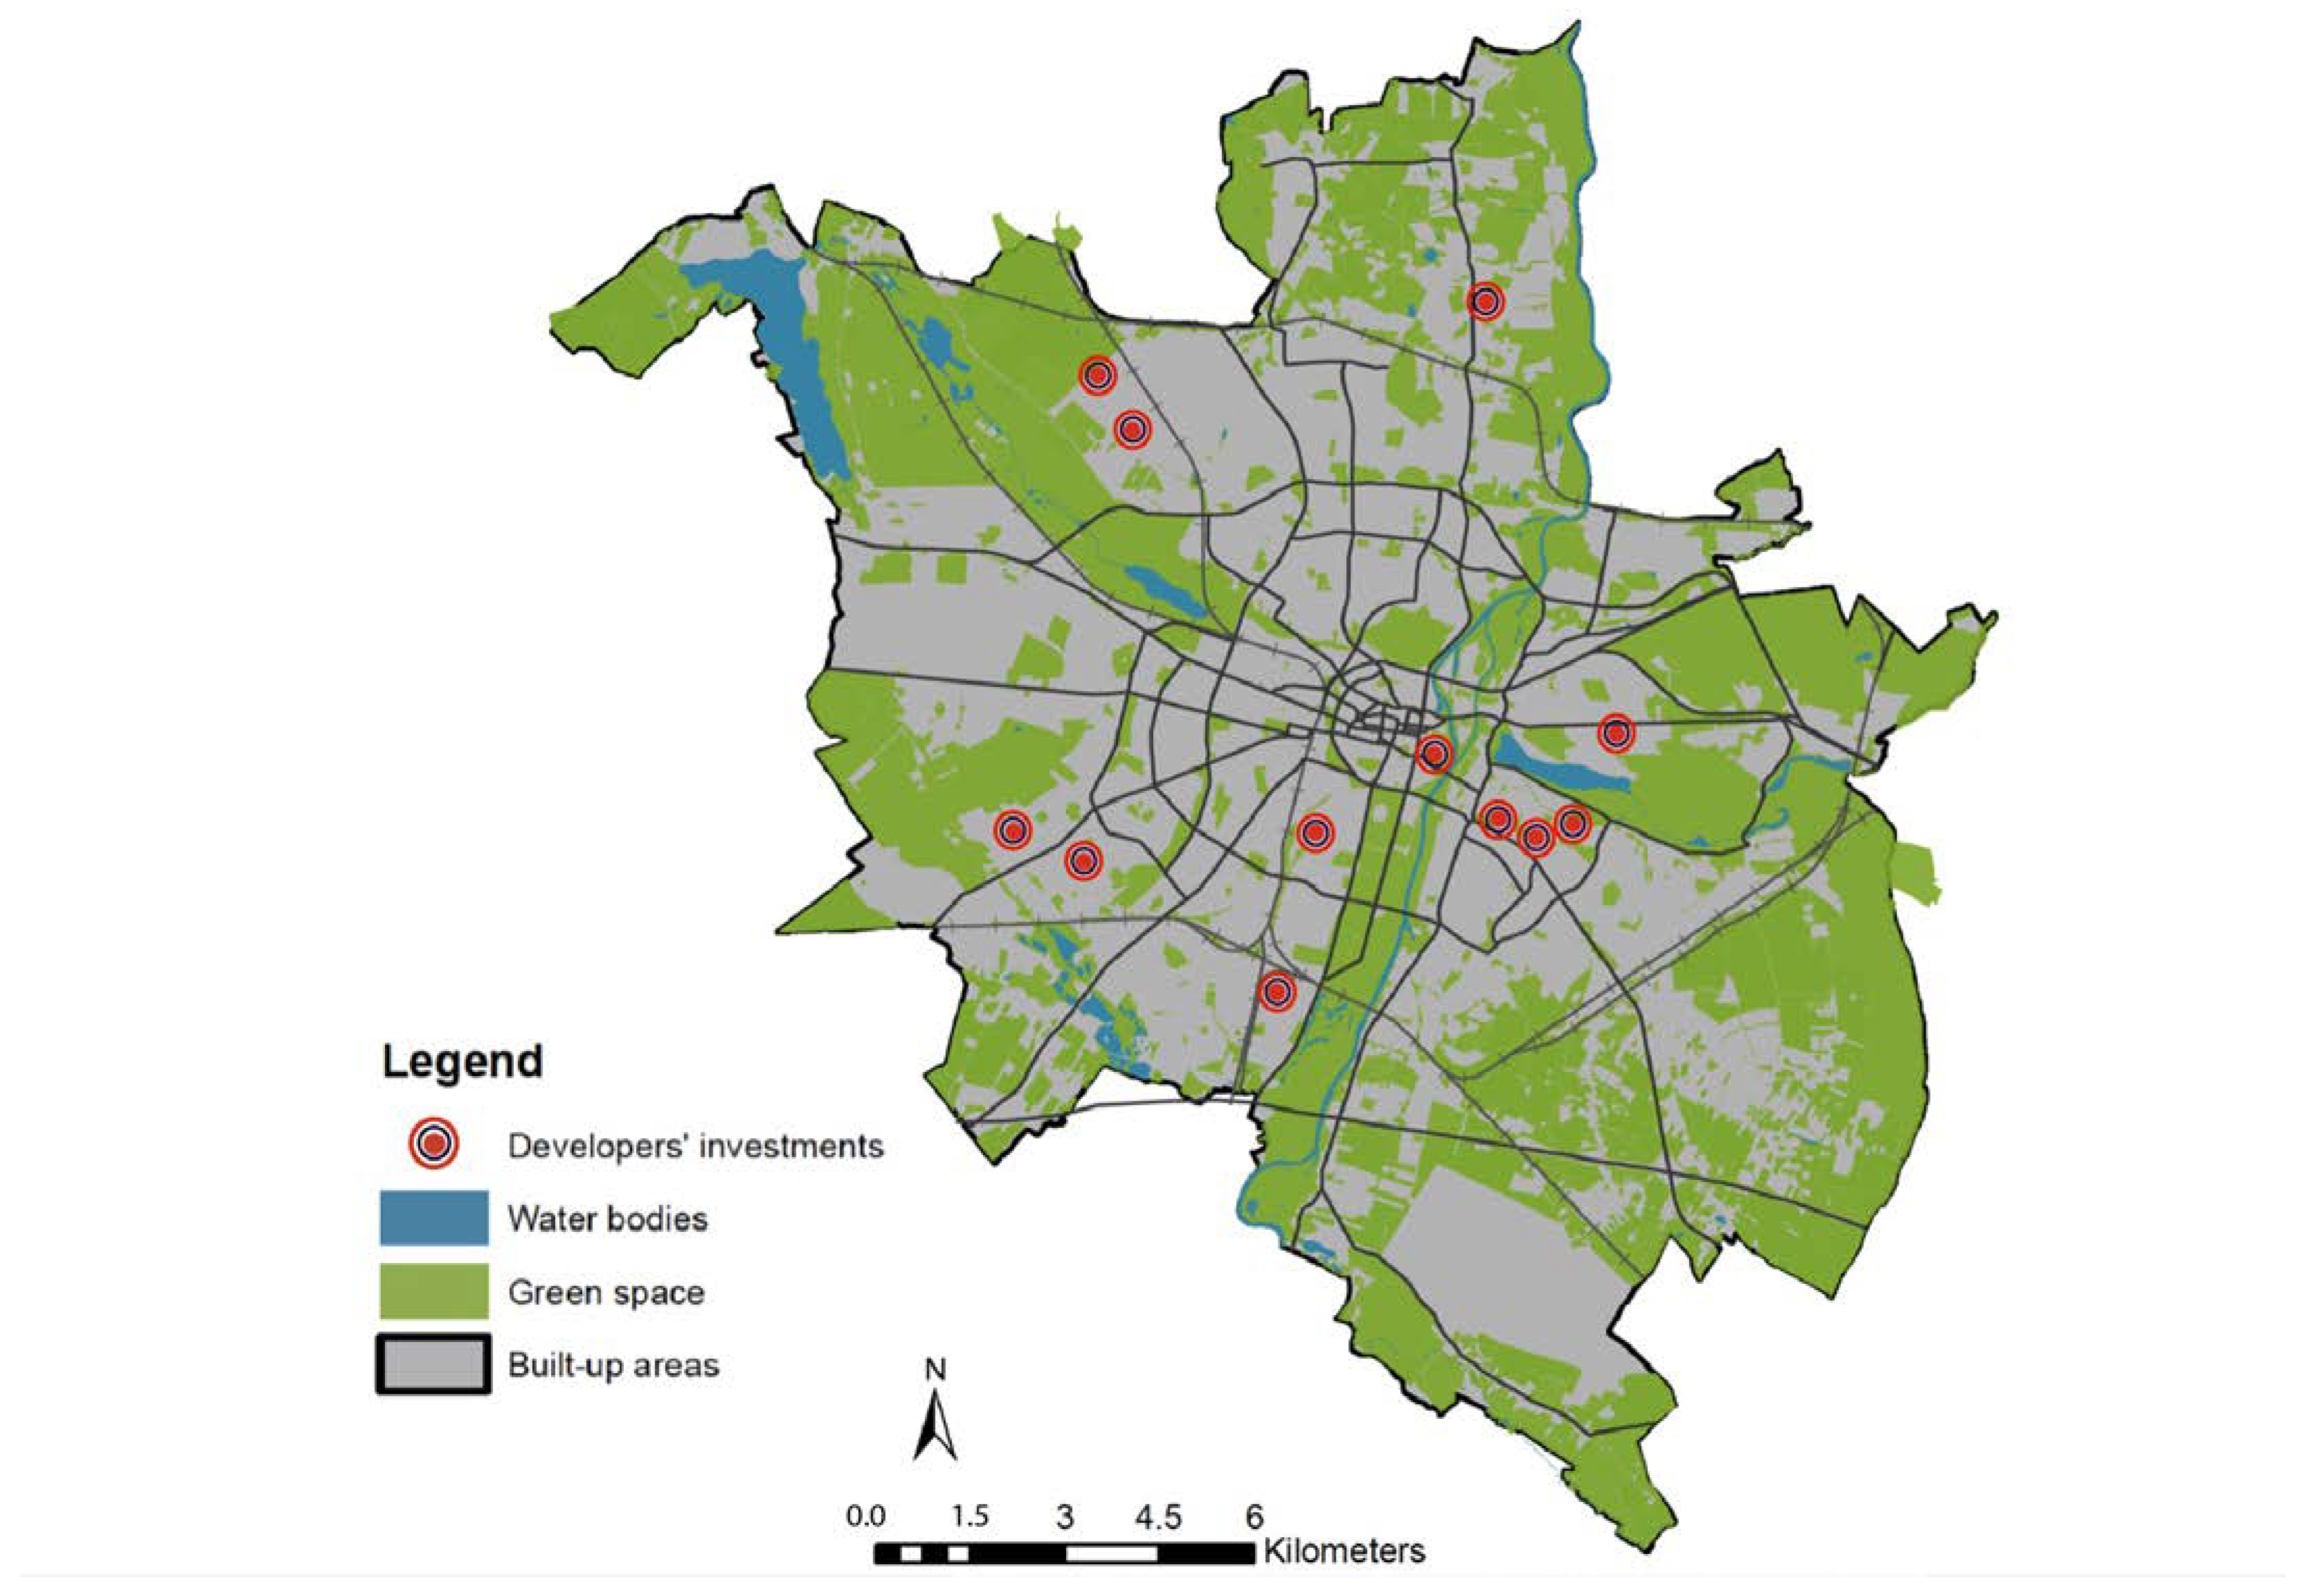
2.1. Study Area

Poznań is the fifth biggest city in Poland, with a population of 533,830 [41]. The number of flats in Polish cities is rising steadily. This is linked to growing living space expectations, the development of metropolitan areas and a housing boom in the property market before 2022. These figures are confirmed for Wielkopolska, the region whose capital is Poznań, which had the highest number of new housing developments completed in 2020, just after Mazovia, with the nation’s capital Warsaw [42]. Poznań alone saw a record number of multi-family residential buildings completed in 2020 [43].
Poznań has been considered a green city since the 1930s when the idea of the ring and wedge system of greenery was conceived. The system took advantage of Poznań’s location in the valley of three rivers which still form the basis of the green wedges and the fortress that surround the city; the location was supposed to be the backbone of the green rings. The greenery rings were not created; their layout on the city plan reads as dispersed enclaves of greenery.
The share of residential greenery in the total structure of green areas in Poznań is 13%, which lands it in 15th place among the 18 provincial cities in Poland in this respect. Moreover, statistical data from 2010–2020 on the amount of greenery in housing estates in Poznań indicate a decrease in this form of greenery by 8% (Table 1). These areas accompany multi-family housing, excluding parks, squares, street greenery, forests, communes, cemeteries and private gardens.
Recent efforts of the city authorities to promote greenery are superficial and promotional, showing the hallmarks of greenwashing. The greenery system is not developed, and more green wedges are allocated for development [44]. In Poznań, as in other large Polish cities, fenced and monitored multi-family housing estates are often built, leading to space appropriation, including the green areas near these developments. Moreover, in recent years, there has been a densification of housing estates created during the communist era. These housing estates were planned and built following functional, spatial and architectural standards, i.e., including common areas: playgrounds, sports fields and residential greenery. Due to the often unresolved ownership issues of the land on which the housing estates were built, it is a widespread practice for developers to encroach on the green areas of the housing estates with new developments [45]. For the last few years, grassroots social movements favouring greenery have been growing in Poznań. Non-governmental organizations oppose the development of green areas, the felling of trees and the renovation of public spaces involving the concreting of areas. There is a growing public expectation of the city’s availability and quality of green spaces. This is widely exploited by developers advertising their estates as green, which, in reality, involves greenwashing. Greenery appears mainly in the names of new developments. The sellers use visualisations to communicate with buyers, showing new developments in a favourable light, with lush greenery in the background of the estate and inside it. However, the depicted green areas turn out to be impossible to create [11].

2.2. Methods

2.2.1. Estate’s Masterplans and Detailed Planting Design Analysis

The study considered newly built or under-construction multi-flat investments from the area of Poznań (Figure 1). The study focused on the detailed designs of greenery and landscaping projects. These materials are neither publicly available in full nor disclosed to investors—flat buyers. To obtain the design documents, we approached the developers directly, asking them to make them available for research on a fully anonymous basis. We obtained twelve greenery plans among 73 different development investments we applied for, which is a limitation of the study. We received design charts with landscaping designs, planting plans, detailed designs of landscaping elements and paving, sometimes also with a descriptive section. The design charts were sent in .pdf or .dwg formats. We imported these files into Vectorworks, where calculations were made of the area occupied by the various types of greenery and paving concerning the total development project (development area, paved area, area of common greenery, private greenery, lawns, perennials and shrubs, roof greenery). The number of projected plants of various taxa was also calculated based on the documentation. The number of trees cut down and retained was also determined. The measurement data considering the area of various forms of greenery in relation to built-up and paved areas and the variety of plantings were used to calculate the quality factors described below. These were statistically processed to compare the quality of greenery in two groups of investments, prestigious and less prestigious. The analyses also included the residential part: the number of flats, the average flat area, the number of floors and the estimated target number of residents. Ten development projects analysed were entirely commercial; two were social housing developments, subsidised on various terms with public funds. Due to varying data availability, it was not possible to calculate indicators for all developments (for this reason, 1 of 12 was omitted in the statistical analyses). In addition, a research walk was carried out to determine how residents use the public green space and investigate its accessibility.

2.2.2. Residential Greenery Quality Indicators

The first stage of the study determined the quality of the residential greenery, which was derived from the seven indicators we developed:
  • ‘Greening index’ (WZ) compares the area of greenery on plots in relation to the size of those plots.
WZ = RBVA/PZO.
RBVA—total ratio of biologically vital areas (i.e., low, medium, high green and green roofs);
PZO—housing estate area.
2.
‘Accessibility index’ (WDs) determines the area of green space available to residents and the amount of it is per person.
WDs = PTZO/LM.
PTZ—area of residential greenery;
LM—number of residents.
3.
‘Compensation ratio’ (WK) shows the way in which the area of greenery removed from the plot in preparation for the development compares to the greenery introduced after the development is completed.
WK = PZN/PZU.
PZN—area of greenery added;
PZU—area of greenery removed.
4.
‘Structural indicator’ (WS) assumes that the importance of tall greenery (trees, tall shrubs) is both environmentally and socially more important than low greenery (lawns, perennial and low shrub beds, ground cover plants), which plays a mainly ornamental role. The indicator shows the share of tall greenery in the total area of greenery on the plots surveyed for residential developments.
WS = ZW/RBVA.
ZW—area occupied by tall greenery;
RBVA—total ratio of biologically vital areas (i.e., low, medium, high green and green roofs).
5.
‘Biodiversity index’ (WB) shows the species diversity of the planned planting related to the number of plants planted.
WB = LG/LR.
LG—number of species;
LR—number of plants.
6.
‘Socialisation rate’ (WU) indicates the proportion of green space that can be used to develop social contacts. The area of greenery arranged as recreation areas for residents (courtyards, playgrounds, outdoor gyms) is related to the ratio of biologically vital areas.
WU = PZW/RBVA.
PZW—green area arranged as a recreation area;
RBVA—total ratio of biologically vital areas (i.e., low, medium, high green and green roofs).
7.
‘Democratic index’ (WD) indicates the accessibility of the greenery on the plot, as some of the greenery arrangements include private greenery (private gardens or terraces) inaccessible to every resident. The area of greenery along the pedestrian routes on the plot and related to recreation areas for residents is related to the area of ratio of biologically vital areas.
WD = ZD/RBVA.
ZD—area of accessible greenery (transport + recreation areas);
RBVA—total ratio of biologically vital areas (i.e., low, medium, high green and green roofs).

2.2.3. Economic Value of the Housing Estate and Greenery

The second stage of the research compared data on greenery quality with information concerning the economic value of the statistic flat in the housing estate. It can be assumed that if an investment is more prestigious, one can expect to spend more on greenery.
The surveyed housing estates were divided into two groups: A—more prestigious with a higher standard and B—less prestigious with a lower standard. The criteria determining the assignment to a particular group were the following: average price per 1 m2 of flat, location and size of flats offered. The average price per m2 of flats was of key importance. Flats with an average price per 1 m2 up to PLN 7000 were classified as less prestigious, while those with prices exceeding 7000 per 1 m2 were included in the more prestigious group. Group A covered flats of relatively large sizes—small ones (below 40 m2) did not occur or occurred together with particularly large ones (above 100 m2). Housing estates in prestigious locations such as the very centre of the city (11) and very close to a large green area (10—Lasek Marceliński, 4 and 7—Lake Malta) were included in Group A. The quality of the architectural solutions offered was also arbitrarily assessed and considered. Two communal developments (6 and 9) were included in Group B, recognising that, by definition, they are aimed at residents with lower incomes.
Statistical analyses were carried out using Statistica 13.1 and MedCalc 20.115. Data were analysed in two groups for more prestigious investments (6 cases) and less prestigious investments (5 cases). Group A and B variables did not show a normal distribution. The normal distribution was analysed using the Shapiro–Wilk test. The Mann–Whitney test then analysed the data.

3. Results

The greenery on the surveyed plots occupied 23% and over 55% of the area in percentage terms after the development (Table 2). The average for prestigious investments was 40.16% and 41.62% for less prestigious ones. On average, greenery occupied a larger area of the plots than development (the average area of development for prestige investments was 33.95% and 31.07% for less prestigious ones); only in three prestige investments was the area of development on the plot larger than the area of greenery. Ornamental greenery along travel routes was predominant, occupying an average of 19.07% of plots in prestigious investments and 17.23% in less prestigious ones. Gathering spaces such as green courtyards, playgrounds and other recreation spaces important for supporting social contacts were not present on three properties, all from the prestige group. The average area of such green space was also lower in the prestigious investments, as it averaged 2.11% of the plot, while in the less prestigious ones, it averaged 9.5% of the plot. The area of private greenery (private gardens and terraces) varied considerably from plot to plot. One plot had no such greenery at all, ranging from 4.1% of the plot area to 41.5% in the other cases. The average percentage of plot area devoted to private greenery was the same for prestigious and less prestigious investments and amounted to 14.7%. In relation to the total area of greenery in the group of prestigious investments, public greenery occupied an average of 51.1% of the greenery area, and private greenery inaccessible to all residents occupied an average of 41.1% of the greenery area; in the group of less prestigious investments, these were 68.8% and 31.2%, respectively.
The predominant form of greenery was lawn (Table 3). Lawns occupied between 12.6% and 41% of the plot area. On average, in the prestigious group, lawns occupied 22.8% of the plot area, which accounted for 61.6% of the total green space. In the less prestigious group, lawns occupied an average of 29.35% of the plot area and 70.6% of the total green space. Perennials and grasses covered an average of 5.27% of the plot area of prestigious developments (which averages 11.5% of the total green space) and an average of 1.6% of the plot area of less prestigious developments (averaging 3.4% of the total green space). This may indicate a desire to provide more ornamental vegetation, which requires more maintenance and therefore is more costly to maintain in the case of the prestigious group. The most significant plants from the point of view of environmental impact, i.e., trees and shrubs, occupied a small area, ranging from 0.2% of the plot area to 16.4% of all investment. In the case of the prestigious group, trees and shrubs covered an average of 8.5% of the plot area (an average of 21.1% of the total green area) and an average of 8.1% of the plot area of the less prestigious group (19.9% of the total green area) (Table 3).
The potential associated with trees on the development plots before construction was not harnessed. Trees were present on all the plots surveyed but in varying numbers from a few to over 300 specimens. As many as six developments, including five prestigious ones, had all their trees removed from the site (Table 4). Only one of the prestigious developments retained 25 of the original 48 trees. In the case of the less prestigious group, an average of 9.9% of the trees on the plot before the development were retained. In this group, there was a project with 394 trees on the plot, of which only six were retained. In most cases (nine), more trees were planted than felled. On average, in the case of prestigious developments, 19 trees were felled (which represented 94% of the existing trees), and 37 were planted. In one case, fewer trees were planted than fell, and in another, no planting was carried out despite the felling. In the case of the less prestigious developments, an average of 92 trees (90.2% of existing trees) were removed and an average of 107 trees were planted. In one case, fewer trees were planted than removed. The area of RBVA before the development averaged 59.1% of the plot area for the prestige developments and was higher for the less prestigious developments, averaging 88.4%. As the compensation ratio (WK) shows for all but one development, the area of greenery removed far exceeds the area of greenery introduced after the development. Buildings and paved surfaces replaced the green spaces. The species diversity of new plantings was not high in the case of trees, ranging from two to seven species; on average, three new tree species were introduced in the prestigious group and two in the less prestigious group. The most popular tree species and their cultivars were the following: Tilia cordata ‘Greenspire’, Acer campestre ‘Elsrijk’ and Carpinus betulus ‘Frans Fontaine’. As for shrubs, five new species of shrubs were planned to be planted on average in the case of prestigious investments, with three species in the case of less prestigious investments. However, there were much higher numbers of shrubs per investment on average (366 shrubs on average, in an area of 446.3 m2 per prestigious investment, and 1336 shrubs in an area of 918.8 m2 per less prestigious investment). The perennial species diversity was similar, with an average of five new perennial species introduced and an average of 514 plants per plot in the case of the prestigious investments and an average of two new perennial species and an average of 1235 plants per plot in the case of the less prestigious investments (although the average area occupied by perennials on the plots, nominally and in percentage terms, was larger (an average of 472 m2 and 5.24% of the plot area in the case of the prestigious investments versus an average of 123 m2 and 1.6% of the plot area in the case of the less prestigious investments)). Climbing plants and green roofs were rarely used design solutions in the cases analysed.
The statistical analyses showed that the differences between the average values of the indicators for the two groups of investments (prestigious and less prestigious) are statistically significant in the case of the ‘socialisation rate’ (WU) (Figure 2 and Table 5). It was higher in the case of the less prestigious investments, indicating fewer private green areas excluded from common use by all residents and better maintained public green space accessible to all.
Also, the average WB, WD, WDs and WZ were higher for the less prestigious investments, but these differences were not statistically significant (Table 5 and Table 6). The statistical significance of the differences in the results for both groups for only one indicator is probably related to the small number of detailed greenery projects that could be collected for development investments and analysed. This represents a limitation of the research conducted.

4. Discussion

While the mutual influence of real property and green space has been widely studied [46], there are few answers to the question of how developers shape the greenery inside their developments. The work of Garcia-Lamarca et al. [47] represents a breakthrough in this regard. Forty-two residential property developers from Europe and North America were interviewed for the purpose of this study. The study differentiated between private and non-profit developers, consistent with our approach. Both groups were shown to use rent extraction from greenery. Investment in greenery is dictated by financial benefits, consumer demands and developers’ aspirations of socio-environmental good. Greenery was an important element of all the investments we analysed, which confirms the above statement. The problem, however, was the low quality of the new greenery, which is also indicated in our study (small share of common green areas in the investment area to be used as a meeting place, low species diversity of plantings, low rate of removed greenery compensation).
Greenery introduced in new housing estates is also an element that, in addition to the increasing attractiveness of the space, results in greater social acceptance of the dense housing developments being built, which developers eagerly exploit [47]. Also due to the importance of the social reception of the investment, in our research, we focused, among other aspects, on spaces that enable social integration within the estate greenery. The study of Schmid and Säumel [38] for Berlin shows that residents surveyed by researchers visited parks not more often than once a week but benefited daily from residential greenery.

4.1. Green Estates in Poland

The problem of poor-quality green space next to new residential development is significant. The scale of this problem is exacerbated by the manipulation of customers’ image of their future residence. Studies conducted in Poland note the low share of greenery, particularly tall greenery, in the development of residential green areas. Bradecki and Twardoch [48] revealed that in the cities of the Upper Silesian Metropolitan Union (Poland), in 17% (from 41) of examined new housing estates, green areas occupy less than 20% of the investment area, and in 26% of cases, there is no high greenery (trees). In other cases, the only trees on the plot had grown there before the investment. In regard to the investments in our studies, the results were more favourable. The average area of greenery in relation to the area of the plot was 40.16% for prestigious investments, and 41.62% for less prestigious ones. There were some trees on every plot but there were not as many trees planted on any of the plots as had been cut down before the construction started. The liberal law in Poland allows easy removal of trees [26]. Zwierzchowska et al. [45] show that environmental conditions in socmodernist housing estates are more favourable than those in new development sites in Poznań and Berlin. Socmodernist estates are richer in green spaces than new developments., probably due to the more demanding legal regulations regarding greenery from the socialist period. This state of affairs can also probably be explained by the desire to use the land for development as intensively as possible by increasing the intensity of development [49]. The potential of residential greenery to build urban resilience is untapped. A study for Wrocław showed that only 32% of the developments surveyed used nature-based solutions, and as many as 17% of developments were devoid of trees [50]. Green roofs have been a regular feature of the promotional campaigns of development estates [11]. In contrast, in 2017, green roofs were not used for promotional purposes in response to customer needs but as an opportunity to meet regulations related to the RBVA [51]. In our studies, the use of green roofs was marginal (there were two examples of investments with green roofs).

4.2. Is Greenery Crucial for Polish Housing Investments or Just a Bonus?

Residential greenery in new developments is becoming an increasingly important element of their spatial structure. This is confirmed by the widespread use of green marketing by the developers [11] and the growing demands of customers related to increasing awareness of environmental issues, which is a worldwide trend, also noticeable in Poland, especially for consumers with higher income [52,53]. However, these elements do not yet translate into good-quality greenery as evidenced by our research, because the quality of greenery in the case of prestigious and less prestigious investments is similar when considering the area of various forms of greenery in relation to built-up and paved areas, variety of plantings, etc. The lack of good-quality green space next to new developments can be explained by the large housing shortage until a decade or so ago, which made the comfort of residents less important [54]. Environmental benefits are still less important to buyers than other parameters of the development, including, for example, parking spaces. This is due to the car-oriented approach of most residents and poorly developed public transport. There is often a takeover of space planned as green space by cars [52,55]. The literature indicates several development projects with carefully created green space and good-quality common areas. These estates are presented as positive examples, worthy of emulation and treated as innovative and pioneering [55,56]. These projects should be treated as examples of good practice worth following, but not as the actual state of residential greenery, as indicated in our research.
The approach to residential greenery among urban residents has changed due to the COVID-19 pandemic. Greenery near the residence has become more important for individuals from underprivileged residential areas in Berlin. Every fifth in 2018 and every fourth respondent in 2021 stated that they did not visit public parks outside their residential area, while all used residential greenery areas in some way [36]. Residential greenery was all the more important during the COVID-19 pandemic as some recreational areas, including playgrounds and sports fields, were periodically closed, and city parks were perceived as crowded.

4.3. Approach to Existing Green Space in Development Projects

The deteriorating conditions of urban trees and the difficulties with planting new ones should force maximum protection of existing greenery. We observed that most of the trees were removed from construction sites. The potential of the existing greenery, i.e., mature trees on the development site at the time of its commissioning, which could have positively influenced prospective buyers’ perception of the property, was not harnessed. Similar conclusions were drawn in the case of Wrocław [50] and Poznań [11], where the existing greenery on development plots is mostly removed. Even if some of the greenery is preserved, its chances of survival are very slim. A survey conducted by Suchocka et al. [57] among tree professionals involved in development projects indicates that trees are often not sufficiently protected during development. In the context of our study, the low level of greenery compensation rates also seems worrying: the mean value of WK (‘Compensation ratio’ indicator) for prestigious investments was 0.245, and for less prestigious investments it was 0.008.

4.4. Flat Price and Quality of Green Space

Surprisingly, the study results indicate greater accessibility to common green space in less prestigious estates than those identified as prestigious. This is due, among other things, to the separation of large areas of private gardens within prestigious estates. Creating gardens next to ground-floor flats is a common practice of developers, whereas it is less common in communal and social housing developments. In our studies, all investments except one had this form of greenery. The average percentage of an RBVA area devoted to private gardens was the same for prestigious and less prestigious investments and amounted to 14.7%. Private gardens in multi-family developments are seen as part of a sales strategy. It is also a method of ceding the costs of greenery maintenance to buyers. Ground-floor flats are less popular with consumers; they offer a poorer view and less sunlight, and their users feel less secure. A good incentive to buy a ground-floor flat is a garden ranging in size from a dozen to even several hundred square meters. By dedicating large sections to private greenery, developers leave physically no room for common space. Meeting places intended for recreation that are important for social interactions were not present in the three properties surveyed (all represented the prestigious group). This may be a particularly significant problem in the context of the COVID-19 pandemic. A study of changes in resident attitudes towards residential greenery in Berlin before and after the pandemic showed that these green spaces were important to many residents in terms of maintaining social contacts [36] and reducing the feeling of loneliness. A study in Kraków [58] indicated the same reason for visiting green spaces was cited by around 20% of respondents in different phases of the pandemic. The Berlin survey respondents more frequently sought social contact than the opportunity to grow plants, for which private gardens may be used more than common spaces, and 65% of the respondents indicated meeting neighbours or other people in the residential greenery; the majority stated that children used the residential greenery, but only 15% gardened [36], which could be a good activity for a private garden. A study of different uses of and attitudes towards urban greenery during the pandemic in different countries showed that respondents indicated ‘meeting other people’ as the aspect they sorely lacked in terms of access to green spaces during the initial stage of the pandemic when the possibility to use urban greenery in many countries was limited or non-existent [59]. Some cities (e.g., Beijing) made an effort after the pandemic to determine the behavior patterns of residents related to urban greenery to improve the urban greenery system and its functioning [60].
The limitation of the research was the difficulty in obtaining design documentation related to greenery, which resulted in a small number of cases we examined. Another obstacle was the difficulty in separating greenery from other factors affecting the cost of flats. In Poland, attention is paid first to the accessibility, size of the flat and price, rather than to attractive neighbourhoods [50,61]. Only 6.9% of flat buyers in 2005–2018 indicated that green surroundings were important to them [52].
Appearing certificates for green buildings [25] may contribute to greater attention to the greenery of housing estates and its quality. One can hope that society will also start to expect it.

5. Conclusions

We could not prove that a higher cost of flats translates to better residential greenery. Our research leads to the opposite conclusion: less prestigious (cheaper) flats have the same or even better access and quality of greenery in the estate. Our study concludes that even expensive housing does not necessarily have access to good-quality green space, as the price is not a factor in making a housing estate greener. Residents may not have close and direct contact with good-quality greenery despite the comparatively high price of the flat.
Greenery has become part of developers’ marketing strategies; at the same time, greenery is becoming an increasingly tricky asset for city residents. Thus, developers should be required to survey and valorise the existing greenery in the area intended for investment before its implementation to preserve valuable greenery elements. At the same time, ensuring that their investments offer high-quality greenery for public access is necessary, providing a package of ecosystem services.
In the development projects analysed, greenery is not derived from the price of the flats. The common spaces are larger in less prestigious developments. In some of the studied more prestigious investments, the green area is limited to the minimum required by law and the opportunities of plot development with maximum build-up area. Both prestigious and less prestigious development projects offer private gardens. These gardens are separated from the potentially publicly accessible housing estate space. This is particularly noticeable in the more prestigious developments and exacerbates the problem of equitable access to green space. These gardens do not serve a residential and recreational role for the flat owner nor an ecological and social one for the city inhabitants. Thus, the prestige of the investment is artificial and relies on a higher price, leading to a segregated society.
The analysed greenery of the development estates, due to the modest composition of the plant cover of both the publicly accessible space and the private gardens (parts of housing estates), does not constitute a significant element for the biodiversity and natural values of UGS. Moreover, residual, seminatural, informal vegetation (trees on plots before investment) that can provide an alternative to amenity greenery is rapidly disappearing in developing cities due to strong urban pressure. Given that the current UGS resource is over-exploited, including in marketing strategies and naming of development projects, this is an opportune time to argue for the integration of greenery of newly developed housing estates into local housing policies and urban spatial planning.

Author Contributions

Conceptualization, M.S., A.G.-D. and A.W.; methodology, M.S., A.G.-D. and A.W.; software, A.G.-D.; validation, M.S., A.G.-D. and A.W.; formal analysis, M.S., A.G.-D. and A.W.; investigation, M.S., A.G.-D. and A.W.; resources, A.G.-D.; writing—original draft preparation, M.S., A.G.-D. and A.W.; writing—review and editing, M.S. All authors have read and agreed to the published version of the manuscript.

Funding

This work was supported by the Ministry of Science and Higher Education programme as ‘Regional Initiative Excellence’ in years 2019−2022 under Grant 005/RID/2018/19.

Institutional Review Board Statement

Not applicable.

Informed Consent Statement

Not applicable.

Data Availability Statement

Data is unavailable due to privacy reasons.

Conflicts of Interest

The authors declare no conflict of interest.

References

  1. Todes, A.; Robinson, J. Re-directing developers: New models of rental housing development to re-shape the post-apartheid city? Environ. Plan. A Econ. Space 2019, 52, 297–317. [Google Scholar] [CrossRef]
  2. Connolly, J.J.T. From Jacobs to the Just City: A foundation for challenging the green planning orthodoxy. Cities 2019, 91, 64–70. [Google Scholar] [CrossRef]
  3. Tammaru, T.; Marcińczak, S.; Aunap, R.; van Ham, M.; Janssen, H. Relationship between income inequality and residential segregation of socioeconomic groups. Reg. Stud. 2019, 54, 450–461. [Google Scholar] [CrossRef] [Green Version]
  4. Wüstemann, H.; Kalisch, D.; Kolbe, J. Access to urban green space and environmental inequalities in Germany. Landsc. Urban Plan. 2017, 164, 124–131. [Google Scholar] [CrossRef]
  5. Li, X.; Zhang, C.; Li, W.; Kuzovkina, Y.A.; Weiner, D. Who lives in greener neighborhoods? The distribution of street greenery and its association with residents’ socioeconomic conditions in Hartford, Connecticut, USA. Urban For. Urban Green. 2015, 14, 751–759. [Google Scholar] [CrossRef]
  6. Łaszkiewicz, E.; Kronenberg, J.; Marcińczak, S. Microscale socioeconomic inequalities in green space availability in relation to residential segregation: The case study of Lodz, Poland. Cities 2021, 111, 103085. [Google Scholar] [CrossRef]
  7. Sikorska, D.; Łaszkiewicz, E.; Krauze, K.; Sikorski, P. The role of informal green spaces in reducing inequalities in urban green space availability to children and seniors. Environ. Sci. Policy 2020, 108, 144–154. [Google Scholar] [CrossRef]
  8. Hwang, Y.H.; Nasution, I.K.; Amonkar, D.; Hahs, A. Urban green space distribution related to land values in fast-growing megacities, Mumbai and Jakarta-unexploited opportunities to increase access to greenery for the poor. Sustainability 2020, 12, 4982. [Google Scholar] [CrossRef]
  9. Kilnarová, P.; Wittmann, M. Open space between residential buildings as a factor of sustainable development—Case studies in Brno (Czech Republic) and Vienna (Austria). IOP Conf. Ser. Earth Environ. Sci. 2017, 95, 052008. [Google Scholar] [CrossRef]
  10. Battisti, L.; Pille, L.; Wachtel, T.; Larcher, F.; Säumel, I. Residential greenery: State of the art and health-related ecosystem services and disservices in the city of Berlin. Sustainability 2019, 11, 1815. [Google Scholar] [CrossRef] [Green Version]
  11. Gałecka-Drozda, A.; Wilkaniec, A.; Szczepańska, M.; Świerk, D. Potential nature-based solutions and greenwashing to generate green spaces: Developers’ claims versus reality in new housing offers. Urban For. Urban Green. 2021, 65, 127345. [Google Scholar] [CrossRef]
  12. Sanesi, G.; Colangelo, G.; Lafortezza, R.; Calvo, E.; Davies, C. Urban green infrastructure and urban forests: A case study of the Metropolitan Area of Milan. Landsc. Res. 2017, 42, 164–175. [Google Scholar] [CrossRef]
  13. Jaworek-Jakubska, J.; Filipiak, M.; Michalski, A.; Napierała-Filipiak, A. Spatio-temporal changes of urban forests and planning evolution in a highly dynamical urban area: The case study of Wrocław, Poland. Forests 2019, 11, 17. [Google Scholar] [CrossRef] [Green Version]
  14. Tyrväinen, L.; Miettinen, A. Property prices and urban forest amenities. J. Environ. Econ. Manag. 2000, 39, 205–223. [Google Scholar] [CrossRef] [Green Version]
  15. Crompton, J.L. The impact of parks on property values: A review of the empirical evidence. J. Leis. Res. 2001, 33, 1–31. [Google Scholar] [CrossRef]
  16. Mansfield, C.; Pattanayak, S.K.; McDow, W.; McDonald, R.; Halpin, P. Shades of green: Measuring the value of urban forests in the housing market. J. For. Econ. 2005, 11, 177–199. [Google Scholar] [CrossRef] [Green Version]
  17. Mei, Y.; Zhao, X.; Lin, L.; Gao, L. Capitalization of urban green vegetation in a housing market with poor environmental quality: Evidence from Beijing. J. Urban Plan. Dev. 2018, 144, 05018011. [Google Scholar] [CrossRef]
  18. Checker, M. Wiped out by the “Greenwave”: Environmental gentrification and the paradoxical politics of urban sustainability. City Soc. 2011, 23, 210–229. [Google Scholar] [CrossRef]
  19. The Ordinance of the Minister of Infrastructure of 12 April 2002 on Technical Conditions for Buildings and Their Location. 2022, no 75, Item 690. Available online: https://isap.sejm.gov.pl/isap.nsf/DocDetails.xsp?id=wdu20020750690 (accessed on 14 January 2023).
  20. Czarnecki, W. Planowanie Miast i Osiedli; Warszawa: Warsaw, Poland, 1965; Volume 4. [Google Scholar]
  21. Staszewska, S.; Łowicki, D.; Szczepańska, M. Landscape and Spatial Management: Changes, Principles and Directions of Measure. In Three Decades of Polish Socio-Economic Transformations: Geographical Perspectives; Churski, P., Kaczmarek, T., Eds.; Springer: Cham, Switzerland, 2022; pp. 381–404. [Google Scholar]
  22. Dąbrowska-Milewska, G. Standardy urbanistyczne dla terenów mieszkaniowych—Wybrane zagadnienia. Archit. Et Artibus 2010, 2, 17–31. [Google Scholar]
  23. Warszawski Standard Mieszkaniowy—Warsaw Housing Standard. Available online: https://konsultacje.um.warszawa.pl/sites/konsultacje.um.warszawa.pl/files/1_warsz_standard_mieszkaniowy_do_konsultacji.pdf (accessed on 14 January 2023).
  24. Gawron, H.; Trojanek, M.; Lis, P.; Palicki, S.; Celka, K. Polityka Mieszkaniowa Miasta Poznania na Lata 2017–2027 (Poznań: Uniwersytet Ekonomiczny w Poznaniu). Available online: https://www.poznan.pl/mim/public/main/attachments.att?co=show&instance=1017&parent=83191&lang=pl&id=243438 (accessed on 14 January 2023).
  25. PLGBC. Available online: https://plgbc.org.pl/projekty/zielony-dom/ (accessed on 22 March 2023).
  26. Journal of Laws Nature Conservation Act, 2013 Item 627. Available online: https://isap.sejm.gov.pl/isap.nsf/DocDetails.xsp?id=wdu20130000627 (accessed on 22 March 2023).
  27. Knobel, P.; Dadvand, P.; Maneja-Zaragoza, R. A systematic review of multi-dimensional quality assessment tools for urban green spaces. Health Place 2019, 59, 102198. [Google Scholar] [CrossRef] [PubMed]
  28. Knobel, P.; Dadvand, P.; Alonso, L.; Costa, L.; Español, M.; Maneja, R. Development of the urban green space quality assessment tool (RECITAL). Urban For. Urban Green. 2021, 57, 126895. [Google Scholar] [CrossRef]
  29. Szulczewska, B.; Giedych, R.; Borowski, J.; Kuchcik, M.; Sikorski, P.; Mazurkiewicz, A.; Stańczyk, T. How much green is needed for a vital neighbourhood? In search for empirical evidence. Land Use Policy 2014, 38, 330–345. [Google Scholar] [CrossRef]
  30. Pretty, J. How nature contributes to mental and physical health. Spiritual. Health Int. 2004, 5, 68–78. [Google Scholar] [CrossRef]
  31. Konijnendijk, C.C. Evidence-based guidelines for greener, healthier, more resilient neighbourhoods: Introducing the 3-30-300 rule. J. For. Res. 2022, 34, 821–830. [Google Scholar] [CrossRef]
  32. Amtsblatt Für Berlin 1990. Available online: https://digital.zlb.de/viewer/image/34530922_1990_1/1/LOG_0004 (accessed on 14 January 2023).
  33. Clime Adapt 2023. Available online: https://climate-adapt.eea.europa.eu/pl/metadata/case-studies/green-roofs-in-basel-switzerland-combining-mitigation-and-adaptation-measures-1 (accessed on 22 March 2023).
  34. Stadtgärtnerei 2023. Available online: https://www.stadtgaertnerei.bs.ch/ (accessed on 22 March 2023).
  35. Website of the European Union 2023. Available online: https://ec.europa.eu/environment/europeangreencapital/wp-content/uploads/2012/07/Section-3-green-urban-areas_Copenhagen.pdf (accessed on 20 March 2023).
  36. Conedera, M.; Del Biaggio, A.; Seeland, K.; Moretti, M.; Home, R. Residents’ preferences and use of urban and peri-urban green spaces in a Swiss mountainous region of the Southern Alps. Urban For. Urban Green. 2015, 14, 139–147. [Google Scholar] [CrossRef]
  37. Säumel, I.; Sanft, S.J. Crisis mediated new discoveries, claims and encounters: Changing use and perception of residential greenery in multistory housing in Berlin, Germany. Urban For. Urban Green. 2022, 74, 127622. [Google Scholar] [CrossRef]
  38. He, D.; Miao, J.; Lu, Y.; Song, Y.; Chen, L.; Liu, Y. Urban greenery mitigates the negative effect of urban density on older adults’ life satisfaction: Evidence from Shanghai, China. Cities 2022, 124, 103607. [Google Scholar] [CrossRef]
  39. Schmid, H.L.; Säumel, I. Outlook and insights: Perception of residential greenery in multistorey housing estates in Berlin, Germany. Urban For. Urban Green. 2021, 63, 127231. [Google Scholar] [CrossRef]
  40. Lindholst, A.C.; van den Bosch, C.C.K.; Kjøller, C.P.; Sullivan, S.; Kristoffersson, A.; Fors, H.; Nilsson, K. Urban green space qualities reframed toward a public value management paradigm: The case of the Nordic Green Space Award. Urban For. Urban Green. 2016, 17, 166–176. [Google Scholar] [CrossRef]
  41. GUS Główny Urząd Statystyczny—Statistics Poland, Bank Danych Lokalnych—Local Data Bank. Available online: https://bdl.stat.gov.pl/bdl/start (accessed on 14 January 2023).
  42. SWAID System Wspomagania Analiz i Decyzji—System for Analysis and Decision Support. Available online: http://swaid.stat.gov.pl/AtlasRegionow/AtlasRegionowMapa.aspx (accessed on 14 January 2023).
  43. PINB Powiatowy Inspektorat Nadzoru Budowlanego dla Miasta Poznania—Poviat Building Supervision Inspectorate for the City of Poznań. Available online: http://www.pinb.poznan.pl/index.php/sytuacja-na-rynku-budowlanym-w-poznaniu/480-bardzo-dobry-rok-na-poznanskich-placach-budowy-perspektywy-jeszcze-lepsze (accessed on 14 January 2023).
  44. Raszeja, E.; Gałecka-Drozda, A. Współczesna interpretacja idei poznańskiego systemu zieleni miejskiej w kontekście strategii miasta zrównoważonego. Stud. Miej. 2015, 19, 75–86. [Google Scholar]
  45. Zwierzchowska, I.; Haase, D.; Dushkova, D. Discovering the environmental potential of multi-family residential areas for nature-based solutions. A Central European cities perspective. Landsc. Urban Plan. 2021, 206, 103975. [Google Scholar] [CrossRef]
  46. Czembrowski, P.; Kronenberg, J. Hedonic pricing and different urban green space types and sizes: Insights into the discussion on valuing ecosystem services. Landsc. Urban Plan. 2016, 146, 11–19. [Google Scholar] [CrossRef]
  47. García-Lamarca, M.; Anguelovski, I.; Cole, H.V.S.; Connolly, J.J.T.; Pérez-del-Pulgar, C.; Shokry, G.; Triguero-Mas, M. Urban green grabbing: Residential real estate developers discourse and practice in gentrifying Global North neighborhoods. Geoforum 2022, 128, 1–10. [Google Scholar] [CrossRef]
  48. Bradecki, T.; Twardoch, A. Współczesna zabudowa mieszkaniowa w miastach Górnośląskiego Związku Metropolitalnego. Prezentacja metody badawczej oraz wnioski z badań. In Badania Miejskie i Regionalne: Potencjały Rozwojowe Oraz Kierunki przemian w Miastach i Regionach; Klasik, A., Ed.; Prace Naukowe Uniwersytet Ekonomiczny w Katowicach: Katowice, Poland, 2015; pp. 53–72. [Google Scholar]
  49. Podawca, K.; Górecki, M. Analiza warunków zamieszkania w wybranych zamkniętych osiedlach podwarszawskich. Probl. Rozw. Miast 2009, 1, 94–107. [Google Scholar]
  50. Dobrzańska, J.; Nadolny, A.; Kalbarczyk, R.; Ziemiańska, M. Urban Resilience and Residential Greenery—The Evidence from Poland. Sustainability 2022, 14, 11317. [Google Scholar] [CrossRef]
  51. Kronenberg, J.; Bergier, T.; Maliszewska, K. The Challenge of Innovation Diffusion: Nature-Based Solutions in Poland. In Nature-Based Solutions to Climate Change Adaptation in Urban Areas; Kabisch, N., Korn, H., Stadler, J., Bonn, A., Eds.; Springer: Cham, Switzerland, 2017; pp. 291–305. [Google Scholar] [CrossRef]
  52. Bryk, R. Preferencje zakupu mieszkań w dużych miastach Polski. Stud. Miej. 2019, 33, 141–153. [Google Scholar] [CrossRef]
  53. Rice, J.L.; Cohen, D.A.; Long, J.; Jurjevich, J.R. Contradictions of the climate-friendly city: New perspectives on eco-gentrification and housing justice. Int. J. Urban Reg. 2020, 44, 145–165. [Google Scholar] [CrossRef] [Green Version]
  54. Gyurkovich, J. Marzenia o komforcie. In 2nd International Congress on Intelligent Building Systems InBus. Congress Proceedings; Mikulik, J., Ed.; “Text”: Kraków, Poland, 2002. [Google Scholar]
  55. Gyurkovich, M.; Sotoca, A. Quality of Social Space in Selected Contemporary Multifamily Housing Complexes in Poland’s Three Biggest Cities. IOP Conf. Ser. Mater. Sci. Eng. 2019, 471, 092009. [Google Scholar] [CrossRef]
  56. Fuhrmann, M. Koncepcja osiedla rekreacyjnego? Przykład osiedla Lykke w Warszawie. Stud. Miej. 2017, 25, 149–161. [Google Scholar] [CrossRef]
  57. Suchocka, M.; Jankowski, P.; Błaszczyk, M. Tree protection on construction sites—Knowledge and perception of Polish professionals. Urban For. Urban Green. 2019, 46, 126436. [Google Scholar] [CrossRef]
  58. Gorzelany, J.; Noszczyk, T.; Kukulska-Kozieł, A.; Hernik, J. Urban green spaces management during the COVID-19 pandemic: Experiences from Kraków, Poland. Land Degrad. Dev. 2022, 34, 423–440. [Google Scholar] [CrossRef]
  59. Ugolini, F.; Massetti, L.; Calaza-Martínez, P.; Cariñanos, P.; Dobbs, C.; Ostoic, S.K.; Marin, A.M.; Pearlmutter, D.; Saaroni, H.; Šaulienė, I.; et al. Effects of the COVID-19 pandemic on the use and perceptions of urban green space: An international exploratory study. Urban For. Urban Green. 2022, 56, 126888. [Google Scholar] [CrossRef] [PubMed]
  60. Xu, H.; Zhao, G.; Liu, Y.; Miao, M. Using Social Media Camping Data for Evaluating, Quantifying, and Understanding Recreational Ecosystem Services in Post-COVID-19 Megacities: A Case Study from Beijing. Forests 2023, 14, 1151. [Google Scholar] [CrossRef]
  61. Bartkowiak, P.; Strączkowski, Ł. Rynek pierwotny w poznaniu z perspektywy sprzedających i kupujących mieszkania. Stud. Ekon. 2019, 382, 9–23. [Google Scholar]
Figure 1. Analysed developers’ investments in Poznań. Source: Author’s elaboration.
Sustainability 15 09997 g001
Figure 2. Differences in median value for WU in two groups of investments: prestigious (Group A) and less prestigious (Group B).
Sustainability 15 09997 g002
Table 1. Residential green areas in Poznań between 2010 and 2020 (ha).
Year20102011201220132014201520162017201820192020
Area (ha)630.4665.6666.1608.8608.8514.4627.2627.2580.7580.7580.7
Source: GUS (2021).
Table 2. Summary of the different types of areas at the various developments.
Area
InvestmentNo.Housing EstatesBuilt-UpPavedGreenery
(RBVA)
Common Greenery Next to RoutesCommon Green Space as a Meeting Place
m2%m2%m2%m2%m2%m2%
A1306310072223.663520.7170655.7123740.400.0
the prestigious investments416,284100392724.1571335.1901855.4312319.26103.8
53585100121433.982723.1108730.338010.600.0
75850100165928.4192232.9226938.883014.22364.0
104343100190343.8103223.8140832.4101923.52114.9
112449100122450.053121.769428.41626.600.0
average5929100177534.0177726.2269740.2112519.11762.1
B25027100194438.780716.1248549.4240.53747.4
the less prestigious investments311,072100410737.1238821.6471842.65505.0278925.2
625,603100706427.6798231.210,55741.2578922.618737.3
87779100270934.8105913.6401151.6290737.43915.0
928,144100482317.116,77659.6654623.3583320.77132.5
average15,525100412931.1580228.4566341.6302117.212289.5
Source: Author’s elaboration.
Table 3. Summary of the area of greenery of different types in the area of each development.
Area
InvestmentNo.LawnsPerennials and Ornamental GrassesShrubs and TreesGreenery on RoofsTOTAL Planted CoverGreenery AccessibleGreenery Private GardensRBVA before ConstructionTree and Shrub Cover before Construction
m2%m2%m2%m2%m2%m2%m2%m2%m2%
A192630.22779.050316.400.078025.5123740.446915.33 063100.0278791.0
the prestigious investments4205812.6218613.48495.2392724.1696142.7373322.910806.67234.47234.4
572920.31012.835810.000.045912.838010.670719.73585100.0260.7
7151625.900.075312.900.075333.2106618.2120420.6340558.22454.2
10102023.52686.21202.800.03888.9123028.31784.1313772.274517.2
1159724.400.0953.900.0953.91626.653321.748319.748319.7
average114122.84725.24468.56544.0157321.230121.269514.7239959.183522.9
B2174634.71603.257911.500.073914.73987.9208741.5435686.7387977.2
the less prestigious investments3216019.52562.38707.900.012610.2344731.1127111.511,072100.0151613.7
610,51041.100.0470.200.0470.2766229.9289511.325,603100.01600.6
8276135.554913.770117.500.01 25016.1329942.47129.2754497.0168121.6
9449716.000.020497.300.020497.3654623.300.016,36958.2645422.9
average433529.41231.69198.100.010429.7427026.9139314.712,98988.4273827.2
Source: Author’s elaboration.
Table 4. Summary of greenery removed and newly designed.
InvestmentNo.Trees RemovedTrees RetainedNew Tree SpeciesNumber of New TreesShrub SpeciesNumber of New ShrubsPerennial and Grass SpeciesNumber of Perennials and Grasses
Quantity%Quantity %Quantity%Quantity%Quantity%Quantity%Quantity%Quantity%
A148-25347-36-10-542-13-1799-
the prestigious investments45-0-7-64-6-nd-12-nd-
56-0-2-9-7-714-0-0-
715-0-2-32-4-383-0-0-
1018-0-2-82-0-0-2-770-
1119-0-0-0-1-190-0-0-
average1904.25.73-37-5-366-5-514-
B241-36.82-119-7-1166-2-1760-
the less prestigious investments320-12383-53-2-381-4-41-
632-133-47-1-0-0-0-
827-0 2-43-4-2005-3-4372-
9338-61.72-271-3-3128-0-0-
average9204.49.92-107-3-1336-2-1235-
Source: Author’s elaboration.
Table 5. Summary of indicators for individual investments, highlighting the highest values (in bolds).
InvestmentNoIndicator
1 WZ2 WDs3 WK4 WS5 WB6 WU7 WD
A10.5633.440.010.290.0100.73
the prestigious investments40.5517.480.010.09-0.070.41
50.33.71.270.330.0100.35
70.396.30.140.330.010.10.47
100.325.320.010.0900.150.87
110.281.870.030.140.0100.23
B20.497.810.010.2300.150.16
the less prestigious investments30.4319.410.010.180.020.590.71
60.4119.55000.090.180.73
80.522.50.010.1700.10.82
90.237.600.3100.111
Source: Author’s elaboration.
Table 6. Summary statistics table for prestigious and less prestigious investments.
PRESTIGIOUS INVESTMENTS LESS PRESTIGIOUS INVESTMENTS
IndicatorMeanMedianSDRSDMeanMedianSDRSD
WB0.006670.010.0051640.77460.0220 0.000 0.03899 1.7721
WD0.510.440.24230.47510.684 0.730 0.3145 0.4598
WDs11.3525.8112.1311.068711.374 7.810 7.69930.6769
WK0.2450.020.50472.060.00800 0.0100 0.008367 1.0458
WS0.2120.2150.11740.55450.196 0.230 0.1193 0.6086
WU0.05330.0350.063770.19570.226 0.150 0.2060 0.9114
WZ0.40.3550.12570.31420.416 0.430 0.1130 0.2718
Source: Author’s elaboration.
Disclaimer/Publisher’s Note: The statements, opinions and data contained in all publications are solely those of the individual author(s) and contributor(s) and not of MDPI and/or the editor(s). MDPI and/or the editor(s) disclaim responsibility for any injury to people or property resulting from any ideas, methods, instructions or products referred to in the content.

