Article

Rethinking National Competitiveness for Europe 2050: The Case of EU Countries

by
Jurgita Bruneckienė
1,*,
Ineta Zykienė
1 and
Ieva Mičiulienė
2
1
School of Economics and Business, Kaunas University of Technology, 44239 Kaunas, Lithuania
2
Faculty of Mathematics and Natural Sciences, Kaunas University of Technology, 44239 Kaunas, Lithuania
*
Author to whom correspondence should be addressed.
Sustainability 2023, 15(13), 10697; https://doi.org/10.3390/su151310697
Submission received: 3 June 2023 / Revised: 29 June 2023 / Accepted: 3 July 2023 / Published: 6 July 2023
(This article belongs to the Special Issue Economic Transition and Green Development)

Abstract

:
The EU climate policy affects the competitiveness of both the European Union (EU) as a whole and individual member states, leading countries to search for new knowledge to increase their national competitiveness. However, there has been little empirical research about the implementation of green competitive strategies in the common European space from different countries’ perspectives. Using the Porter Hypothesis and system theory, this paper explores national competitive strategies that align with climate neutrality in the EU. We used index construction, clusterization, principal components analysis and trajectories change analysis to analyze data from the 24 EU countries from a 10-year period (2012–2021). The main findings reveal three green competitiveness profiles and five green competitiveness progress strategies in the EU. We found that EU countries have different strategies and conditions in terms of their transition towards climate neutrality and competitiveness, which ultimately lead to different rates of progress. Our results provide an initial basis for the development of nation-specific policies to achieve green competitiveness.

1. Introduction

The EU aims to be competitive and climate-neutral by 2050 [1]. By combining competitiveness and climate neutrality, the EU seeks to simultaneously achieve economic prosperity and environmental sustainability. Such a transition would foster a sustainable and low-carbon economy that not only addresses the urgent challenge of climate change but also ensures long-term economic growth, job creation, and resilience in the face of global environmental and economic transitions. A trade-off between environmental quality and economic growth no longer dominates research or policy narratives and simultaneous targets are identified for growth, sustainability and societal development [2].
Despite the strong commitment that the EU is making, through various communications and recommendations to climate neutrality in the common European space, there are still strong divergences between the results obtained by different countries [3,4,5,6]. Giannakitsidou et al. [4] found divergences between Western and Eastern Europe. Škrinjarić [5] found divergences between countries, according to differences in GDP per capita, infrastructure, education, and research and development indicators. Furthermore, Škrinjarić [5] indicates that the most inefficient countries have increased their sustainable development efficiency scores from 2004–2016.
To solve the divergence problem, EU countries are searching for ways to fashion new green growth paths, promote green shifts [7] and allocate large amounts of funding to achieve better results in adapting to climate change and reducing and mitigating its negative effects [6]. Government intervention is seen as a particularly important factor in driving the transition toward climate neutrality in order to prevent engineering and technological barriers from obstructing the transition [8]. In setting the ambition to solve environmental problems [9], government strategies serve as a catalyst for technological and social innovations, fostering the modernization of industry and infrastructure, as well as behavior changes in society that enhance the competitiveness of businesses and the whole economy globally.
Within this context, the different strategies used by countries to achieve competitive and climate-neutral economies offer an interesting case to investigate. Specifically, EU directives must be applicable at the same scale for all countries, and the local context is essential when fostering transition. This means that all EU members, which may differ in terms of national or regional systems [10], economic and social conditions and policy regimes [11,12,13], existing economic development paths [14,15], industrial structures [7] or infra-system architectures [16], have to achieve the same goal. However, the transitions from one system to another are often very challenging as existing socio-economic systems, which are often embedded and anchored in specific technologies, infrastructures, institutions and territorial capabilities [14,17,18,19], which are not relevant to the new system [16]. Economic development and competitiveness advantages are often influenced by past rounds of development, pre-existing economic structures, organisational support structures, institutional set-ups, and natural assets [7]. This means that existing national socio-economic systems do not often automatically lead to new socio-economic systems, and each country may use different strategies in different periods of time to achieve the common EU goal of becoming competitive and climate-neutral. In some cases, existing socio-economic systems may become a trap for green transformation. Klitkou et al. [20,21] defined this situation as a ‘lock-in mechanism’ and observed that there could be interactions between lock-in mechanisms, such as between learning effects, network externalities, and technological interrelatedness, which reinforce each other, while other interactions could have weakening effects. Kar et al. [22] identified institutional traps, suggesting that low-income countries would not reach the middle-income or high-income level due to the poor quality of institutions. Recognizing that differences in the socio-economic systems may hamper or complicate the timely achievement of common EU goals at the planned scale by all EU members, calls for new knowledge and data about potential strategies to realize the vision of Europe in 2050. Therefore, this study poses the following research question: How can EU countries achieve climate neutrality and competitiveness? Ketels and Porter [23] also recommended a rethinking of the EU policy regarding competitiveness. New knowledge about changes in competitive metrics in EU countries will allow a more accurate reinterpretation of competitive strategies in turbulent scenarios [24].
Much research is being performed on countries’ development paths [14,16,17,18], the progress of geographic sustainability transitions [25], and transformative innovation policies [26]. Various economic shocks, such as the COVID-19 pandemic and the Russian–Ukraine war, has led to a new trend in research: climate change and resilience. For example, Kotseva–Tikova and Dvorak [6] analyzed the green transformation and stabilization of EU member states’ economies after the economic slowdown caused by COVID-19, and found that these countries need to take further actions to reduce greenhouse gas emissions. According to Škrinjarić [5] and Hansen, and Coenen [25], there is a need for more systematic research into how place specificity and scale influence transition processes. Theories, strategies, and practices were initially developed in and applied to developed economies, resulting in a lack of knowledge of how they might work in developing and emerging economies. Although there is a wide consensus that place-specificity matters, there is still little generalizable knowledge about how place specificity matters for transitions [25].
We use the Porter Hypothesis (PH) [27,28] and system theory to investigate the competitiveness of countries. The Porter Hypothesis states that the conflict between environmental protection and economic competitiveness is a false dichotomy, and that strict environmental regulation may generate, rather than hamper, competitive advantage. In alignment with this approach, we define climate neutrality or environmental impact as an endogenous factor of competitiveness and define the green competitiveness of a country as economic (and social) competitiveness, thus leading to an overall reduction in environmental impact (neutrality). The system theory posits that all phenomena can be understood as systems composed of interconnected components that interact both with each other and with their environment.
This paper makes several important contributions. Firstly, the paper contributes to evolutionary economic geography and policy literature, and expands the competitiveness concept by treating environmental performance as an endogenous factor, and clarifies the definition of green competitiveness according to the nature of the relationship between economic competitiveness and climate neutrality. This approach is in alignment with the Europe 2050 vision. Secondly, the paper provides five possible green competitive strategies in the European Union. Thirdly, this paper provides original empirical evidence which may be useful for policymakers creating transformative innovation policies, in order to ensure the progress of coherent geographic sustainability transitions.
The paper is organized as follows. The literature review section presents presents a theoretical analysis of green competitiveness. The research methodology is then introduced. The research results section presents the key findings of the empirical research. The paper ends with a discussion of the results, and the conclusions drawn from them.

2. Literature Review

2.1. Transformations in the Concept of Competitiveness

The concept of territorial competitiveness is gaining an increasing role in both academic and political-strategic literature, gradually becoming a central theme in governance of the transformation of territories by administrators and decision-makers [29]. As the importance of the concept has grown, the content of the concept has also expanded with various additional factors having been embraced. The evolution of the concept of competitiveness began with a strong relationship with industrialization, infrastructure development, technology, and innovations, and continued with the intensified role of intellectual capital and the creative economy, ‘soft’ factors, networking and collaboration. The focus of the competitiveness concept has also changed, along with its mission. Following [30] and [31], the core focus shifted from pure economics to a more holistic perspective, involving additional concepts of wellbeing and sustainability. Sgambati [32] found a strong relationship between urban competitiveness and the ability of a city to tackle future challenges, such as climate change, social challenges, resilience, and so on; the ability to adapt to external changes is crucial to developing a competitive advantage, as it allows threats to be transformed into opportunities.
Environmental concerns have also led to significant changes in the concept, attitude, and strategies of competitiveness. In 2015, the World Economic Forum extended its definition of competitiveness to encompass sustainability, defining ‘sustainable competitiveness’ as the set of institutions, policies and factors that make a nation productive over the longer term, while ensuring social and environmental sustainability [30]. Criticism of traditional economic indicators, such as GDP for offering limited insight into sustainability [31], has led researchers [2,32,33] to apply comprehensive, integrated and holistic approaches to the assessment of competitiveness, and to include sustainability adjustments, including both social and environmental elements, as factors in competitiveness.
Improvements in quality of life and the achievement of sustainable development goals are the dominant objectives of increasing the competitive advantage of a city in all countries, especially in Europe [32]. Two closely related concepts, sustainable competitiveness and green competitiveness, have increasingly aroused scientific interest. Sustainable competitiveness is an umbrella concept that takes a more comprehensive approach to competitiveness, including the economic, social, and environmental aspects of sustainable development, as well as responsible governance. Meanwhile, green competitiveness puts more focus on economic and environmental goals, more precisely reducing carbon emissions or the transition to a low-carbon economy. However, both these concepts focus on long-term competitiveness and well-being. It is important to note that sustainable competitiveness and green competitiveness are not mutually exclusive, and companies, organizations and institutions often pursue both objectives to varying degrees. Table 1 illustrates the main differences between these two concepts; it should be noted that, due to high interdependency between the two concepts, the criteria can overlap.
The PH states that countries that stick with resource-wasting methods and forgo environmental standards because they are “too expensive” will remain uncompetitive, relegating themselves to poverty [27]. The more stringent policies trigger greater investment in developing new pollution-saving technologies, which induce higher costs for domestic firms in the short run, but the induced innovation will generate economic benefits in the long run by providing domestic firms with a competitive advantage over foreign firms (which will later be constrained by the same regulations) [27]. Several studies [36,37,38,39] have proved the PH and found positive effects of innovation on business performance and improved firm resource efficiency on profitability; however, there is a lack of research on whether the first-mover advantage actually leads to improvements in competitiveness in the long run [40].
Policies that promote green growth must be founded on a good understanding of the determinants of green growth and of related trade-offs or synergies [41]. Green competitiveness can be simply defined [33,41] as the ability of a country to maintain or improve its economic performance while simultaneously reducing environmental pressures and contributing to the transition of a low- or zero-carbon economy, or as [1] the ability of a country to provide goods and services that satisfy human needs and improve quality of life while reducing the use of natural resources, the impact on the environment and the emission of greenhouse gases. These definitions combine economic competitiveness with climate neutrality, and limited explanations of the nature of this relationship are provided. The main focus is on ways of achieving green competitiveness, which are highly variegated [7]. Meanwhile, Geyer [42] explained the concept of green business by contributing the ‘net green’ approach. A business activity is net green if it leads to an overall reduction in environmental impact. By adopting the Geyer [42] idea of ‘net green’ at the macro-level, we specify the definition of green competitiveness according to the nature of the relationship between economic competitiveness and climate neutrality. We define the green competitiveness of a country as the ability to maintain or improve its economic performance while achieving a general reduction in environmental impact.

2.2. The Impact of Place Specificity on Green Competitiveness

Green or sustainable competitiveness is influenced by a multitude of factors, and understanding these factors and their effect on competitiveness can change over time. As knowledge, technology, and societal priorities evolve, the thinking of strategists and policy makers regarding green competitiveness also evolves. New insights, research findings, and emerging trends can shape the strategies and policies implemented to enhance sustainability and competitiveness. Comparative, competitive, and collaborative advantages provide rise to a wide range of policy tools and changes in strategies and plans [43]. It is widely recognized that economic development [18,19] and green competitiveness [44], as well as sustainability transitions [25], are influenced by place specificity. Contextual factors, such as the political environment, innovation, industrial competitiveness, the anticipatory knowledge of local transition managers about transition processes, informal localized institutions, innovation system structures, natural resource endowments, technological and industrial specialization, consumers and local market formation, place-specific norms and values, and many others, have important influences on the geographically uneven landscape of sustainability transition and green competitiveness. Economic development and competitiveness strategies have mainly been analyzed in research related to evolutional economic geography. Martin and Sunley [14] identified strategies based on natural resources, local assets and infrastructure, industrial specialization, technology, economies of agglomeration, regionally specific institutions, social forms and cultural traditions, and interregional linkages; notably, regions may thus employ multiple development strategies. However, it is important to understand that competitiveness goes beyond these indicators or goals [45]. Existing capabilities are the key indicator of future comparative advantages in the green economy [44]. The idea of ‘creative destruction’, where new ideas drive out the old [46], is central to the type of transformative growth that the green economy discourse espouses [44]. Following Trippl et al. [7] and Fankhauser et al. [44], we treat a country’s competitiveness as a reflection of the country’s capability to decouple economic growth from environmental degradation and, at the same time, remain a competitive economy.
The past decade has seen a particularly rapid increase in research combining national development strategies and the transition to green or sustainable development, producing heterogeneous results in terms of progress [3,4,5,6,47,48] and different ways of achieving it, such as renewal, diversification, importation, and creation [7]. Despotovic et al. [49] stated that post-transition European countries have a lower level of sustainable competitiveness and that heterogeneity also applies to the rest of Europe. Wang and Feng [50] demonstrated that the transition to green development in China is possible but is still progressing at a slow pace.
Global climate policies play an important role in reducing carbon dioxide emissions [47] and many countries have formulated relevant strategies and different policy instruments based on their own or international needs. Zheng et al. [47] also found that different policy instruments have varying levels of performance in reducing carbon dioxide emissions and that while policy effectiveness varies across countries, it is generally higher in developing countries. These heterogeneous findings on the effectiveness of climate policy and competitiveness among different countries demand new knowledge about the possibility of achieving the shared Europe 2050 vision, given the significant differences between specific countries. According to Zheng et al. [47], when a country intends to launch a climate policy which aims to mitigate climate change, it should carefully consider its unique circumstances rather than seeking to replicate the policies adopted by other nations.
Various methods can be used to measure the green (sustainable) competitiveness of a country; however, indices are generally used (for example, the environmental performance index [48] or the green innovation index [44]). These indices, as strategic indicators, reflect the quality of the business environment and influence investors’ decisions about entering markets in the indexed country [51]. The idea of the index method, in this case, is to select universal and relevant indicators for all studied countries, calculate each country’s performance for each indicator, index them, and rank them according to the index. All of the important indicators are included in the index function, and the countries can be ranked and compared with each other based on the index results. The index system is necessary to speed up the reform of the system and develop an ecological civilization [52].

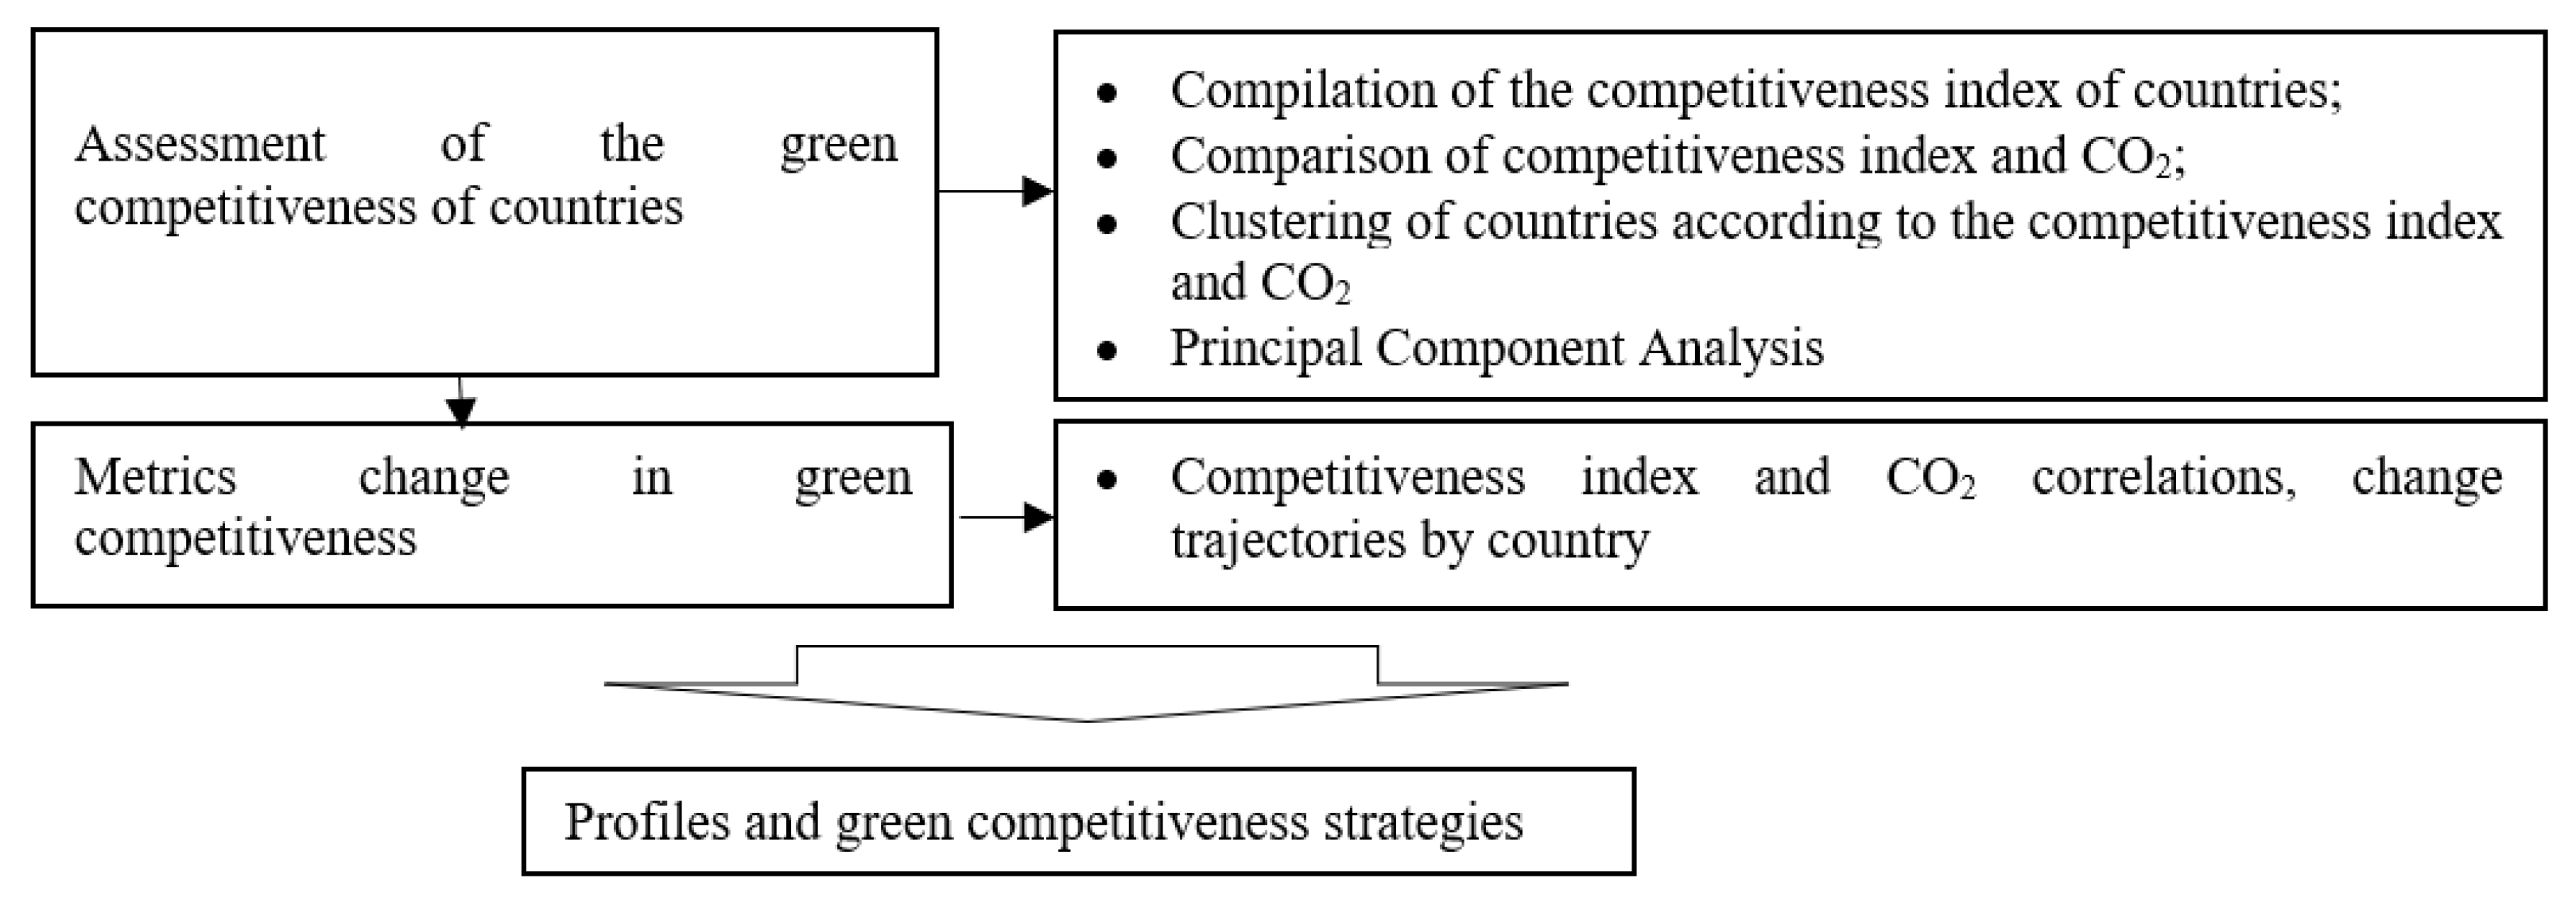
3. Research Methodology and Data

This section presents the data and methodology used to analyze the impact of EU climate policy on national competitiveness and find strategies to achieve the Europe 2050 vision, which accounts for differences between specific countries.
The research methodology used for impact analysis and the identification of strategies is presented in Figure 1.
The research period was 10 years (2012–2021). The units of research were 24 EU countries, having excluded Malta, Luxembourg, and Cyprus due to data limitations. Data was sourced from Eurostat, the World Bank, and Transparency International.
The conceptual framework for the compilation of the competitiveness index was based on the global competitiveness index (GCI) devised by the World Economic Forum (WEF) [8]; however, we focus on the objective (hard) data. We did not include valuations from opinion surveys given to business executives and/or entrepreneurs of countries (soft data), as the methodology of WEF-GCI does. We constructed the competitiveness index from seven groups of factors (pillars) determining competitiveness: (1) institutions, (2) basic and IT infrastructure (combining pillars 2 and 9 of WEF-GCI), (3) macroeconomic environment and market size (combining pillars 3 and 10 of WEF-GCI), (4) health and education (combining pillars 4 and 5 of WEF-GCI), (5) labor market efficiency, (6) innovation, and (7) climate-neutral environment (a new pillar with no equivalent in WEF-GCI). A total of 50 factors were split between these seven pillars. We excluded pillars 6, 8 and 11 from the WEF-GCI due to data availability limitations. The missing values (total 4.93 %) in the data matrix were filled using the Multiple Imputation by Chained Equations (MICE) method. The Pearson correlation coefficient was used to test for correlation between indicators; highly correlated indicators (more than 0.8 or less than −0.8) were removed from the data matrix and a total of 43 indicators remained (a of total 10560 observations). The data matrix and descriptive statistics of the indicators are included in Appendix A and Appendix B. The panel data were strongly balanced; to comply with stationarity, we tested the data sample for unit roots. The results of the Levin-Li-Chu test suggested that the variables in the data sample were stationary.
The remaining indicators were normalized using the maximum and minimum value method. The difference between one and the normalized value was used to calculate the indicators with negative influences. No weights were used to calculate the index, based on the practice of researchers [53], who equalize the importance of factors in environmental and sustainability research. Normalized values were summarized (see Formula (1)) by year, country and competitiveness indices for 10 years, and the 24 countries were ranked accordingly.
C I = W 1 I + W 2 I n f r + W 3 M a + W 4 H E + W 5 L M + W 6 I n n + + W 7 C N E
where:
  • CI—competitiveness index;
  • I—institutions;
  • Infr—basic and IT infrastructure;
  • Ma—macroeconomic environment and market size;
  • HE—health and education;
  • LM—labour market efficiency;
  • Inn—innovation;
  • CNE—climate-neutral environment;
  • Wn—weight coefficient.
Given the context, the competitiveness of a country was treated as the reflection of the country’s capability to decouple economic growth from environmental degradation and, at the same time, remain a competitive economy; ‘net green’ was evaluated by measurements of CO2 emissions, and was not included as an endogenous factor in the competitiveness index function. In the next steps, the competitiveness indices of the countries were compared with the amount of CO2 generated annually by each country. To identify common trends throughout the EU, the index values and CO2 values were clustered using different methods (k-means, hierarchical method, clustering of continuous data trajectories using the R software (version 4.1.3) library kml3d). After using different internal cluster validation methods (elbow, silhouette, Callinski Harabatz statistics), the optimal number of clusters was determined—5 (see Appendix C).
Principal components analysis (PCA) was used to determine which factors of the 43 selected were the most important for each formed cluster. Before applying the PCA procedure, a Kaisere–Meyere–Olkin (KMO) measurement of sampling adequacy and a Bartlett test for sphericity (p-value) were performed to test for partial correlation and dependence to exclude the potential non-independence of the original data, which can affect the result of a PCA. For PCA to be applicable to a data set, the KMO value should be >0.6. The result of the Bartlett test for sphericity should be significant (p < 0.05).
Metric change in green competitiveness was carried out using correlation analysis between the CO2 and the competitiveness indices of the countries in the clusters, and determining the trajectories of the countries’ competitiveness indices and CO2 emissions using the Euclidean distance method.

4. Research Results

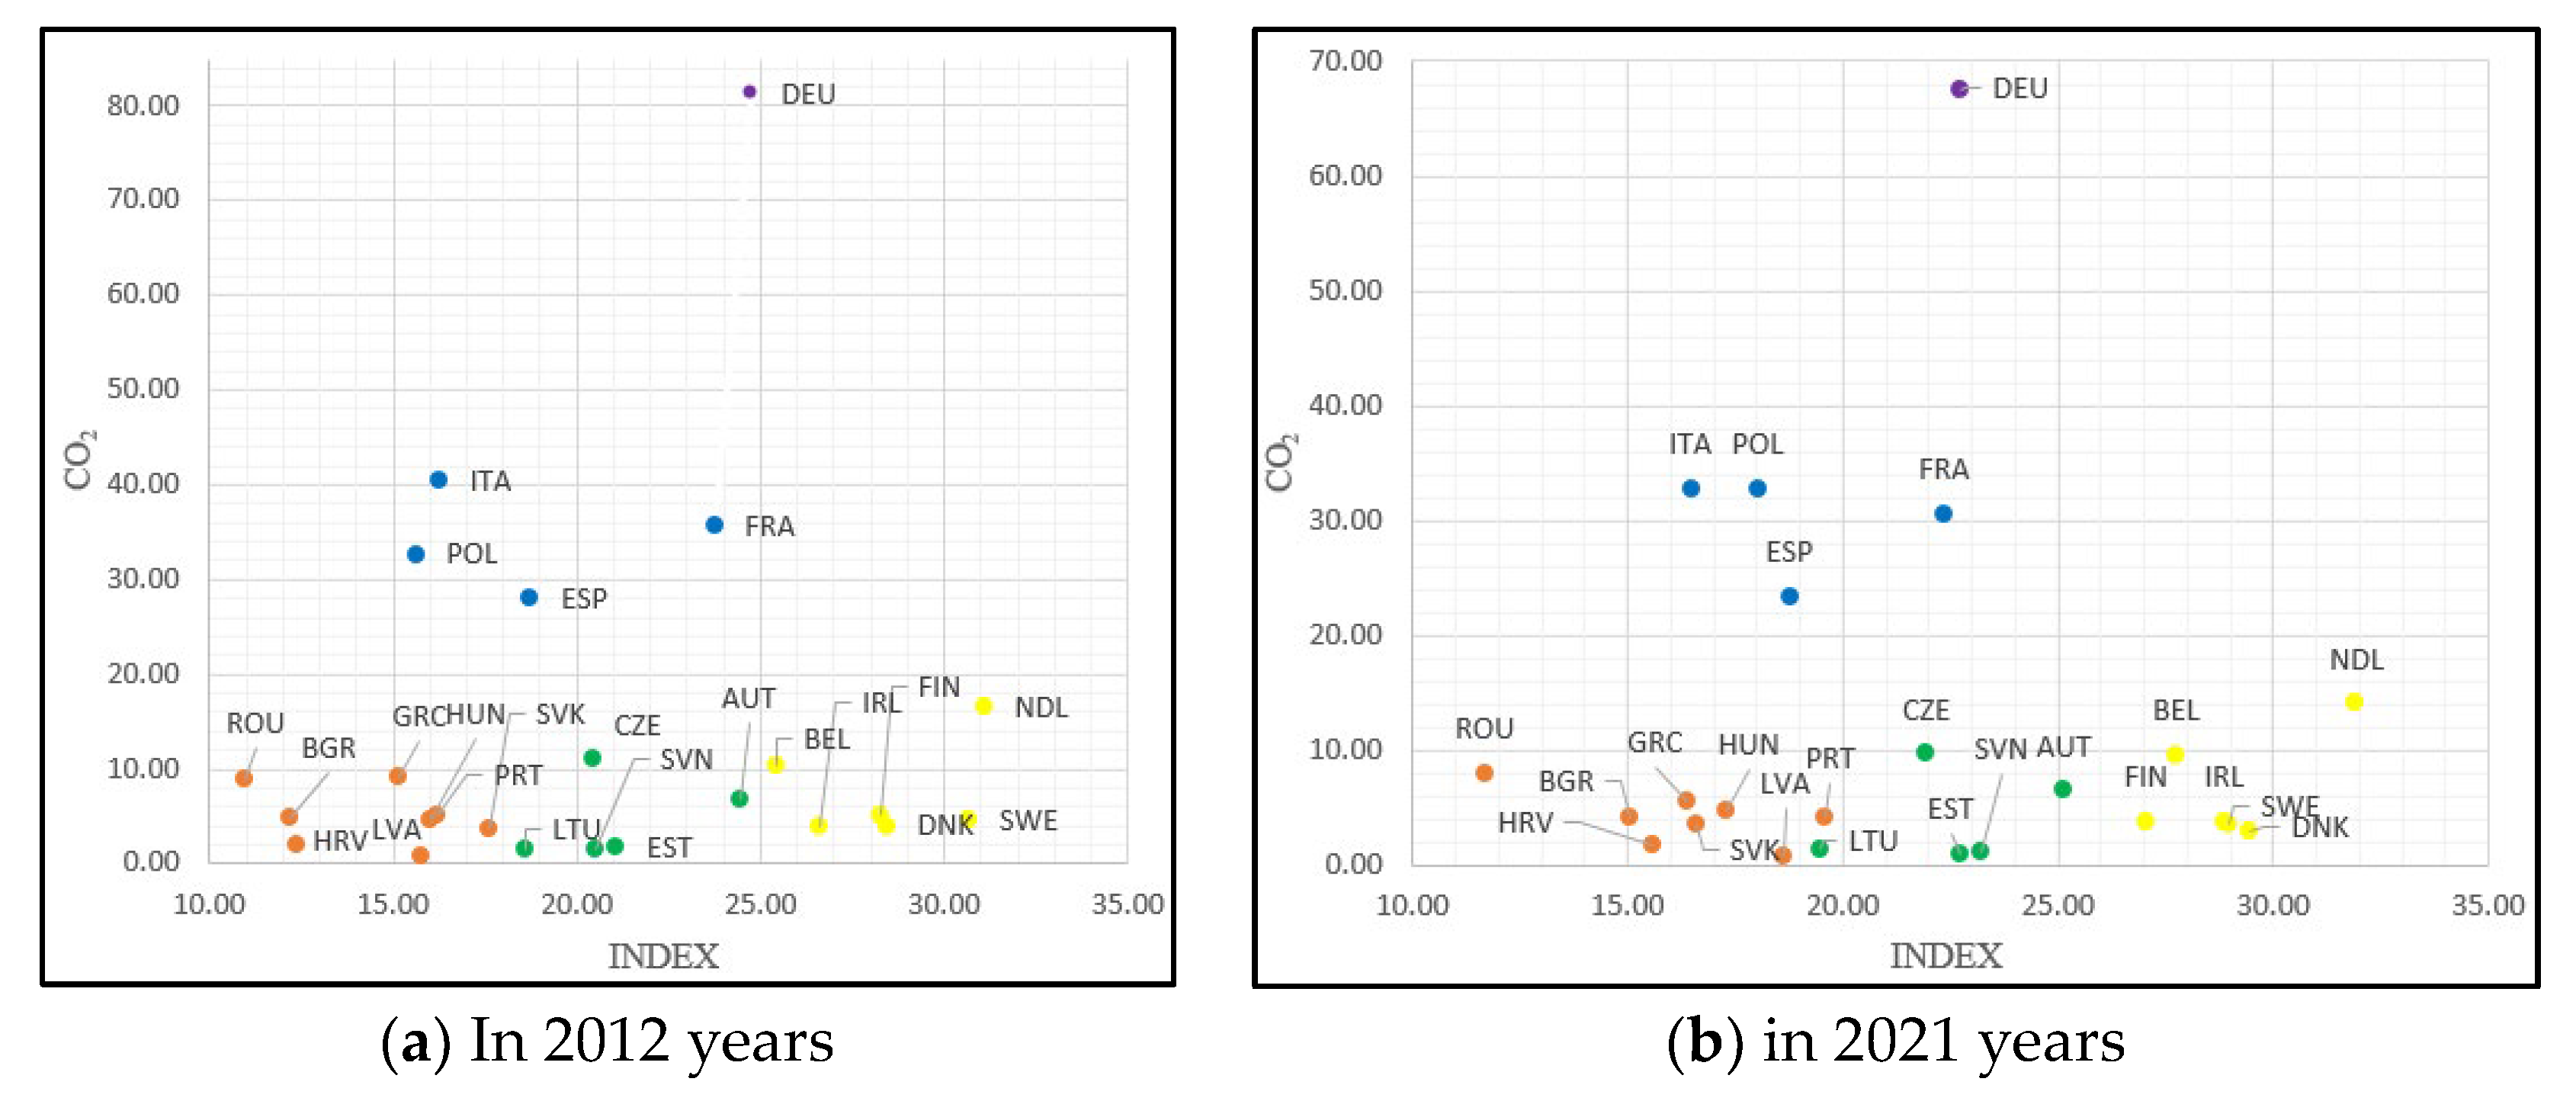
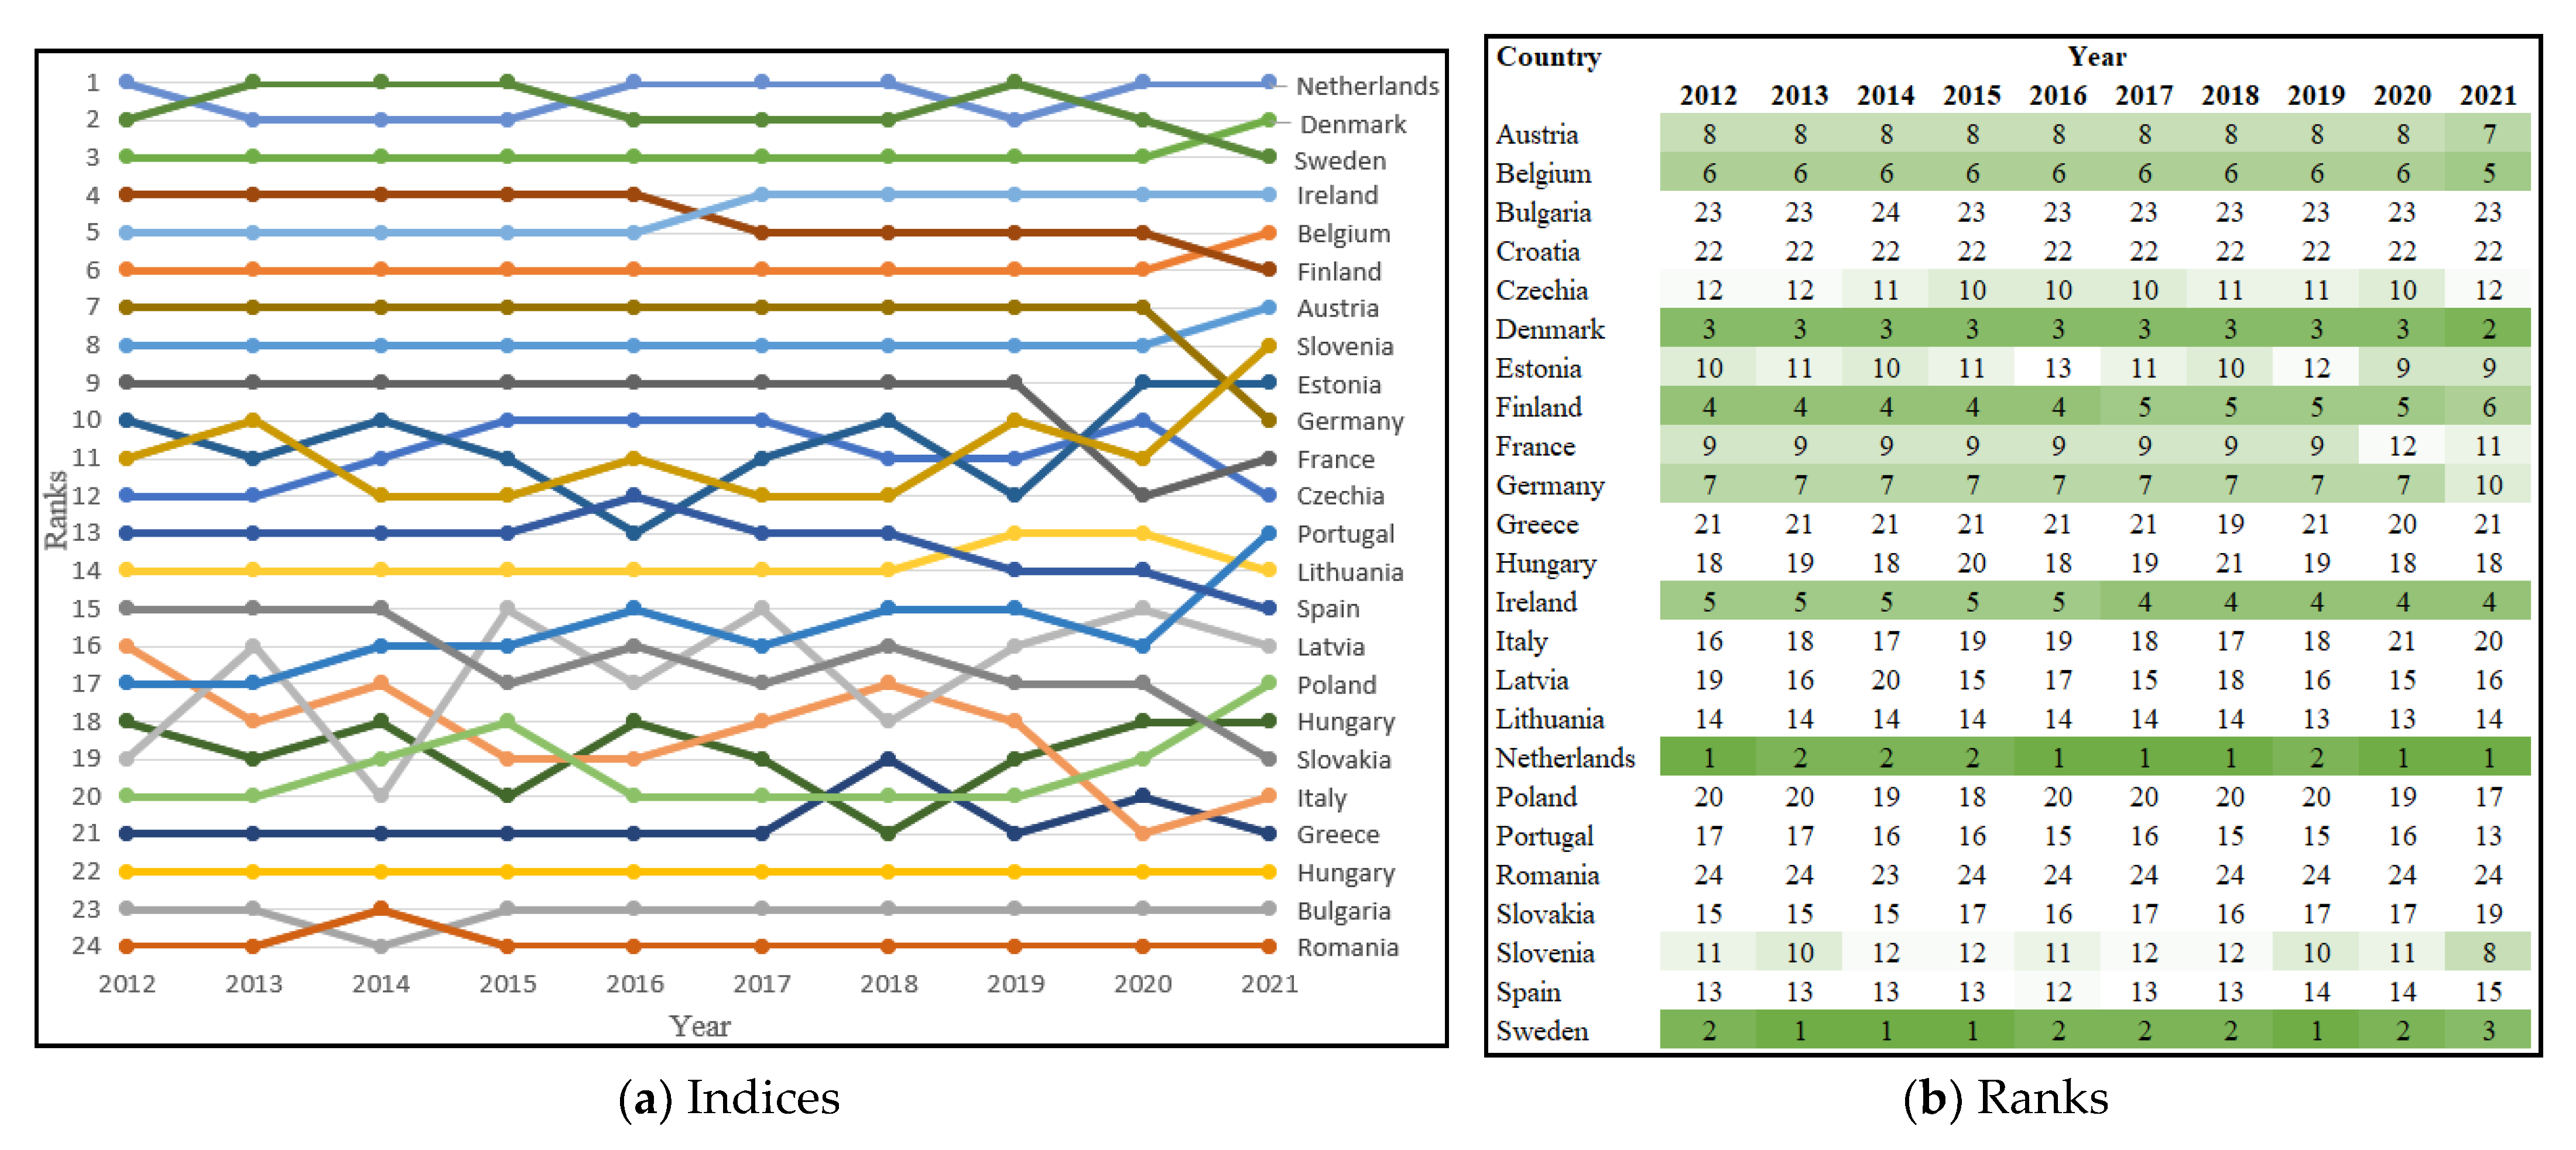
4.1. Competitiveness Index and Comparison with CO2 Results
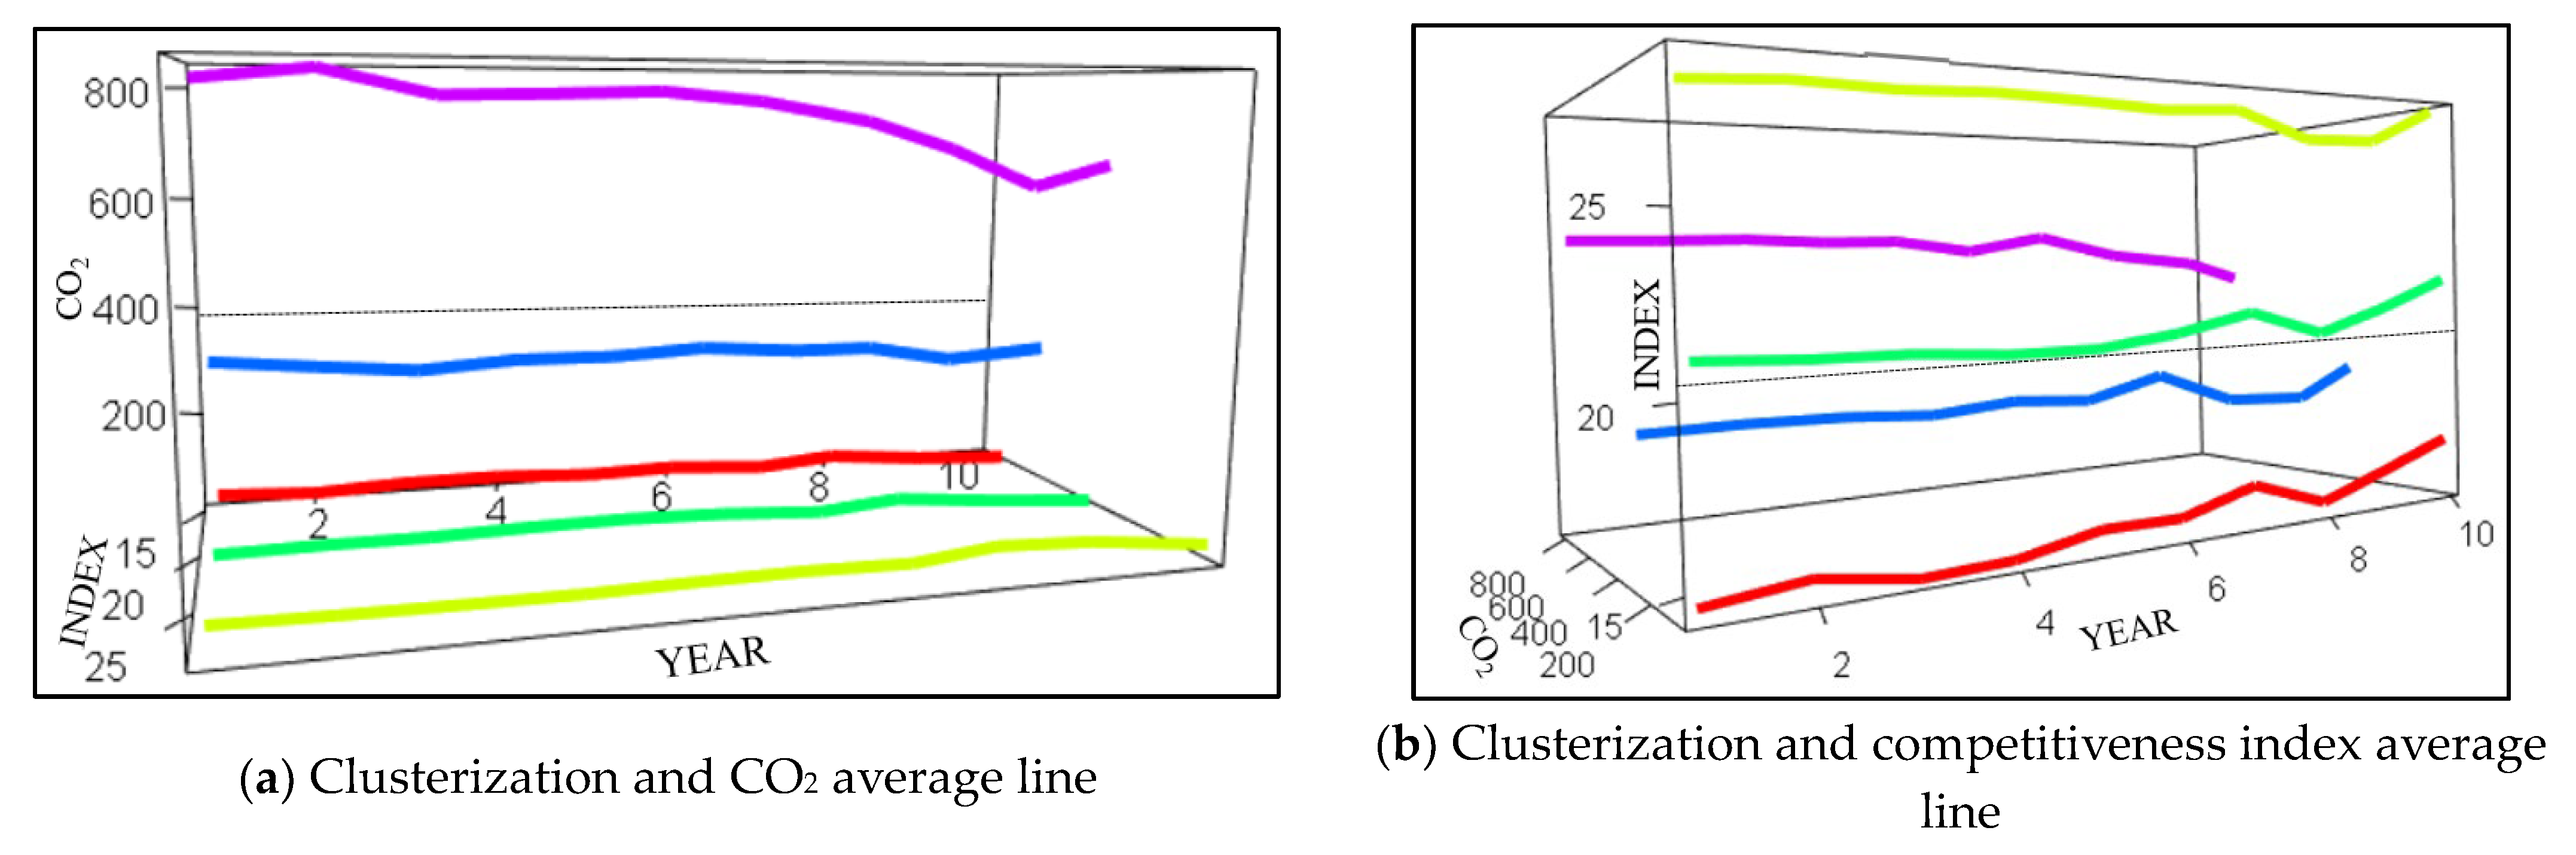
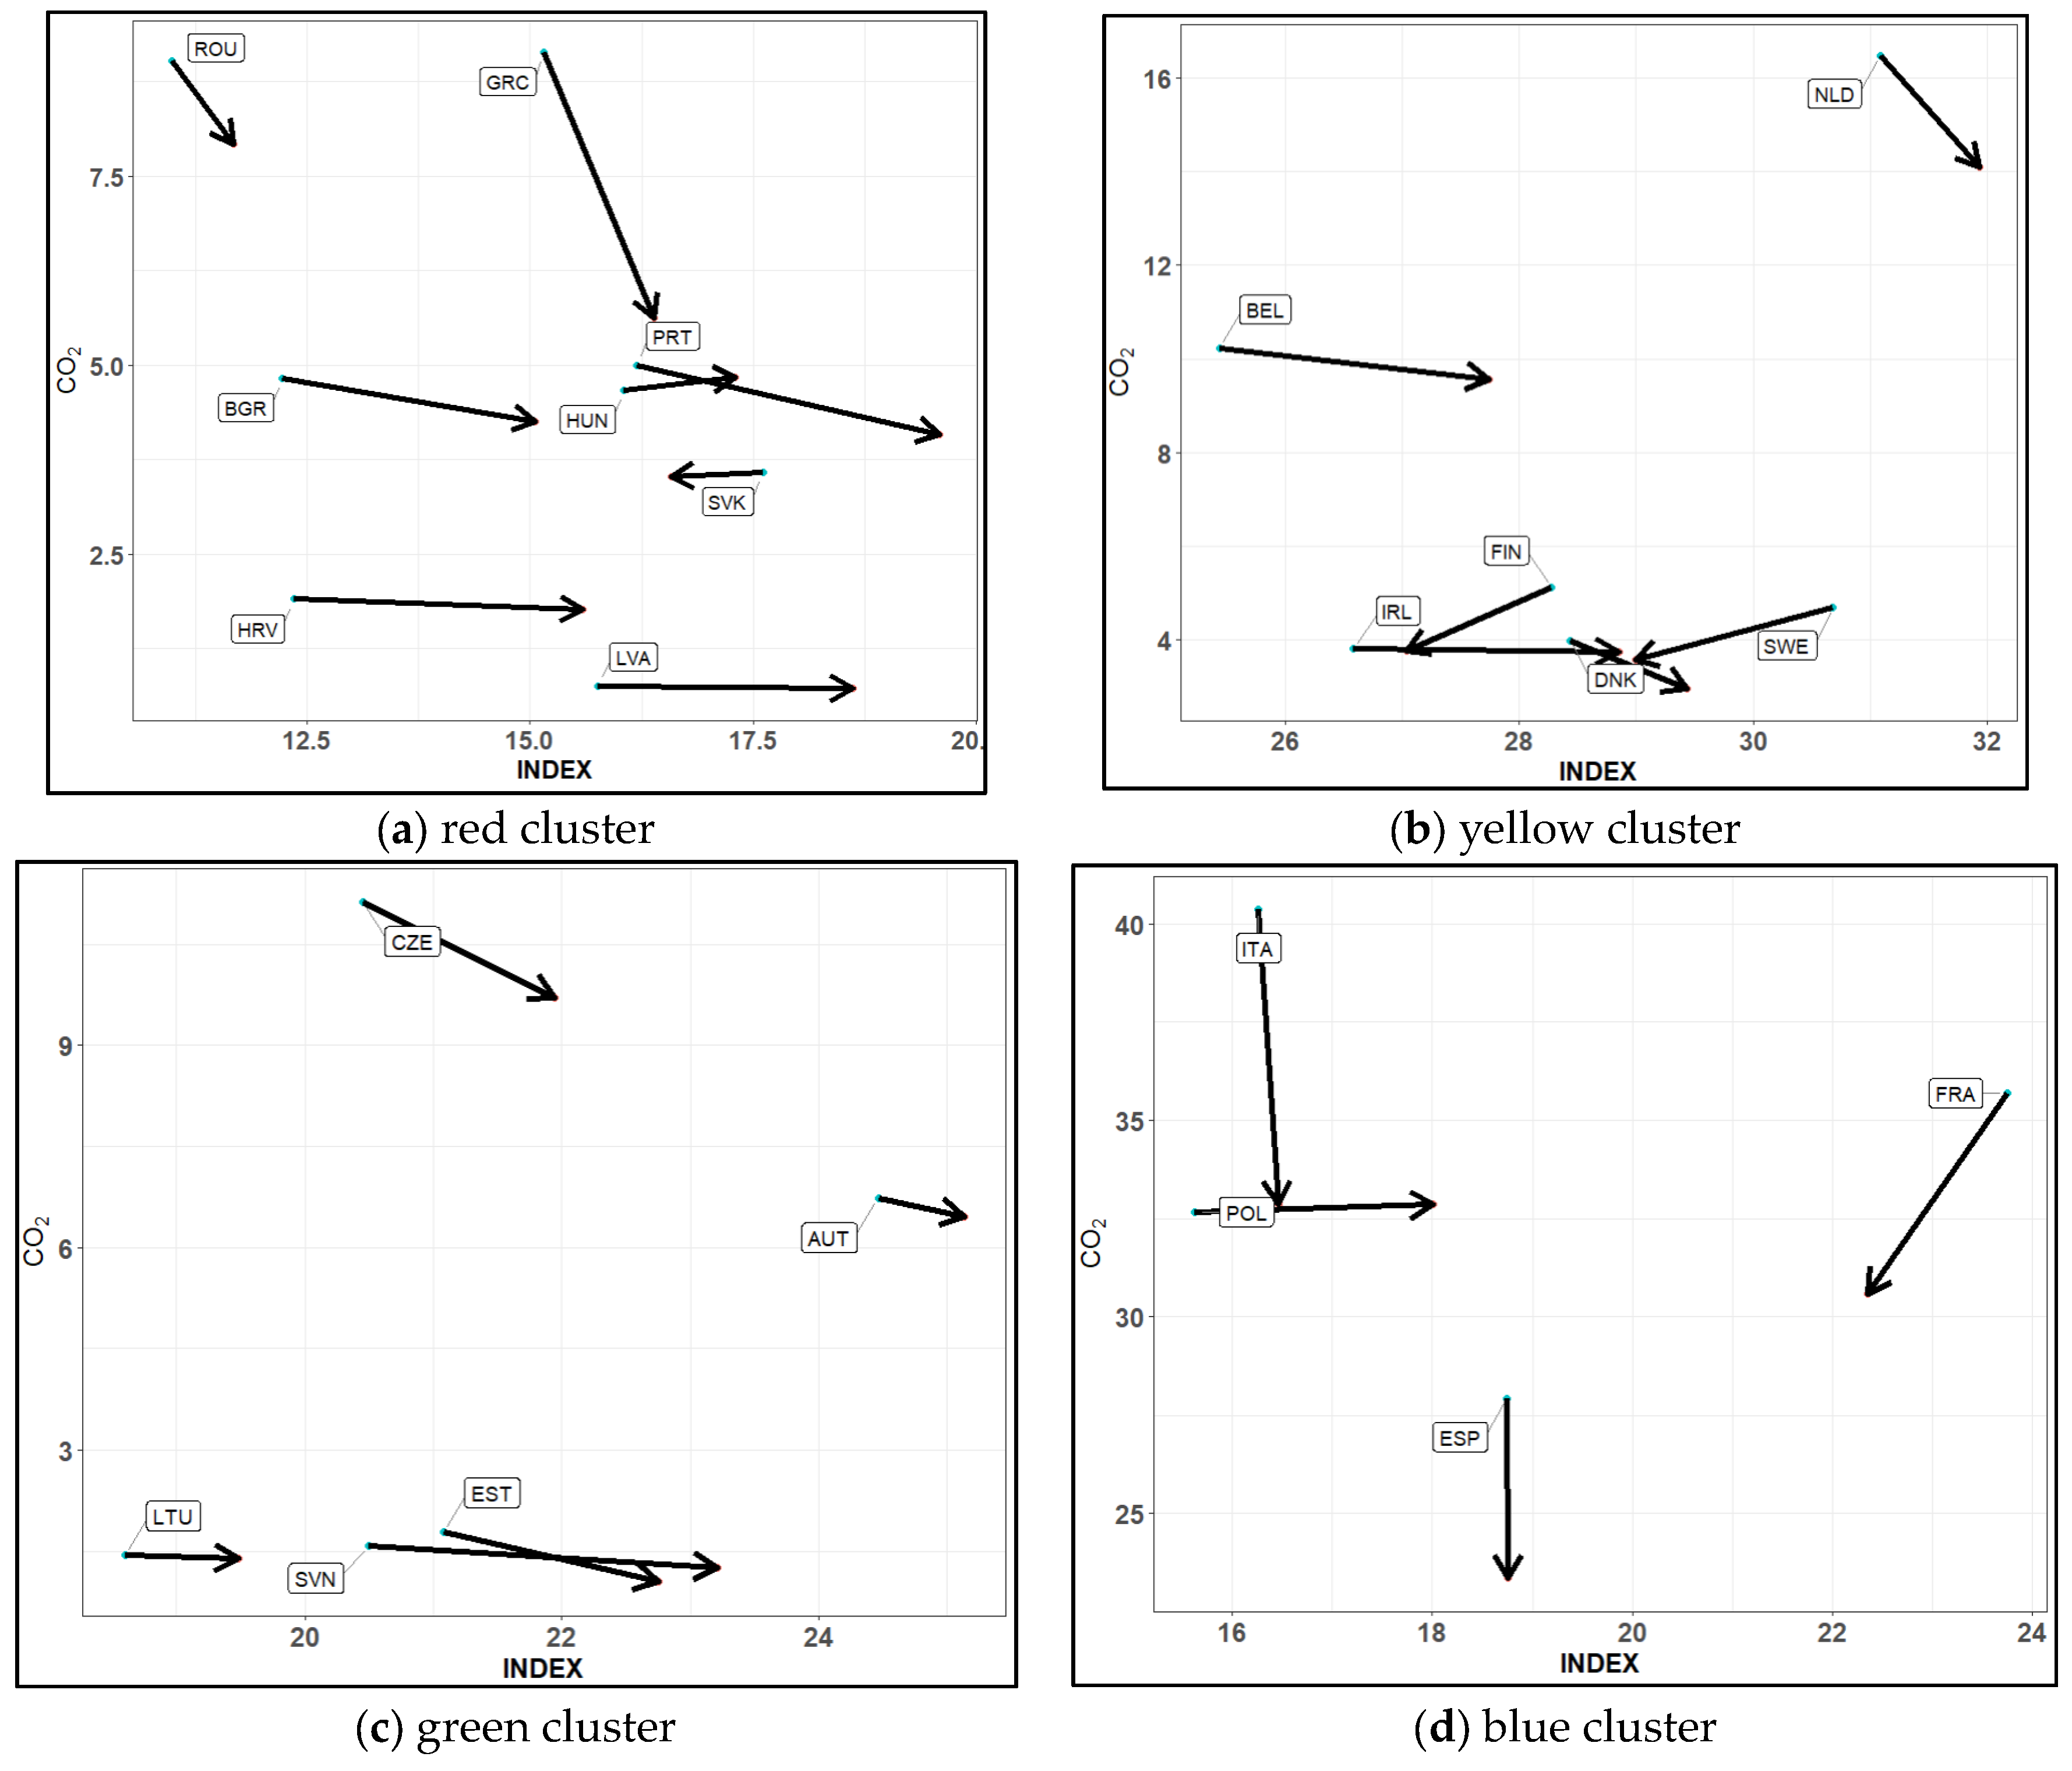
The calculation of the studied countries’ competitiveness indices and ranks for 2012–2021 (see Appendix D) revealed that countries develop unevenly in terms of competitiveness. Based on the rankings at the beginning and the end of the research period, the countries can be divided into three groups: (a) countries where competitiveness increased (these countries make up 37.5% of the researched countries, namely Austria, Belgium, Denmark, Estonia, Ireland, Latvia, Poland, Portugal, and Slovenia), decreased (these countries make up 29.2% of the countries analyzed in the study, namely Finland, France, Germany, Italy, Slovakia, Spain, and Sweden) or remained unchanged (33.3% of studied countries, namely Bulgaria, Croatia, the Czech Republic, Greece, Hungary, Lithuania, the Netherlands, and Romania).
The countries’ competitiveness indices were compared with the CO2 generated annually by each country (see Figure 2).
Comparing 2012 and 2021 (see Figure 2), an average reduction of 8% was obtained in the CO2 results. The general situation in the EU is one of positive change: EU countries are changing their economies to be more climate-neutral.

4.2. Clusterisation

To detect general trends across the EU and the relationship between competitiveness and CO2, the countries were clustered according to the competitiveness index and CO2 emissions. Five clusters were identified (see Figure 3):
  • Red cluster: Bulgaria, Greece, Hungary, Latvia, Romania, Portugal, Slovakia, Croatia;
  • Yellow cluster: Belgium, Finland, Denmark, Ireland, Netherlands, Sweden;
  • Green cluster: Austria, Czech Republic, Estonia, Lithuania, Slovenia;
  • Blue cluster: France, Italy, Poland, Spain;
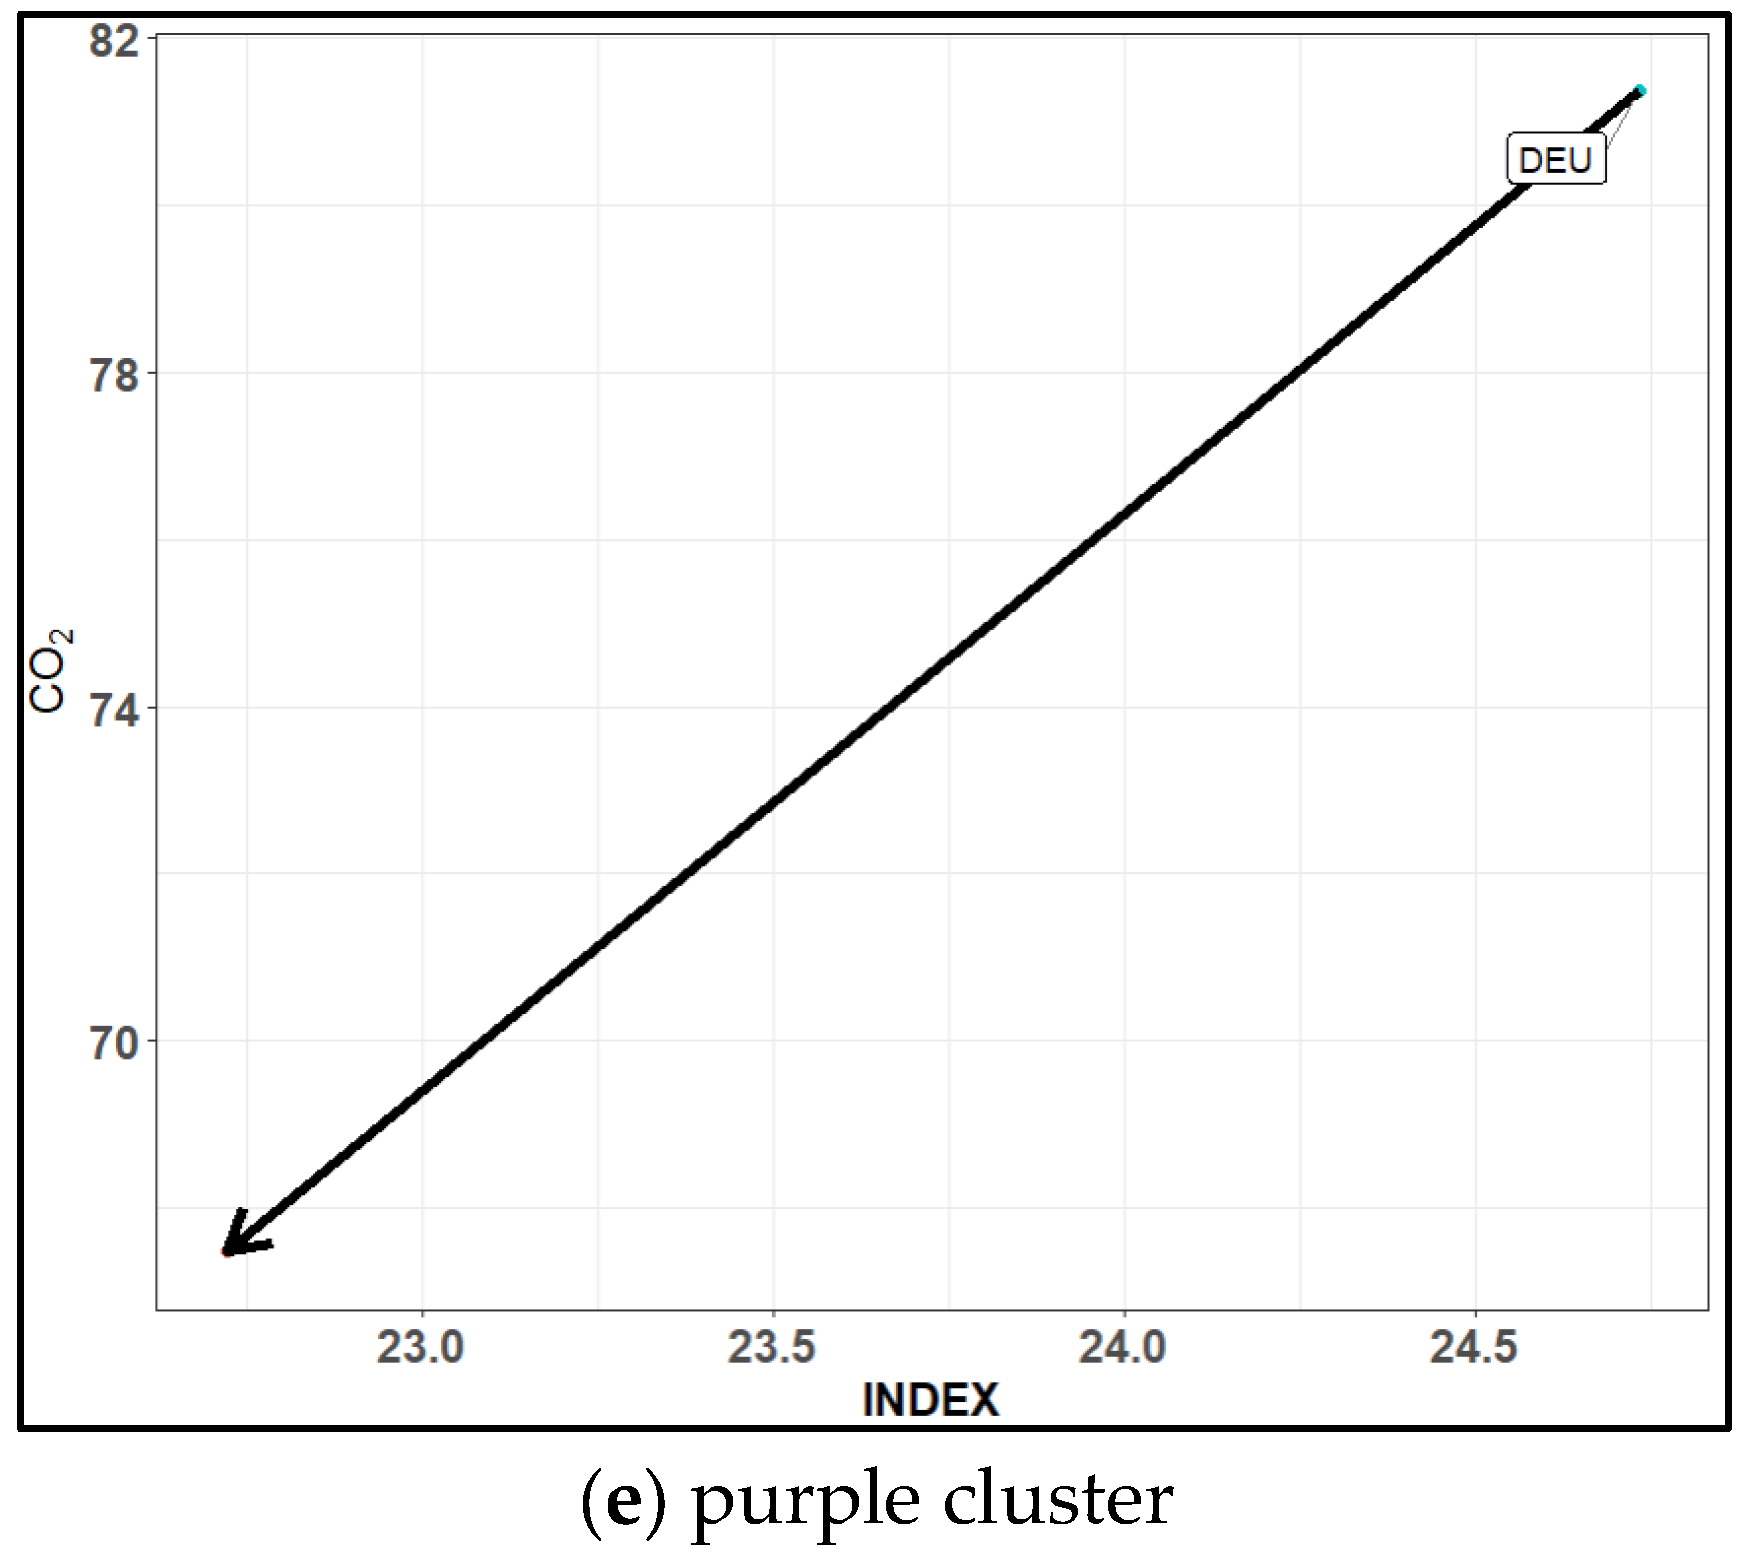
  • Purple cluster: Germany.
The competitiveness index was observed to decrease from 2018 (i.e., from the 7th period) and, depending on the cluster, this decline continued until 2019 or 2020 and then began to increase. Only the purple cluster (which contains one country, Germany) could be distinguished from this trend. In this cluster, a decreasing trend of the competitiveness index was observed from 2018, and did not change trajectory in the subsequent period. It should be noted that the CO2 level in Germany decreased quite significantly throughout the analyzed period and only began to increase in the ninth studied year (2020), when the CO2 trends of other groups were more constant or the rate of change was not so drastic.
Following [54] and based on Figure 2, we can identify three profiles of green competitiveness in the matrix of the relationship between the countries’ competitiveness index and CO2:
relatively low competitiveness and relatively low CO2 emissions (competitiveness index and CO2 values are below average);
relatively high competitiveness and relatively low CO2 emissions (competitiveness index values are above the average and CO2 values are below the average);
relatively high competitiveness and relatively high CO2 emissions (competitiveness index and CO2 values are above the average);
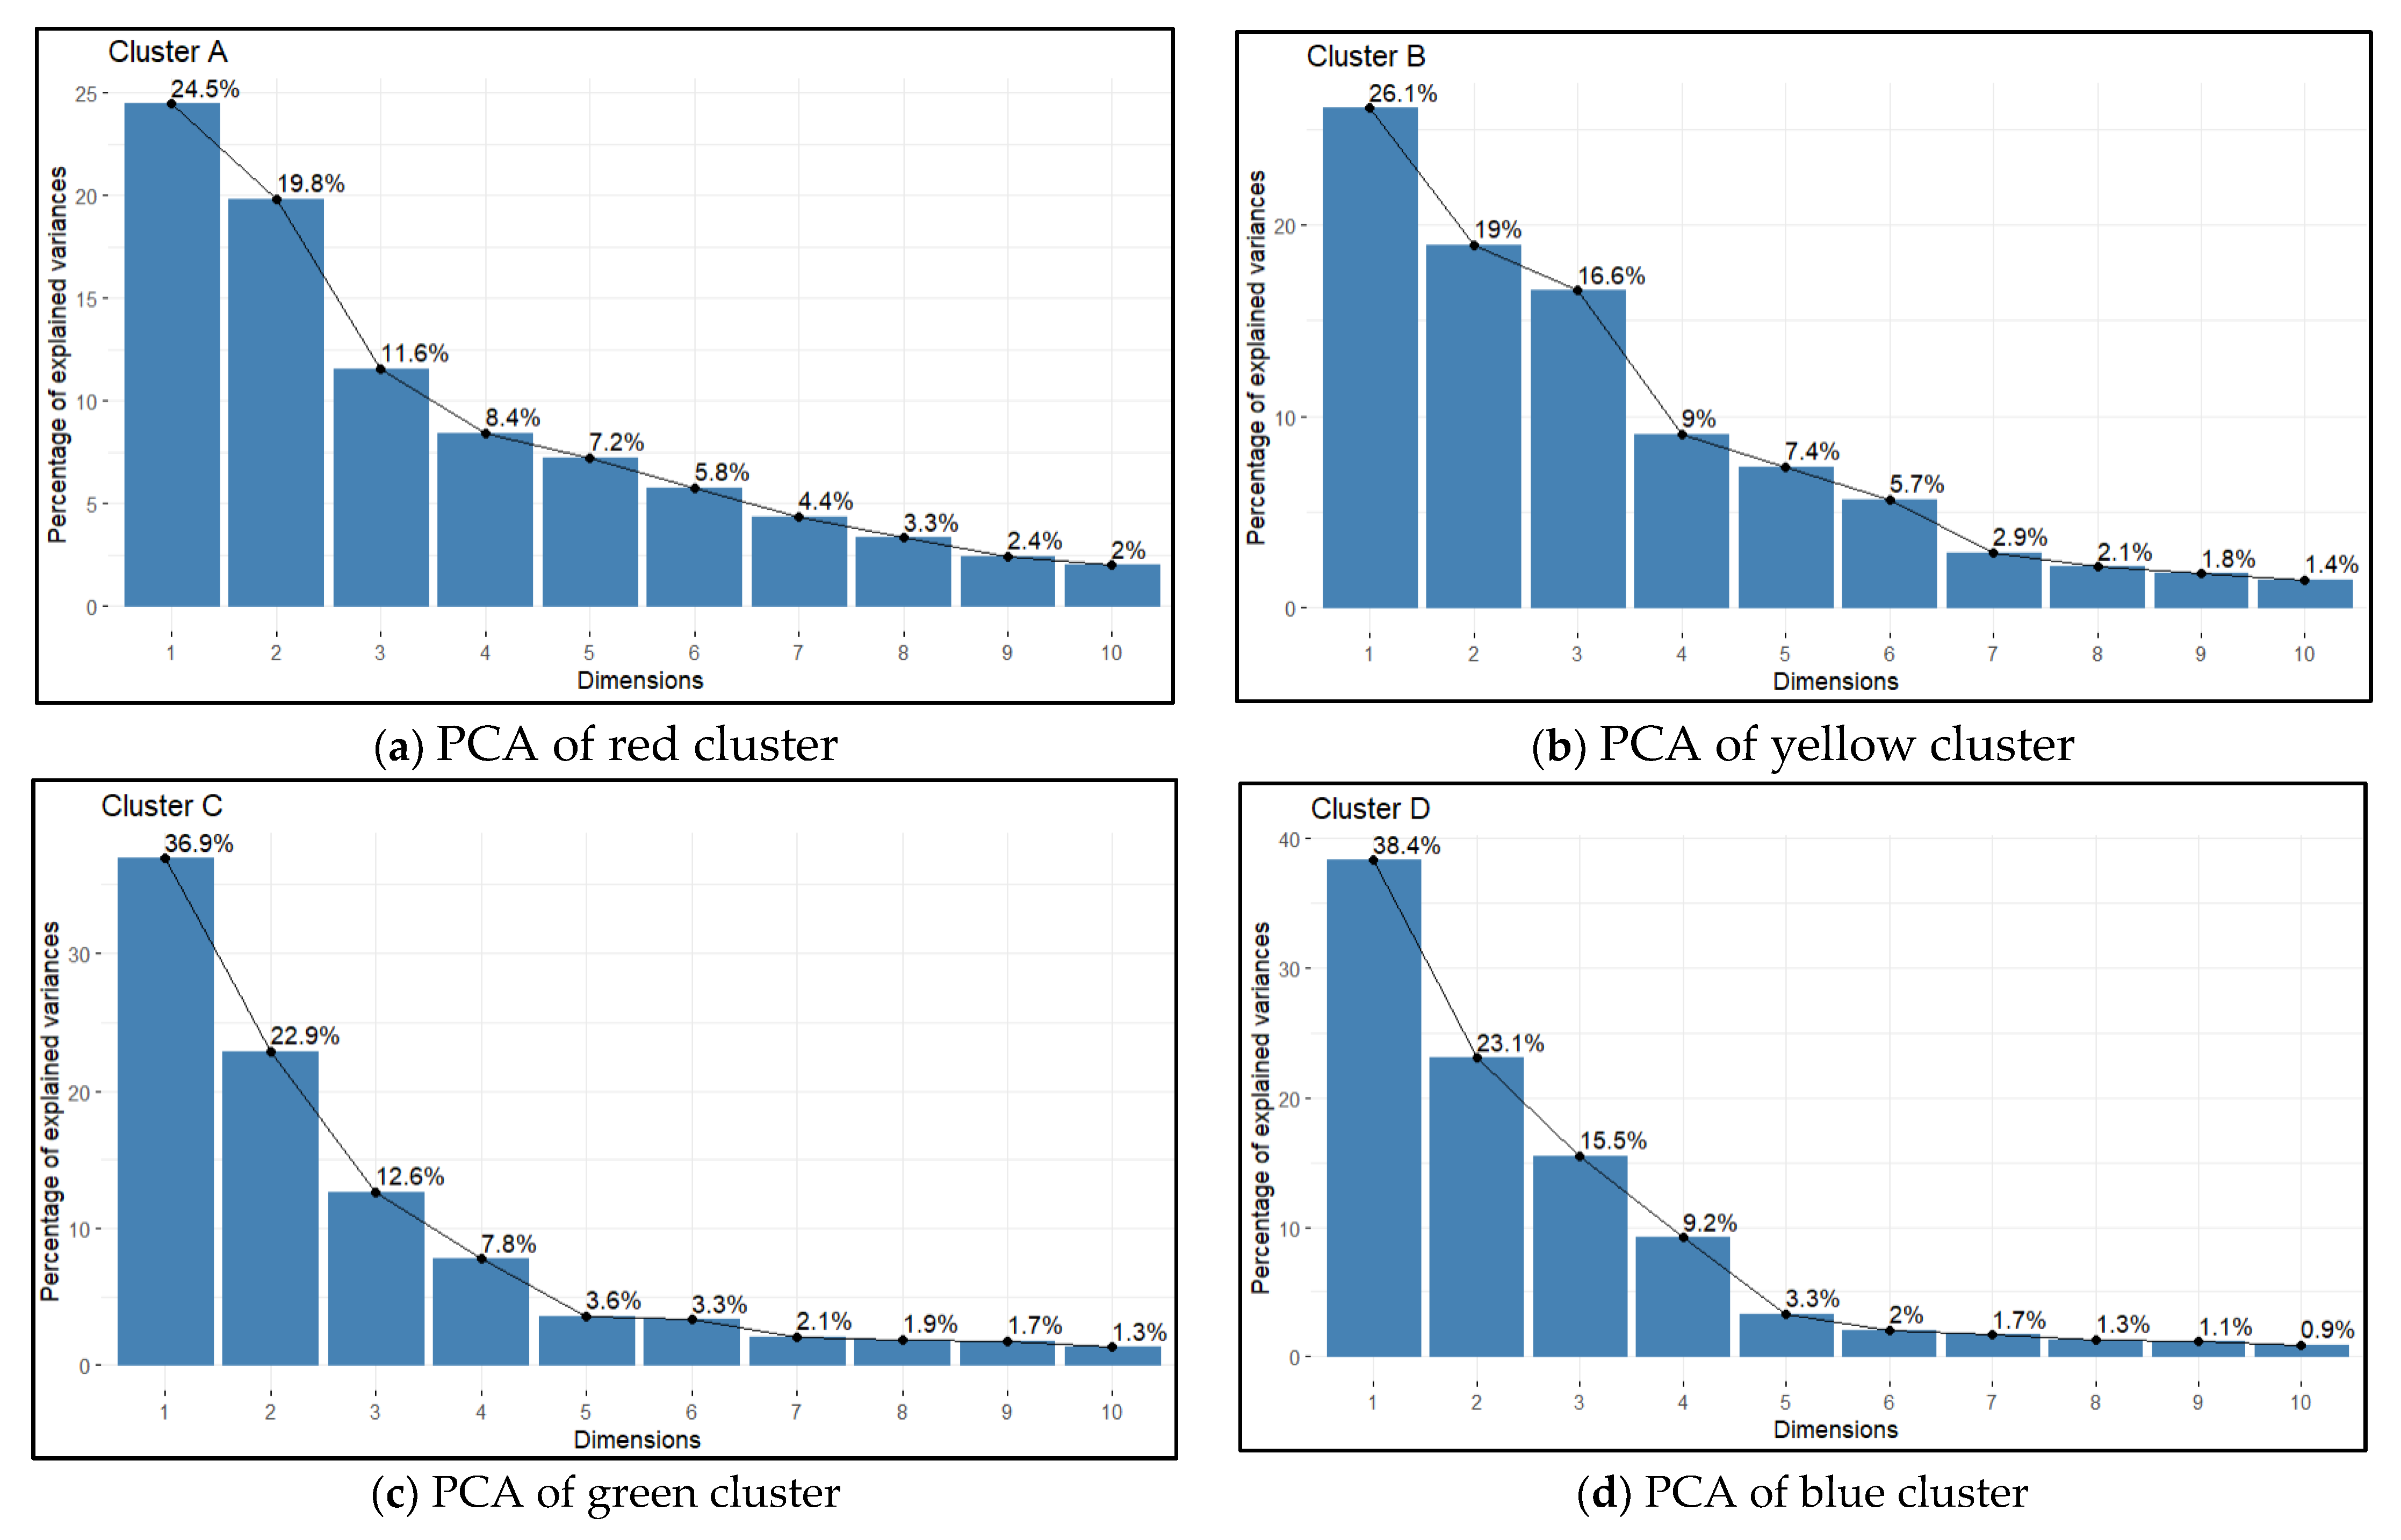
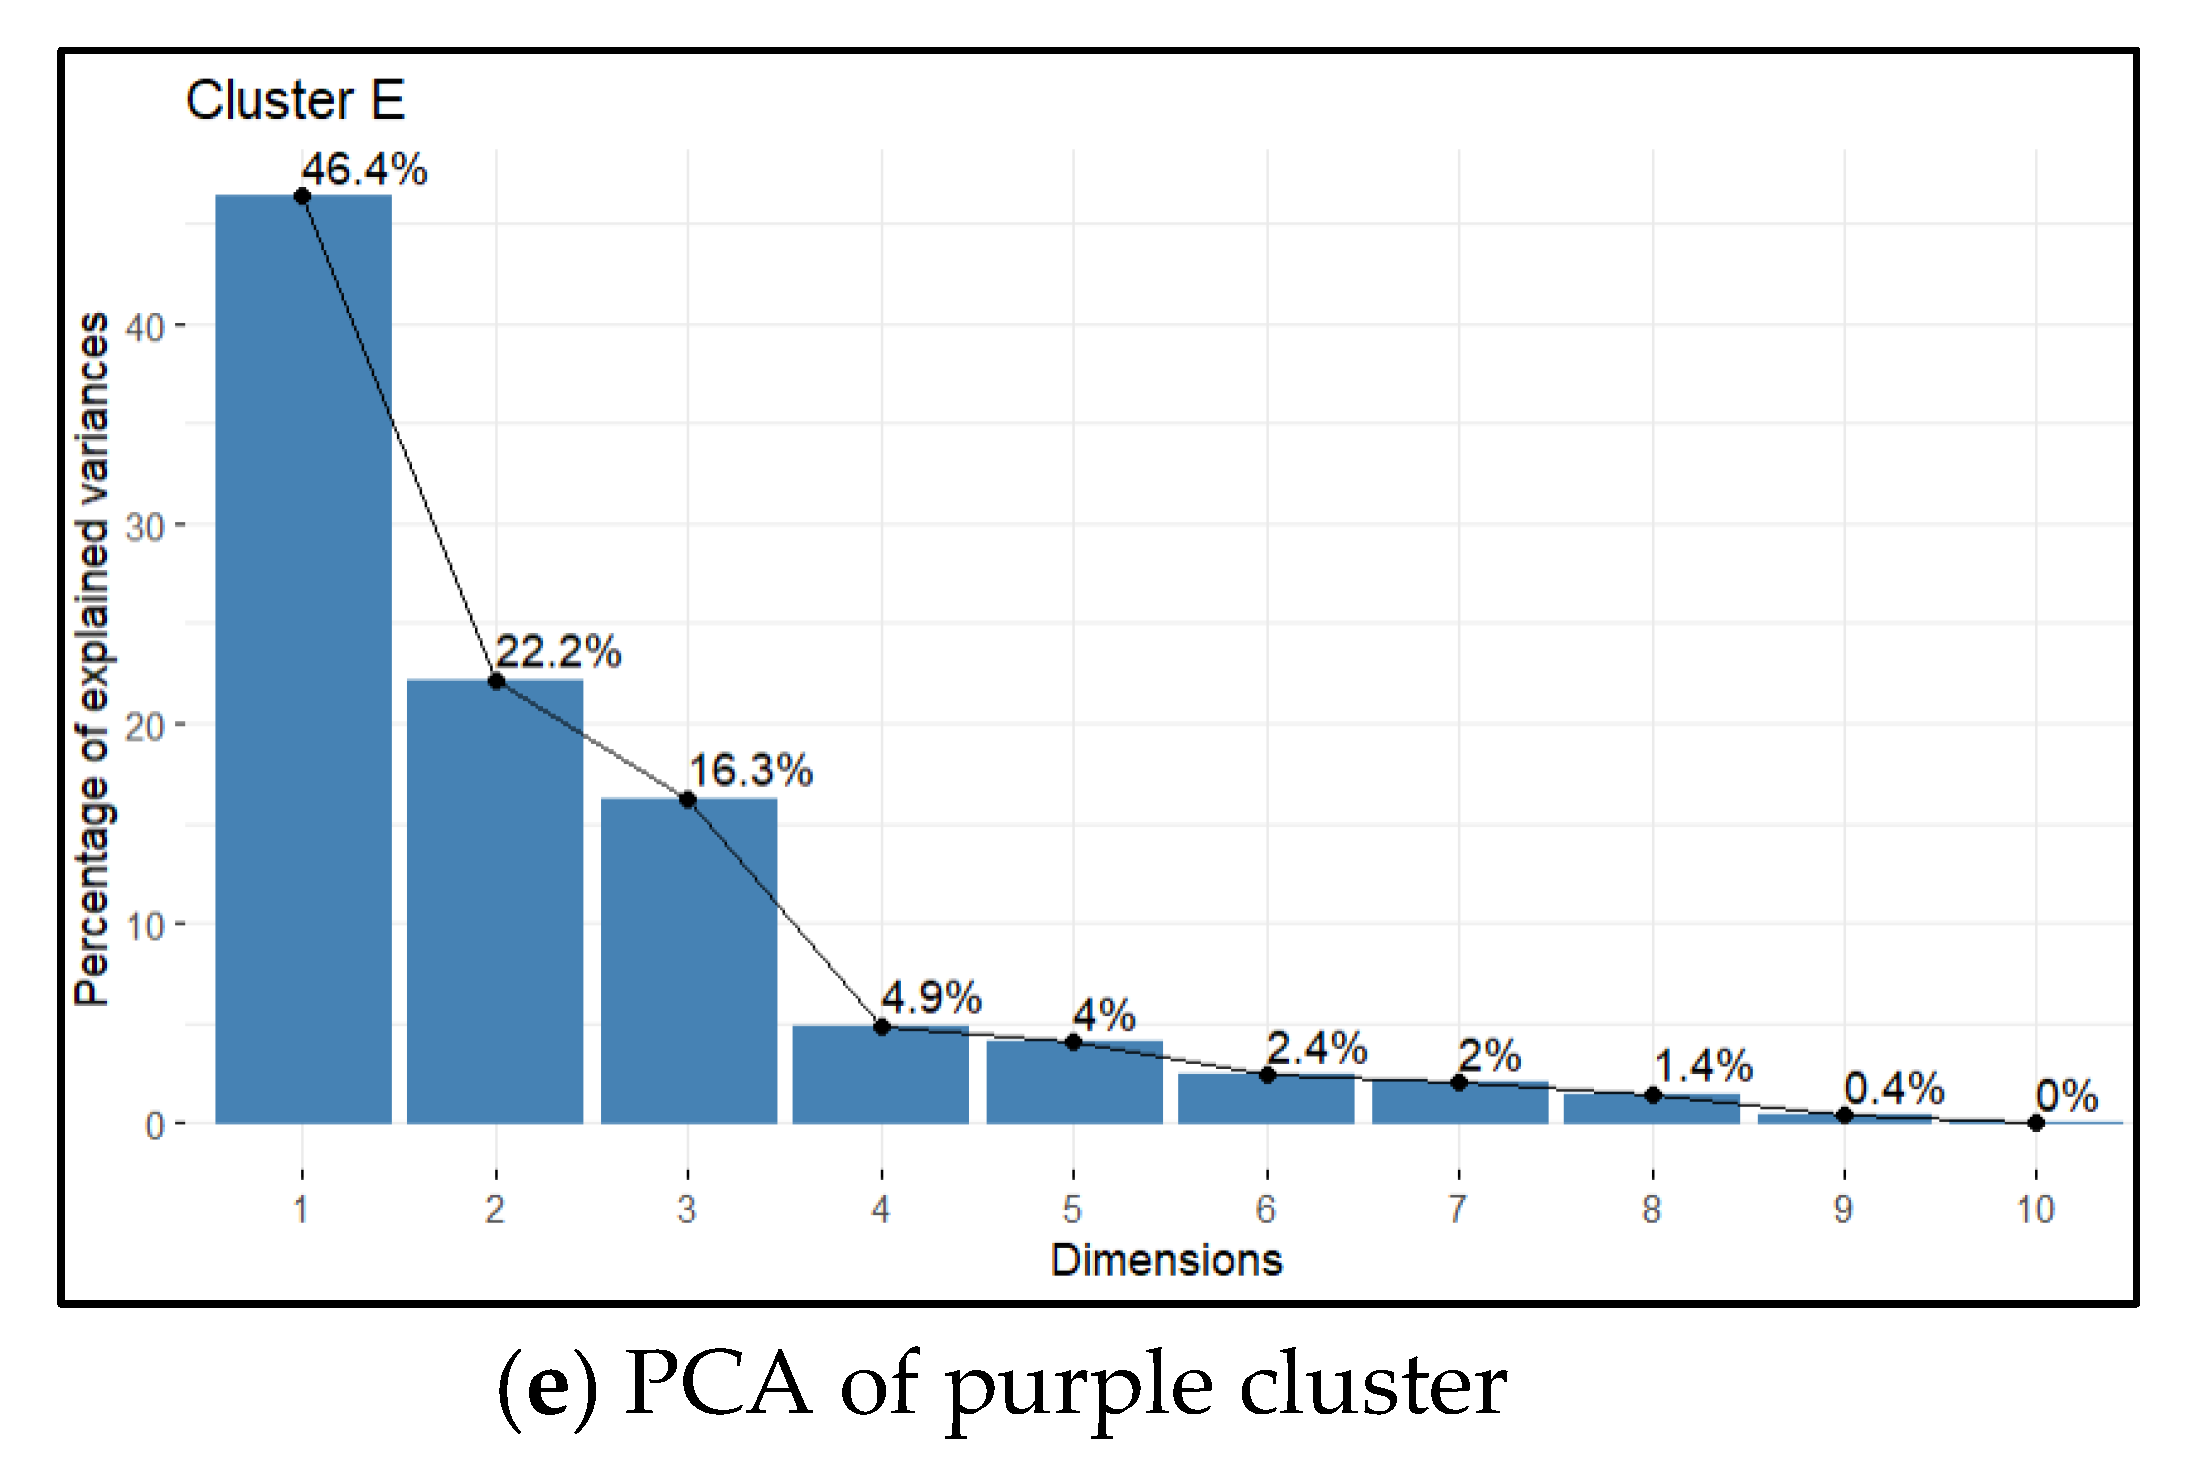
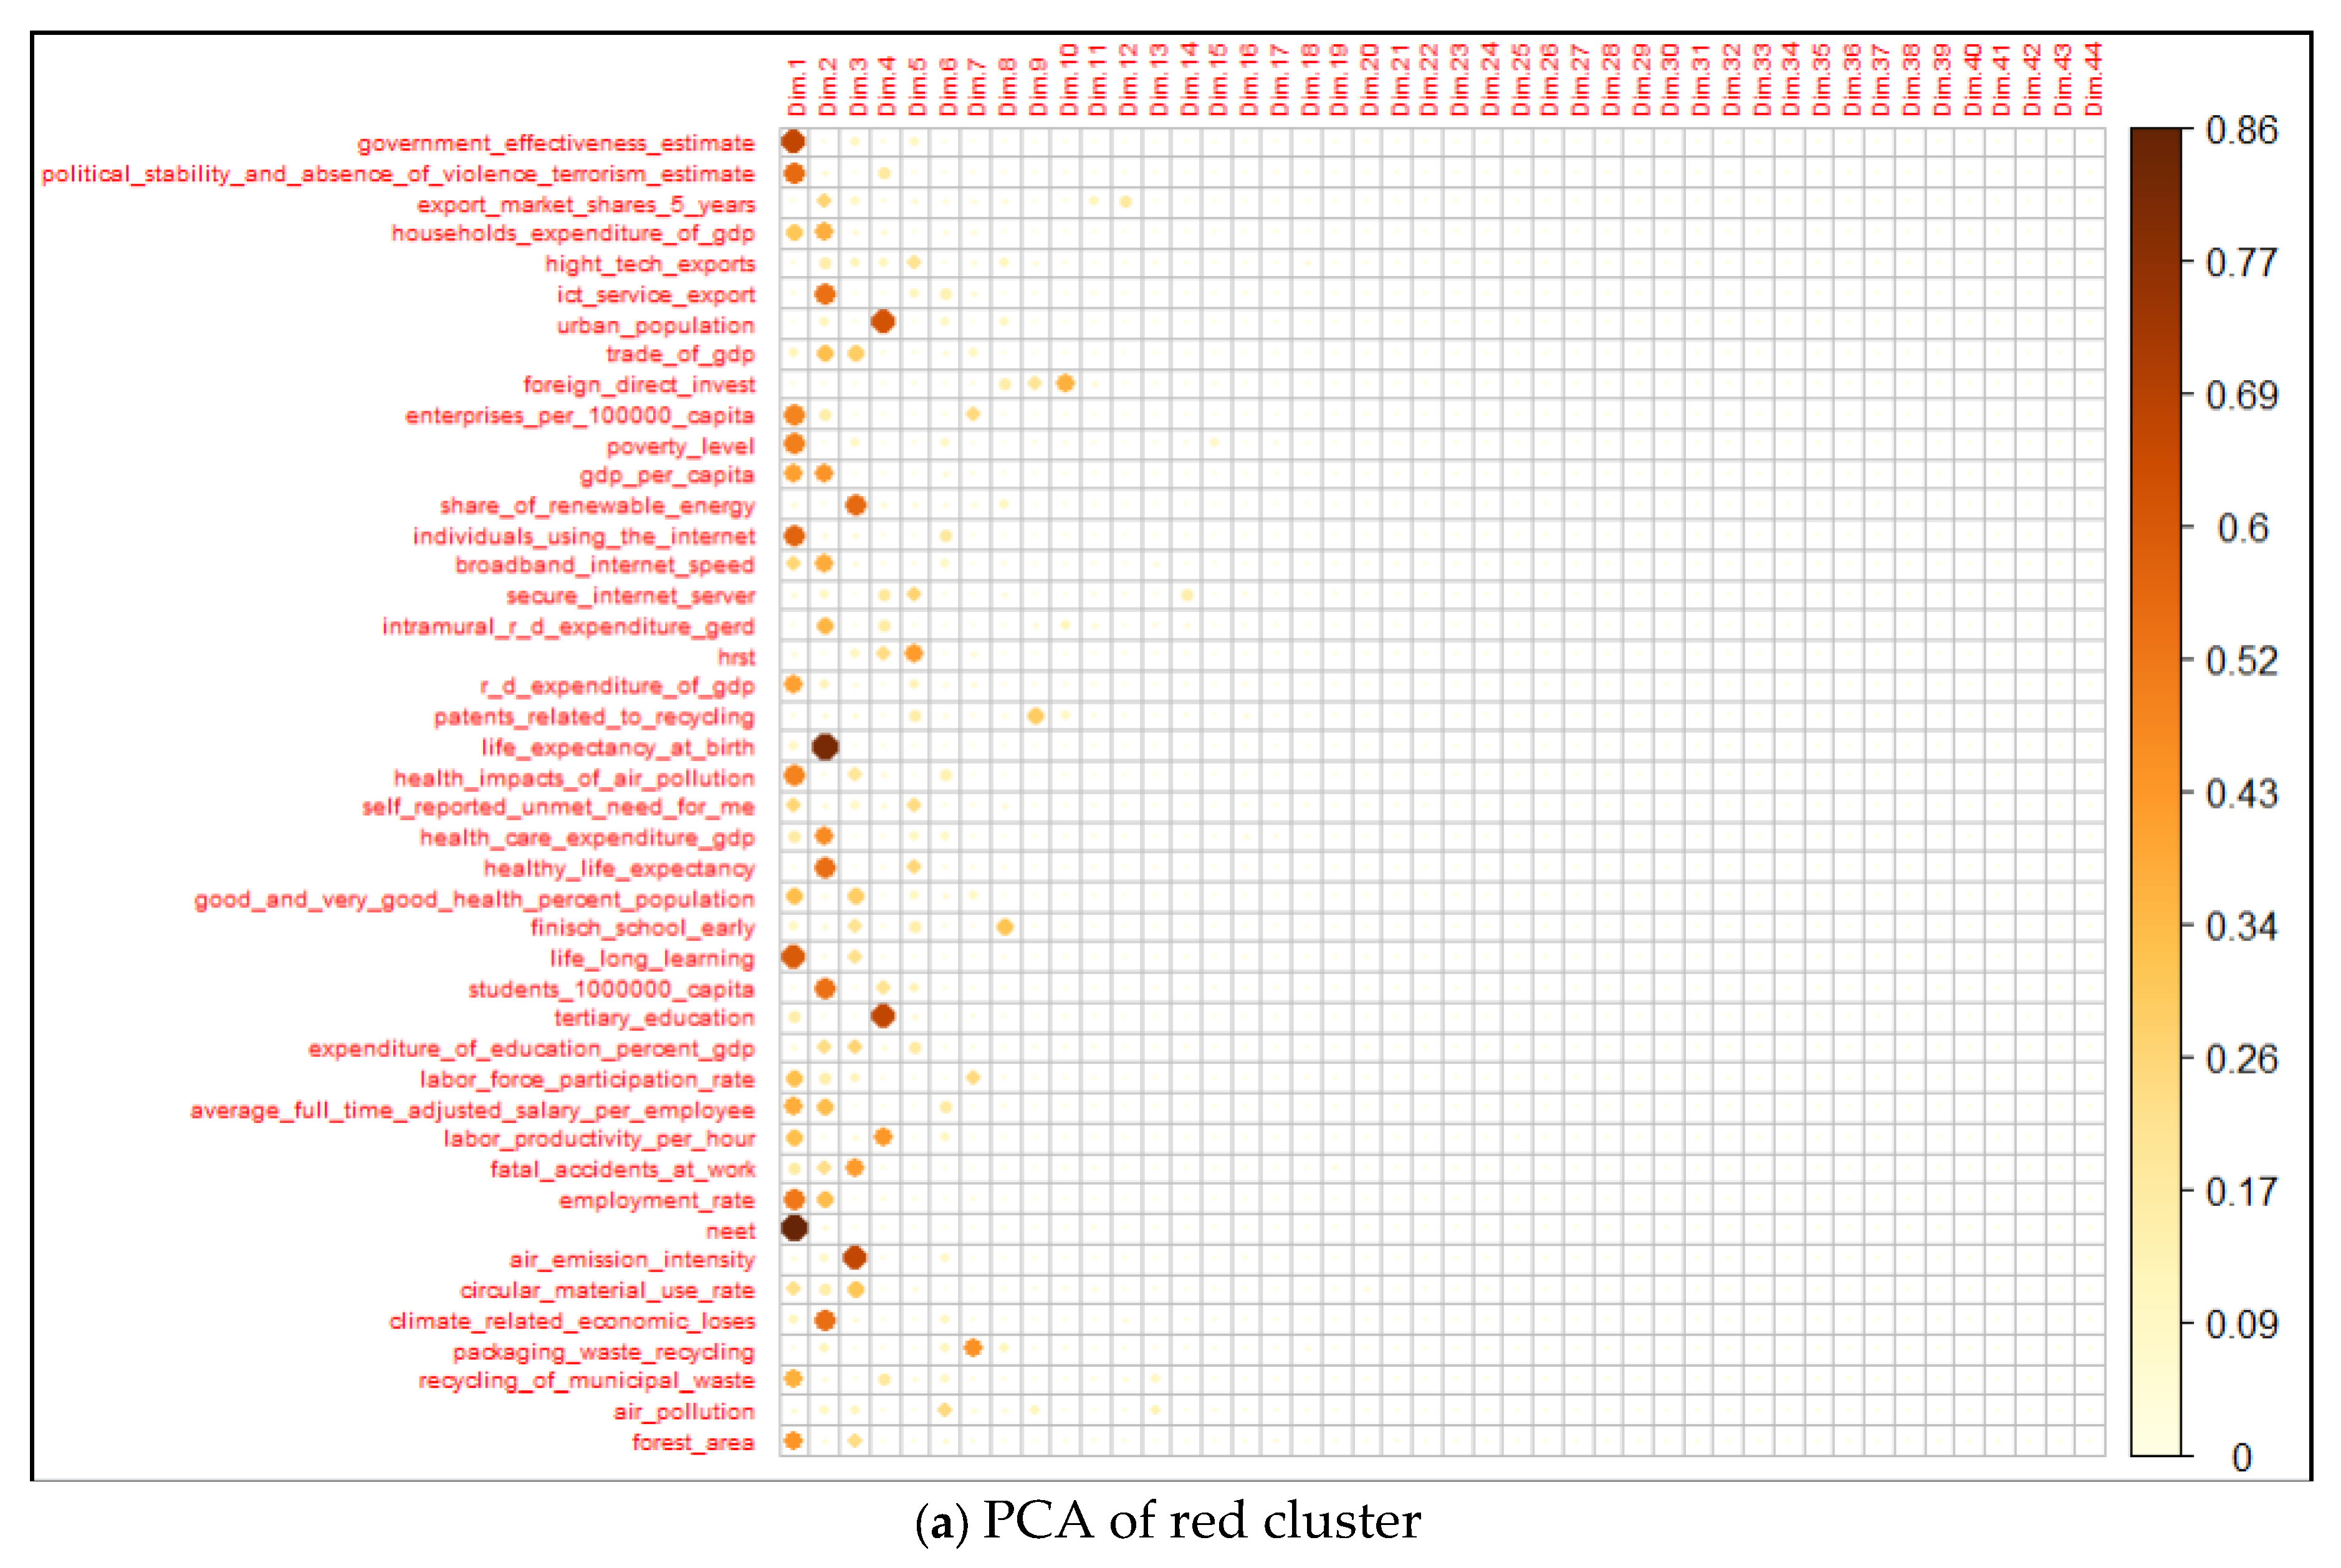
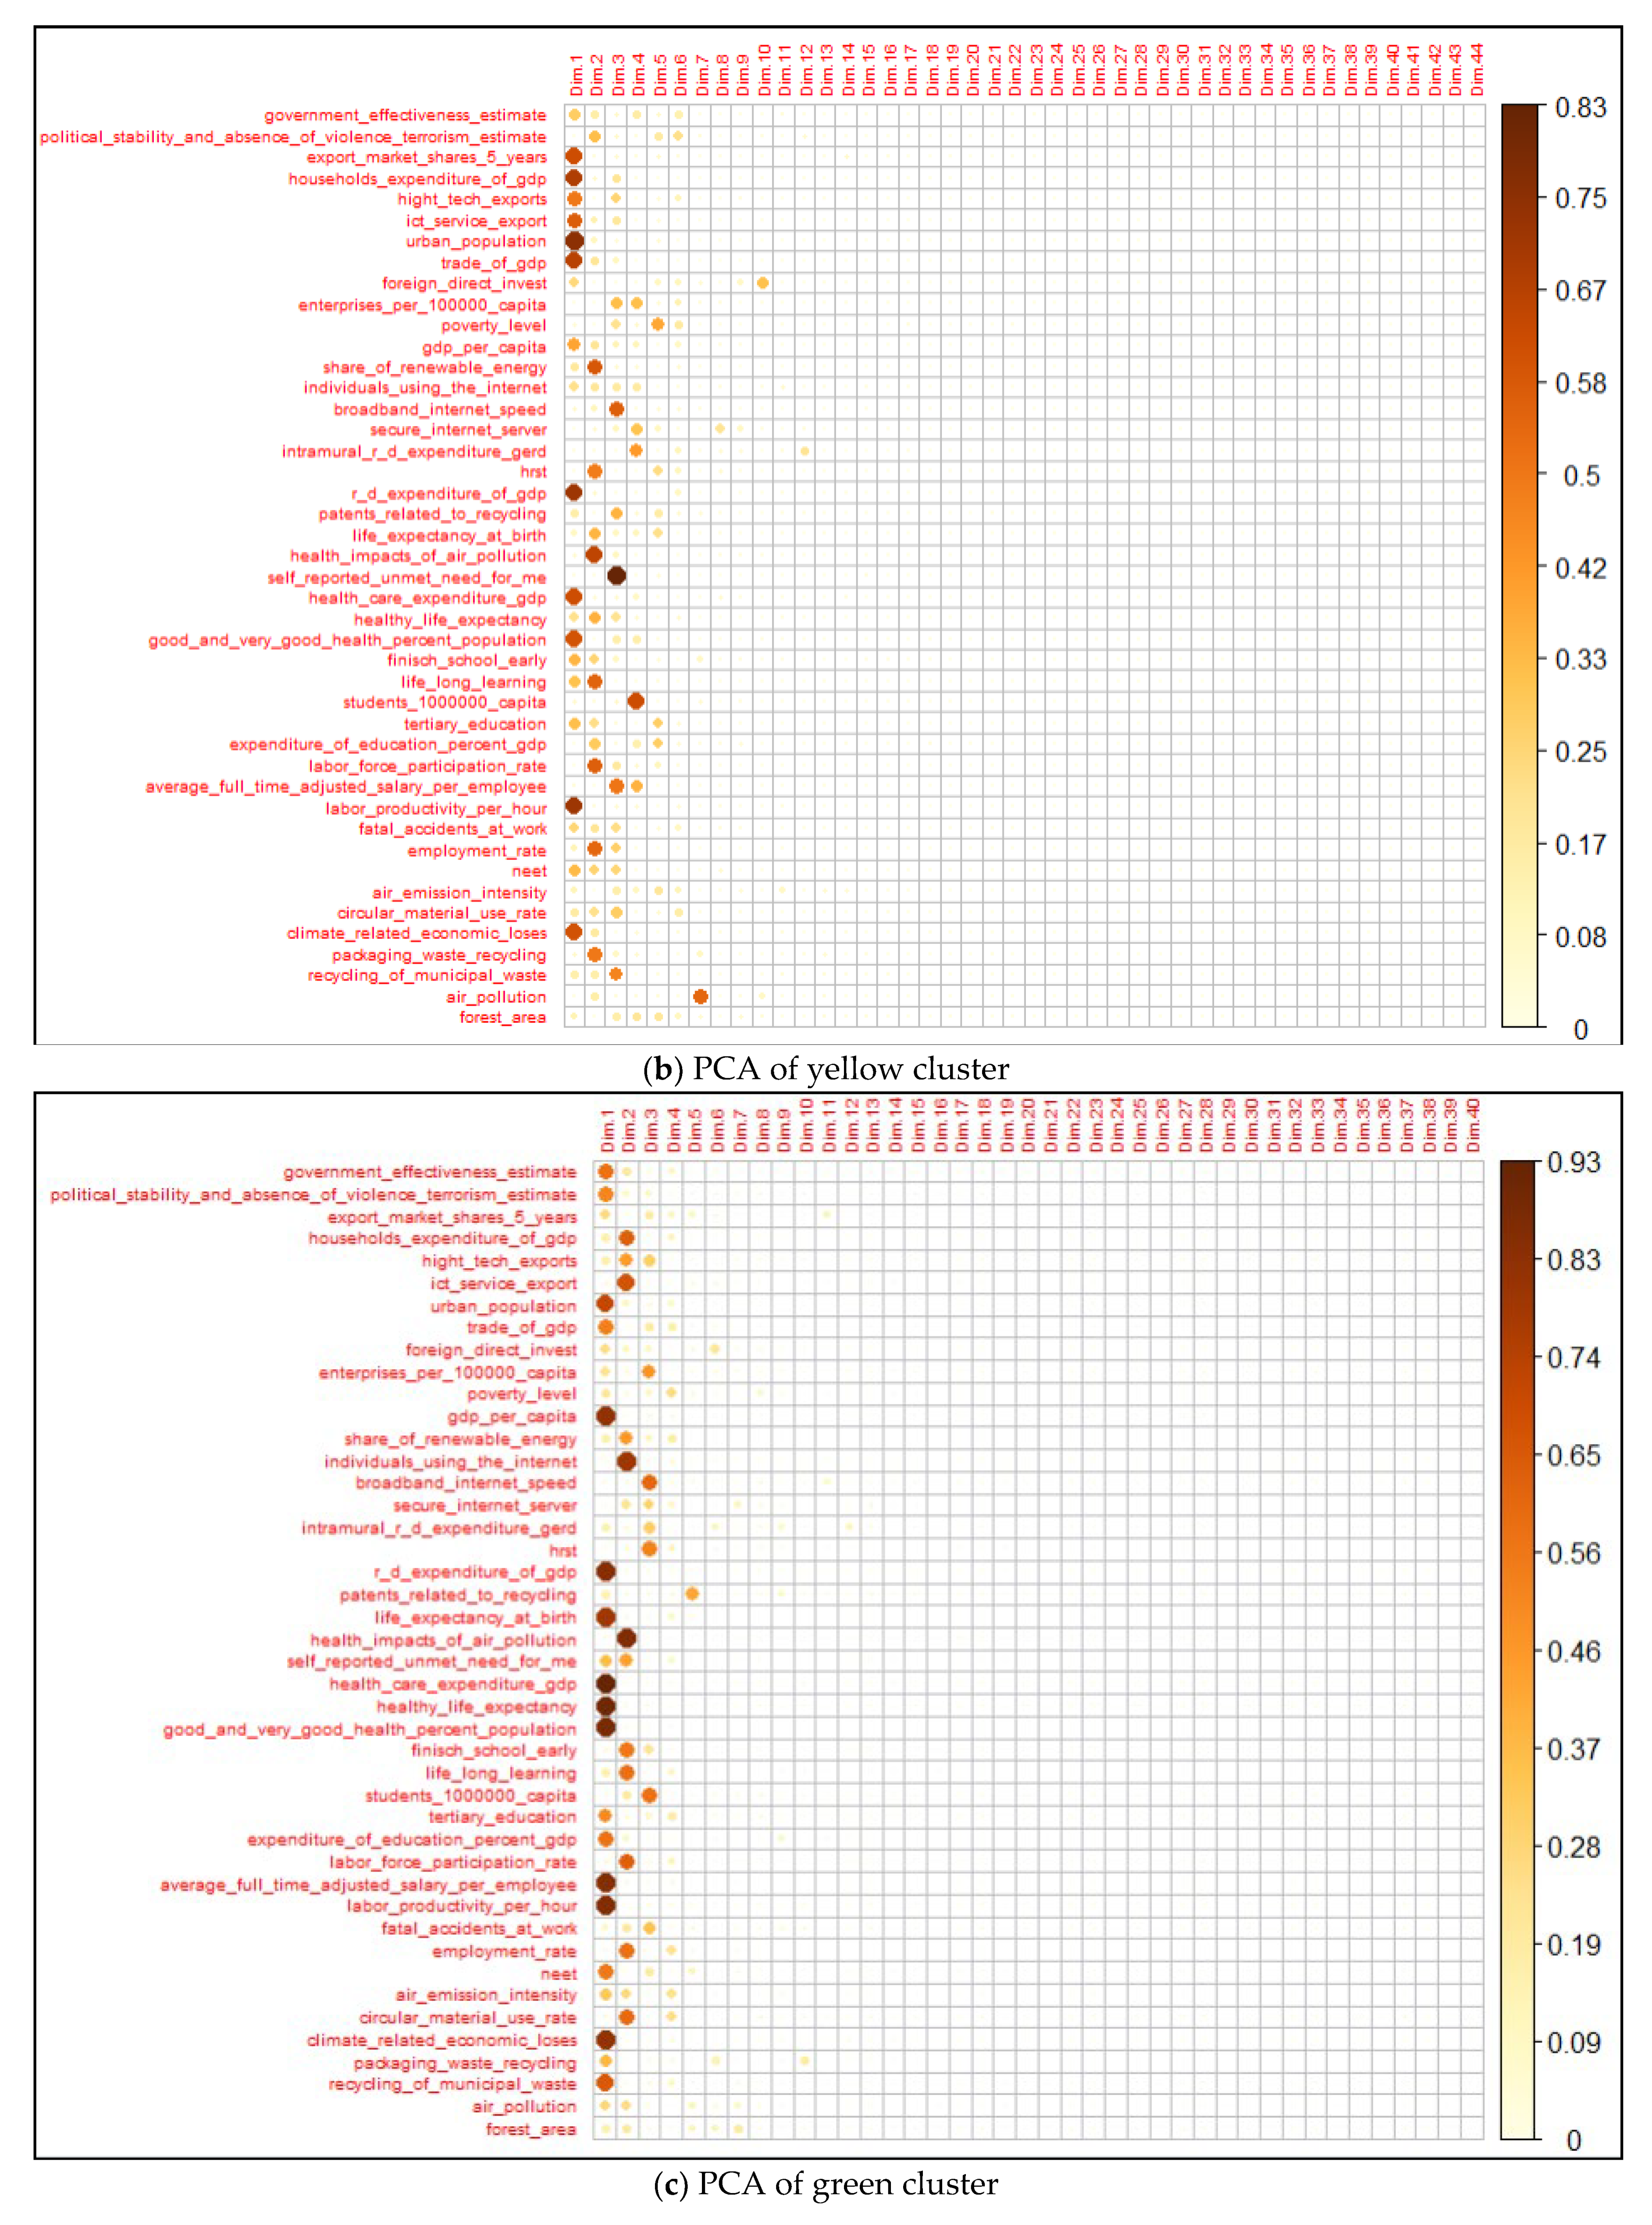
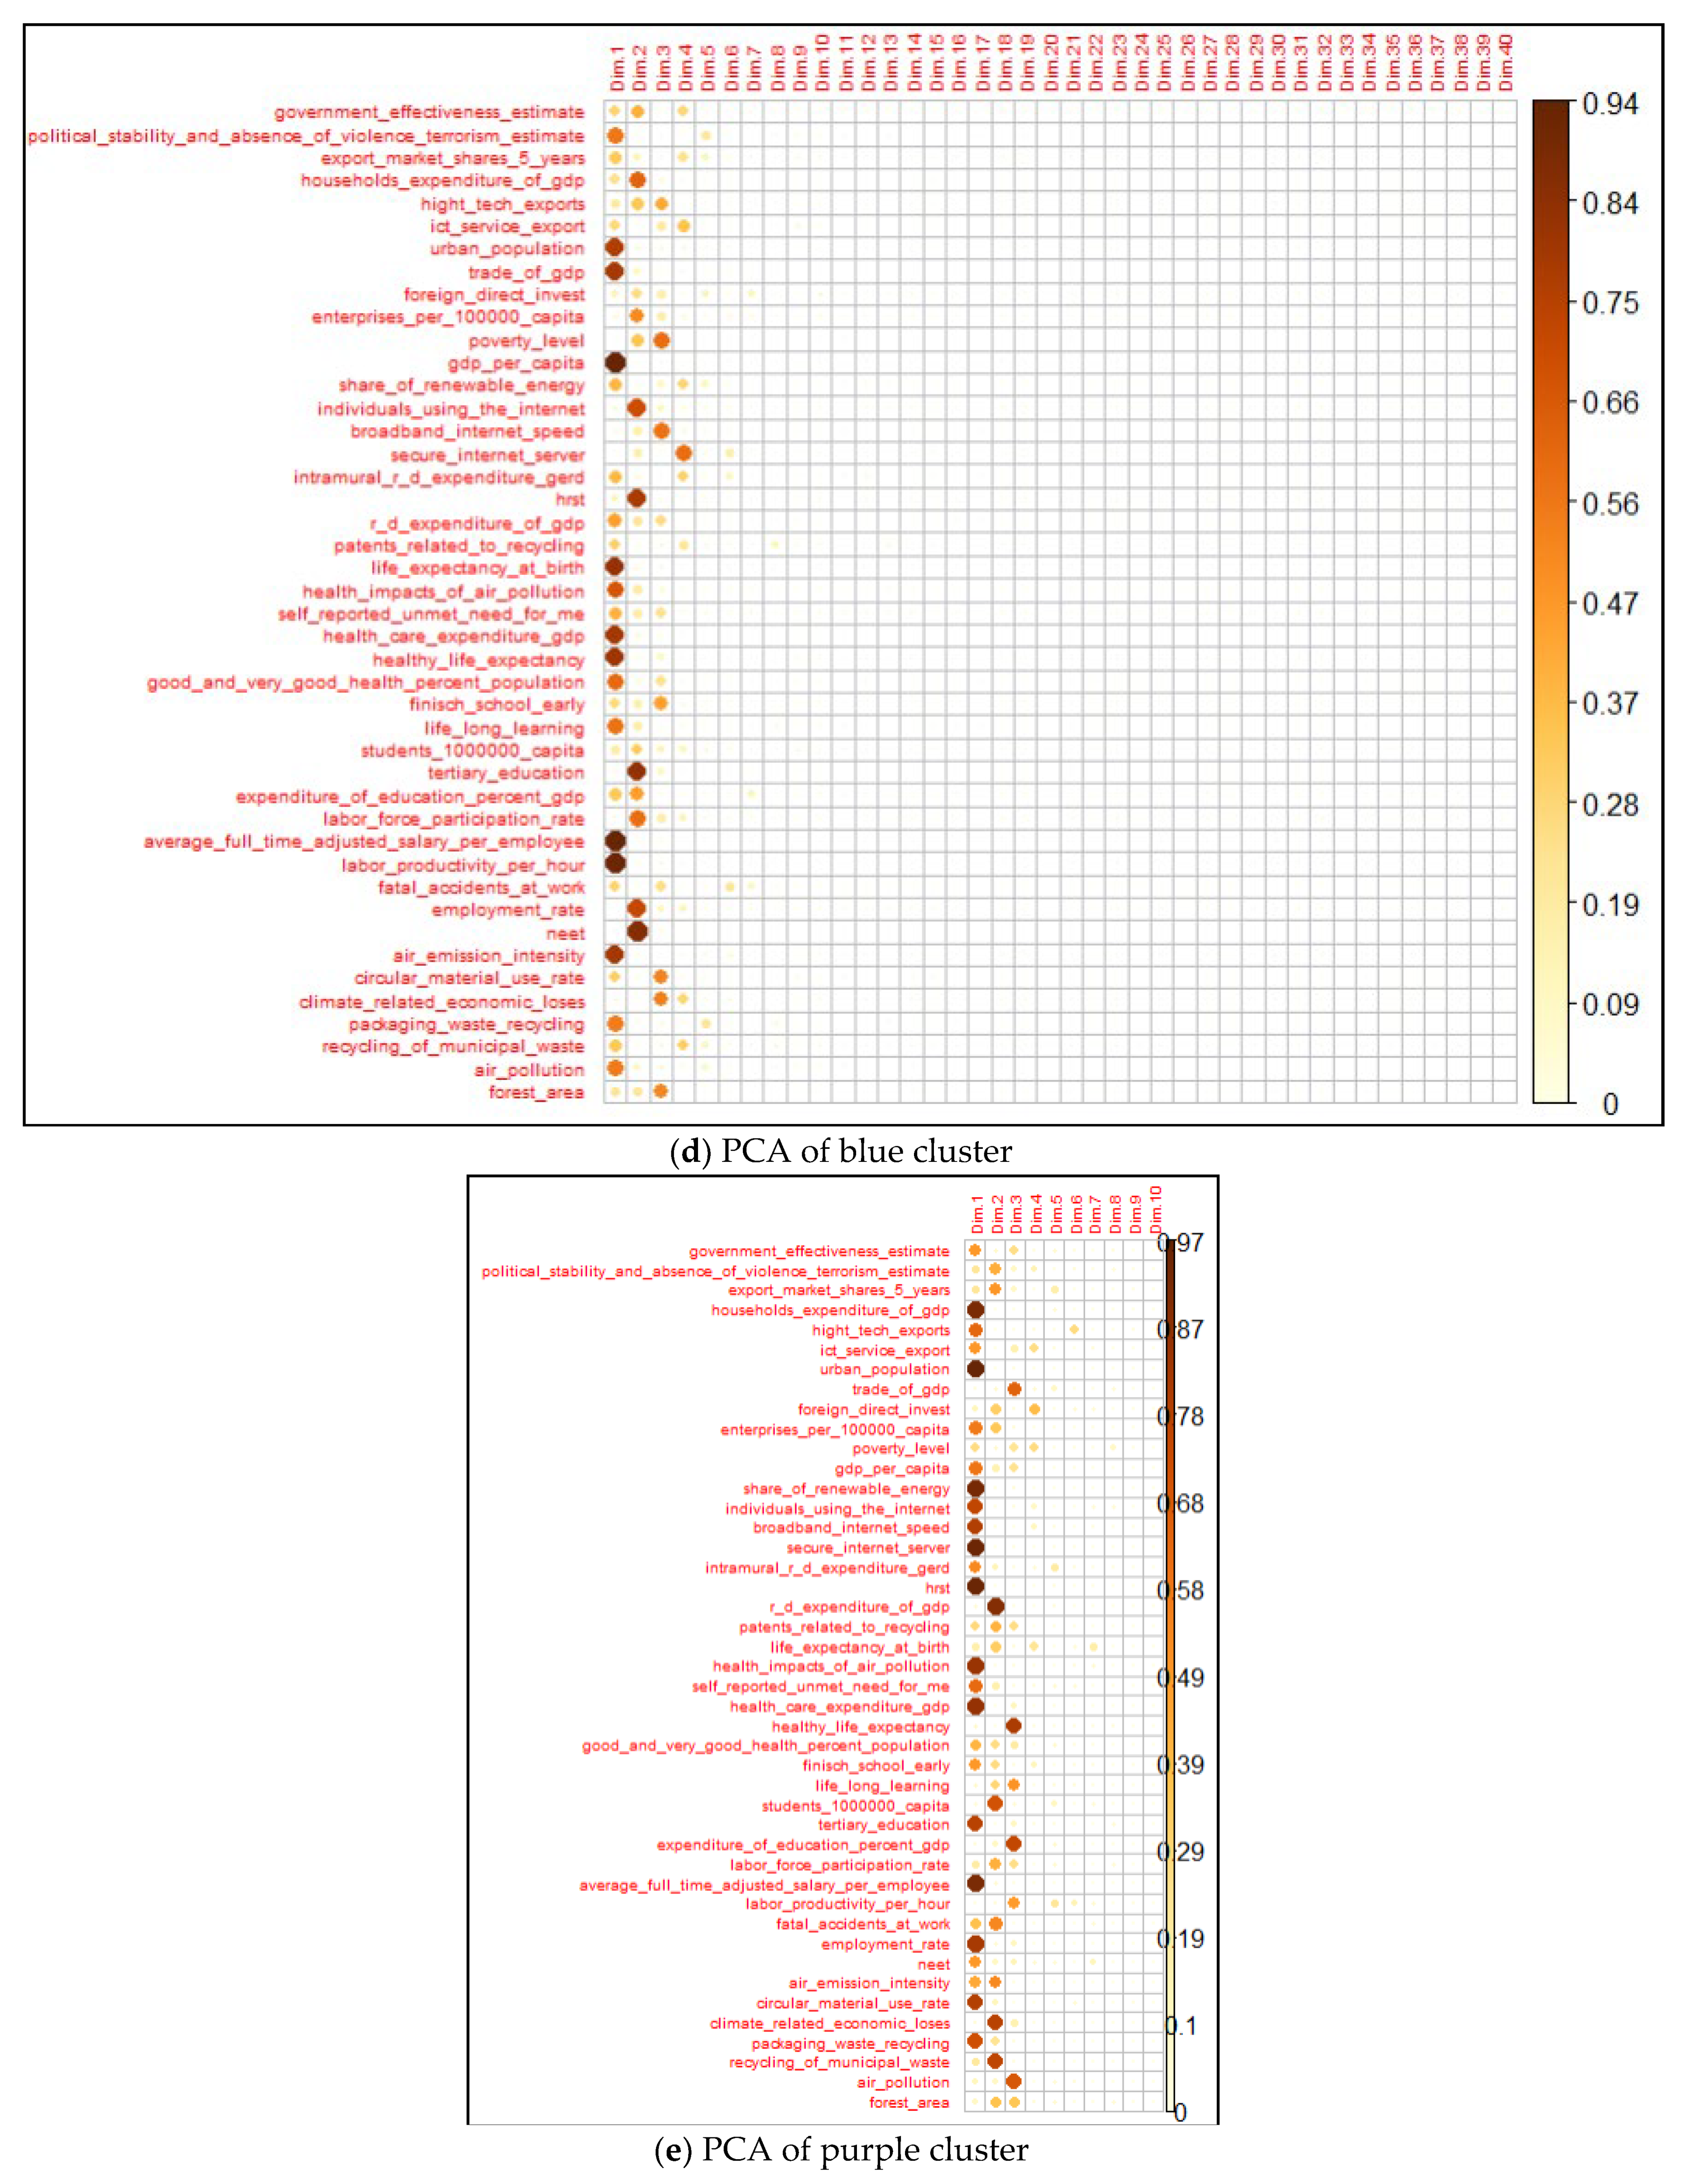
No countries fit the profile of relatively low competitiveness and relatively high CO2 emissions.
Analysis of the relationship between the countries’ competitiveness indices and CO2 emissions showed that no cluster changed its profile between 2012 and 2021.

4.3. PCA Results

PCA basically aims to find direct mixes of the factors, which are linear combinations of the original variables (known as principal components) that lead to the directions of maximal discrepancy in the data [55]. This method is used to provide valuable insights into countries’ characteristics and identify countries’ strategies [56]. In this study, PCA was performed determine the clusters’ characteristics (see Appendix E). The results of the PCA show that the clusters of countries are influenced by different factors (see Table 2), which proves that the EU countries have developed differently in terms of competitiveness.

4.4. Competitiveness Index and CO2 Trajectory Results

The results for the competitiveness indices and CO2 change trajectories of each cluster are presented in Figure 4.
In addition, correlations between the index and CO2 emissions were calculated, along with the rates of change for each cluster. As the COVID-19 pandemic had a strong impact on the 2020–2021 results, a correlation and change analysis was carried out for the period 2012–2019 to identify strategies for progress in green competitiveness. The correlation coefficient between the competitiveness index and CO2 in the red cluster is (−0.27). On average, the competitiveness indices of the countries in the red cluster grew at a rate of 0.001612, while CO2 emissions grew at a rate of 0.0178. These changes show that the competitiveness index of the countries in the red cluster is increasing at a lower rate than their CO2 emissions. The correlation coefficient for the yellow cluster is 0.66. On average, the competitiveness indices of countries in the yellow cluster increased by 0.00366 units annually, while CO2 emissions rose by 0.01281 annually. The green cluster has a correlation of 0.37 between the competitiveness index and CO2 emissions. On average, green cluster countries’ competitiveness indices varied by 0.00185 and their CO2 emissions by 0.01086. The weak correlation and the rate of change show that as countries’ competitiveness increases at a low rate, CO2 decreases at a higher rate. The correlation between the competitiveness indices of the countries in the blue group and the CO2 index is 0.31. The average rate of change of the competitiveness indices of the countries in the blue cluster was 0.00434 and that of their CO2 emissions was 0.01498. The decline in indices is uneven. The correlation coefficient of the variables in the purple cluster is 0.86. The average rate of change of their competitiveness indices was 0.00494 and the average rate of change of their CO2 indices was 0.01942. There was a significant decrease in CO2 emissions.

5. Discussion

Based on the results of our empirical research, we have identified five green competitiveness progress strategies which relate to the green competitiveness profiles we determined (see Table 3).
Countries in the green cluster (with profiles combining relatively high competitiveness with relatively low CO2 emissions) are the most aligned with the Europe 2050 vision and have developed three types of green competitiveness progress strategies: (1) inspiring steady growth in green competitiveness; (2) threatening stagnation of green competitiveness and (3) shocking growth in green competitiveness, transitioning to slower growth. The first strategy represents the greatest progress in economic decoupling. Due to the high level of competitiveness achieved, the rate of increase in countries’ competitiveness is relatively low but maintains a strong position, while the rate of CO2 emission reduction is high. The second strategy shows strong progress in economic decoupling; however, it represents a scenario where competitiveness increases at a higher rate than the rate of decrease in CO2 emissions, due to the specific characteristics of countries with big economies. The third strategy shows an initial increase in green competitiveness due to investments in technology (such as clean production and energy) providing potential to increase economic competitiveness and reduce CO2 emissions, which is subsequently followed by declines in the rate of increase in green competitiveness, demonstrating a need for rapid innovations beyond technology (i.e., social innovations, changes in behavior patterns, sustainable urban planning, etc.). Countries in the purple cluster, with a profile of relatively high competitiveness and relatively high CO2 emissions, developed one type of green competitiveness progress strategy: the potential growth of green competitiveness. Due to the high level of competitiveness achieved, the rate of increase in countries’ competitiveness is relatively low but maintains a strong position, while the rate of CO2 emission reduction is relatively low due to the large size of the countries’ economies. Countries in the red cluster, with a profile of relatively low competitiveness and relatively low CO2 emissions, require significant and long-term investment until the whole economy is competitive and CO2 neutral, and have developed one type of green competitiveness progress strategy: a lagging increase in green competitiveness. In this strategy, the rate of increase in countries’ competitiveness is relatively low, while the rate of CO2 emission reduction is increasing due to investments in technological innovations and labor-intensive activities.
Our research confirms the PH at the macro level and in the case of EU countries. We have clearly identified that the competitiveness of a country can increase in alignment with strict climate policy and EU environmental regulations. These results are consistent with the insights of other researchers who have proved the PH in non-EU counties (macro level). Environmental regulation directly promotes green total factor productivity growth in China [37] and has a positive effect on China’s regional development [57]. PH was originally applied at the enterprise level and mainly to large firms [58]. Our research has expanded the PH to the macro level and confirmed that it is relevant at the macro as well as the micro level. Rexhauser and Rammer [38] and Lanoie et al. [39] found that the environmental policy induces economic and environmental innovation that can improve a firm’s resource efficiency, but not necessarily its overall efficiency (productivity) to provide positive profitability effects. Positive impacts of environmental regulations have been found on firms and/or industries, which already have a high level of productivity in the most technologically advanced countries [59].
Our research clarifies the PH in terms of green competitiveness profiles and strategies. The identified profiles and green competitiveness strategies provide a good empirical case for narrow PH, which, following Albrizio et al. [59], are less frequently analyzed. A narrow PH points out that flexible regulation provides a stronger incentive for innovation than regular regulation [28]. By identifying different profiles and green competitiveness strategies, we support narrow PH by stating that the specifics of socioeconomic systems (contextual factors and performance level) have an important influence on the effect of environmental regulations and progress in climate neutrality. This is in alignment with Albrizio et al. [59] in the case of OECD countries, and Festa et al. [24] in the case of China.

6. Conclusions

The empirical results of the green competitiveness metric changes in the 2012–2021 period in EU countries support the EU political agenda and the current scientific consensus, which states that an economy’s gradual transition towards climate neutrality is only visible over time.
The empirical results and the identified green competitiveness profiles support the statement that the competitiveness of countries can be increased in alignment with the strict climate policies and environmental regulations of the EU.
The identification of green competitiveness progress strategies supports the statement that EU countries use different strategies to transition towards climate neutrality, which ultimately leads to different rates of progress. Our results also support the conclusion that countries can shift from one green competitiveness progress strategy to another by adopting climate neutrality development tools and practices. These findings are important for fostering a green competitiveness approach across EU countries.
The identification of different green competitiveness progress strategies also supports the argument that the local context is important for the achievement and success of the EU’s common goals. EU countries are subject to different sets of conditions affecting their transition towards climate neutrality, ultimately leading to different rates of progress. This implies a need at the policy level to draw more attention to the need to develop supportive environments (including in terms of infrastructure) and encourage economic subjects to implement practices which will lead towards climate neutrality.
This study has several limitations. The results are specific to the selected sample of countries, which were observed over a defined period and processed using specific types of quantitative analysis. We only analyzed EU countries. Furthermore, we only analyzed a 10-year period, the duration of which is insufficient to identify deeper long-term effects. Averaging and clustering indicators, in certain cases, eliminate the specificity of each country, which requires a more detailed analysis of individual cases. Additionally, we did not include the economic shock produced by the COVID-19 pandemic when identifying profiles and strategies. Our empirical research also ignores the potential effects of economic and political crises in individual countries, on estimates of their economic and environmental performance.
We identified several future research opportunities. Deeper theoretical and empirical research (including case analysis) on the concept of green competitiveness is needed to help rethink the EU policy on competitiveness. More deeper analysis by the use various mathematical and econometrical methods for identification of trajectories of EU countries’ competitiveness indices and CO2 emissions is required. An analysis of how green competitiveness metrics change in response to economic shocks, and what kinds of strategies these changes call for, is also required. Furthermore, incorporating additional countries into the analysis would allow us to compare the green competitiveness profiles and strategies of EU and non-EU countries, and would increase the range of the study field. This would be useful, as the most significant limitation of this work is our restricted study field, which contains only EU economies.

Author Contributions

Conceptualization, J.B. and I.Z.; Methodology, J.B.; Validation, J.B. and I.M.; Formal analysis, I.Z.; Investigation, J.B. and I.Z. All authors have read and agreed to the published version of the manuscript.

Funding

The project has received funding from European Regional Development Fund (project No. 01.2.2-LMT-K-718-03-0104 under grant agreement with the Research Council of Lithuania (LMTLT).

Institutional Review Board Statement

Not applicable.

Informed Consent Statement

Not applicable.

Data Availability Statement

Not applicable.

Conflicts of Interest

The authors declare no conflict of interest.

Appendix A. Indicators Used in Competitiveness Index Calculation

No.Sub-IndexIndicatorData Source
Institutions
1Government EffectivenessGovernment Effectiveness EstimateWorld Bank
2Political Stability and Absence of Violence/TerrorismPolitical Stability and Absence of Violence/Terrorism EstimateWorld Bank
Macroeconomic environment and market size
3Gross domestic productGross domestic product per capitaEurostat
4Poverty ratioThe at-risk-of-poverty rate is the share of people with an equalized disposable income (after social transfer) below the at-risk-of-poverty threshold, which is set at 60% of the national median equalized disposable income after social transfers.Eurostat
5Foreign direct investmentForeign direct investment per capitaEurostat
6Level of entrepreneurshipEnterprises per 100,000 capitaEurostat
7International trade as a share of GDPInternational trade (% of GDP)World Bank
8Export market sharesExport market shares—5 years % changeEurostat
9Households expenditure of GDPHouseholds final consumption expenditure (% of GDP)World Bank
10High—technology exportHigh—technology export (% of goods export)World Bank
11ICT service exportICT service export (% of service exports)World Bank
12Population degree of urbanizationPart of the population living in the cityEurostat
Basic and IT infrastructure
13Broadband Internet by speed Broadband Internet speed (Mbps) Eurostat
14Renewable energy consumptionRenewable energy consumption (% of total final energy consumption)Eurostat
15Secure Internet serversSecure internet servers per 1 million people (TLS/SSL) World Bank
16Internet userInternet users per1000 peopleEurostat
Innovation
17Total intramural R&D expenditureTotal intramural R&D expenditure (GERD) ratioEurostat
18Human resources in science and technologyHRST (% from all employed people)Eurostat
19R&D expenditure R&D expenditure (% of GDP)World Bank
20Patents related to recycling and secondary raw materialsPatents related to recycling and secondary raw materials per 1000 enterprisesEurostat
Health and education
21Early leavers from education and trainingEarly leavers from education and training (% of population from 18 to 24 years)Eurostat
22Lifelong learningParticipation in lifelong learning (%of population from 25 to 65 years)Eurostat
23Students enrolled in tertiary educationStudents enrolled in tertiary education per 1 million peopleEurostat
24Tertiary educationThe share of the population with tertiary educationEurostat
25Public expenditure on educationPublic expenditure on education (% GDP)World Bank
26People with good or very good perceive healthShare of people with good or very good perceive healthEurostat
27Healthy life expectancy based on self perceived healthHealth expectancy in absolute values at birthEurostat
28Total health care expenditureTotal health care expenditure (% GDP)World Bank
29Self-reported unmet need for medical examination and careShare of the population self-reported unmet need for medical examination and careEurostat
30Health impacts of air pollutionRate of premature deaths due to air pollutionEurostat
31Life expectancy at birthMean number of years that a new-born child can expect to live if subjected throughout his life to the current mortality conditionsEurostat
Labor market efficiency
32Employment rateEmployment rate of the total populationEurostat
33Participation rateLabor force per working age population Eurostat
34Young people neither in employment nor in education and trainingYoung people neither in employment nori n education and training (NEET) ratio (% of total population)Eurostat
35Labour productivityLabour productivity per person employed and hour workedEurostat
36Average full time adjusted salary per employeeAverage full time adjusted salary per employeeEurostat
37Fatal accidents at workFatal accidents at work per 100,000 workersEurostat
Climate-neutral environment
38Recycling rates for packing wasteShare of recycled packaging waste in all generated packaging wasteEurostat
39Recycling rate of municipal wasteRecycling of municipal waste share to all wasteEurostat
40Exposure to air pollution by particulate matterThe population weighted annual mean concentration of particulate matter at urban background stations in agglomerationsEurostat, EEA
41Air pollutionThe emissions intensity of the particulate matter from manufacturing sector in grams per euro of value addedEurostat
42Circular material use rateCircular material use rateEurostat
43Grow of forest areaGrowth of forest area in 5 yearsWorld Bank
44Climate related economic losesThe economic losses from weather and climate—related events, euro per inhabitantEurostat, EEA

Appendix B. Descriptive Statistics of Data Sample

No.Sub-indicatorMinimum1st QuartileMedianMean3rd QuartileMaximum
1Government Effectiveness−0.25740.58891.06071.05171.15272.2100
2Political Stability and Absence of Violence/Terrorism−0.23030.47470.74850.69160.94181.4008
3Gross domestic product53901275218035240023548070530
4Poverty ratio(13.20)
13.20
(19.10)
19.10
(22.20)
22.25
(23.14)
23.15
(27.85)
27.82
(38.20)
38.20
5Foreign direct investment−40.0870.9352.4594.3864.016109.025
6Level of entrepreneurship(2122)
2122
(4196)
4228
(5389)
5381
(5549)
5517
(6640)
6611
(9980)
9980
7International trade as a share of GDP54.8781.49104.06116.32150.55252.25
8Export market shares−32.6209.3201.1151.8599.17278.380
9Households expenditure of GDP23.65049.83054.29054.10059.45070.220
10High—technology export(4.493)
4.493
(9.398)
9.409
(12.299)
12.344
(13.929)
13.994
(17.678)
17.727
(32.833)
32.833
11ICT service export(2.444)
2.444
(7.485)
7.558
(9.428)
9.420
(12.705)
12.688
(13.949)
13.938
(58.950)
58.950
12Population degree of urbanization53.1161.4970.4771.7580.0598.12
13Broadband Internet by speed(0.40)
0.40
(44.27)
42.98
(63.55)
61.95
(61.00)
59.54
(83.53)
82.12
(98.50)
98.50
14Renewable energy consumption4.65914.75419.32722.72129.64662.573
15Secure Internet servers(131.40)
131.40
(1208.9)
1310.8
(5333.1)
7168.1
(18983.7)
23084.2
(21427.4)
25241
(277330.6)
277330.6
16Internet user(45.88)
45.88
(73.21)
73.26
(80.69)
80.70
(79.63)
79.69
(88.02)
88.11
(98.87)
98.87
17Total intramural R&D expenditure(17.80)
17.80
(28.70)
27.77
(33.60)
32.75
(34.32)
33.26
(39.65)
38.90
(53.30)
53.30
18Human resources in science and technology2.9005.5006.6007.0788.82513.000
19R&D expenditure(0.3816)
0.3816
(0.9653)
0.9653
(1.4108)
1.4108
(1.7244)
1.7297
(2.3666)
2.3700
(3.5272)
3.5272
20Patents related to recycling and secondary raw materials(0.0000)
0.0000
(0.1750)
0.1400
(0.4900)
0.4850
(0.6703)
0.6678
(1.0375)
1.0600
(3.2400)
3.2400
21Early leavers from education and training2.206.408.459.2711.8024.70
22Lifelong learning0.905.058.2510.9014.4034.70
23Students enrolled in tertiary education(2534)
2534
(3537)
3585
(4051)
4037
(4173)
4168
(4672)
4663
(7510)
7510
24Tertiary education15.3025.0731.9531.6838.3352.70
25Public expenditure on education(7.157)
7.157
(9.616)
9.618
(10.944)
10.962
(11.087)
11.096
(12.300)
12.362
(18.744)
18.744
26People with good or very good perceive health(42.80)
42.80
(59.75)
59.85
(67.05)
67.15
(65.57)
65.65
(72.90)
73.00
(84.10)
84.10
27Healthy life expectancy based on self perceived health(60.30)
60.30
(66.45)
66.50
(72.10)
72.15
(70.78)
70.85
(74.35)
74.62
(78.70)
78.70
28Total health care expenditure(4.730)
4.730
(6.827)
6.817
(8.670)
8.490
(8.568)
8.534
(10.338)
10.340
(12.820)
12.820
29Self-reported unmet need for medical examination and care(0.000)
0.000
(1.125)
1.175
(2.100)
2.100
(3.315)
3.307
(4.300)
4.430
(16.400)
16.400
30Health impacts of air pollution(1.00)
1.00
(34.00)
32.50
(62.00)
58.50
(66.50)
64.98
(95.25)
94.25
(219.00)
219.00
31Life expectancy at birth(71.40)
71.40
(76.95)
76.97
(80.90)
80.90
(79.48)
79.50
(81.70)
81.72
(84.00)
84.00
32Employment rate52.5066.8572.5071.0376.2281.80
33Participation rate48.5155.2358.9458.4061.1673.36
34Young people neither in employment nor in education and training5.509.8012.8013.7716.7028.10
35Labour productivity42.9064.9078.9591.91119.83209.80
36Average full time adjusted salary per employee(5266)
5266
(13102)
13102
(21620)
21620
(27415)
27415
(42125)
42125
(72247)
72247
37Fatal accidents at work(0.270)
0.270
(1.425)
1.387
(2.115)
2.095
(2.220)
2.177
(2.810)
2.763
(5.780)
5.780
38Recycling rates for packing waste(36.10)
36.10
(59.23)
58.67
(65.55)
64.95
(64.26)
63.44
(69.53)
69.33
(85.30)
85.30
39Recycling rate of municipal waste(10.30)
10.30
(28.10)
28.48
(36.30)
36.20
(37.34)
37.51
(48.10)
48.12
(68.30)
68.30
40Exposure to air pollution by particulate matter(0.0100)
0.0100
(0.0500)
0.0500
(0.0900)
0.0900
(0.1783)
0.1708
(0.2400)
0.2300
(1.0200)
1.0200
41Air pollution4.8010.4014.1014.5619.0029.30
42Circular material use rate1.3004.3007.4009.06711.60033.800
43Grow of forest area(−0.9676)
−0.9676
(0.0000)
0.0000
(0.03512)
0.3512
(0.06066)
0.06066
(0.09979)
0.09979
(0.53171)
0.53171
44Climate related economic loses20.6057.4072.3074.3487.53138.80
() data before missing data imputation by MICE method.

Appendix C. Optimal Number of Clusters in kml3d, Callinski Harabatz Statistics

Figure A1. Optimal number of clusters in kml3d, Callinski Harabatz statistics.
Sustainability 15 10697 g0a1

Appendix D. Countries’ Competitiveness Indices and Ranks

Figure A2. Countries’ competitiveness indices and ranks, 2012—2021.
Sustainability 15 10697 g0a2

Appendix E. Decomposition of the Total Inertia on PCA Components (%)

Figure A3. Decomposition of the Total Inertia on PCA Components (%).
Sustainability 15 10697 g0a3aSustainability 15 10697 g0a3b
Figure A4. PCA of clusters.
Sustainability 15 10697 g0a4aSustainability 15 10697 g0a4bSustainability 15 10697 g0a4c

References

  1. EC. A new Circular Economy Action Plan: For a Cleaner and More Competitive Europe. 2020. Available online: https://eur-lex.europa.eu/legal-content/EN/TXT/?qid=1583933814386&uri=COM:2020:98:FIN (accessed on 12 April 2023).
  2. Doyle, E.; Alaniz, M.P. Dichotomous impacts on social and environmental sustainability: Competitiveness and development levels matter. Competitiveness Rev. Int. Bus. J. 2020, 31, 771–791. [Google Scholar] [CrossRef]
  3. Rodríguez-Antón, J.M.; Rubio-Andrada, L.; Celemín-Pedroche, M.S. From the circular economy to the sustainable development goals in the European Union: An empirical comparison. Int. Environ. Agreem. Politics Law Econ. 2022, 22, 67–95. [Google Scholar] [CrossRef] [PubMed]
  4. Giannakitsidou, O.; Giannikos, I.; Chondrou, A. Ranking European countries on the basis of their environmental and circular economy performance: A DEA application in MSW. Waste Manag. 2020, 109, 181–191. [Google Scholar] [CrossRef]
  5. Krinjarić, T. Re-examining sustainable development in Europe: A data envelopment approach. Int. J. Environ. Sustain. Dev. 2020, 19, 72–108. [Google Scholar] [CrossRef]
  6. Kotseva-Tikova, M.; Dvorak, J. Climate Policy and Plans for Recovery in Bulgaria and Lithuania. Rom. J. Eur. Aff. 2022, 22, 79–99. [Google Scholar] [CrossRef]
  7. Trippl, M.; Baumgartinger-Seiringer, S.; Frangenheim, A.; Isaksen, A.; Rypestøl, J.O. Unravelling green regional industrial path development: Regional preconditions, asset modification and agency. Geoforum 2020, 111, 189–197. [Google Scholar] [CrossRef]
  8. Kirchherr, J.; Piscicelli, L.; Bour, R.; Kostense-Smit, E.; Muller, J.; Huibrechtse-Truijens, A.; Hekkert, M. Barriers to the Circular Economy: Evidence From the European Union (EU). Ecol. Econ. 2018, 150, 264–272. [Google Scholar] [CrossRef] [Green Version]
  9. Nentjes, A.; de Vries, F.P.; Wiersma, D. Technology-forcing through environmental regulation. Eur. J. Politi Econ. 2007, 23, 903–916. [Google Scholar] [CrossRef]
  10. Schmitt-Egner, P. The Concept of ‘Region’: Theoretical and Methodological Notes on its Reconstruction. J. Eur. Integr. 2002, 24, 179–200. [Google Scholar] [CrossRef]
  11. Hermann, C. Crisis, structural reform and the dismantling of the European Social Model(s). Econ. Ind. Democr. 2016, 38, 51–68. [Google Scholar] [CrossRef]
  12. Burghelea, C.; Ene, C.M.; Uzlău, C. Impact of economic models on European Union economies development. Theor. Appl. Econ. 2013, XX, 89–100. [Google Scholar]
  13. Golinowska, S.; Zukowski, M. Diversity and Commonality in European Social Policies: The Forging of a European Social Model. In Friedrich-Ebert-Stiftung and Wydawnictwo Naukowe Scholar, Warsaw; Golinowska, S., Hengstenberg, P., Zukowski, M., Eds.; 2009; pp. 13–21. Available online: https://www.researchgate.net/publication/293806844_Diversity_and_Commonality_in_European_Social_Policies_The_Forging_of_a_European_Social_Model (accessed on 12 April 2023).
  14. Martin, R.; Sunley, P. Path dependence and regional economic evolution. J. Econ. Geogr. 2006, 6, 395–437. [Google Scholar] [CrossRef] [Green Version]
  15. Lall, S. Technological capabilities and industrialization. World Dev. 1992, 20, 165–186. [Google Scholar] [CrossRef]
  16. Frantzeskaki, N.; Loorbach, D. Towards governing infrasystem transitions: Reinforcing lock-in or facilitating change? Technol. Forecast. Soc. Chang. 2010, 77, 1292–1301. [Google Scholar] [CrossRef]
  17. Perruchas, F.; Consoli, D.; Barbieri, N. Specialisation, diversification and the ladder of green technology development. Res. Policy 2020, 49, 103922. [Google Scholar] [CrossRef]
  18. Boschma, R.; Frenken, K. The emerging empirics of evolutionary economic geography. J. Econ. Geogr. 2011, 11, 295–307. [Google Scholar] [CrossRef] [Green Version]
  19. Martin, R. Roepke Lecture in Economic Geography-Rethinking Regional Path Dependence: Beyond Lock-in to Evolution. Econ. Geogr. 2010, 86, 1–27. [Google Scholar] [CrossRef]
  20. Klitkou, A.; Bolwig, S.; Hansen, T.; Wessberg, N. The role of lock-in mechanisms in transition processes: The case of energy for road transport. Environ. Innov. Soc. Transit. 2015, 16, 22–37. [Google Scholar] [CrossRef] [Green Version]
  21. Klitkou, A.; Fevolden, A.M.; Capasso, M. From Waste to Value: Valorisation Pathways for Organic Waste Streams in Circular Bioeconomies, 1st ed.; Routledge: London, UK, 2019. [Google Scholar] [CrossRef] [Green Version]
  22. Kar, S.; Roy, A.; Sen, K. The double trap: Institutions and economic development. Econ. Model. 2018, 76, 243–259. [Google Scholar] [CrossRef]
  23. Ketels, C.; Porter, M.E. Rethinking the role of the EU in enhancing European competitiveness. Competitiveness Rev. Int. Bus. J. 2020, 31, 189–207. [Google Scholar] [CrossRef]
  24. Festa, G.; Rossi, M.; Vrontis, D. Guest editorial: Reinterpreting competitive strategies in turbulent scenarios. Competitiveness Rev. Int. Bus. J. 2022, 32, 277–281. [Google Scholar] [CrossRef]
  25. Hansen, T.; Coenen, L. The geography of sustainability transitions: Review, synthesis and reflections on an emergent research field. Environ. Innov. Soc. Transit. 2015, 17, 92–109. [Google Scholar] [CrossRef] [Green Version]
  26. Mazzucato, M. Mission-oriented innovation policies: Challenges and opportunities. Ind. Corp. Chang. 2018, 27, 803–815. [Google Scholar] [CrossRef] [Green Version]
  27. Porter, M.E.; van der Linde, C. Toward a New Conception of the Environment-Competitiveness Relationship. J. Econ. Perspect. 1995, 9, 97–118. [Google Scholar] [CrossRef] [Green Version]
  28. Jaffe, A.B.; Palmer, K. Environmental Regulation and Innovation: A Panel Data Study. Rev. Econ. Stat. 1997, 79, 610–619. [Google Scholar] [CrossRef]
  29. Dabbous, A.; Barakat, K.A.; Kraus, S. The impact of digitalization on entrepreneurial activity and sustainable competitiveness: A panel data analysis. Technol. Soc. 2023, 73, 102224. [Google Scholar] [CrossRef]
  30. Schwab, K. The Fourth Industrial Revolution; Portfolio Penguin: London, UK, 2017. [Google Scholar]
  31. Stiglitz, J. The Current Economic Crisis and Lessons for Economic Theory. East. Econ. J. 2009, 35, 281–296. [Google Scholar] [CrossRef] [Green Version]
  32. Sgambati, S.; Gargiulo, C. The evolution of urban competitiveness studies over the past 30 years. A bibliometric analysis. Cities 2022, 128, 103811. [Google Scholar] [CrossRef]
  33. WEF. Beyond the Equity-Efficiency Trade-Off: Practical Ideas for Inclusive Growth and Competitiveness in Europe. 2015. Available online: https://www3.weforum.org/docs/WEF_EUROPE-LAB.pdf (accessed on 12 April 2023).
  34. Fischer, C. Green Competitiveness. 2011. Available online: https://ec.europa.eu/economy_finance/events/2011/2011-11-21-annual-research-conference_en/pdf/session032_fischer_en.pdf (accessed on 12 April 2023).
  35. Weick, V. Chapter 6: Green Economy and sustainable development. In Waste Management and the Green Economy; Kummer Peiry, K., Ziegler, A.R., Baumgartner, J., Eds.; Edward Elgar Publishing: Cheltenham, UK, 2016; pp. 121–150. [Google Scholar] [CrossRef]
  36. Turok, I. Cities, Regions and Competitiveness. Reg. Stud. 2004, 38, 1069–1083. [Google Scholar] [CrossRef]
  37. Luo, Y.; Mensah, C.N.; Lu, Z.; Wu, C. Environmental regulation and green total factor productivity in China: A perspective of Porter’s and Compliance Hypothesis. Ecol. Indic. 2022, 145, 109744. [Google Scholar] [CrossRef]
  38. Rexhäuser, S.; Rammer, C. Environmental Innovations and Firm Profitability: Unmasking the Porter Hypothesis. Environ. Resour. Econ. 2013, 57, 145–167. [Google Scholar] [CrossRef]
  39. Lanoie, P.; Laurent-Lucchetti, J.; Johnstone, N.; Ambec, S. Environmental Policy, Innovation and Performance: New Insights on the Porter Hypothesis. J. Econ. Manag. Strat. 2011, 20, 803–842. [Google Scholar] [CrossRef] [Green Version]
  40. OECD. Green Policies and Firms’ Competitiveness. 2018. Available online: https://www.oecd.org/greengrowth/GGSD_2018_Competitiveness%20Issue%20Paper_WEB.pdf (accessed on 14 April 2023).
  41. OECD. Towards Green Growth: Monitoring Progress OECD Indicators. 2019. Available online: https://www.oecd.org/greengrowth/48224574.pdf (accessed on 14 April 2023).
  42. Geyer, R. The Business of Less: The Role of Companies and Households on a Planet in Peril, 1st ed.; Routledge: London, UK, 2021. [Google Scholar] [CrossRef]
  43. Choe, K.A.; Roberts, B.H. Competitive Cities in the 21st Century: Cluster-Based Local Economic Development; Asian Development Bank: Mandaluyong City, Philippines, 2011; ISBN 978-92-9092-431-9. [Google Scholar]
  44. Fankhauser, S.; Bowen, A.; Calel, R.; Dechezleprêtre, A.; Grover, D.; Rydge, J.; Sato, M. Who will win the green race? In search of environmental competitiveness and innovation. Glob. Environ. Chang. 2013, 23, 902–913. [Google Scholar] [CrossRef] [Green Version]
  45. Aiginger, K.; Bärenthaler-Sieber, S.; Vogel, J. Competitiveness under New Perspectives. Working Paper No. 44, WIFO. 2013. Available online: https://www.wifo.ac.at/jart/prj3/wifo/resources/person_dokument/person_dokument.jart?publikationsid=47019&mime_type=application/pdf (accessed on 14 April 2023).
  46. Schumpeter, J. Capitalism, Socialism and Democracy; Harper and Row: New York, NY, USA, 1942. [Google Scholar]
  47. Zheng, S.; Pu, Y.; Lu, H.; Zhang, J.J.; Wang, D.; Ma, X. Global climate policy effectiveness: A panel data analysis. J. Clean. Prod. 2023, 412, 137321. [Google Scholar] [CrossRef]
  48. Wolf, M.J.; Emerson, J.W.; Esty, D.C.; de Sherbinin, A.; Wendling, Z.A. 2022 Environmental Performance Index. Yale Center for Environmental Law & Policy: New Haven, CT, USA. 2022. Available online: https://epi.yale.edu/ (accessed on 14 April 2023).
  49. Despotovic, D.; Cvetanovic, S.; Nedic, V.; Despotovic, M. Social Aspects of Sustainable Competitiveness in the Selected European Countries in the Period 2012–2015. Soc. Indic. Res. 2018, 141, 841–860. [Google Scholar] [CrossRef]
  50. Wang, M.; Feng, C. The win-win ability of environmental protection and economic development during China’s transition. Technol. Forecast. Soc. Chang. 2021, 166, 120617. [Google Scholar] [CrossRef]
  51. Schwab, K. The Global Competitiveness Report 2019. World Economic Forum. 2019. Retrieved 15 December 2020. Available online: http://www3.weforum.org/docs/WEF_TheGlobalCompetitivenessReport2019.pdf (accessed on 17 April 2023).
  52. Zhang, H.; Geng, Z.; Yin, R.; Zhang, W. Regional differences and convergence tendency of green development competitiveness in China. J. Clean. Prod. 2020, 254, 119922. [Google Scholar] [CrossRef]
  53. Dolge, K.; Kubule, A.; Blumberga, D. Composite index for energy efficiency evaluation of industrial sector: Sub-sectoral comparison. Environ. Sustain. Indic. 2020, 8, 100062. [Google Scholar] [CrossRef]
  54. Azis, I. Regional Economics: Fundamental Concepts, Policies, and Institutions; World Scientific Publishing: Singapore, 2020; p. 166. [Google Scholar] [CrossRef]
  55. Shen, N.; Li, J. Improved structured sparse PCA for cluster-based co-saliency detection. In Proceedings of the 7th International Conference on Internet Multimedia Computing and Service (ICIMCS ‘15), Zhangjiajie, China, 19–21 August 2015; pp. 1–4. [Google Scholar] [CrossRef]
  56. Dagilienė, L.; Bruneckienė, J.; Varaniūtė, V.; Lukauskas, M. The circular economy for sustainable develop-ment: Implementation strategies in advanced small open economies. Int. J. Environ. Sustain. Dev. 2023, 22, 51–76. [Google Scholar] [CrossRef]
  57. Mi, Z.; Zeng, G.; Xin, X.; Shang, Y.; Hai, J. The extension of the Porter hypothesis: Can the role of environmental regulation on economic development be affected by other dimensional regulations? J. Clean. Prod. 2018, 203, 933–942. [Google Scholar] [CrossRef]
  58. Chen, Y.P.; Zhuo, Z.; Huang, Z.; Li, W. Environmental regulation and ESG of SMEs in China: Porter hypothesis re-tested. Sci. Total. Environ. 2022, 850, 157967. [Google Scholar] [CrossRef] [PubMed]
  59. Albrizio, S.; Kozluk, T.; Zipperer, V. Environmental policies and productivity growth: Evidence across industries and firms. J. Environ. Econ. Manag. 2017, 81, 209–226. [Google Scholar] [CrossRef]
Figure 1. Research methodology for impact analysis and identification strategies. Source: designed by the authors.
Sustainability 15 10697 g001
Figure 2. The relationship between the countries’ competitiveness index and CO2 emissions.
Sustainability 15 10697 g002
Figure 3. Results of green competitiveness clustering and matrix. (The figure shows a 10-year period, with 2012 marked as 1 and 2021 as 10).
Sustainability 15 10697 g003
Figure 4. Trajectories of EU countries’ competitiveness indices and CO2 emissions in 2012–2021. (Euclidean distance).
Sustainability 15 10697 g004aSustainability 15 10697 g004b
Table 1. The main differences between the sustainable competitiveness and green competitiveness concepts.
CriteriaSustainable CompetitivenessGreen Competitiveness
PillarsSustainable competitiveness includes social, economic and environmental development [29]Balance between economic and environmental development [1]
FocusBalance among different pillarsFinding new areas of competitiveness [34]. Sustainability remains the vital long-term goal, but the Green Economy is described as the pathway to sustainable development [35]
FocusEconomic viability, social well-being, and environmental stewardshipEnvironmental preservation, resource efficiency, clean production and energy, carbon footprint reduction
Innovation and TechnologySustainable innovation and technologies across sectorsFocusing on the development and adoption of green technologies, clean energy solutions, and resource-efficient processes
PracticesTotal entrepreneurial activity is a driver for sustainable competitiveness [29]Primarily centered on environmental factors and eco-friendly practices
Table 2. Green competitiveness factors and profiles.
ClusterCluster Characterization and Competitiveness FactorsGreen Competitiveness Profiles
RedThis cluster is characterised by developing countries with a high reliance on exports (based on indicators in PCA: low export market share per 5 years, low trade of DGP) and a need for economic modernisation (low labour productivity per hour, low GDP per capita). Economic development driven by government stimulation (compliance with EU policy) (no foreign direct investment, low export market share per 5 years, low trade as share of GDP), small and medium-sized enterprises (enterprises per 100,000 people), focusing on core industries—tourism and manufacturing, as well as education. Economically underdeveloped markets, low CO2. Labour-intensive economic activities do not generate CO2 intensively. Government sector influences economic development. This cluster is a mixure of the central and eastern model (Latvia, Romania, Bulgaria, Hungary, Slovakia, Croatia) and the southern/Mediterranean model (Greece, Portugal) [11,12,13]Relatively low competitiveness and relatively low CO2 emissions
YellowThis cluster may be characterised by economic development driven by innovation (hight labour productivity per hour, ICT service export, export market shares per 5 years), high-tech exports, productivity oriented towards environmental sustainability, sustainable urban planning (high urban population, low air pollution and high percentage of the population in good or very good health), education and research (high R&D expenditure as share of GDP). Although consumption occurs at a high level, innovations in environmental sustainability and education create the conditions for reducing CO2 emissions from rising consumption and changing the behaviour patterns. This cluster is characterised by the Scandinavian model, which focuses on striking a balance between market relations and state regulation (į.e., welfare states) [11,12,13].Relatively high competitiveness and relatively low CO2 emissions
GreenThis cluster is characterised by small open economies, attracting foreign investment (foreign direct investment), diverse economic structure (different kinds of service, manufacturers), export-oriented growth and a focus on digitalisation and innovation adoption (ICT service exports, high-tech export). Economic development driven by government stimulation (compliance with EU policy), productivity and innovation adoption (high average full-time adjusted salary per employee, high labour productivity per hour), export orientation, and education and research (R&D expenditure as share of GDP, health care expenditure as share of GDP). Small markets, relatively low consumption, orientation towards eco-efficiency and exports mean that CO2 emissions are relatively low. This cluster is a mixure of the central and eastern model’s ‘catching-up’ sub-model and the continental model (Austria) [11,12,13].Relatively high competitiveness and relatively low CO2 emissions
BlueThis cluster is characterised by big economies and diverse economic structures with sum hubs of high value-added industries. Economic development is promoted by high productivity (high productivity per hour, high GDP per capita, average full time adjusted salary per employee), which is focused on digitalisation (individuals using the internet, R&D expenditure as share of GDP), the introduction of new innovations, and high consumption within countries (high urban population, high household expenditure as share of GDP). Big markets, high consumption, high CO2—but innovations in environmental sustainability and education are offsetting the rate of CO2 increase due to consumption. This cluster is a mixure of the southern/Mediterranean (Italy, Spain); central and eastern (Poland), and continental (France) models [11,12,13].Relatively high competitiveness and relatively low CO2 emissions
PurpleEconomic development driven by high-productivity manufacturing, oriented towards digitalisation (R&D expenditure as share of GDP) and climate mitigation policies such eco-efficiency and recycling (high packing waste recycling rate, high circular material use rate, high share of renewable energy), education (expenditure on education as share of GDP) and high consumption (household expenditure as share of GDP). It stands out due to its high CO2 emissions due to high production volumes and high levels of consumption. Nevertheless, this cluster is characterised by the fact that production is focused on innovations that are based on digitisation. This cluster is characterised by the Rhenish (German) model [11,12,13].Relatively high competitiveness and relatively high CO2 emissions
Table 3. Matrix of green competitiveness progress strategies.
Profile: relatively high competitiveness and relatively high CO2 emissions
Progress strategy (1): Potential growth of green competitiveness
Countries (purple cluster): Germany
Sustainability 15 10697 i001Climate neutrality
Profile: relatively low competitiveness and relatively low CO2 emissions
Progress strategy (2): lagging increase in green competitiveness
Countries (red cluster): Bulgaria, Greece, Hungary, Latvia, Romania, Portugal, Slovakia, Croatia
Profile: relatively high competitiveness and relatively low CO2 emissions
Progress strategy (1): Inspiring steady growth in green competitiveness.
Countries (yellow cluster): Belgium, Finland, Denmark, Ireland, Netherlands, Sweden
Progress strategy (2): Threatening stagnation of green competitiveness.
Countries (blue cluster): France, Italy, Poland, Spain
Progress strategy (3): Shocking growth in green competitiveness, transitioning to slower growth
Countries (green cluster): Austria, Czech Republic, Estonia, Lithuania, Slovenia
Competitiveness
Sustainability 15 10697 i002
Disclaimer/Publisher’s Note: The statements, opinions and data contained in all publications are solely those of the individual author(s) and contributor(s) and not of MDPI and/or the editor(s). MDPI and/or the editor(s) disclaim responsibility for any injury to people or property resulting from any ideas, methods, instructions or products referred to in the content.

