
A Novel Machine Learning Approach for Solar Radiation Estimation


 and
and
Abstract
:1. Introduction
- We employ an FS method with which to pick out essential feature sets from the initial feature sets using various models;
- We measure each model’s feature importance score, RMSE, and R2 against the others by assessing their performance on an NCEP (National Centers for Environmental Prediction) dataset.
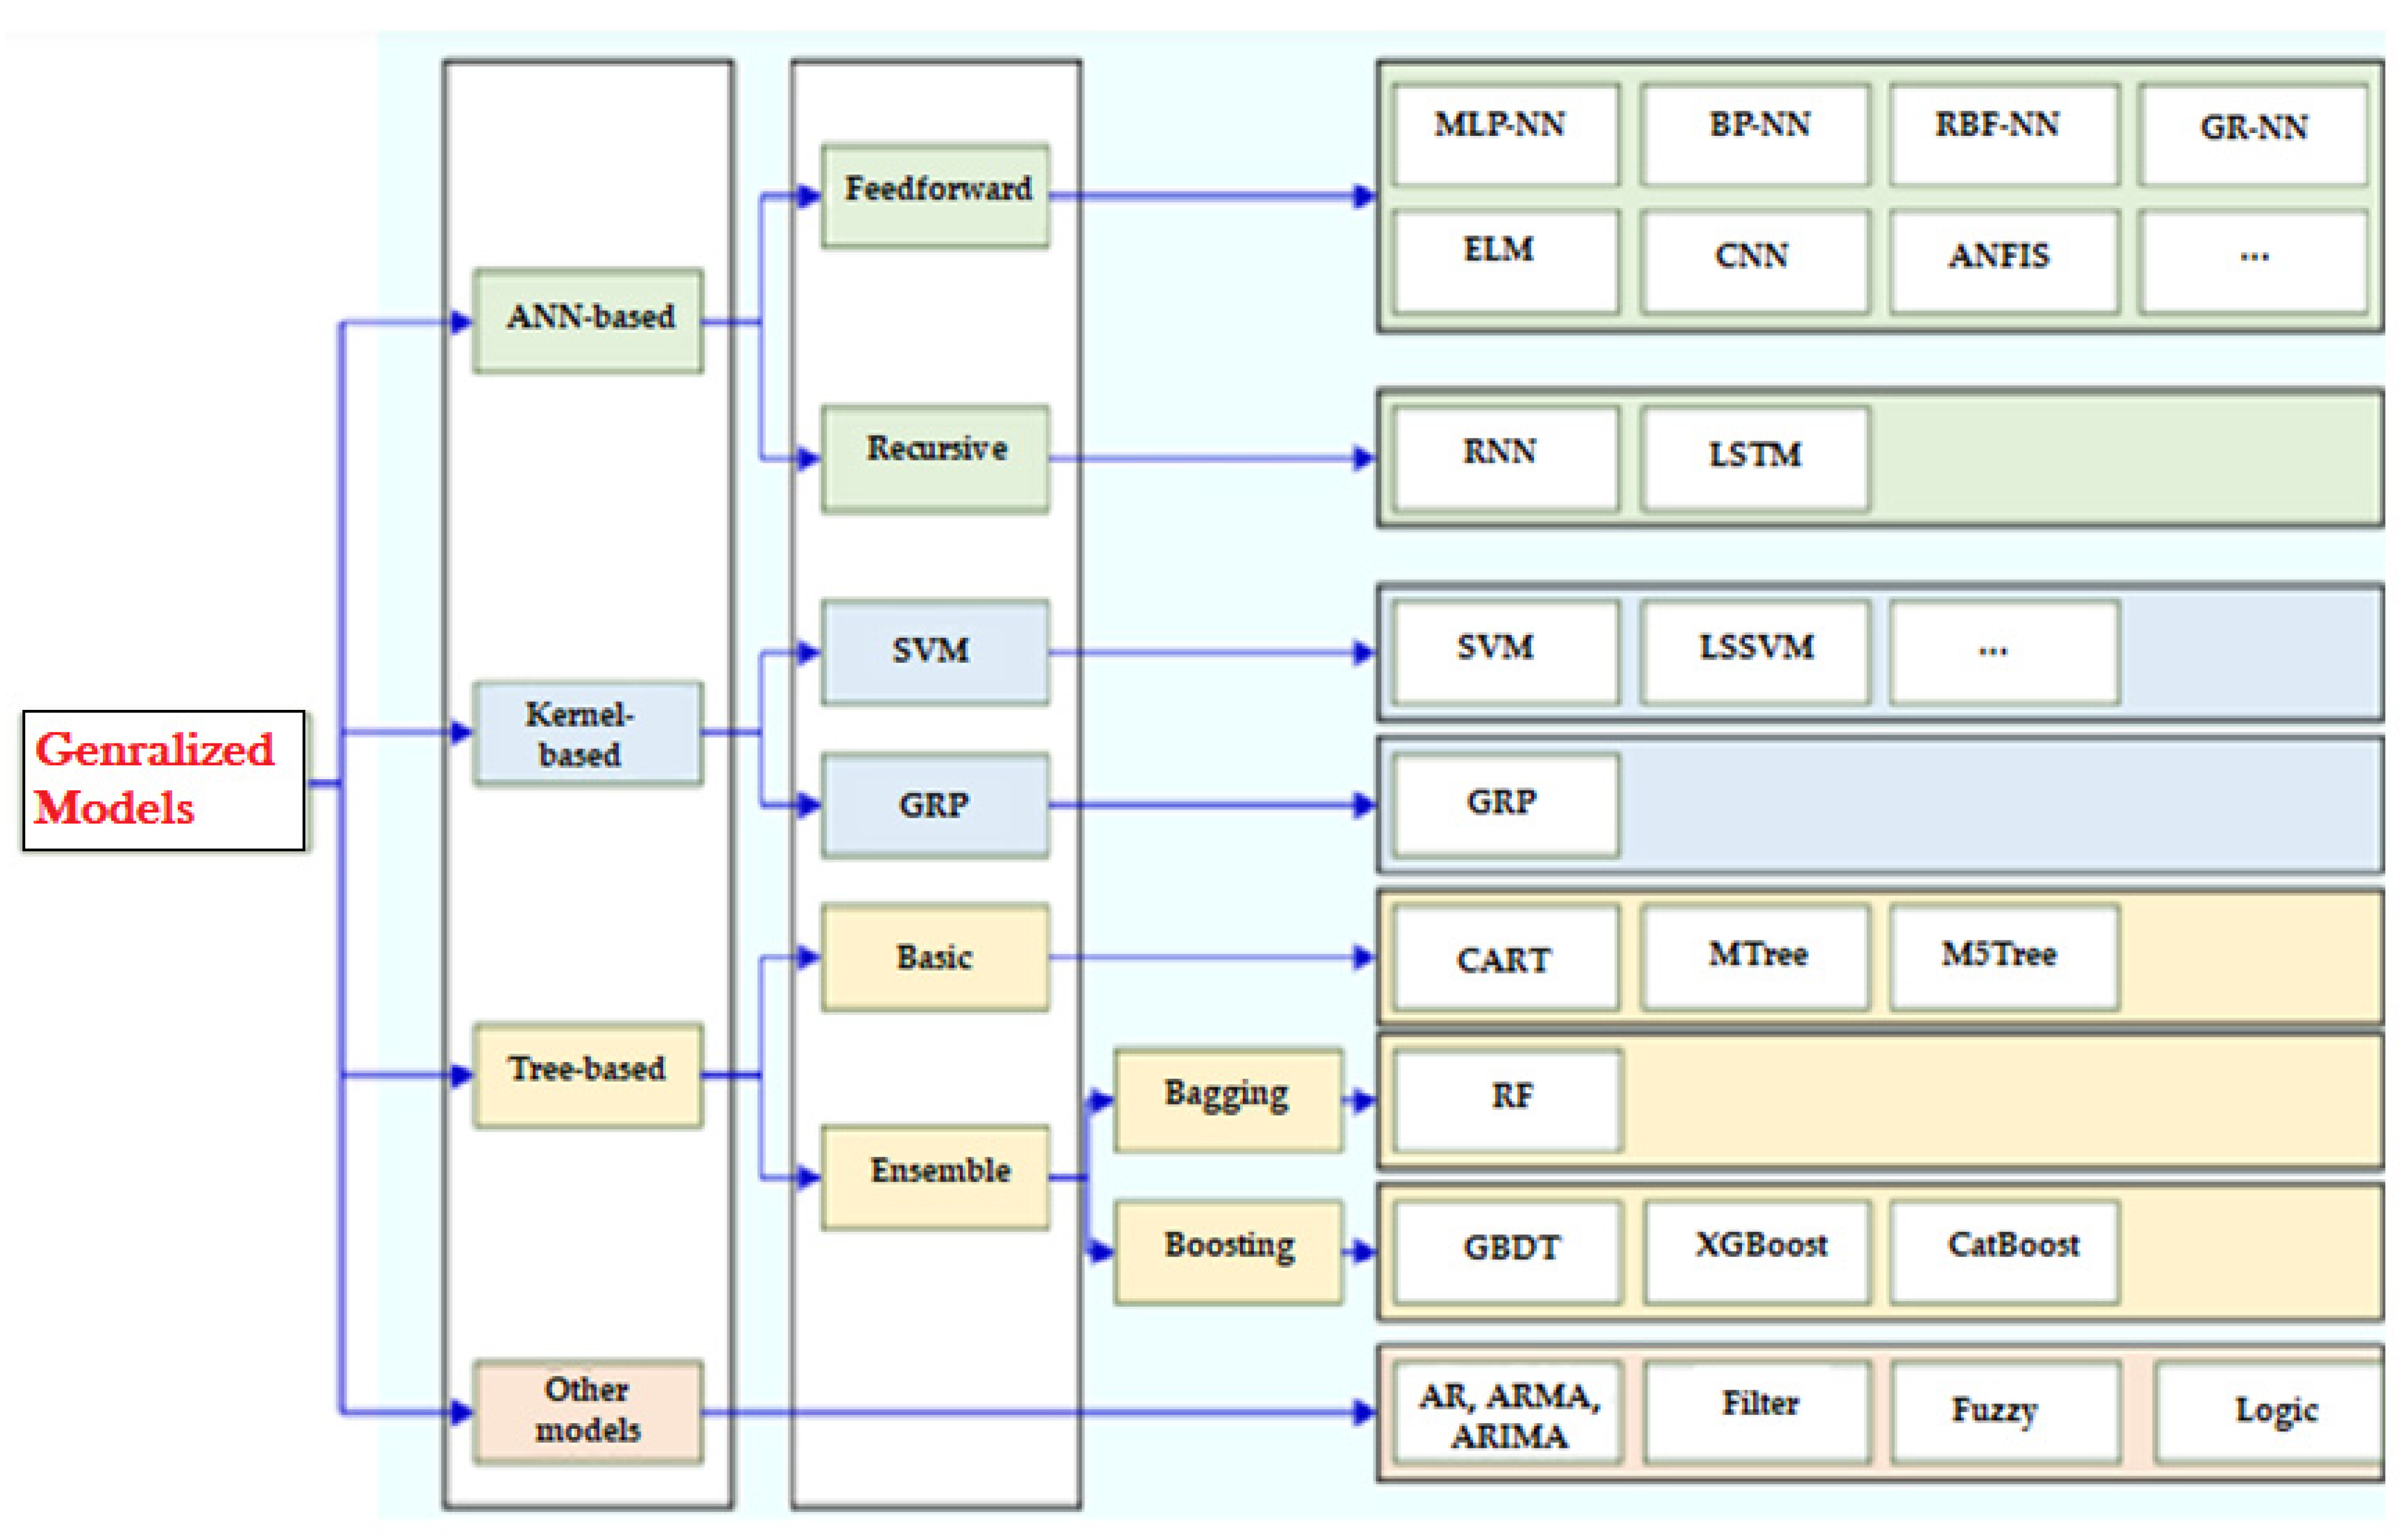
2. Related Works
3. Our Proposed Approach
- Import records from CSV files;
- To ascertain the crucial correlation among all the features employed in the training process, we first need to determine the number of features in the training set;
- After determining the number of features in the previous step, the Recursive Feature Elimination (RFE) technique is applied to identify the features from the CSV files that exhibit the strongest correlation;
- In order to divide the dataset into distinct folds for training and testing, we must indicate the number of folds (in this case, ten folds are chosen);
- Divide the dataset into numerous folds, with one allocated for testing and the remainder for training, through k-fold cross-validation;
- Train the data using various algorithms (RF, DT, LR, Pr, GBM) to then train the model using the created training dataset. It is then used to test the rest of the dataset compared to the randomly selected feature;
- In the next step, the trained model is applied to the test dataset, and various metrics are computed in order to assess the accuracy and efficacy of the model;
- After calculating the scoring metrics, the final results are displayed and graphed.
4. Experimental Study and Results
4.1. Environment Description
- Training the ML algorithm implemented in the heart of the model;
- Ranking the features based on their importance;
- Eliminating the insignificant features and providing the model with further training;
- Continuing the procedure until the intended quantity of features is chosen;
- Creating a metric of importance for variables that sorts the predictors according to their relevance once the entire model has been built;
- In every cycle, the model is reconstructed after eliminating the least significant predictors.
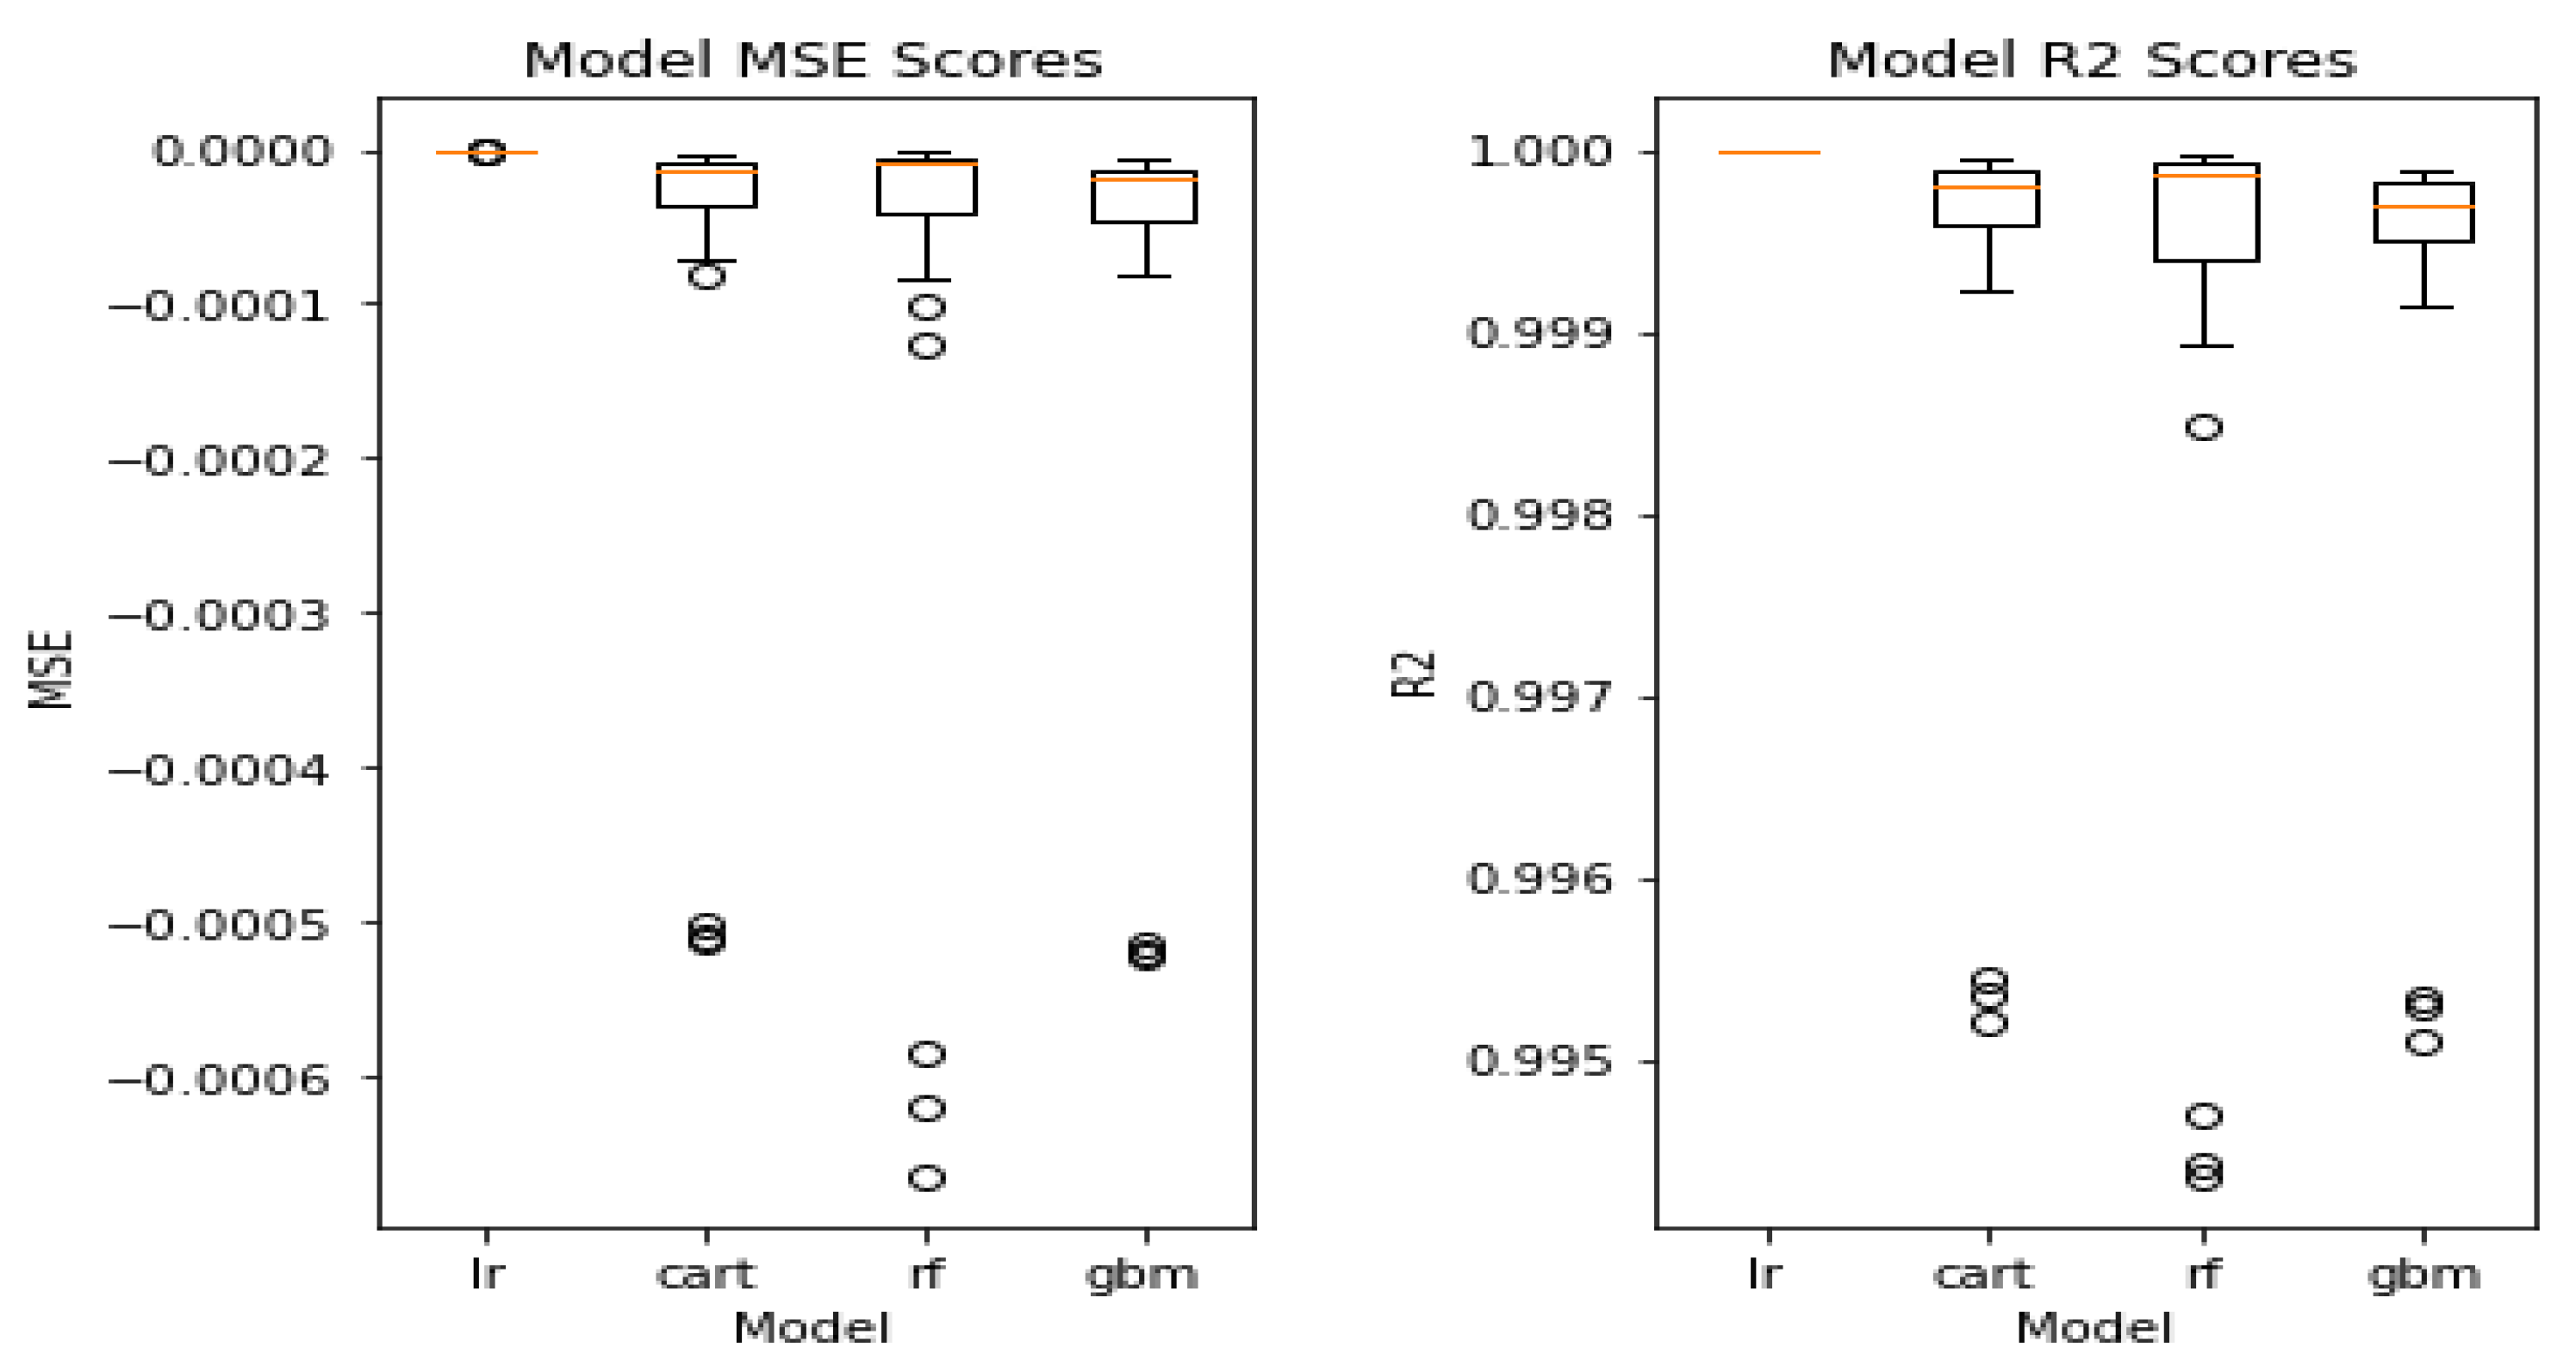
4.2. Discussion of Results
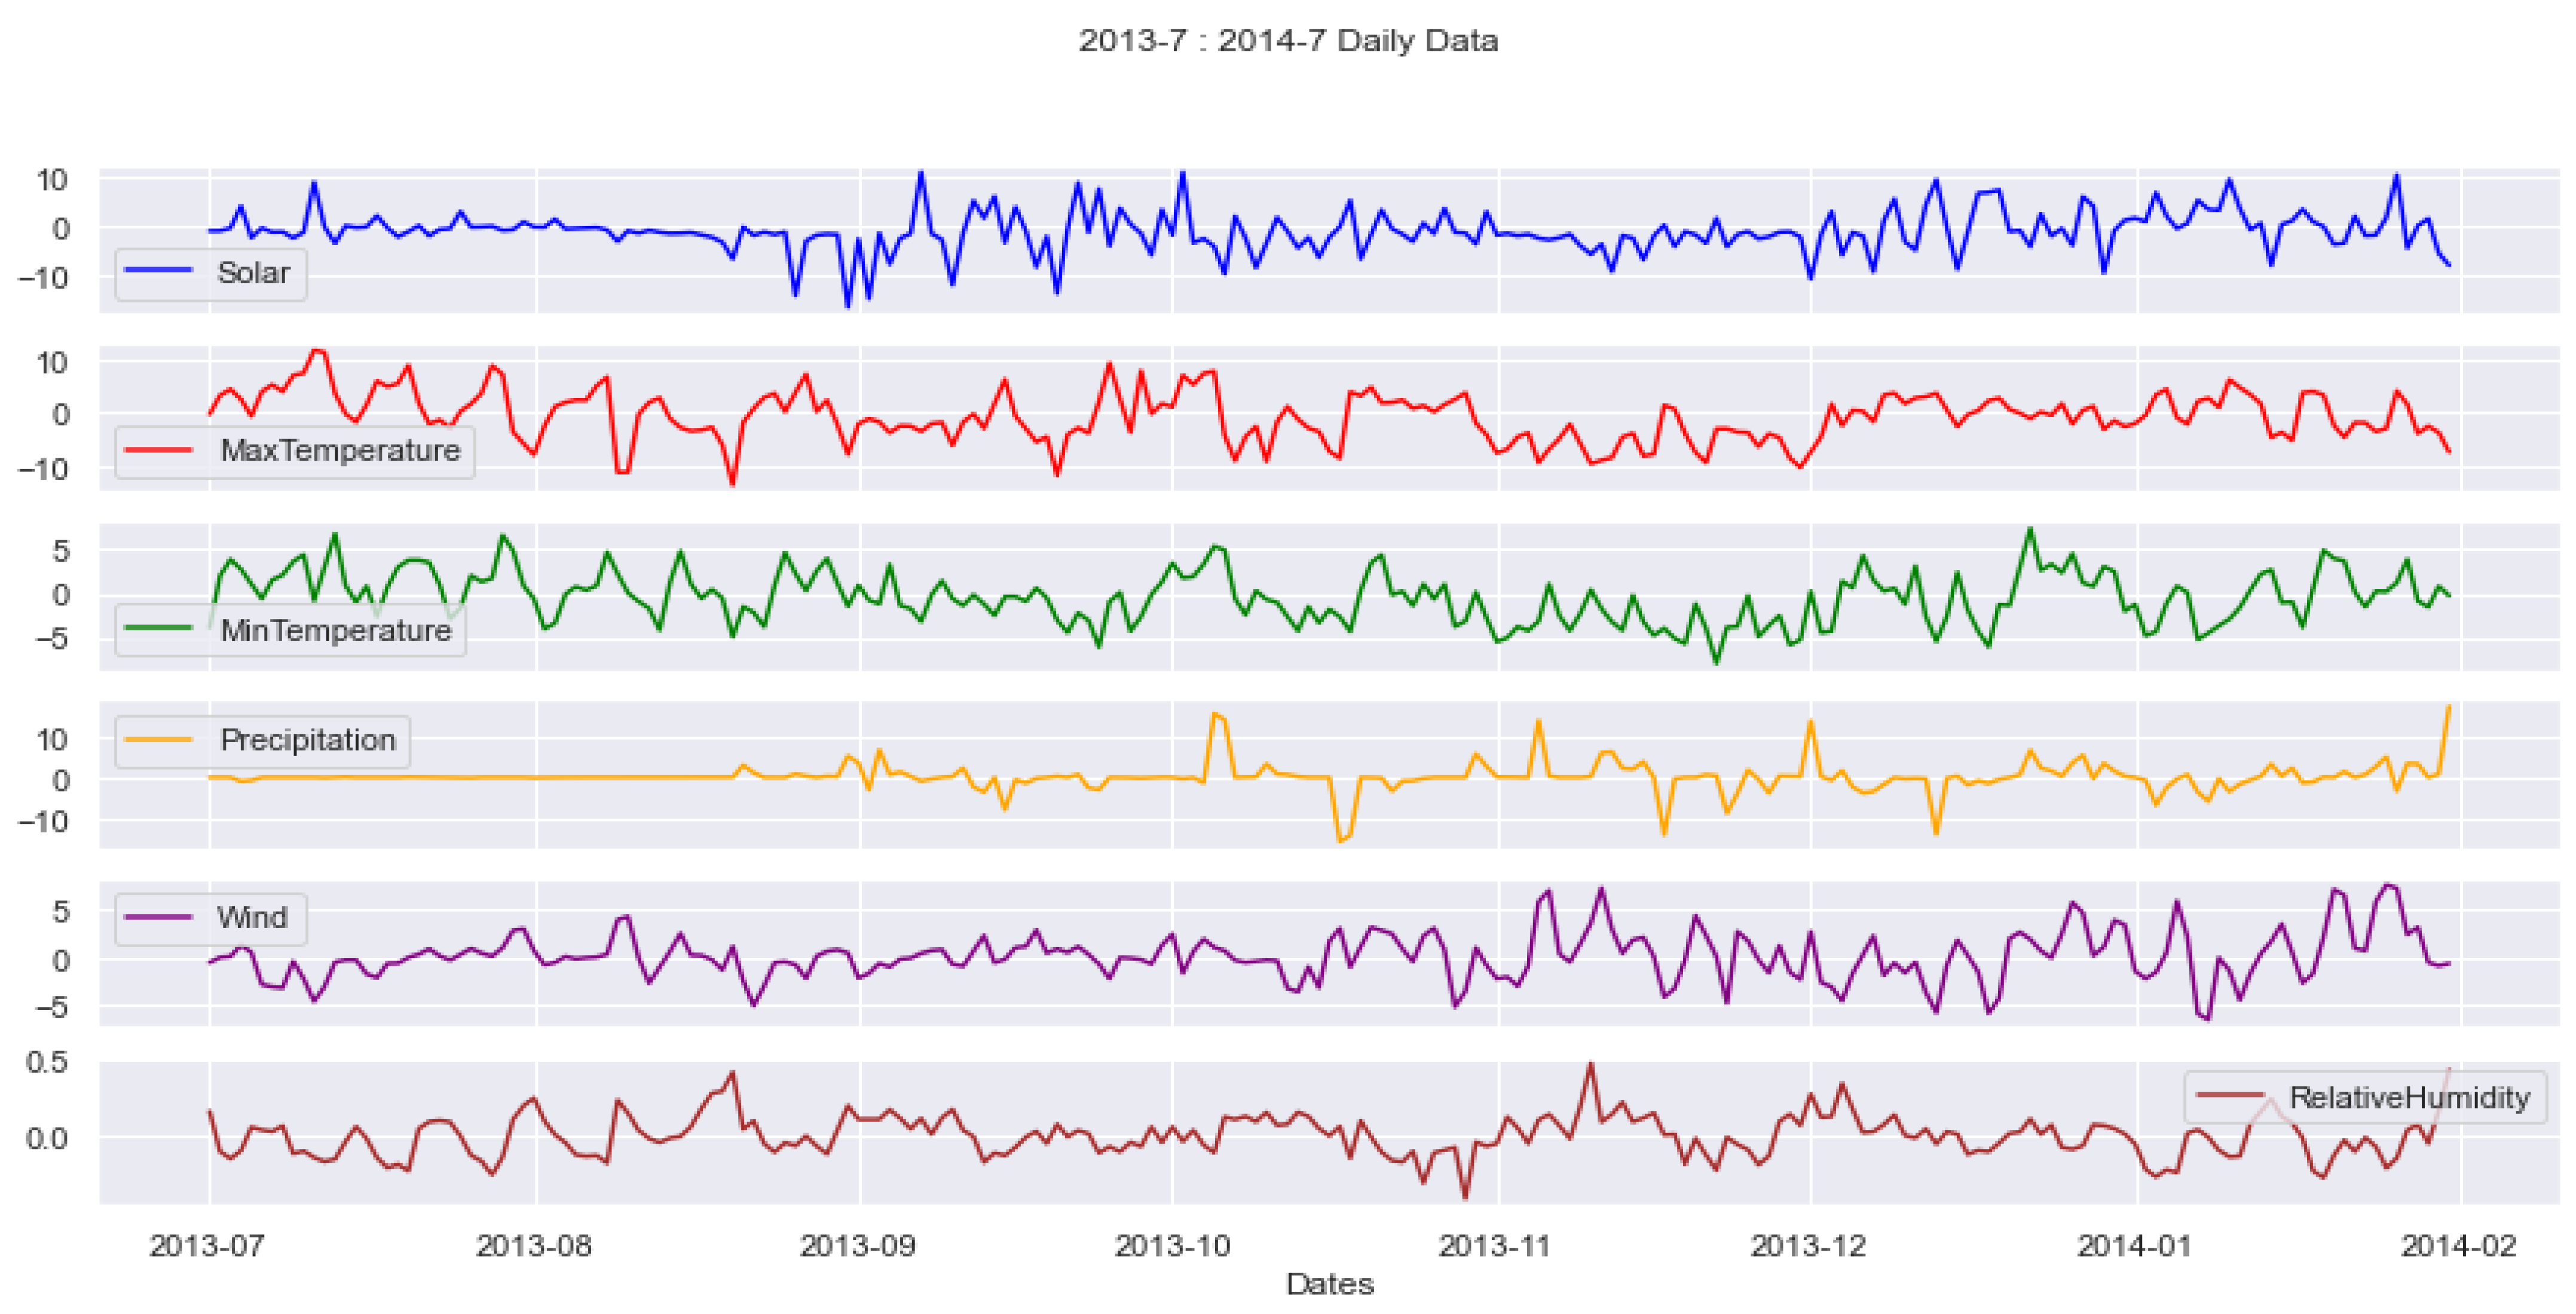
- MaxTemperature of months 12, 10, 4, and 1;
- MinTemperature of months 12, 11, 10, 6, 4, 3, 2, and 1;
- Precipitation of months 12, 11, 10, 7, and 1;
- Wind speed of months 12, 11, 7, 6, and 1;
- Relative humidity of months 11 and 3.
- MaxTemperature of months 12, 10, 4, and 1;
- MinTemperature of months 12, 10, 6, 5, 4, 3, 2, and 1;
- Precipitation of months 12, 9, 8, 6, and 1;
- Wind speed of months 12, 9, 6, and 1;
- Relative humidity of months 11, 9, 5, and 2.
5. Conclusions
- MaxTemperature of months 12, 10, 4, and 1: The maximum temperature during these months likely captures seasonal variations and their impact on solar radiation levels;
- MinTemperature of months 12, 10, 6, 4, 3, 2, and 1: The minimum temperature during these months provides insights into the daily temperature range, which can influence solar radiation patterns;
- Precipitation of months 12 and 1: The amount of precipitation during these months may affect cloud cover and atmospheric conditions, impacting solar radiation levels;
- Wind speed of months 12, 6, and 1: The wind speed during these months is an indicator of atmospheric dynamics, which can influence the dispersion of clouds and affect solar radiation availability;
- Relative humidity of month 11: The relative humidity in month 11 likely represents a critical period for moisture content in the air, which can affect solar radiation absorption and scattering.
Author Contributions
Funding
Institutional Review Board Statement
Informed Consent Statement
Conflicts of Interest
References
- Huang, L.; Kang, J.; Wan, M.; Fang, L.; Zhang, C.; Zeng, Z. Solar Radiation Prediction Using Different Machine Learning Algorithms and Implications for Extreme Climate Events. Front. Earth Sci. 2021, 9, 596860. [Google Scholar] [CrossRef]
- Rohani, A.; Taki, M.; Abdollahpour, M. A novel soft computing model (Gaussian process regression with K-fold cross validation) for daily and monthly solar radiation forecasting (Part: I). Renew. Energy 2018, 115, 411–422. [Google Scholar] [CrossRef]
- Zhang, Y.; Cui, N.; Feng, Y.; Gong, D.; Hu, X. Comparison of BP, PSO-BP and statistical models for predicting daily global solar radiation in arid Northwest China. Comput. Electron. Agric. 2019, 164, 104905. [Google Scholar] [CrossRef]
- Ağbulut, Ü.; Gürel, A.E.; Biçen, Y. Prediction of daily global solar radiation using different machine learning algorithms: Evaluation and comparison. Renew. Sustain. Energy Rev. 2021, 135, 110114. [Google Scholar] [CrossRef]
- Chaibi, M.; Benghoulam, E.M.; Tarik, L.; Berrada, M.; Hmaidi, A.E. An Interpretable Machine Learning Model for Daily Global Solar Radiation Prediction. Energies 2021, 21, 7367. [Google Scholar] [CrossRef]
- Boutahir, M.K.; Farhaoui, Y.; Azrour, M.; Zeroual, I.; El Allaoui, A. Effect of feature selection on the prediction of direct normal irradiance. Big Data Min. Anal. 2022, 5, 309–317. [Google Scholar] [CrossRef]
- Piri, J.; Shamshirband, S.; Petković, D.; Tong, C.W.; ur Rehman, M.H. Prediction of the solar radiation on the Earth using support vector regression technique. Infrared Phys. Technol. 2015, 68, 179–185. [Google Scholar] [CrossRef]
- Voyant, C.; Notton, G.; Kalogirou, S.; Nivet, M.-L.; Paoli, C.; Motte, F.; Fouilloy, A. Machine learning methods for solar radiation forecasting: A review. Renew. Energy 2017, 105, 569–582. [Google Scholar] [CrossRef]
- Rigollier, C.; Lefèvre, M.; Wald, L. The method Heliosat-2 for deriving shortwave solar radiation from satellite images. Sol. Energy 2004, 77, 159–169. [Google Scholar] [CrossRef] [Green Version]
- Huertas-Tato, J.; Aler, R.; Galván, I.M.; Rodríguez-Benítez, F.J.; Arbizu-Barrena, C.; Pozo-Vázquez, D. A short-term solar radiation forecasting system for the Iberian Peninsula. Part 2: Model blending approaches based on machine learning. Sol. Energy 2020, 195, 685–696. [Google Scholar] [CrossRef]
- Shadab, A.; Said, S.; Ahmad, S. Box–Jenkins multiplicative ARIMA modeling for prediction of solar radiation: A case study. Int. J. Energy Water Res. 2019, 3, 305–318. [Google Scholar] [CrossRef]
- Alsharif, M.; Younes, M.; Kim, J. Time Series ARIMA Model for Prediction of Daily and Monthly Average Global Solar Radiation: The Case Study of Seoul, South Korea. Symmetry 2019, 11, 240. [Google Scholar] [CrossRef] [Green Version]
- Hocaoğlu, F.O. Novel analytical hourly solar radiation models for photovoltaic based system sizing algorithms. Energy Convers. Manag. 2010, 51, 2921–2929. [Google Scholar] [CrossRef]
- Ghimire, S.; Deo, R.C.; Downs, N.J.; Raj, N. Global solar radiation prediction by ANN integrated with European Centre for medium range weather forecast fields in solar rich cities of Queensland Australia. J. Clean. Prod. 2019, 216, 288–310. [Google Scholar] [CrossRef]
- Bouzgou, H.; Gueymard, C.A. Minimum redundancy—Maximum relevance with extreme learning machines for global solar radiation forecasting: Toward an optimized dimensionality reduction for solar time series. Sol. Energy 2017, 158, 595–609. [Google Scholar] [CrossRef]
- Meenal, R.; Selvakumar, A.I. Assessment of SVM, empirical and ANN based solar radiation prediction models with most influencing input parameters. Renew. Energy 2018, 121, 324–343. [Google Scholar] [CrossRef]
- Yadav, A.K.; Malik, H.; Chandel, S.S. Application of rapid miner in ANN based prediction of solar radiation for assessment of solar energy resource potential of 76 sites in Northwestern India. Renew. Sustain. Energy Rev. 2015, 52, 1093–1106. [Google Scholar] [CrossRef]
- Zhou, Y.; Liu, Y.; Wang, D.; Liu, X.; Wang, Y. A review on global solar radiation prediction with machine learning models in a comprehensive perspective. Energy Convers. Manag. 2021, 235, 113960. [Google Scholar] [CrossRef]
- Diagne, M.; David, M.; Lauret, P.; Boland, J.; Schmutz, N. Review of solar irradiance forecasting methods and a proposition for small-scale insular grids. Renew. Sustain. Energy Rev. 2013, 27, 65–76. [Google Scholar] [CrossRef] [Green Version]
- Yadav, A.K.; Chandel, S.S. Solar radiation prediction using Artificial Neural Network techniques: A review. Renew. Sustain. Energy Rev. 2014, 33, 772–781. [Google Scholar] [CrossRef]
- Kumar, R.; Aggarwal, R.K.; Sharma, J.D. Comparison of regression and artificial neural network models for estimation of global solar radiations. Renew. Sustain. Energy Rev. 2015, 52, 1294–1299. [Google Scholar] [CrossRef]
- Pang, Z.; Niu, F.; O’Neill, Z. Solar radiation prediction using recurrent neural network and artificial neural network: A case study with comparisons. Renew. Energy 2020, 156, 279–289. [Google Scholar] [CrossRef]
- Chen, J.-L.; Liu, H.-B.; Wu, W.; Xie, D.-T. Estimation of monthly solar radiation from measured temperatures using support vector machines—A case study. Renew. Energy 2011, 36, 413–420. [Google Scholar] [CrossRef]
- Guermoui, M.; Melgani, F.; Gairaa, K.; Mekhalfi, M.L. A comprehensive review of hybrid models for solar radiation forecasting. J. Clean. Prod. 2020, 258, 120357. [Google Scholar] [CrossRef]
- Hedar, A.-R.; Almaraashi, M.; Abdel-Hakim, A.E.; Abdulrahim, M. Hybrid Machine Learning for Solar Radiation Prediction in Reduced Feature Spaces. Energies 2021, 14, 7970. [Google Scholar] [CrossRef]
- Mohanty, S.; Patra, P.K.; Sahoo, S.S. Prediction and application of solar radiation with soft computing over traditional and conventional approach—A comprehensive review. Renew. Sustain. Energy Rev. 2016, 56, 778–796. [Google Scholar] [CrossRef]
- Guermoui, M.; Abdelaziz, R.; Gairaa, K.; Djemoui, L.; Benkaciali, S. New temperature-based predicting model for global solar radiation using support vector regression. Int. J. Ambient. Energy 2022, 43, 1397–1407. [Google Scholar] [CrossRef]
- Geetha, A.; Santhakumar, J.; Sundaram, K.M.; Usha, S.; Thentral, T.T.; Boopathi, C.S.; Ramya, R.; Sathyamurthy, R. Prediction of hourly solar radiation in Tamil Nadu using ANN model with different learning algorithms. Energy Rep. 2022, 8, 664–671. [Google Scholar] [CrossRef]
- Olatomiwa, L.; Mekhilef, S.; Shamshirband, S.; Mohammadi, K.; Petković, D.; Sudheer, C. A support vector machine–firefly algorithm-based model for global solar radiation prediction. Sol. Energy 2015, 115, 632–644. [Google Scholar] [CrossRef]
- Guezzaz, A.; Benkirane, S.; Azrour, M.; Khurram, S. A Reliable Network Intrusion Detection Approach Using Decision Tree with Enhanced Data Quality. Secur. Commun. Netw. 2021, 2021, 1230593. [Google Scholar] [CrossRef]
- Guezzaz, A.; Azrour, M.; Benkirane, S.; Mohy-Eddine, M.; Attou, H.; Douiba, M. A Lightweight Hybrid Intrusion Detection Framework using Machine Learning for Edge-Based IIoT Security. Int. Arab. J. Inf. Technol. 2022, 19, 5. [Google Scholar] [CrossRef]
- Goliatt, L.; Yaseen, Z.M. Development of a hybrid computational intelligent model for daily global solar radiation prediction. Expert Syst. Appl. 2023, 212, 118295. [Google Scholar] [CrossRef]
- Ghimire, S.; Deo, R.C.; Casillas-Pérez, D.; Salcedo-Sanz, S. Boosting solar radiation predictions with global climate models, observational predictors and hybrid deep-machine learning algorithms. Appl. Energy 2022, 316, 119063. [Google Scholar] [CrossRef]
- Etxegarai, G.; López, A.; Aginako, N.; Rodríguez, F. An analysis of different deep learning neural networks for intra-hour solar irradiation forecasting to compute solar photovoltaic generators’ energy production. Energy Sustain. Dev. 2022, 68, 1–17. [Google Scholar] [CrossRef]
- Bamisile, O.; Oluwasanmi, A.; Ejiyi, C.; Yimen, N.; Obiora, S.; Huang, Q. Comparison of machine learning and deep learning algorithms for hourly global/diffuse solar radiation predictions. Int. J. Energy Res. 2022, 46, 10052–10073. [Google Scholar] [CrossRef]
- Üstün, İ.; Üneş, F.; Mert, İ.; Karakuş, C. A comparative study of estimating solar radiation using machine learning approaches: DL, SMGRT, and ANFIS. Energy Sources Part A Recovery Util. Environ. Eff. 2022, 44, 10322–10345. [Google Scholar] [CrossRef]
- Faisal, A.N.M.F.; Rahman, A.; Habib, M.T.M.; Siddique, A.H.; Hasan, M.; Khan, M.M. Neural networks based multivariate time series forecasting of solar radiation using meteorological data of different cities of Bangladesh. Results Eng. 2022, 13, 100365. [Google Scholar] [CrossRef]
- Bounoua, Z.; Chahidi, L.O.; Mechaqrane, A. Estimation of daily global solar radiation using empirical and machine-learning methods: A case study of five Moroccan locations. Sustain. Mater. Technol. 2021, 28, e00261. [Google Scholar] [CrossRef]
- Meenal, R.; Michael, P.A.; Pamela, D.; Rajasekaran, E. Weather prediction using random forest machine learning model. Indones. J. Electr. Eng. Comput. Sci. 2021, 22, 1208. [Google Scholar] [CrossRef]
- Khelifi, R.; Guermoui, M.; Rabehi, A.; Lalmi, D. Multi-step-ahead forecasting of daily solar radiation components in the Saharan climate. Int. J. Ambient. Energy 2020, 41, 707–715. [Google Scholar] [CrossRef]
- Kurniawan, A.; Shintaku, E. Estimation of the Monthly Global, Direct, and Diffuse Solar Radiation in Japan Using Artificial Neural Network. Int. J. Mach. Learn. Comput. 2020, 10, 253–258. [Google Scholar] [CrossRef]
- Fan, J.; Wang, X.; Zhang, F.; Ma, X.; Wu, L. Predicting daily diffuse horizontal solar radiation in various climatic regions of China using support vector machine and tree-based soft computing models with local and extrinsic climatic data. J. Clean. Prod. 2020, 248, 119264. [Google Scholar] [CrossRef]
- Kwon, Y.; Kwasinski, A.; Kwasinski, A. Solar Irradiance Forecast Using Naïve Bayes Classifier Based on Publicly Available Weather Forecasting Variables. Energies 2019, 12, 1529. [Google Scholar] [CrossRef] [Green Version]
- Srivastava, R.; Tiwari, A.N.; Giri, V.K. Solar radiation forecasting using MARS, CART, M5, and random forest model: A case study for India. Heliyon 2019, 5, e02692. [Google Scholar] [CrossRef] [Green Version]
- Basaran, K.; Özçift, A.; Kılınç, D. A New Approach for Prediction of Solar Radiation with Using Ensemble Learning Algorithm. Arab. J. Sci. Eng. 2019, 44, 7159–7171. [Google Scholar] [CrossRef]
- Cornejo-Bueno, L.; Casanova-Mateo, C.; Sanz-Justo, J.; Salcedo-Sanz, S. Machine learning regressors for solar radiation estimation from satellite data. Sol. Energy 2019, 183, 768–775. [Google Scholar] [CrossRef]
- Benali, L.; Notton, G.; Fouilloy, A.; Voyant, C.; Dizene, R. Solar radiation forecasting using artificial neural network and random forest methods: Application to normal beam, horizontal diffuse and global components. Renew. Energy 2019, 132, 871–884. [Google Scholar] [CrossRef]
- Bhola, P.; Bhardwaj, S. Estimation of solar radiation using support vector regression. J. Inf. Optim. Sci. 2019, 40, 339–350. [Google Scholar] [CrossRef]
- Marzouq, M.; Bounoua, Z.; El Fadili, H.; Mechaqrane, A.; Zenkouar, K.; Lakhliai, Z. New daily global solar irradiation estimation model based on automatic selection of input parameters using evolutionary artificial neural networks. J. Clean. Prod. 2019, 209, 1105–1118. [Google Scholar] [CrossRef]
- Guermoui, M.; Gairaa, K.; Rabehi, A.; Djafer, D.; Benkaciali, S. Estimation of the daily global solar radiation based on the Gaussian process regression methodology in the Saharan climate. Eur. Phys. J. Plus 2018, 133, 211. [Google Scholar] [CrossRef]
- Yıldırım, H.B.; Çelik, Ö.; Teke, A.; Barutçu, B. Estimating daily Global solar radiation with graphical user interface in Eastern Mediterranean region of Turkey. Renew. Sustain. Energy Rev. 2018, 82, 1528–1537. [Google Scholar] [CrossRef]
- Fan, J.; Wang, X.; Wu, L.; Zhou, H.; Zhang, F.; Yu, X.; Lu, X.; Xiang, Y. Comparison of Support Vector Machine and Extreme Gradient Boosting for predicting daily global solar radiation using temperature and precipitation in humid subtropical climates: A case study in China. Energy Convers. Manag. 2018, 164, 102–111. [Google Scholar] [CrossRef]
- Quej, V.H.; Almorox, J.; Arnaldo, J.A.; Saito, L. ANFIS, SVM and ANN soft-computing techniques to estimate daily global solar radiation in a warm sub-humid environment. J. Atmos. Sol.-Terr. Phys. 2017, 155, 62–70. [Google Scholar] [CrossRef] [Green Version]
- Marzo, A.; Trigo-Gonzalez, M.; Alonso-Montesinos, J.; Martínez-Durbán, M.; López, G.; Ferrada, P.; Fuentealba, E.; Cortés, M.; Batlles, F.J. Daily global solar radiation estimation in desert areas using daily extreme temperatures and extraterrestrial radiation. Renew. Energy 2017, 113, 303–311. [Google Scholar] [CrossRef]
- Hassan, M.A.; Khalil, A.; Kaseb, S.; Kassem, M.A. Potential of four different machine-learning algorithms in modeling daily global solar radiation. Renew. Energy 2017, 111, 52–62. [Google Scholar] [CrossRef]
- Alsina, E.F.; Bortolini, M.; Gamberi, M.; Regattieri, A. Artificial neural network optimisation for monthly average daily global solar radiation prediction. Energy Convers. Manag. 2016, 120, 320–329. [Google Scholar] [CrossRef]
- Wang, L.; Kisi, O.; Zounemat-Kermani, M.; Salazar, G.A.; Zhu, Z.; Gong, W. Solar radiation prediction using different techniques: Model evaluation and comparison. Renew. Sustain. Energy Rev. 2016, 61, 384–397. [Google Scholar] [CrossRef]
- Mehdizadeh, S.; Behmanesh, J.; Khalili, K. Comparison of artificial intelligence methods and empirical equations to estimate daily solar radiation. J. Atmos. Sol.-Terr. Phys. 2016, 146, 215–227. [Google Scholar] [CrossRef]
- De Felice, M.; Petitta, M.; Ruti, P.M. Short-term predictability of photovoltaic production over Italy. Renew. Energy 2015, 80, 197–204. [Google Scholar] [CrossRef] [Green Version]
- Pedro, H.T.C.; Coimbra, C.F.M. Nearest-neighbor methodology for prediction of intra-hour global horizontal and direct normal irradiances. Renew. Energy 2015, 80, 770–782. [Google Scholar] [CrossRef]
- Lazzaroni, M.; Ferrari, S.; Piuri, V.; Salman, A.; Cristaldi, L.; Faifer, M. Models for solar radiation prediction based on different measurement sites. Measurement 2015, 63, 346–363. [Google Scholar] [CrossRef]
- Demirhan, H. The problem of multicollinearity in horizontal solar radiation estimation models and a new model for Turkey. Energy Convers. Manag. 2014, 84, 334–345. [Google Scholar] [CrossRef]
- Al Shalabi, L.; Shaaban, Z. Normalization as a Preprocessing Engine for Data Mining and the Approach of Preference Matrix. In Proceedings of the 2006 International Conference on Dependability of Computer Systems, Szklarska Poreba, Poland, 25–27 May 2006; pp. 207–214. [Google Scholar] [CrossRef]
- Kuhn, M.; Johnson, K. Applied Predictive Modeling; Springer: New York, NY, USA, 2013. [Google Scholar]
- Hastie, T.; Tibshirani, R.; Friedman, J.H. The Elements of Statistical Learning: Data Mining, Inference, and Prediction, 2nd ed.; Springer Series in Statistics; Springer: New York, NY, USA, 2009. [Google Scholar]
- Sivanandam, S.N.; Deepa, S.N. Hybrid models using support vector regression for stock price prediction. J. Appl. Res. Technol. 2014, 12, 205–214. [Google Scholar]
- Singh, S.; Madan, T.K.; Kumar, J.; Singh, A.K. Stock Market Forecasting using Machine Learning: Today and Tomorrow. In Proceedings of the 2019 2nd International Conference on Intelligent Computing, Instrumentation and Control Technologies (ICICICT), Kannur, India, 5–6 July 2019; pp. 738–745. [Google Scholar] [CrossRef]


| Contribution | Date | Forecasting Model | Geographical Position | Optimal Model | Findings |
|---|---|---|---|---|---|
| [33] | 2022 | The hybrid CXGBRFR framework integrates deep learning CNN, XGB (Extreme Gradient Boosting) + RF, and bird-inspired models like HHD-BN (Harris Hawks Deep Belief Network), DNN (Deep Neural Network), ANN, ELM (Extreme Learning Machine), and MARS (Multivariate Auto-Regressive Spline models) | Australia daily | deep hybrid CXGBRFR | Correlation coefficient (r): deep hybrid CXGBRFR: 0.941–0.962 ANN/ELM: 0.934–0.956/0.954 DBN: 0.495–0.911 DNN: 0.922–0.941 MARS: 0.928–0.935 Legate’s and McCabe’s Index: deep hybrid CXGBRFR: 0.943–0.962, ANN: 0.933–0.958 ELM: 0.931–0.955 DBN: 0.493–0.911 DNN: 0.922–0.941 MARS: 0.928–0.942 |
| [34] | 2022 | Seasonal Auto-Regressive Integrated Moving Average (SARIMA), K-Nearest Neighbors (KNN) Recursive Neural Network-Long Short-Term Memory (RNN-LSTM) | UAE daily | RNN-LSTM and KNN | RNN-LSTM and KNN outperform SARIMA. RNN-LSTM and KNN perform similarly RNN-LSTM slightly outperforms KNN |
| [27] | 2022 | SVM and Corrected- SVM | Ghardaia, Algeria | C-SVM | RMSE = 11.35% rRMSE = 1.713 MJ/m2, MABE = 1.623 MJ/m2 r = 12.61% |
| [28] | 2022 | LM, SCG, and RP | 6 locations from Tamil Nadu, India | LM | LM: R = 0.9376 for training data, 0.9340 For testing data. |
| [35] | 2022 | ANN, CNN, RNN, SVR, PR RF | 4 locations in Nigeria | RNN | Deep learning outperforms RNN: r = 0.9546, RMSE= 82.22 W/m2, MAE = 36.52 W/m2 |
| [36] | 2022 | DL, SMGRT, and ANFIS | Isparta, Turkey | SMGRT | SMGRT is the best MSE = 1.878 R2 = 0.960 MBE = 0.156 RMSE = 1.371 |
| [37] | 2022 | RNN, LSTM, and GRU | 5 cities Bangladesh | GRU | MAPE = 19.28% |
| [1] | 2021 | GPR, RF GBRT, XGBoost {RF, GPR, XGBoost, GBRT} | 12 sites in China | {GBRT, XGBoost, GPR, RF} XGBoost | Daily predictions: Stacking model outperforms Monthly predictions: Comparable performance |
| [5] | 2021 | MLP (XE MLP) SVR MLR LightGBM | Fez, Morocco | LightGBM SVR | LightGBM: Coefficient of determination R2 = 0.9377, RMSE = 0.4827 kWh/m2 MAE = 0.3614 kWh/m2 |
| [38] | 2021 | 22 empirical models RF, MLP, bagged trees, boosted trees | 5 locations in Morocco. | RF | r ranges from 0.8753 to 0.9620, normalized mean absolute error (nMAE) ranges from 5.84 to 11.81%, negative root mean square error (nRMSE) ranges from 7.85 to 15.33%. |
| [39] | 2021 | SVM RF | India | RF | RF: MSE = 0.750 R2 = 0.97 SVM: MSE = 0.867—R2 = 0.9385 |
| [4] | 2021 | K-Nearest Neighbors (k-NN) ANN, DL, SVM | 4 Turkish stations | ANN | MBE = 0.195 MJ/m2 RMSE = 2.157 MJ/m2—rRMSE = 14.10% T statistic = 1.280 MJ/m2—Mape = 15.92% MABE = 1.597—R2 = 0.9320% |
| [22] | 2020 | ANN, RNN | Tuscaloosa, Alabama in the USA | RNN with higher computational costs than ANN. | RNN: better prediction results Cloud cover impacts GSR prediction. RMSE = 7.64%, Normalized Mean Bias Error (NMBE) = 0.2% |
| [40] | 2020 | MLPd and RBF | Ghardaia in Algeria | MLP | MLP demonstrates slightly superior performance. |
| [41] | 2020 | ANN | Sapporo, Tateno, Fukuoka, Ishigakijima, and Minamitorishima in Japan | NA | Monthly diffuse, direct, and GRS forecasts are extremely accurate. All locations have a R2 of 0.988 or higher. |
| [42] | 2020 | M5Tree, CatBoost, and XGBoost SVM, RF | 15 provinces in China | SVM | CatBoost outperforms. |
| [43] | 2019 | Naive Bayes 2 days ahead global horizontal irradiance | Austin, TX in USA | Naive Bayes | Various weather type: MBE = 2.73%, r = 86.33% Clear days: RMBE = 1.49%, r = 99.85%. |
| [44] | 2019 | RF, M5, MARS, CART | India (Gorakhpur side) | RF | RF: highest accuracy, CART: lowest accuracy. |
| [45] | 2019 | SVR, ANN, and DT | 4 provinces in turkey | NA | Boosting improves prediction performance RMSE between 4.6 and 14.6% |
| [46] | 2019 | SVR, GPR, MLP, and Extreme Learning Machines (ELM) | Toledo in Spain | ELM | Satellite measurements improved predictability by increasing input parameters. ELM: RMSE = 60.60 W/m2, r2 = 96% |
| [47] | 2019 | SP, ANN, and R | Odeillo in France | RF | nRMSE: 19.65% (GHI—first hour ahead), 27.78% (GHI—sixth hour ahead), 34.11% (Beam Normal Irradiation—first hour ahead), 49.08% (Beam Normal Irradiation—sixth hour ahead), 35.08% (Diffuse Horizontal Irradiation—first hour ahead) 49.14% (Diffuse Horizontal Irradiation—sixth hour ahead). |
| [48] | 2019 | SVR | Gurugram in India | NA | Performance SVR is influenced by the air temperature (the most significant parameter) RMSE = 14.3 MJ/m2 |
| [49] | 2019 | ANN, k-NN, empirical models | Fez -Morocco | KNN Hybrid model | k-NN: rRMSE = 0.2027 R2 = 0.9663. Hybrid model (k-NN—ANN): rRMSE = 0.1785, R2 = 0.9750. |
| [50] | 2018 | Radial basis function (RBF) MLP GPR | Ghardaïa—Algeria. Daily | GPR | MBE = 0.1861 kWh/m2 nRMSE = 5.2%, r = 0.9842 RMSE = 0.3194 kWh/m2, |
| [51] | 2018 | ANN Regression Analysis | 4 stations in Turkey Monthly | ANN | ANN: R2 = 0.961, RMSE =0.14 |
| [52] | 2018 | SVM XGBoost | China Daily | XGBoost | RMSE = 0.9238 kWh/m2 R2 = 0.7530, XGBoost MAE = 0.6925 kWh/m2—training phase = 3.02 s—testing phase = 0.05 s |
| [2] | 2018 | GPR | Mashha Iran Daily, Monthly | NA | Daily: RMSE = 0.16 MAPE = 1.97%, Model Efficiency (EF) = 0.99 |
| [16] | 2018 | SVM ANN | India Monthly | SVM | SVM > ANN ANN: more accurate with long training time for large dataset. R2(ANN) = 0.9968 R2 (SVM) = 0.9912 |
| [53] | 2017 | ANFIS, SVM, ANN | 6 provinces in Mexico daily | SVM | RMSE = 2.578, R2 = 0.689 MAE = 1.97 |
| [54] | 2017 | ANN | 13 different stations | ANN | rMBE < 4% R2 = 0.64 r = 0.800 rRMSE = 13% |
| [55] | 2017 | MLP ANFIS SVM DT | Egypt Daily | MLP | MLP > ANFIS > SVM > DT |
| [56] | 2016 | ANN | Italy Monthly | ANN | MAPE = 1.67% to 4.25% based on the type and number of inputs |
| [57] | 2016 | Generalized Regression Neural Network (GRNN) Radial Basis Neural Network (RBNN) MLP | 12 Sites (China) Daily | MLP | RBNN > GRNN > MLP R2 = 0.86 MAE = 0.425 kWh/m2 RMSE = 0.5388 kWh/m2 |
| [58] | 2016 | ANN, ANFIS Gene Expression Programming (GEP) | Karmen, Iran Daily | ANN | R2 = 0.935 |
| [7] | 2015 | SVR, Empirical | 2 provinces (Iran) | SVR | RMSE = 0.4515 kWh/m2 R2 = 0.9330 |
| [21] | 2015 | Regression models. ANN | (1 month) | ANN | ANN > Regression models. |
| [59] | 2015 | Linear techniques SVM | Italy 1 Day | SVM | SVM > linear model |
| [60] | 2015 | k-NN | USA 30 min | K-NN | k-NN > persistence Enhancements in the forecast between 10% and 25% |
| [61] | 2015 | ANN—k-NN—SVR Autoregressive models persistence | Italia hourly | SVR | SVR > ANN > AR > k-NN > persistence |
Disclaimer/Publisher’s Note: The statements, opinions and data contained in all publications are solely those of the individual author(s) and contributor(s) and not of MDPI and/or the editor(s). MDPI and/or the editor(s) disclaim responsibility for any injury to people or property resulting from any ideas, methods, instructions or products referred to in the content. |
© 2023 by the authors. Licensee MDPI, Basel, Switzerland. This article is an open access article distributed under the terms and conditions of the Creative Commons Attribution (CC BY) license (https://creativecommons.org/licenses/by/4.0/).
Share and Cite
Hissou, H.; Benkirane, S.; Guezzaz, A.; Azrour, M.; Beni-Hssane, A. A Novel Machine Learning Approach for Solar Radiation Estimation. Sustainability 2023, 15, 10609. https://doi.org/10.3390/su151310609
Hissou H, Benkirane S, Guezzaz A, Azrour M, Beni-Hssane A. A Novel Machine Learning Approach for Solar Radiation Estimation. Sustainability. 2023; 15(13):10609. https://doi.org/10.3390/su151310609
Chicago/Turabian StyleHissou, Hasna, Said Benkirane, Azidine Guezzaz, Mourade Azrour, and Abderrahim Beni-Hssane. 2023. "A Novel Machine Learning Approach for Solar Radiation Estimation" Sustainability 15, no. 13: 10609. https://doi.org/10.3390/su151310609