Article

Quick Electrical Drive Selection Method for Bus Retrofitting

by
Maciej Kozłowski
and
Andrzej Czerepicki
*
Faculty of Transport, Warsaw University of Technology, 00-661 Warszawa, Poland
*
Author to whom correspondence should be addressed.
Sustainability 2023, 15(13), 10484; https://doi.org/10.3390/su151310484
Submission received: 21 May 2023 / Revised: 23 June 2023 / Accepted: 29 June 2023 / Published: 3 July 2023
(This article belongs to the Topic Electric Vehicles Energy Management)

Abstract

:
The article concerns the issue of retrofitting (i.e., the conversion of worn-out diesel buses into electric buses). As this solution is often cheaper than purchasing new electric buses, it can be attractive for low-population areas with a weaker economic infrastructure. The article aims to present an original method for rapidly selecting components for the electric traction system, such as the electric motor, inverter, and transmission systems, combined with a battery installed in a drawer. The battery swapping solution is dedicated to regions with underdeveloped power infrastructure that does not allow for fast charging of bus batteries using pantographs. A mathematical model in the form of a polynomial was developed to estimate the energy losses for a given route. This model consists of a bus physics model, an energy loss model in the propulsion system, and a battery model. The weight coefficients of the polynomials were determined based on an analytical analysis of the model dependencies. The obtained models were reduced using the Lasso regularization method in linear regression. The input data for the model includes route characteristics (or driving cycle) and technical characteristics of the traction system components. The model output provides a detailed profile of electric energy consumption and peak values of the drive system characteristics (e.g., maximum torque of the motor) which must not be exceeded. Implemented as computer software, the model—combined with a database of motors, inverters, drive transmission systems, and batteries—allows for a quick calculation of the possibilities of applying a selected configuration to cover a given route. The approach proposed in the article enables the rapid composition of electric traction devices based on required driving conditions during the initial vehicle prototyping stage. At the same time, it allows the state of the bus battery to be monitored and estimates the remaining range during the operation of upgraded buses.

1. Introduction

The transition of public transport to electric buses is integral to sustainable development worldwide. In Poland, it is also an objective of regional policy and an element of the national transport development strategy [1,2]. Electrification of drive systems in road transportation is currently a widely accepted strategy for vehicle development. Energy recovery in electric vehicles contributes to a significant reduction in energy consumption. This solution minimizes the so-called “road transport carbon footprint” if the energy is RES-based.
The issue of retrofitting worn-out diesel buses is a current research problem. This is mainly due to the negative impact of particulate emissions on human health, which has been repeatedly confirmed by studies [3,4]. As a partial solution to the problem of reducing emissions, various approaches are used—the most common of which is the use of diesel particulate filters (DPFs) [5]. Unfortunately, the effectiveness of such a solution decreases as the bus ages. Furthermore, it does not entirely reduce the harmful environmental impact of diesel engine emissions.
Purchasing a new electric bus involves significant costs, which are still higher than those of a combustion engine bus [6]. However, the significantly lower running and maintenance costs more than compensate for the difference in purchase price over many years. This is due to the lower cost of electricity for an electric bus compared to diesel and the simpler drive system of an electric bus. Of course, the payback period depends on several economic factors, but studies in different countries show similar values in the 7–9 years [6,7]. It should be noted, however, that in the conditions of economically underdeveloped and sparsely populated regions, the payback period for the purchase of new electric buses may be too long for the financial capabilities of local transport companies.
This paper, therefore, focuses on an alternative retrofit solution that reduces the initial investment cost and shortens the payback period. It replaces the internal combustion engine and associated traction components with an electric motor powered by a battery pack. The implementation of the REBOOT (Retrofit all-Electric Bus for reduced Operator Operating costs in urban Transport) research and development project [8] has shown that this approach can reduce the payback period to five years at a total retrofit cost of €166,000 while giving the bus a range of up to 160 km. The operator’s fuel costs were reduced by around 80%. As a result of the EU-elabus4.0 project (reduce–recycle–reuse eMobility–retrofitting-kits for buses) [9], it has been shown that used internal combustion buses often still have a high potential for refurbishment and retrofitting with electric drive systems. Retrofitting, in this case, is not only a sustainable use of resources, but also allows the reuse of the body and other components—which can be worth between €100,000 and €200,000. The project also shows a significant European market for retrofitting buses with electric drive systems.
A preliminary analysis of the solutions proposed in [8,9] has shown that their implementation in Poland requires some adaptation to regional conditions. This is explained in more detail below.
Poland ‘B’ is a colloquial and historically established name of a Polish region with a significantly lower income and economic and social development than the average and typical for Poland. This economic backwardness of the regions is particularly evident in the eastern parts of the country, which were subject to the so-called “Russian partition” in the 19th century. However, focusing only on the conditions for the electrification of road transport, this underdevelopment is manifested in the currently poorer electricity supply infrastructure, poorer road infrastructure, and fewer possibilities for financing the purchase of new electric buses. The above issues are the reason for the original approach to bus electrification presented here. They are, therefore, discussed in more detail.
Poland is one of the European Union countries with the lowest index of paved roads per 100 km2. In addition, the national road system shows large territorial variations in terms of quality, as confirmed by GUS (Central Statistical Office) reports [10,11]. The same reports state that the average daily distance covered by regional buses in Poland is 185 km. At the end of 2021, buses aged 16 to 30 amounted to 39.8% of the total number of buses, while buses older than 30 years amounted to 30.5% of this number [12]. Most older buses are operated in rural areas. These buses are, of course, diesel and in a condition that qualifies them for a major overhaul.
The necessary outlays for infrastructural development in proportion to the revenues of Local Government Units (LGUs) are so high that financing them requires the aid of European Commission programs. A report by the Central Statistical Office (GUS) [13] indicates that the Transport Department accounts for the largest portion of LGU expenses, containing the highest share of projects implemented with European Union funds. This situation also applies to all kinds of transport enterprises, including large-sized (PESA, URSUS, SOLARIS), which most willingly implement transport projects with the financial aid of public funds.
Electricity in Poland originates primarily from coal-fired power plants. Polskie Sieci Energetyczne (PSE) is the operator of the power grid in Poland. Based on a map of existing industrial networks [14], it should be stated that grid density is low. In addition, almost the entire grid is in an overhead form, characterized by worse energy indicators than cable-based solutions. Due to the prolonged lack of investments in switch station systems, electricity supply continuity indices in rural areas are low [15]. Poor electrical grid quality also contributes to the limited possibility of receiving energy from small, domestic energy producers.
The observations above can be summed up as follows: there are currently great problems in rural areas with the supply of energy (power) of adequate quality for the fast charging of electrified buses, and the bus fleet operated within rural areas primarily contains diesel buses that require a major overhaul. Owing to the favorable operating properties of electric buses, they should also be employed in rural areas. Due to limited local government budgets, the offered means of transport should be as cheap as possible. Therefore, the idea that comes into mind is for old, worn-out buses to be converted into electric versions. These buses have good running gears that enable a battery of significant weight to be installed. Such solutions are currently brought to life [5,16,17,18].
Because, as mentioned, Poland ‘B’ currently experiences a big issue with the supply of energy of appropriate quality for charging buses, the system charging solutions employing pantographs operated as part of the discussed solutions cannot be applied. A good solution that distinguishes the proposal of this article’s authors from the ones discussed above will be the installation of batteries in the form of replaceable drawer-packs. Many companies manufacture such packs (e.g., [19,20]). The advantage of the proposed solution is that battery packs will be charged in depots with low current and then replaced during daytime operation. Considering the frequency limits of so-called “fast charging”, the suggested solution will also contribute to increased battery service life. Manufactured buses will be most often used for transporting employees to large-sized companies located in areas of lower-quality infrastructure.
The retrofitting concept presented by the authors of the article is based on the following assumptions:
(1)
suburban and regional transport operators do not have sufficient funds to purchase new electric buses;
(2)
the retrofit process uses commercially available electric motors and transmissions whose technical characteristics are provided by the manufacturers and used for modelling purposes;
(3)
the motor is selected based on an analysis of the route to be covered by the bus;
(4)
the battery pack is placed in a drawer so that it can be quickly replaced at bus stops, which solves the problem of providing electrical connections in remote areas so that the battery pack can be quickly recharged on the bus when stationary;
(5)
mathematical models of the bus, the traction system, and the battery allow simulation calculations to be performed to check whether the bus—after modification—will meet the operator’s requirements, what its maximum range will be, and how quickly the battery will age;
(6)
a component database allows rapid prototyping of the vehicle and storage of the configuration of already retrofitted buses to track their further operation and facilitate the repeatability of subsequent conversions.
The article aims to present an original method for rapidly selecting components for the traction and power supply system of an electric bus obtained through the retrofitting process based on a diesel bus.
Calculations of energy consumption in a converted bus apply the multi-criteria optimization method, where the objective function is minimizing energy consumption per 100 km and extending battery service life. Input values are the broadly understood motion conditions (traction requirements) and available types of bodies for buses to be converted and offered in the drive component market. The database of drive devices contains a description of the technical parameters and characteristics of motors, inverters, and systems for transmitting torque onto the vehicle’s wheels to be used. Device manufacturers provide the data. Calculation results provide a selected drive system, estimated energy consumption, and battery service life.
The paper proposes models that enable efficiency maps and characteristics of electro-traction devices to be obtained. The authors determined values that allow describing these characteristics with polynomial function dependencies. Polynomial weighting factors were determined based on the analysis of the analytical model dependence. The models obtained were reduced using a linear regression method with Lasso regularization. The application of the regression method assumed that explained variables were values applied in analytical models, and explanatory variables were device database characteristics. The result of the calculations are weights (predictors) of polynomial expansion coefficients. This led to obtaining simple mathematical models reduced to a numerical series of obtained weights. The authors then demonstrated how the models developed could be used to choose the electric motor and other traction system components.

2. Materials and Methods

The quick selection method presented by the authors requires the creation of three mathematical models: a model of bus motion conditions, a model of propulsion system components, and an electric battery model. The application of the method, therefore, requires the determination of the necessary parameters that define these models. The key parameters that characterize the forces of motion resistance and driving methods include bus mass parameters, tire traction, and scheduled timetables. These parameters were obtained from the description of the technical data of the vehicles to be converted and the speed profiles required on specified road sections. In addition, parameters characterizing the drive system (inverter–engine–rear axle) were introduced, based on which power loss and equipment efficiency maps were calculated.
These maps were expressed by functional approximations using weighting coefficients relative to nominal values. The weighting coefficients were calculated from the energy loss model analysis and adjusted using the regression method (this procedure is described further in the article). By treating these weighting coefficients as constant values, the maps are expressed relative to the nominal values of the continuous machine power. The last set of data describes a battery pack characterized by its capacity and the parameters of the matching function, which make it possible to analyze the loss of capacity (SOC) and aging (SOH).
The algorithm for calculating the bus range works as follows (Figure 1). Firstly, based on the characteristics of the specified routes (distribution of speed profiles and route profiles), the required traction force profiles and their corresponding power demands are determined. Then, it is checked whether the propulsion system composed of the inverter, motor, and rear axle can meet these requirements—assuming the criterion that long-term and short-term load operating points are within the permissible regions of the drive characteristics. Suppose the operating conditions of the propulsion system are met. In that case, the power demand profiles, which represent the electric power the battery should supply, are obtained using power loss functions. Subsequently, it is verified whether the power profiles do not exceed the specified maximum allowable values for the battery pack. Based on the model, the change in the state of charge (SOC) and capacity loss over the implemented cycle can be determined if the battery operating conditions can be adequately fulfilled under these circumstances. By repeating cycles until discharge, the bus range is estimated. By repeating cycle execution until the permissible capacity loss, an approximate battery lifespan is prognosed.
Simulation methods for determining the drive parameters required to achieve the required motion conditions have been known for some time [21,22,23,24]. It distinguishes two groups of models that determine motion conditions and drive element characteristics. The group of motion condition models includes the so-called “authoritative motion conditions” (which determine formal requirements for the travel process), traffic timetables, and individually defined theoretical travel conditions adapted to customer needs. The group of drive element models includes a motor with an inverter, an accumulator battery, and a system for transmitting torque onto vehicle wheels (an axle with a reduction gear and road wheels). Due to the rapid technological development in drive device construction [25], the calculation models must be updated. These models are discussed below.
Due to the high-efficiency values, a brushless motor is considered a bus drive unit. Currently, due to the battery power supply, motor efficiency is a very important quality indicator, whereas modeling utilizes efficiency maps [26,27,28]. Electric motors achieve the greatest efficiency near a rated operating point. However, under actual driving conditions, drives are used over a wider range of operating points, and maintaining a system at the optimum efficiency point is impossible. Therefore, in addition to motor parameters, system efficiency is also determined by the control system [29,30].
In a generic case, total losses emitted in a brushless motor for a given current ( I ) and a specific angular velocity ( w ) can be determined with the following dependence [21,31]:
P t = P C u N I I N 2 + P F e N + P m ω N 2 ω ω N 3 + P m ω N ω ω N + P m t
where symbols with an N mean respective rated values of P C u N —winding losses, P F e N —core losses, P m ω N 2 —mechanical losses proportional to ω 2 , P m ω N —mechanical losses proportional to ω , P m t —mechanical losses caused by dry friction, I N and ω N current and angular velocity rated values.
After introducing weighing factors that determine the shares of individual loss types in rated losses P t N
a m = P C u N P t N b m = P F e N + P m ω N 2 P t N c m = P m ω N P t N d m = P m t P t N
the dependence defining the losses takes the form
P t = a m I I N 2 + b m ω ω N 3 + c m ω ω N + d m P t N
where a m , b m , c m , d m share weights for relevant losses in total losses.
Whereas power losses in semi-conductor systems, composed of IGBT transistors and diodes, can be divided into conduction losses and switching losses [30]:
P i n v = P c o n _ I G B T + P c o n _ D + P s w + P r e c
where P i n v —converter losses, P c o n _ I G B T —conduction losses in IGBT transistors, P c o n _ D —diode conduction losses, P s w —IGBT switching losses, P r e c —suppression diode recovery losses. Precise determination of the losses in the above components requires in-depth knowledge of the valve control process. In engineering practice, inverter power component losses are described in a simplified manner, most usually with [32,33] formulas:
P c o n = a f I I N 2 P t N P r e c = b f I I N + c f p w p w N P t N
where P c o n —total diode and IGBT conduction losses (proportionally to the output current square), P r e c —total diode recovery and switching losses (total losses proportional to current intensity and PWM carrier frequency product, with a constant value and losses proportional to the pulse width factor), P t N —losses at the rated (reference) operating point, a f , b f , c f —weighting factors. Given that the pulse filling factor controls the rotational speed and the current is proportional to the torque, i.e.,
p w p w N = ω ω N I I N = T T N
The formula determines total power losses generated in the machine and the converter:
P s = P t + P i n v = w T 2 T T N 2 + w T T T N + w o m 3 ω ω N 3 + w o m ω ω N + w 0 P t N
whereas the weighting factors have been obtained as follows: w 0 = d m , w o m = c m + c f , w o m 3 = b m , w T = b f , w T 2 = a m + a f , P s —total losses. Standardized loss coefficients for the presented fit model have been determined in [34].
This expression and the dependencies defining the machine’s efficiency for motor- and generator-based operation enable determining loss and efficiency maps within an area limited by a maximum traction specification.
Because the only considered drive systems have a central machine intended for 12 m long buses, the group of machine-inverter systems that may provide correct operating conditions is clearly defined. Based on the analysis of four systems, the authors approximated the coefficients of the P s polynomial by applying a regression method with regularization [35].
Using the regularization method, the authors found that the lowest fit error is obtained when the polynomial fit is of the fourth order:
P s = m = 1 d e g = 4 n = 0 m k j ω m n t n P t N = ( k 0 + k 1 ω + k 2 t + k 3 ω 2 + k 4 ω t + k 4 t 2 + k 6 ω 3 + k 7 ω 2 t + k 8 ω t 2 + k 9 t 3 + k 10 ω 4 + k 11 ω 3 t + k 12 ω 2 t 2 + k 13 ω t 3 + k 14 t 4 ) P t N
where t = T T N , ω = ω ω N , k 1 , , k 14 —polynomial fit weight.
Electric cars currently use mainly electro-chemical batteries of the following types: Lithium-Ion (Li-Ion), Lithium-Nickel-Cobalt-Manganese (NMC), Lithium-Nickel-Cobalt-Aluminium (NCA), Lithium-Ferrum-Phosphate (LFP), Lithium-Manganese (LMO).
The objective of the calculations was to primarily determine such fundamental values as [36]: state of charge ( S o C ), state of health ( S o H ), capacity loss ( Q l o s s ), state of life, available power, available energy, total energy throughput (ET), and range.
Developing a single, universal battery pack model to calculate these values is downright impossible because cell characteristics differ. In addition, a dedicated BMS management system that significantly shapes pack performance characteristics is used for individual cell types. NMC batteries are recommended for drives of heavy-duty vehicles, including buses. The paper’s authors determined a consumption map for an energy pack with cells of such type. Pack characteristics were analyzed using the AMESIM environment and built-in library software with an implemented BMS model [37].
The application of an iterative model for the statistical description of the operating state leads to the following system of equations:
S o C n = S o C n 1 + S o C n 1 Q l o s s n = Q l o s s n 1 + Q l o s s n 1   E T n = i = 1 n P b n t   S o H n = 1 Q l o s s n
where S o C —state of charge, Q l o s s —capacity loss, E T —energy throughput, S o H —state of health, P b —electric power expended from the battery, Δ t —sampling period (1 s).
In a generic case, the Δ S o C and Q l o s s increments are functions that depend on numerous parameters, including the S o C , S o H , consumed power, and temperature.
The application of linear regression formalism for these parameters with Lasso regularization leads to the following equations:
S o C n 1 = w 0 + w 1 p + w 2 s + w 3 p s + w 4 p 2 Q l o s s n 1 = c 0 + c 1 p 0.5 + c 2 s 0.5 + c 3 p + c 4 s
whereas p = P b n P C H , s = S o C 100 , w 0 , , w 4 and c 0 , , c 4 —weighting coefficients of the linear regression method.
Calculations of traffic conditions use a simple bus model, which is used repeatedly to dimension the drive system [21,36,38], where a rigid body has replaced the vehicle:
d d t v = F W m k w d d t s = v
where v and s —velocity and distance (state variables), F and W —functional expression describing the traction force and motion resistance force, m and k w —mass and rotating mass factor.
The calculations employ standard drive cycles [39,40,41].
Figure 2 shows cycle rate waveforms:
  • ECECOL–UN/ECE Elementary Urban Cycle (Part One of the Type 1 Test);
  • EUDCCOL–UN/ECE Reg 83 Extra-Urban Driving Cycle for Low-Powered Vehicles (Part 2 of the Type 1 Test);
  • EUDCLCOL–HDUDDS Urban Dynamometer Driving Schedule for Heavy Duty Vehicles.
Figure 3 shows cycle rate waveforms:
  • NYCCCOL–New York City Cycle;
  • UDDSCOL–US06 Supplemental FTP Driving Schedule;
  • US06COL–aggressive urban test.

3. Results

3.1. Mathematical Model of Electric Motor

Formula (8) describes the power loss map function P s of the machine-inverter system using polynomial fitting. The form of function (8) was chosen based on theoretical analysis of the machine and inverter losses. The parameters from k 1 to k 14 are essentially weights of approximation coefficients expressed relative to the rated loss value P t n . The weight coefficients were determined using the linear regression method based on the power loss maps of motor-inverter system devices. Table 1 shows obtained weights for a system with a continuous hourly power P n = 365   k W and total losses P t N = 26   k W .
Figure 4 shows the fit result for a motor with a continuous power P n = 365 k W and continuous operating speed n n = 2330   r p m . The left chart shows an efficiency map graph for motor- and generator-based operation, and the right chart shows a power map for inverter supply.

3.2. Battery Pack Model

Formula (9) describes an iterative model of the battery operating state for constant ambient temperature τ = 10   and sampling period Δ t = 1   s . The authors assumed the following pack parameters: energy content (battery capacity Q n = 40   k W h ), continuous use (charging/discharging P C H = 56   k W , P D C H = 60   k W ) , and maximum performance (CH/DCH P m C H = 120   k W , P m D C H = 110   k W ). The studied model adapted a serial configuration of two packs with two parallel connections.
The weight values calculated based on Formulas (9) and (10) are presented in Table 2 and Table 3, respectively.
The dependence map graph for increment Δ S o C is shown in Figure 5. The graph for capacity loss increment Q l o s s is shown in Figure 6.

3.3. Bus Model

The values of parameters describing the mass and motion resistance force were adopted for a 12 m long bus with 4–6 accumulator battery packs on board, assuming that the required maximum speed is 110 km/h.
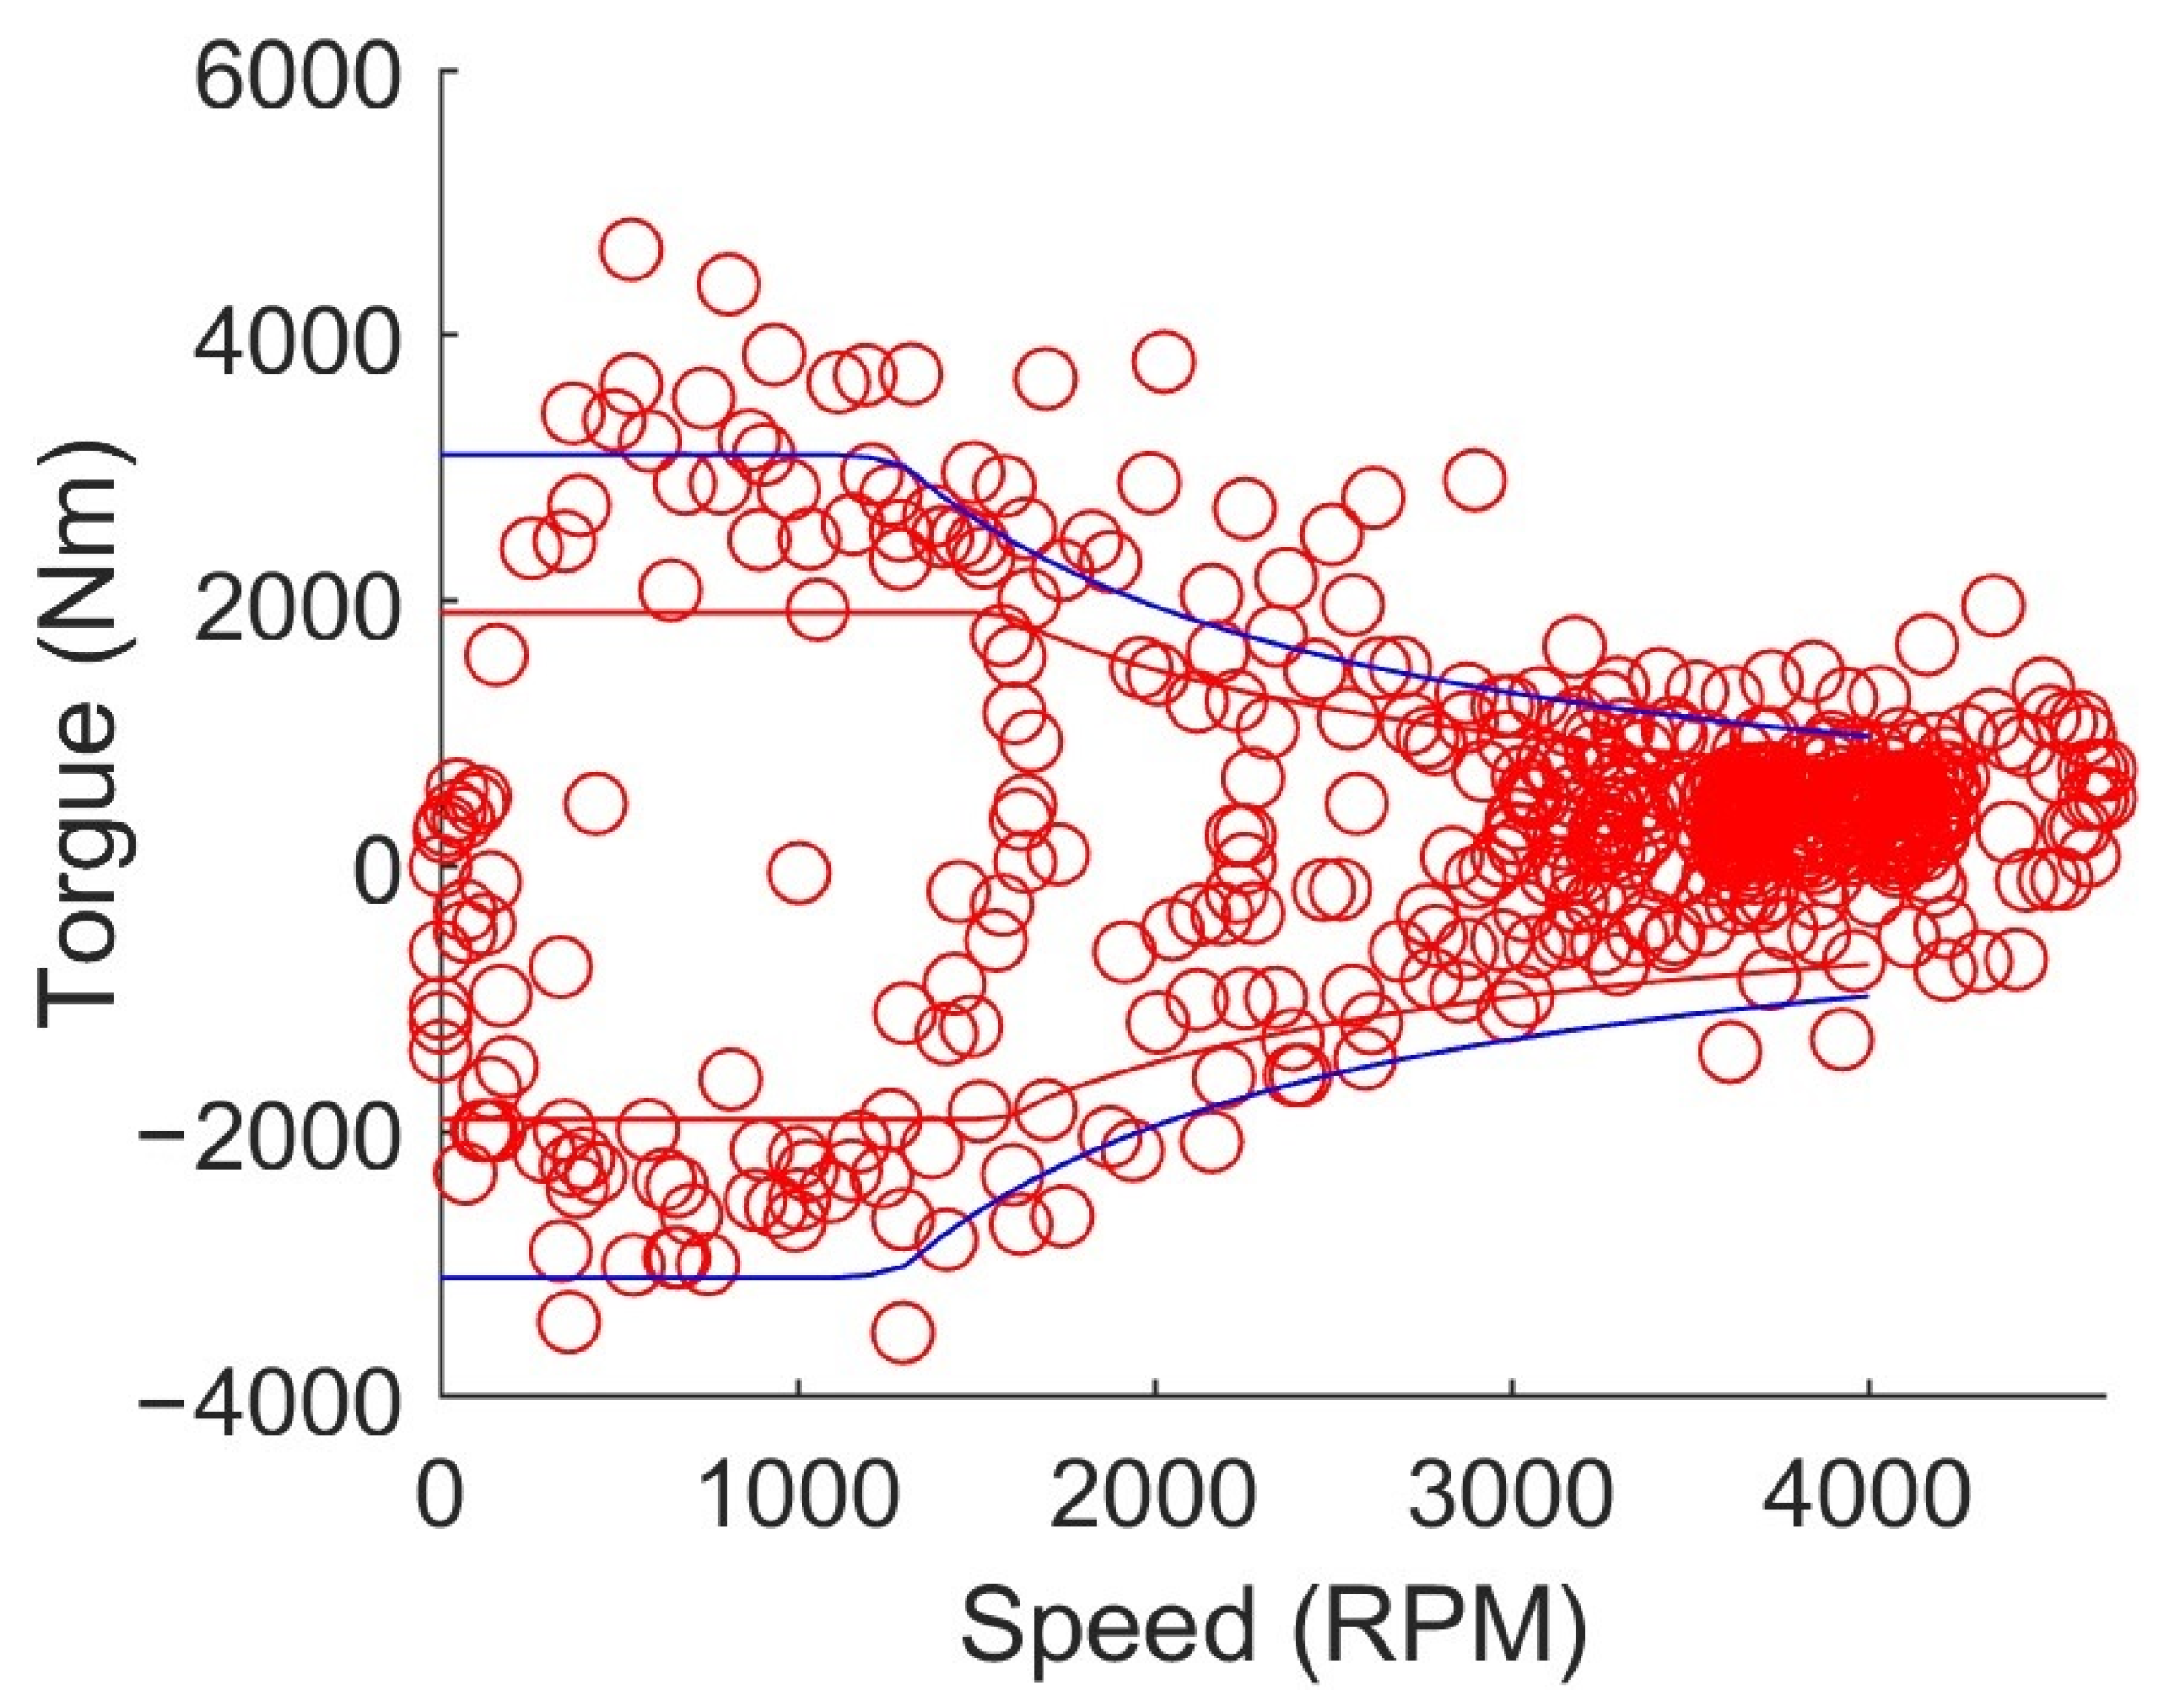
  • Based on a defined drive cycle and a system of bus motion equations, the authors determined the required central unit torque waveforms (in addition, taking into account the values of bus road wheel diameters, kinematic ratios and rear drive axle power losses). The calculation results for standard drive cycles are shown in Figure 7.
Figure 7. Required torque waveforms for the NYCCCOL, UDDSCOL, US06COL cycles.
Sustainability 15 10484 g007
  • The authors determined the maximum effective values for 30 s based on the above loads and plotted them onto traction characteristic graphs for the drive unit. The calculation results are shown in Figure 8, Figure 9 and Figure 10.
Figure 8. Required 30 s operational points in the motor torque-speed plane (NYCCCOL cycle). Red line means continuous power, blue line—peak power.
Sustainability 15 10484 g008
Figure 9. Required 30 s operational points in the motor torque-speed plane (UDDSCOL cycle). Red line means continuous power, blue line—peak power.
Sustainability 15 10484 g009
Figure 10. Required 30 s operational points in the motor torque-speed plane (US06COL cycle). Red line means continuous power, blue line—peak power.
Sustainability 15 10484 g010
  • Based on the calculation results, the authors concluded that the proposed drive system, which consists of a motor and a rear axle, can correctly operate under the UDDSCOL implementation conditions. Next, the authors determined the required traction battery load. The obtained waveform is shown in Figure 11—graph in blue (UDDSCOL cycle).
Because no operating point exceeds the permissible peak power of the adopted set of four battery packs, by applying the presented functional model for calculating S o C , we can determine S o C waveforms. Figure 11 shows two S o C waveform graphs (in red). The solid line represents the graph for an initial state of health S o H = 100 % , and a dashed line is for S o H = 95 % . With the assumed S o H = 95 % , full discharge occurs after seven full drive cycles. The covered distance is then S = 84   k m , which for an energy increase E = 100   k W h determines the average energy consumption at a level of 118   k W h / 100   k m .
Figure 11. Required battery pack power waveforms and determined SoC waveform for two SoH parameters.
Sustainability 15 10484 g011
This cycle’s total energy throughput (ET, i.e., battery charging and discharging) is 139 kWh. Because 33 × 4 = 132 kW, the obtained result means, in practice, the use of one permissible battery life cycle during the trip in question. Assuming that a bus should cover a distance of 100 km per day, the assumed 3000 life cycles will cover a five-year operation period (Table 4).
To extend the service life of battery packs in a bus, it would be worthwhile to consider increasing the number of battery packs to six.

4. Discussion

So far, the issue of determining the operating conditions for electro-traction devices for electric cars has been solved based on either relatively simple calculation models or using very complex simulation models. Based on various simulation calculations in the Matlab environment version R2022a conducted for 12 m long buses, the authors of this article developed polynomial approximations for brushless motor-inverter assembly energy consumption maps and the S o C decrease and Q l o s s capacity loss maps for accumulator batteries. Polynomial coefficients were determined with the regression method, with an achieved accuracy of 2–5% relative to the simulation results. Moreover, because these coefficients were converted to dimensionless units (relative to the equipment-rated power), the obtained approximations may be applied to determine the operating conditions for a wider class of electro-traction devices intended for bus drives.
Owing to calculation simplicity, the developed method does not require specialized simulation software and may be implemented in Python programming language, for example. It can also be applied at the preliminary calculation stage, where basic technical parameters for the motor, inverter, and battery pack are determined based on agreed motion conditions (described by a diverse set of bus motion cycles). We can obtain preliminary information on vehicle service life under its required operating conditions by estimating the degree of battery capacity loss and energy throughput. The application of the presented method does not preclude further detailed simulation analyses.
The developed method enables the creation of a preliminary list of drive devices (out of several available ones) to ensure their correct functioning throughout drive cycles. The method stands out owing to the following features:
  • it has been developed using simulation analyses of drive systems intended for a 12 m long bus;
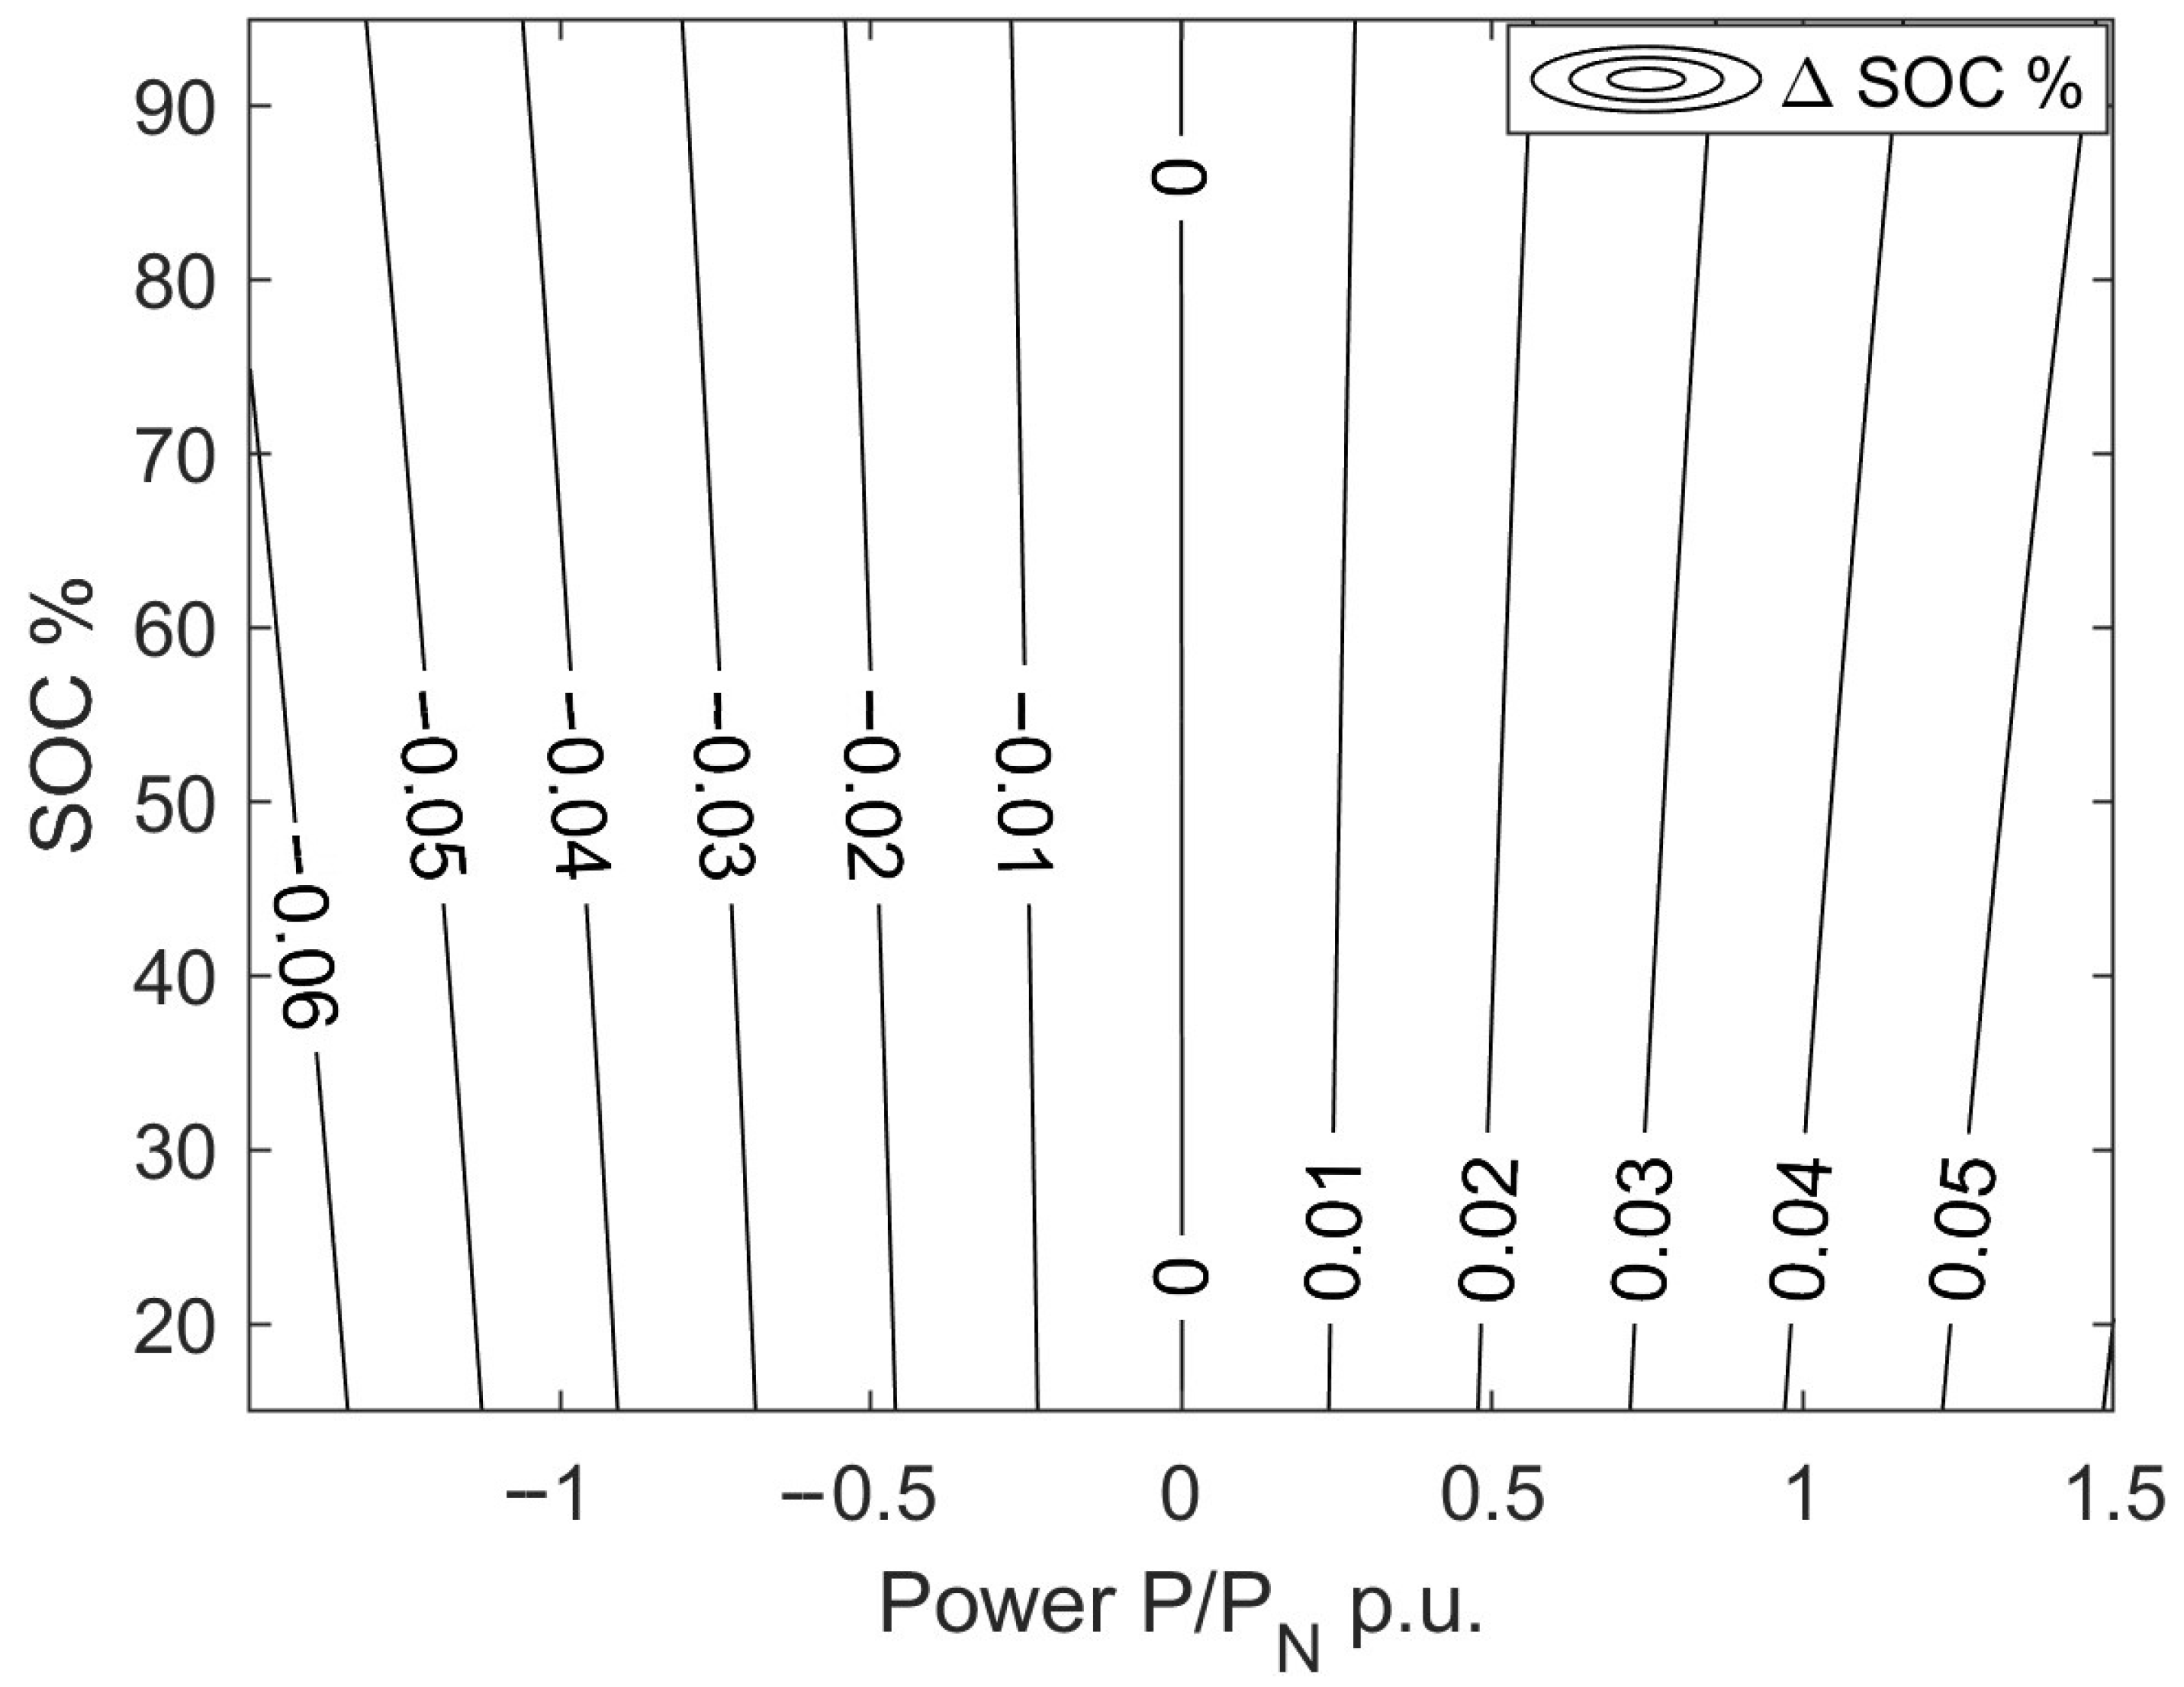
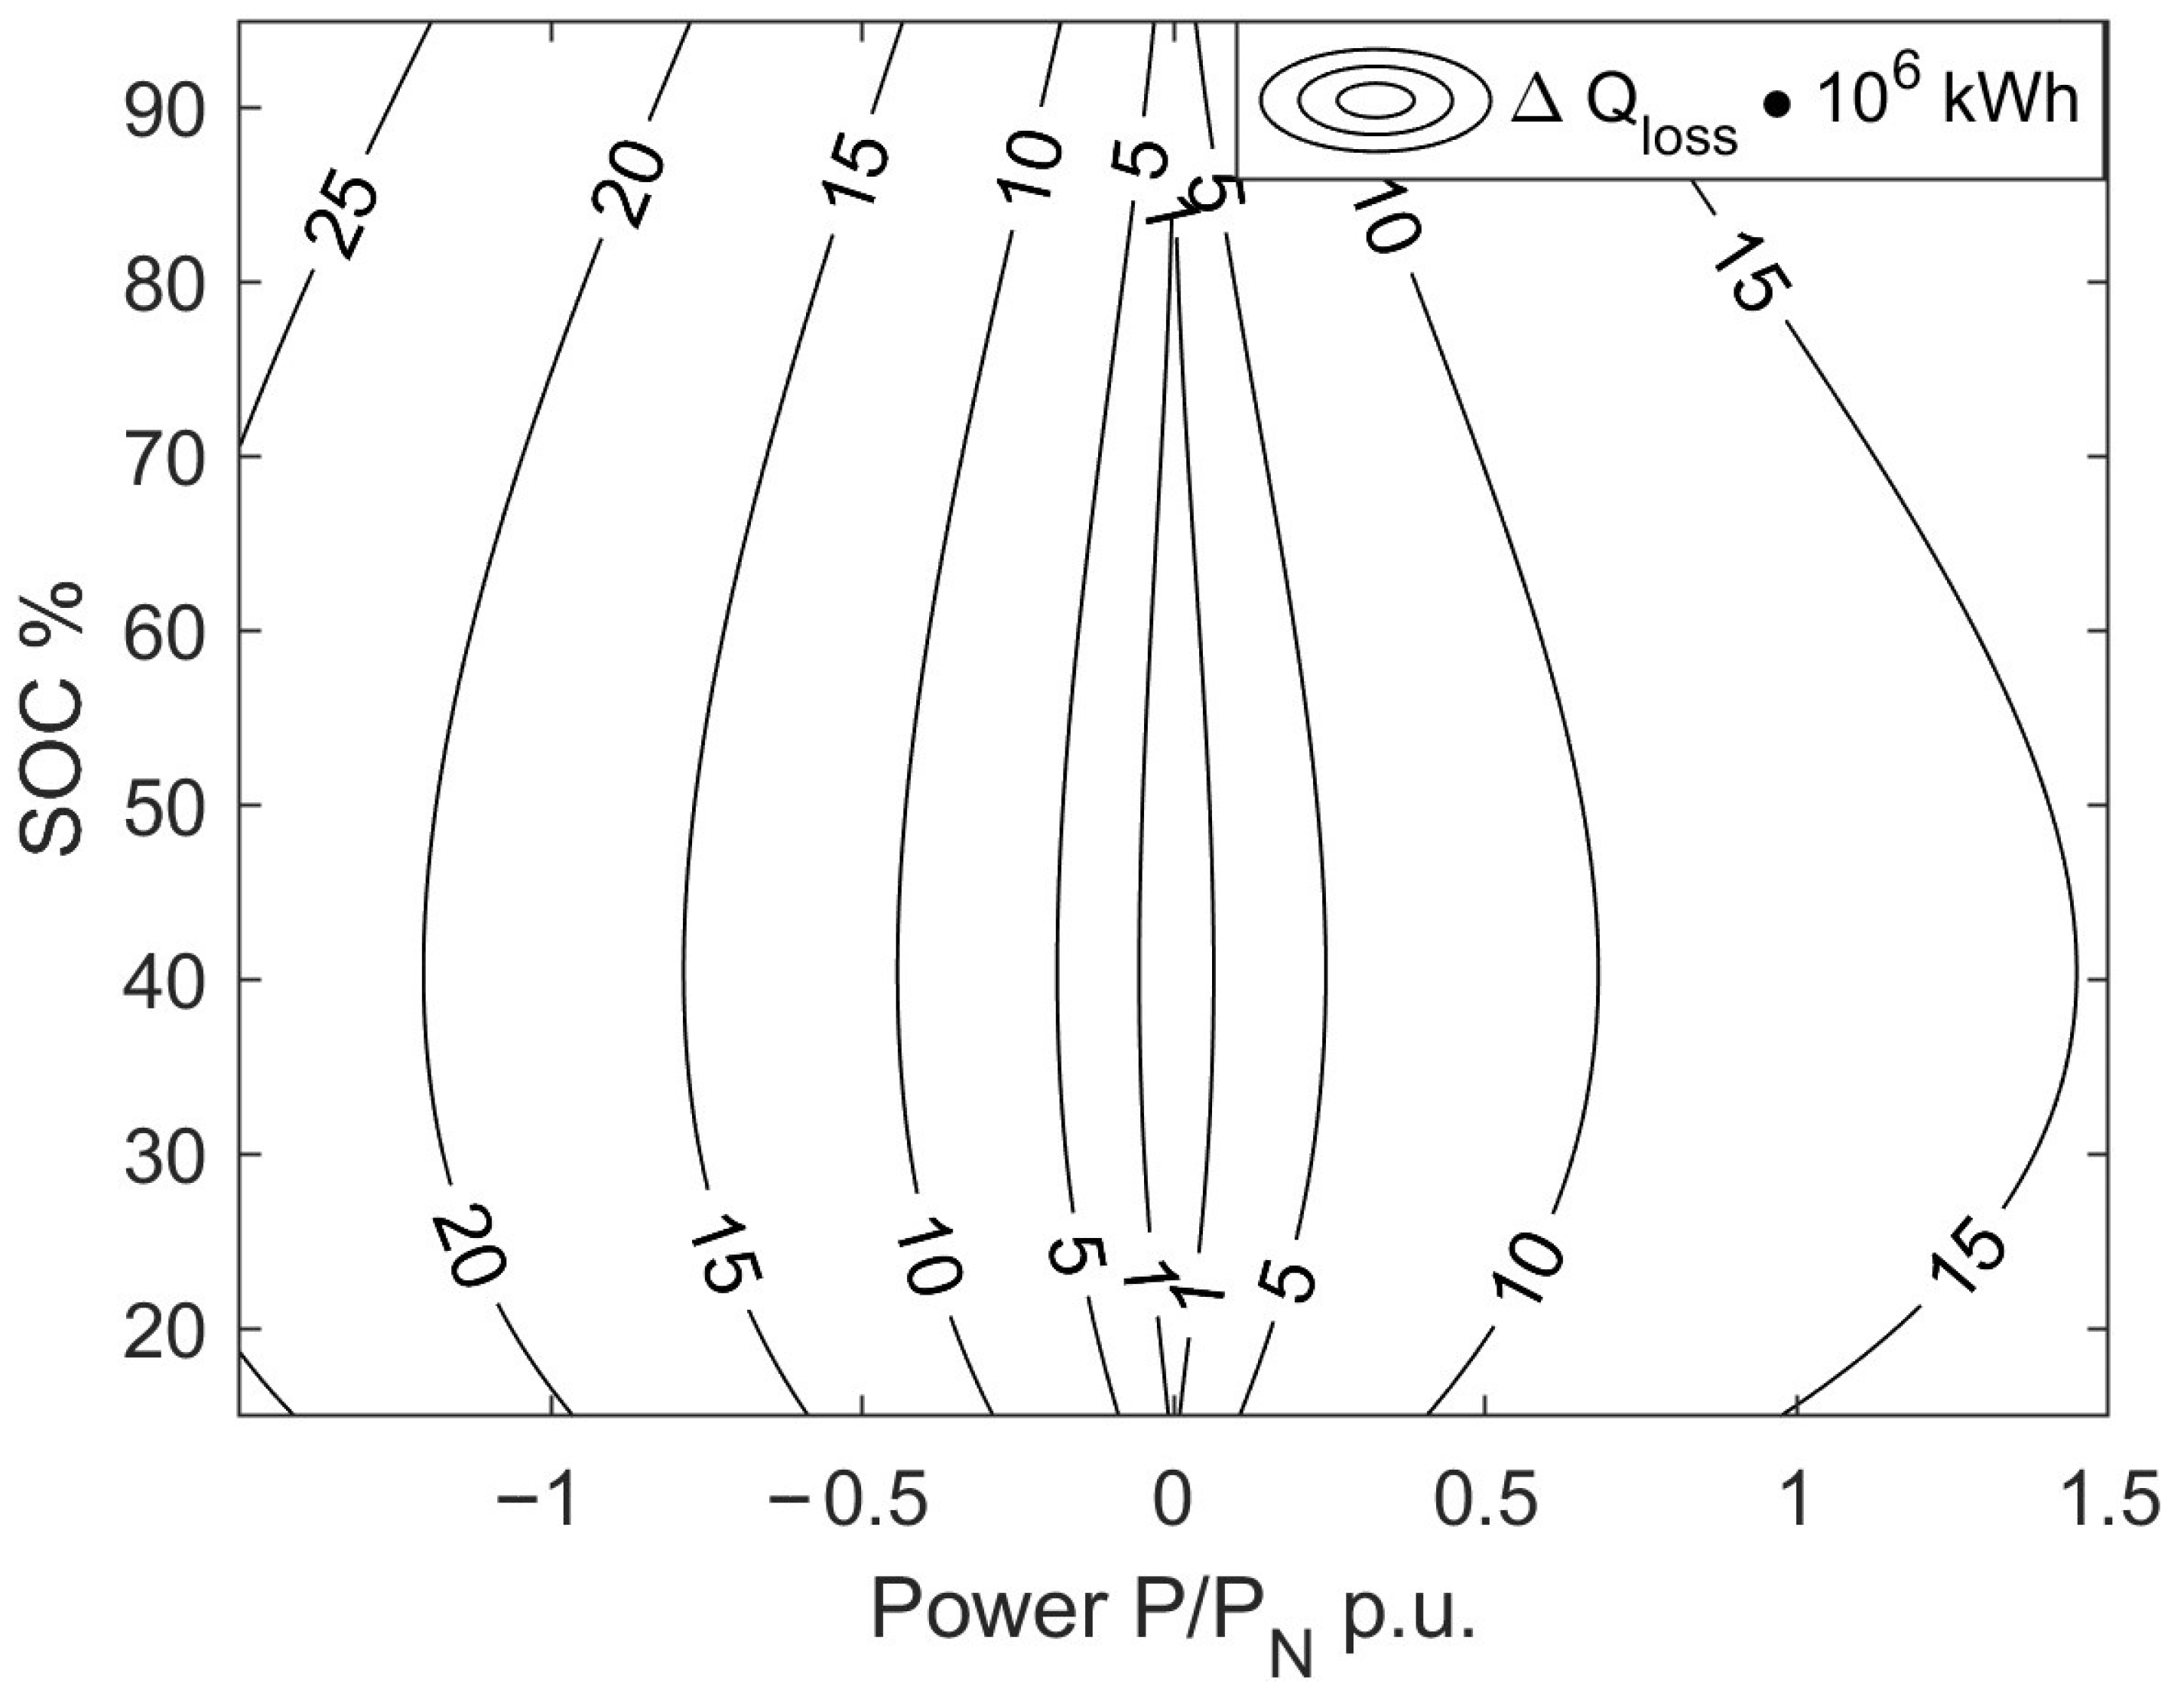
  • it describes stationary operating conditions using energy demand (machine and inverter), state of charge ( S o C ), state of health ( S o H ), capacity loss ( Q l o s s ), and energy throughput maps;
  • it employs maps of operating conditions described with polynomial approximations obtained through the regression method for simulation analyses results;
  • it can be used for fast setup of electro-traction drive devices based on the required motion conditions (drive cycles) at the vehicle prototyping stage.
According to the authors, the method proposed in the article allows for an efficient selection of components used in the retrofit process, which ultimately leads to a bus that meets the operator’s requirements while minimizing the retrofit cost. Table 5 shows the potential benefits and issues to consider when planning retrofitting buses.
The presented method for determining the operational properties of buses uses power loss maps of electro-traction devices. The maps are expressed through functional approximations, where fitting coefficients are used relative to nominal values. The weighting coefficients are determined based on an analysis model that considers both theoretical descriptions and the fitting of coefficients using regression methods. This approach was already known for electric machine-inverter systems, but according to the authors, it represents a novelty in battery packs.
The method distinguishes between parameters and independent variables. Parameters are constant values determined by the weighting coefficients of the fitting functions. Independent variables are the nominal powers concerning which these coefficients are expressed. Although the article does not explicitly discuss an optimization method, the final form of the algorithm may resemble typical optimization computations. In this case, constraints, control variables, and quality criteria are identified, with control variables referring to the nominal powers of the devices and the quality criterion relating to range and operational period. Table 6 presents the advantages and disadvantages of the proposed method.
The method is approximate. It does not consider the various unpredictable dynamics phenomena of the drive and battery management systems (BMS) that may occur during real-world operation. The charging process of batteries in depots is also omitted, while it is known that short charging (fast charging) can reduce battery lifespan. Therefore, the proposed approach cannot replace detailed simulation studies that could be conducted using models developed in professional engineering software environments.

5. Conclusions

The accuracy of our method was verified by comparing the results of our calculations with those of accurate simulation models. In this way, we obtained confirmation of accuracy at a level of 3 to 5%. This approach could be considered as a formal verification of the correctness of our model. The obtained results need to be compared with reality.
We are currently working on implementing the microcomputer method for onboard vehicle application. The device that will be built will allow us to collect real data from the CAN bus network of the bus and compare it with our forecast.
Next year, we plan to validate our method using the currently prepared pre-prototype of the bus (after conversion). We plan to measure energy consumption and battery state of charge (SoC) drop on a test track (airport tarmac). If the validation results confirm the effectiveness of our calculations, we intend to develop a more universal method for analyzing SoC and range for other types of vehicles, such as 18-meter buses or trucks.
If the validated models prove to be correct, a possible direction for future work could also be the execution of optimization calculations based on them, determining optimal movement strategies (velocity distribution profiles and road profiles) with a quality indicator, such as energy consumption or driving range. It can be observed that, currently, this topic is not addressed using complex simulation models due to high computational requirements. Simplified models would be better suited for such problems.

Author Contributions

Conceptualization, A.C. and M.K.; methodology, M.K.; software, A.C.; formal analysis, M.K.; resources, A.C.; data curation, A.C.; writing—original draft preparation, M.K.; writing—review and editing, A.C.; visualization, M.K.; project administration, A.C.; funding acquisition, A.C. All authors have read and agreed to the published version of the manuscript.

Funding

This research was funded by Scientific Council of the Discipline of Civil Engineering and Transport of Warsaw University of Technology, grant number 1/2022.

Institutional Review Board Statement

Not applicable.

Informed Consent Statement

Not applicable.

Data Availability Statement

No new data were created or analyzed in this study. Data sharing is not applicable to this article.

Conflicts of Interest

The authors declare no conflict of interest.

References

  1. Wach-Kloskowska, M.; Rzeźny-Cieplińska, J. Smart and Sustainable Transport Development as an Element of the Implementation of the Smart City Concept—Polish and European Examples. Urban Stud. 2018, 30, 99–108. [Google Scholar]
  2. Ogryzek, M.; Wolny-Kucińska, A. Sustainable Development of Transport as a Regional Policy Target for Sustainable Development—A Case Study of Poland. ISPRS Int. J. Geo-Inf. 2021, 10, 132. [Google Scholar] [CrossRef]
  3. Giechaskiel, B.; Maricq, M.; Ntziachristos, L.; Dardiotis, C.; Wang, X.; Axmann, H.; Bergmann, A.; Schindler, W. Review of Motor Vehicle Particulate Emissions Sampling and Measurement: From Smoke and Filter Mass to Particle Number. J. Aerosol Sci. 2014, 67, 48–86. [Google Scholar] [CrossRef]
  4. Liu, Z.; Shah, A.N.; Ge, Y.; Ding, Y.; Tan, J.; Jiang, L.; Yu, L.; Zhao, W.; Wang, C.; Zeng, T. Effects of Continuously Regenerating Diesel Particulate Filters on Regulated Emissions and Number-Size Distribution of Particles Emitted from a Diesel Engine. J. Environ. Sci. 2011, 23, 798–807. [Google Scholar] [CrossRef] [PubMed]
  5. Fleischman, R.; Amiel, R.; Czerwinski, J.; Mayer, A.; Tartakovsky, L. Buses Retrofitting with Diesel Particle Filters: Real-World Fuel Economy and Roadworthiness Test Considerations. J. Environ. Sci. 2018, 67, 273–286. [Google Scholar] [CrossRef] [PubMed]
  6. Judah, A. Electric Bus Analysis for New York City Transit; Columbia University: New York, NY, USA, 2016. [Google Scholar]
  7. Topal, O.; Nakir, İ. Total Cost of Ownership Based Economic Analysis of Diesel, CNG and Electric Bus Concepts for the Public Transport in Istanbul City. Energies 2018, 11, 2369. [Google Scholar] [CrossRef] [Green Version]
  8. Retrofit All-Electric Bus for Reduced Operator Operating Costs in Urban Transport (REBOOT). 2018. Available online: https://cordis.europa.eu/project/id/651630 (accessed on 3 June 2023).
  9. EU-Elabus4.0 (Reduce–Recycle–Reuse EMobility–Retrofitting-Kits for Busses); 2015. Available online: https://cordis.europa.eu/project/id/673330 (accessed on 3 June 2023).
  10. Statistics Poland, Road Transport in Poland in the Years 2018 and 2019. Available online: https://stat.gov.pl/files/gfx/portalinformacyjny/pl/defaultaktualnosci/5511/6/6/1/td_w_pl_2018_2019.pdf (accessed on 23 March 2023).
  11. Statistics Poland, Road Transport in Poland in the Years 2010, 2011. Available online: https://stat.gov.pl/cps/rde/xbcr/gus/TL_transport_drogowy_2010-2011.pdf (accessed on 24 March 2023).
  12. Transportation—Results of Operations in 2021. Available online: https://stat.gov.pl/obszary-tematyczne/transport-i-lacznosc/transport/transport-wyniki-dzialalnosci-w-2021-roku,9,21.html (accessed on 23 March 2023).
  13. Statistics Poland, Financial Economy of Local Government Units 2020. Available online: https://stat.gov.pl/download/gfx/portalinformacyjny/pl/defaultaktualnosci/5483/5/17/1/gospod_finansowa_jst_2020.pdf (accessed on 24 March 2023).
  14. PSE, Highest Voltage Transmission Network Plan. Available online: https://www.pse.pl/obszary-dzialalnosci/krajowy-system-elektroenergetyczny/plan-sieci-elektroenergetycznej-najwyzszych-napiec (accessed on 24 March 2023).
  15. PSE, Information Regarding the Duration of Interruptions in the Supply of Electricity to Customers Connected to the Transmission Network. Available online: https://www.pse.pl/obszary-dzialalnosci/krajowy-system-elektroenergetyczny/wskazniki-ciaglosci-dostaw-energii-elektrycznej (accessed on 24 March 2023).
  16. Berzi, L.; Baldanzini, N.; Barbani, D.; Barbieri, R.; Locorotondo, E.; Pierini, M.; Pugi, L.; Alessandrini, A.; Cignini, F.; Ortenzi, F.; et al. Structural and Energy Storage Retrofit of an Electric Bus for High-Power Flash Recharge. Procedia Struct. Integr. 2019, 24, 408–422. [Google Scholar] [CrossRef]
  17. Warburton, S. Horiba Mira Urges Bus Owners to Retrofit with Electric. Available online: https://www.horiba-mira.com/media-centre/news/2019/10/21/horiba-mira-urges-bus-owners-and-operators-to-consider-retrofitting-amid-50m-e-bus-pledge/ (accessed on 24 March 2023).
  18. Alessandrini, A.; Cignini, F.; Ortenzi, F.; Pede, G.; Stam, D. Advantages of Retrofitting Old Electric Buses and Minibuses. Energy Procedia 2017, 126, 995–1002. [Google Scholar] [CrossRef]
  19. Standardized Battery Systems for Commercial Vehicles. Available online: https://www.webasto-electrified.com/int/products/cv-standard-battery-system/ (accessed on 24 March 2023).
  20. Webasto Battery Systems—Product Showcase CV NextGen Battery @ the Battery Show 2021. 2021. Available online: https://www.youtube.com/watch?v=rUlxq_dGphc (accessed on 3 June 2023).
  21. Kozłowski, M.; Tomczuk, K.; Szczypior, J. Methodology of Determining Basic Technical Parameters of Electric-Drive Car. Electr. Rev. 2011, 87, 299–304. [Google Scholar]
  22. Rakov, V.; Ivanov, V.N.; Karpov, Y.G.; Melehin, V.F.; Izmailov, R.A.; Yun, V.K.; Zaripova, D.A. Method for Determining the Basic Energy Characteristics of Elements of a Hybrid Car Engine. IOP Conf. Ser. Earth Environ. Sci. 2019, 337, 012066. [Google Scholar] [CrossRef] [Green Version]
  23. Wang, X.; Ye, P.; Zhang, Y.; Ni, H.; Deng, Y.; Lv, S.; Yuan, Y.; Zhu, Y. Parameter Optimization Method for Power System of Medium-Sized Bus Based on Orthogonal Test. Energies 2022, 15, 7243. [Google Scholar] [CrossRef]
  24. Bekheira, T.; Sofiane, D.; Abdelaziz, K.; Mohamed, B. A Power Presizing Methodology for Electric Vehicle Traction Motors. Int. Rev. Model. Simul. 2013, 6, 29–32. [Google Scholar]
  25. Husain, I.; Ozpineci, B.; Islam, M.S.; Gurpinar, E.; Su, G.-J.; Yu, W.; Chowdhury, S.; Xue, L.; Rahman, D.; Sahu, R. Electric Drive Technology Trends, Challenges, and Opportunities for Future Electric Vehicles. Proc. IEEE 2021, 109, 1039–1059. [Google Scholar] [CrossRef]
  26. Efficiency and Loss Mapping of AC Motors. Available online: https://www.hbm.com/en/6207/white-paper-efficiency-and-loss-mapping-of-ac-motors/ (accessed on 26 March 2023).
  27. Gang, L.; Zhi, Y. Energy Saving Control Based on Motor Efficiency Map for Electric Vehicles with Four-Wheel Independently Driven in-Wheel Motors. Adv. Mech. Eng. 2018, 10, 168781401879306. [Google Scholar] [CrossRef] [Green Version]
  28. Schwager, L.; Tuysuz, A.; Zwyssig, C.; Kolar, J.W. Modeling and Comparison of Machine and Converter Losses for PWM and PAM in High-Speed Drives. IEEE Trans. Ind. Appl. 2014, 50, 995–1006. [Google Scholar] [CrossRef]
  29. Increasing the Range of EV with the Same Battery Size—Part I—The Efficiency. Available online: https://www.silicon-mobility.com/increasing-the-range-of-ev-with-the-same-battery-part-i-the-efficiency/ (accessed on 26 March 2023).
  30. Sato, D.; Itoh, J. Total Loss Comparison of Inverter Circuit Topologies with Interior Permanent Magnet Synchronous Motor Drive System. In Proceedings of the 2013 IEEE ECCE Asia Downunder, Melbourne, VIC, Australia, 3–6 June 2013; pp. 537–543. [Google Scholar]
  31. Stark, A. EV Design—Electric Motors. Available online: https://x-engineer.org/automotive-engineering/vehicle/electric-vehicles/ev-design-electric-motors/ (accessed on 26 March 2023).
  32. Liu, H.; Huang, X.; Lin, F.; Yang, Z. Loss Model and Efficiency Analysis of Tram Auxiliary Converter Based on a SiC Device. Energies 2017, 10, 2018. [Google Scholar] [CrossRef] [Green Version]
  33. Stabile, A.; Estima, J.O.; Boccaletti, C.; Marques Cardoso, A.J. Converter Power Loss Analysis in a Fault-Tolerant Permanent-Magnet Synchronous Motor Drive. IEEE Trans. Ind. Electron. 2015, 62, 1984–1996. [Google Scholar] [CrossRef]
  34. Mahmoudi, A.; Soong, W.L.; Pellegrino, G.; Armando, E. Efficiency Maps of Electrical Machines. In Proceedings of the 2015 IEEE Energy Conversion Congress and Exposition (ECCE), Montreal, QC, Canada, 20–24 September 2015; pp. 2791–2799. [Google Scholar]
  35. Ng, A.; Ma, T. CS229 Lecture Notes. Available online: https://cs229.stanford.edu/notes2022fall/main_notes.pdf (accessed on 26 March 2023).
  36. Plett, G.L. Battery Modeling. In Battery Management Systems; University of Colorado: Colorado Springs, CO, USA, 2015; Volume I. [Google Scholar]
  37. How Simcenter Amesim Can Help You in the Battery Pack Design for Electrical Vehicles. Available online: https://community.sw.siemens.com/s/article/how-simcenter-amesim-can-help-you-in-the-battery-pack-design-for-electrical-vehicles (accessed on 26 March 2023).
  38. Kozłowski, M. Simulation Method for Determining Traction Power of ATN–PRT Vehicle. Transport 2016, 33, 335–343. [Google Scholar] [CrossRef] [Green Version]
  39. Vehicle and Fuel Emissions Testing. Dynamometer Drive Schedules. Available online: https://www.epa.gov/vehicle-and-fuel-emissions-testing/dynamometer-drive-schedules (accessed on 26 March 2023).
  40. Emission Test Cycles. Available online: https://dieselnet.com/standards/cycles/index.php (accessed on 26 March 2023).
  41. Barlow, T.J.; Latham, S.; Mccrae, I.S.; Boulter, P.G. A Reference Book of Driving Cycles for Use in the Measurement of Road Vehicle Emissions; Transport Research Laboratory: Crowthorne, UK, 2009. [Google Scholar]
Figure 1. Concept of the component selection method.
Sustainability 15 10484 g001
Figure 2. ECECOL, EUDCCOL, EUDCLCOL travel cycle speed waveforms.
Sustainability 15 10484 g002
Figure 3. NYCCCOL, UDDSCOL, US06COL travel cycle speed waveforms.
Sustainability 15 10484 g003
Figure 4. Efficiency map graphs for motor (left) and inverter (right). Red line means continuous power, blue line—peak power.
Sustainability 15 10484 g004
Figure 5. Δ S o C increment dependence map.
Sustainability 15 10484 g005
Figure 6. Δ Q l o s s × 10 6 capacity loss map.
Sustainability 15 10484 g006
Table 1. Loss function fit weights for a selected system.
k 0 k 1 k 2 k 3 k 4 k 5 k 6 k 7
0.1580−0.2733−0.22780.78121.47451.1305−0.2249−1.9670
k 8 k 9 k 10 k 11 k 12 k 13 k 14
−1.0319−0.32900.01980.48360.8965−0.00030.1103
Table 2. Examples of weight values for equation Δ S o C .
w 0 w 1 w 2 w 3 w 4
−0.051943.89160.0695−8.1747−1.4921
Table 3. Examples of weight values for equation Q l o s s .
c 0 c 1 c 2 c 3 c 4
14,66218,541−57,168−262644,938
Table 4. Estimated battery lifetime based on bus operating conditions and its configuration.
ParameterValue
S o H , [%]95
Full discharge (cycles)7
Distance travelled, [km]84
Average Q l o s s , [kWh]/100 km118
Energy Throughput, [kWh]/100 km139
Battery life cycles used per trip33 × 4/ET = ~1
Expected daily mileage, [km]100
Assumed battery cycles3000
Estimated battery life [years]5
Table 5. Potential benefits and issues of bus retrofitting.
BenefitsIssues
Electric buses converted through the retrofitting process do not emit pollutants, contributing to improved air quality and reducing the local environmental impact.Retrofitting does not result in a new bus, so design deficiencies and problems with other bus components may emerge during operation.
Electric motors have higher efficiency than combustion engines, resulting in lower bus operating costs.Accommodating the battery pack may require structural modifications; an alternative solution could involve placing the batteries in the luggage compartment.
The ability to recuperate electric energy reduces overall energy consumption.Existing systems, such as cooling or air conditioning, need to be adapted to meet the requirements of an electric bus.
Electric traction systems have simpler designs and fewer components, reducing maintenance and repair costs.The service center responsible for repairs and maintenance of retrofitted buses should be adequately equipped, and its staff should be trained in handling electric buses.
Electric motors operate with lower noise levels, creating a more pleasant environment for residents living near roads.Retrofitted electric buses generally have a lower range compared to their combustion counterparts.
The investment costs for bus modernization are significantly lower than purchasing new electric buses.The operational lifespan of retrofitted buses will be shorter than new buses.
When retrofitting a combustion bus, a considerable portion of its components can still be utilized, eliminating the need for their scrapping.When using a solution with a removable battery placed in a tray, the issue of high currents at the battery contacts during connection should be taken into account, as well as the fire safety aspects of the battery pack.
Table 6. Advantages and disadvantages of the proposed method.
AdvantagesDisadvantages
The method allows the estimation of the range and operational period of a 12-m bus based on a small number of control variables, such as the continuous rated power of the motor and battery capacity.The method is specifically designed for 12-m buses. This limitation arises because the authors for propulsion systems suitable for this type of bus investigated the weighting coefficients determining the map parameters.
Due to its simplicity, the method requires minimal computational resources and can be employed by investors without specialized design offices for rapid bus pre-prototyping.Extending this method to other vehicles, such as passenger or heavy-duty vehicles, would require new fitting calculations.
The method can be used to assess the range (for determining charging points)
or the remaining operational time for buses already in operation.
Building efficiency maps may require specialized engineering software (e.g., Matlab R2022a, Simulink R2022a, Amesim 2022.1—depending on the used model).
The method allows a quick check of whether the bus configuration allows for traveling along a selected route. It enables rapid verification of operating condition constraints for given movement patterns (scheduled speed plan + road profiles).
It is sufficient to import the route profile, for example, from Google Maps into the program to accomplish this.
Adding new components to the library requires constructing efficiency maps and parameters describing the battery. For this method to be reliable, it is necessary to have accurate loss maps and battery models provided by the manufacturer.
Disclaimer/Publisher’s Note: The statements, opinions and data contained in all publications are solely those of the individual author(s) and contributor(s) and not of MDPI and/or the editor(s). MDPI and/or the editor(s) disclaim responsibility for any injury to people or property resulting from any ideas, methods, instructions or products referred to in the content.

