
Mosque Morphological Analysis: The Impact of Indoor Spatial–Volumetric Visibility on Worshipers’ Visual Comfort


Abstract
:1. Introduction
2. Literature Review
2.1. Previous Studies on Spatial Visibility Analysis in Architecture
2.2. Previous Studies on Volumetric Visibility Analysis in Architecture
2.3. Previous Studies on Spatial–Visibility Analysis in Mosques
- What are the differences in visual comfort between various mosque typo-morphologies as indicated by 2D isovist assessments of prayer hall spatial characteristics?
- What are the differences in visual comfort between various mosque typo-morphologies as indicated by 3D isovist assessments of prayer hall volumetric characteristics?
- Is there a difference in the volumetric visual comfort of worshipers sitting and standing conditions inside the prayer hall?
- Which Mosque typo-morphology provides the highest level of visual comfort for worshipers by integrating spatial and volumetric vision?
- Spatial parameters using 2D isovist.
- Volumetric parameters using 3D isovist.
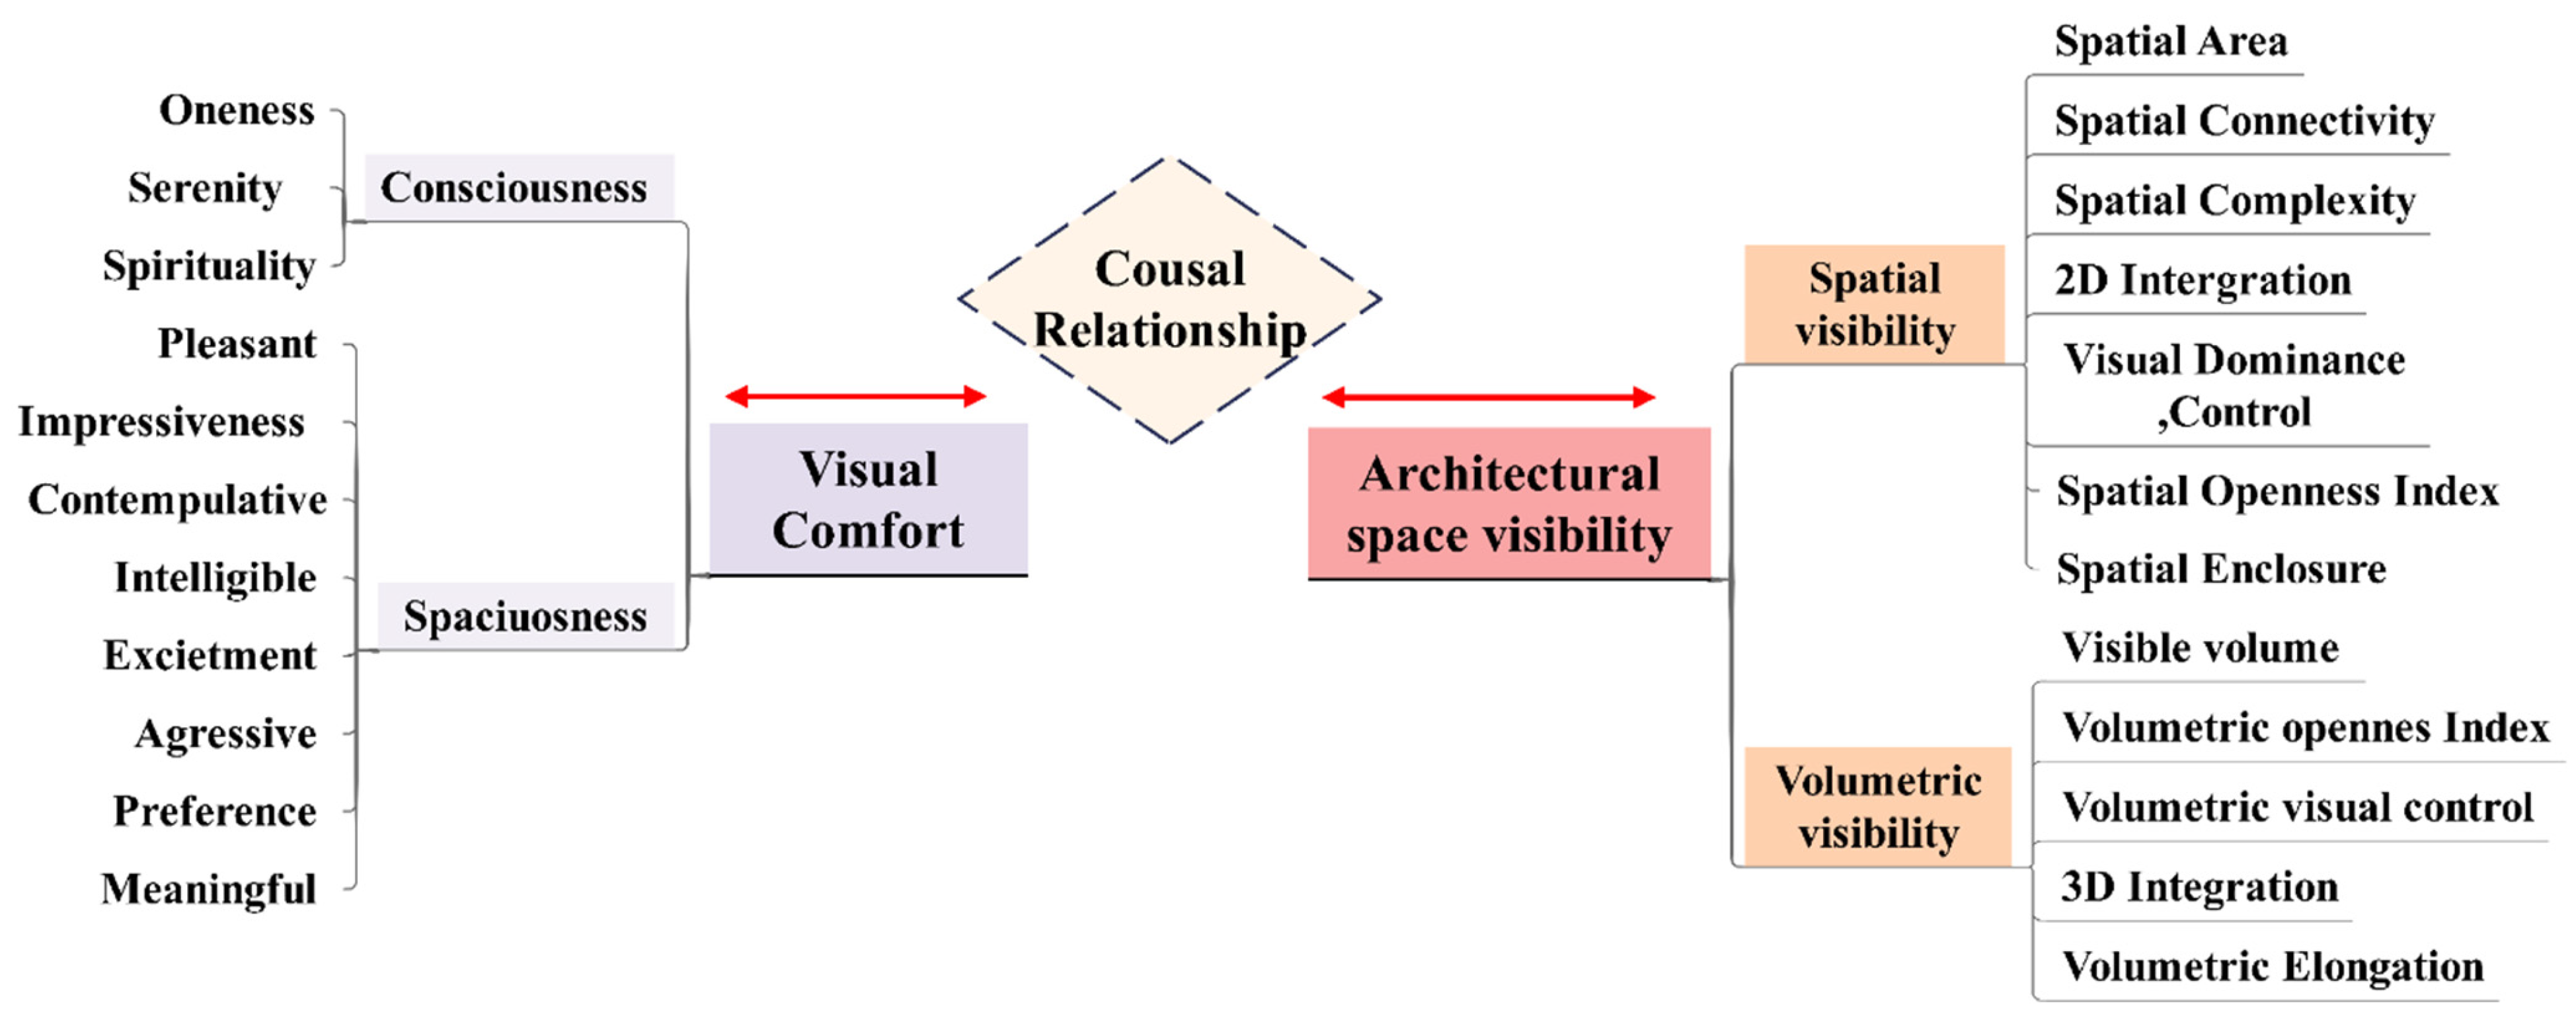
3. Theoretical Framework of Visual Comfort
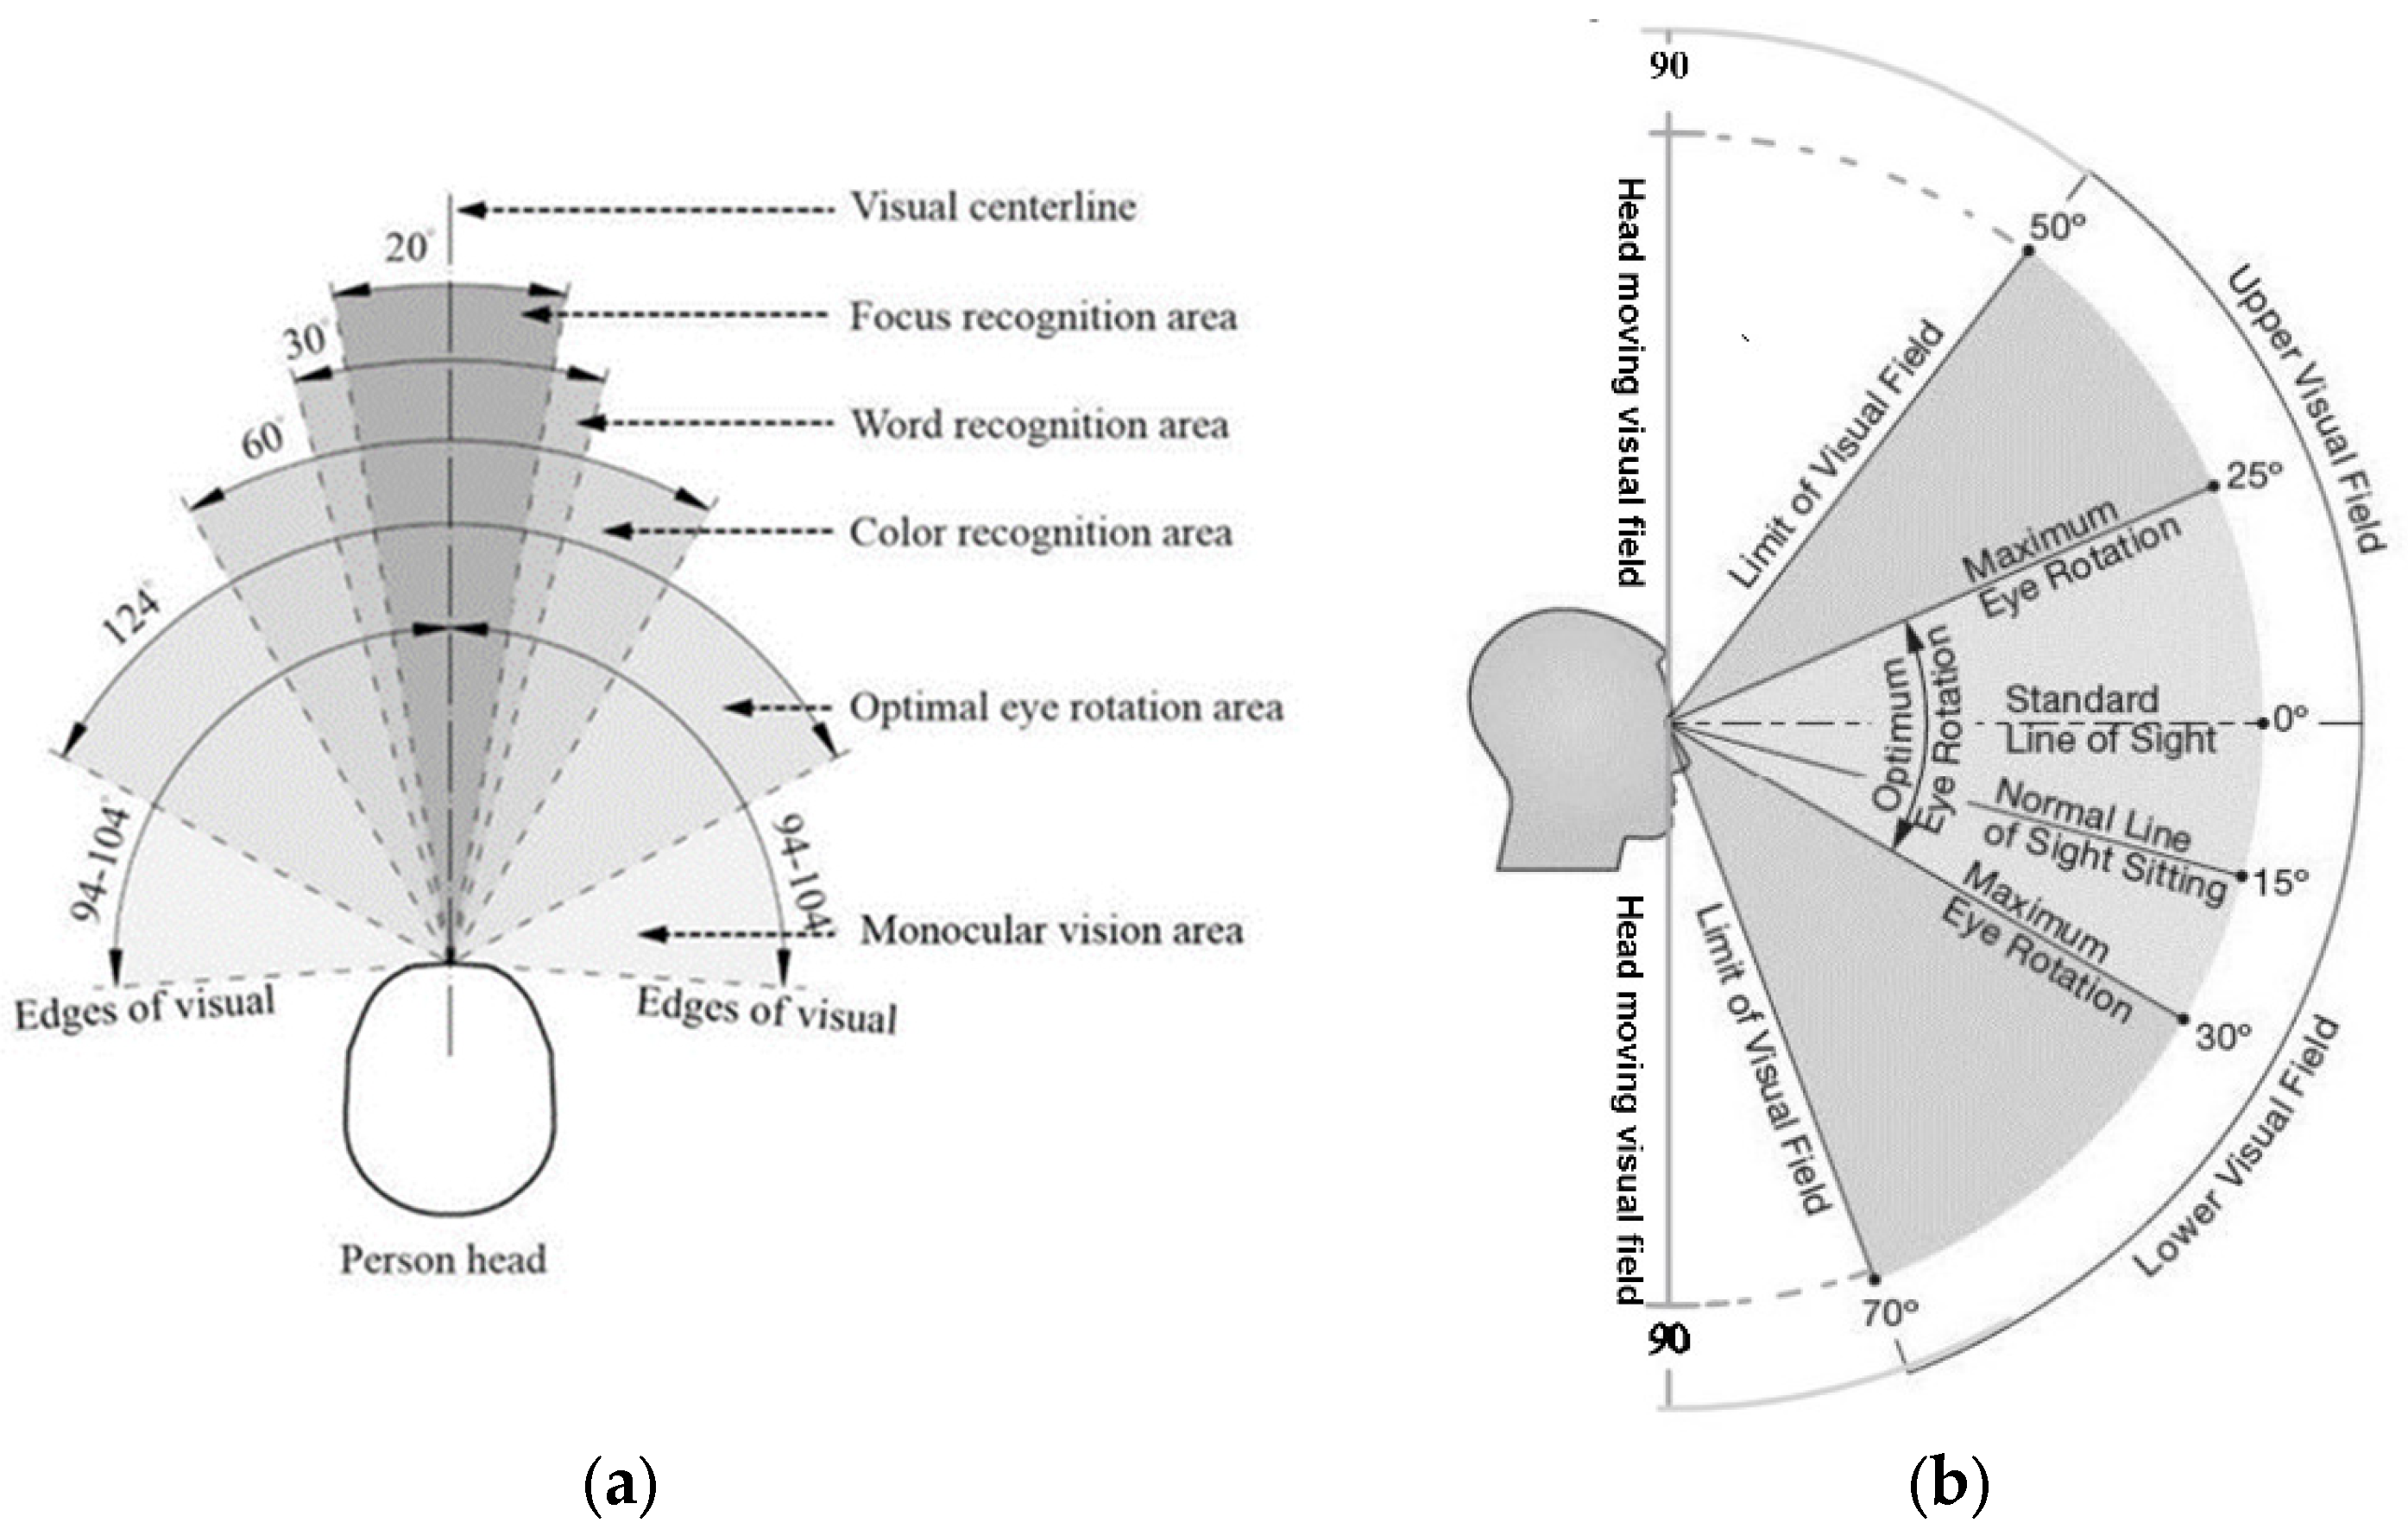
3.1. Visual Field
3.1.1. The Concept of Indoor Spatial and Volumetric Visual Field
3.1.2. Isovist and Visibility Graph Analysis (VGA)
3.1.3. Developing Isovist from 2D to 3D Isovist
3.2. Visual Comfort Measures and Their Relationship to the Isovist
3.2.1. Visual Comfort Metrics and Their Relation to Two-Dimensional Isovist Metrics
Spatial Visibility Area
Spatial Connectivity
Spatial Complexity
Spatial Integration
Spatial Control
Spatial Openness Index—SOI
Spatial Circularity
3.2.2. Three-Dimensional Isovist Metrics and Their Relation to Human Visual Comfort
Visible Volume
Volumetric Openness Index–VOI
Volumetric Visual Control
Three Dimensional Integration
Volumetric Elongation
4. Materials and Methods
4.1. Case Study Selection Strategy
4.2. Method
4.2.1. Two-Dimensional Isovist for Calculating Spatial Visibility Metrics
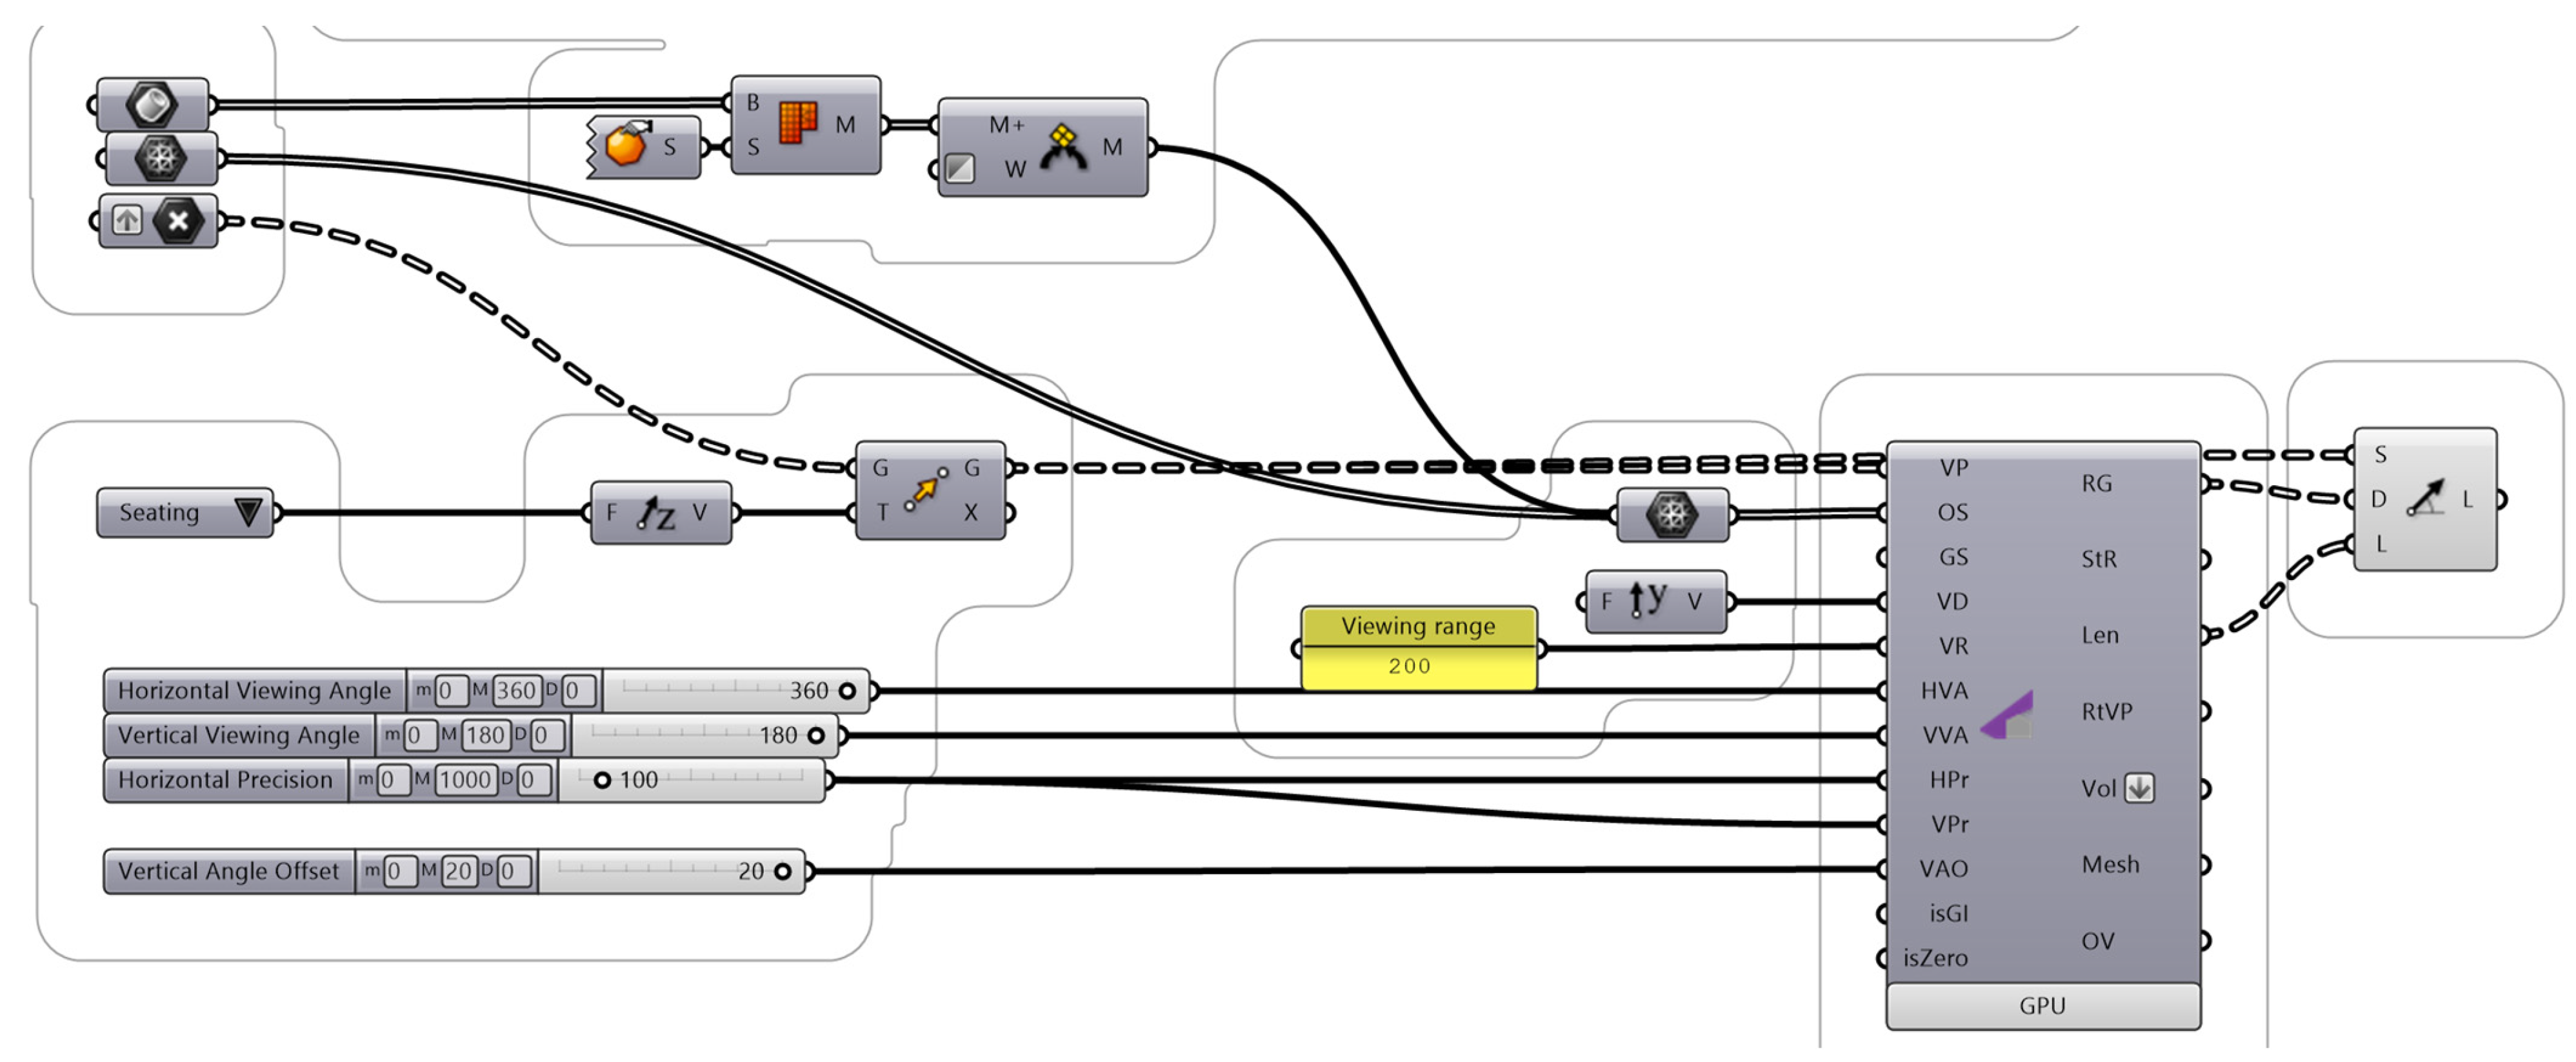
4.2.2. Three-Dimensional Isovist Calculation
- (a)
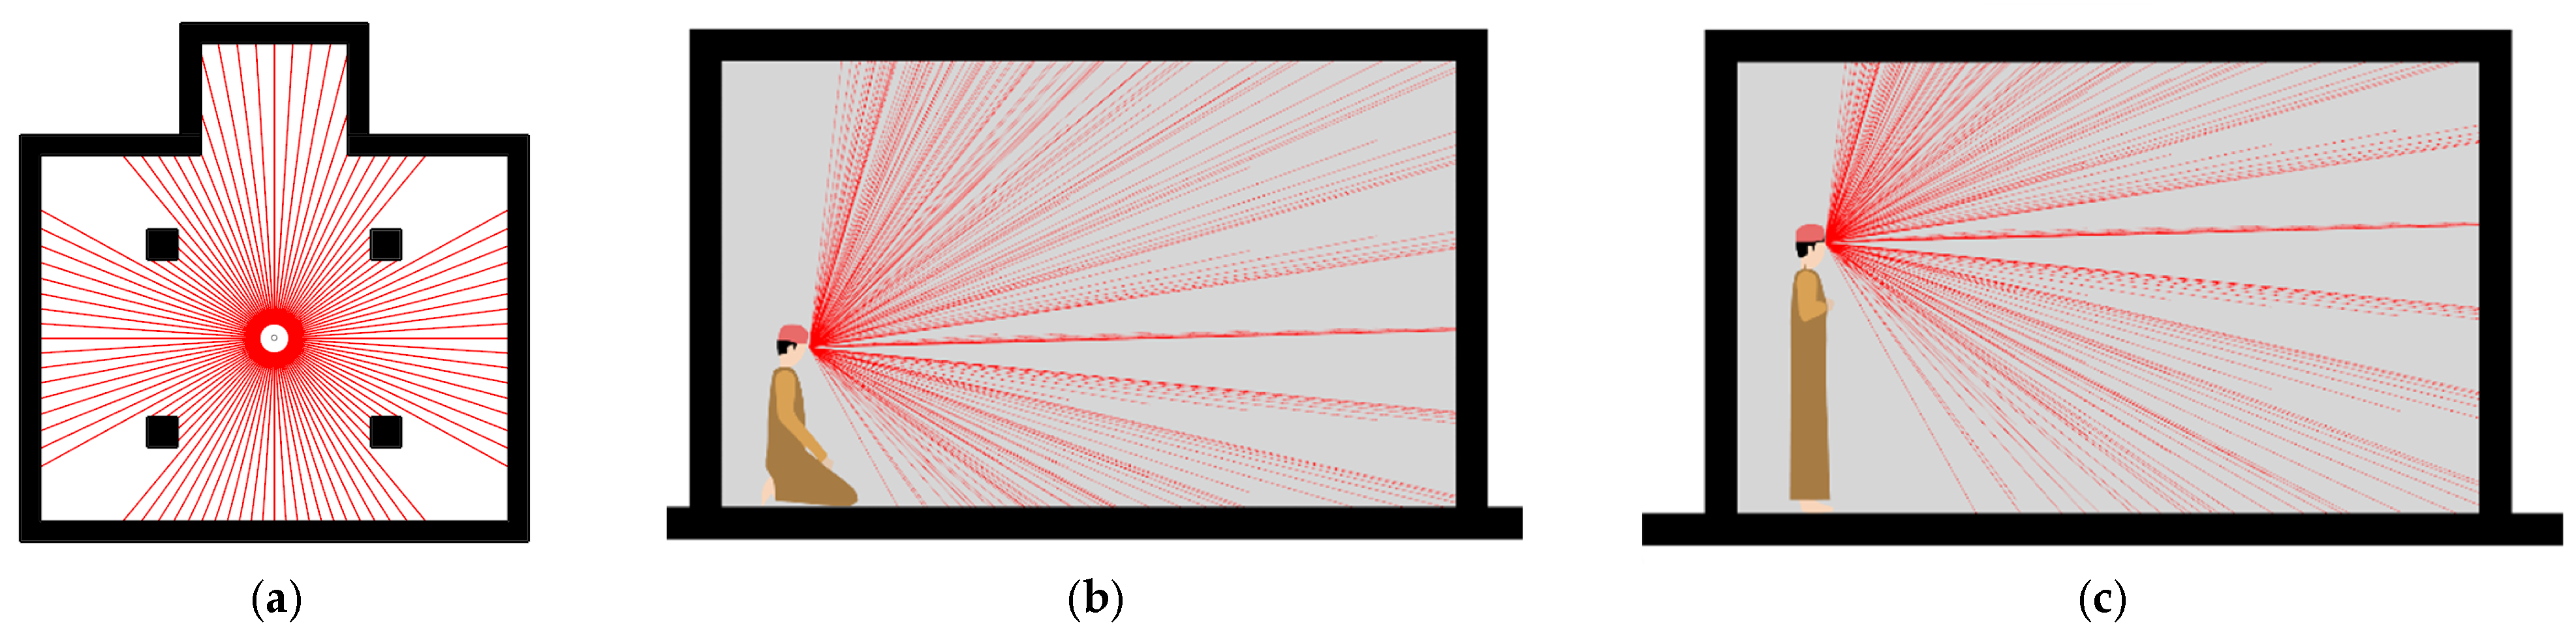
- Choosing four different vantage points.
- (b)
- Setting the point of view of the worshipers’ sitting and standing conditions to 1.00 m and 1.68 m, separately.
- (c)
- Identifying the horizontal direction with an angle (360°) in addition to the vertical direction with angles (0–180°).
- (d)
- The main idea behind creating the 3D isovist is to create a sphere that resembles the visible visual field of a human being, and then use ray-casting technology to measure the length of the rays after they contact the obstacles.
- (e)
- The ray sphere is generated in two steps; the first is to create a semicircle of rays in the vertical direction with a number (180° ray-casting direction) to ensure that the angle between each ray and its neighbor is (10°). The second step is to copy the semicircle in a circular way starting from the point in the horizontal direction with a number (360° ray-casting direction) to ensure that the angle between each semicircle of rays and its neighbors is 10° (Figure 5a–c).
- (f)
- A full sphere of rays emitted from one vantage point is generated using 180 × 360 = 640,000 rays.
- (g)
- The ray discontinues when it encounters an obstacle and is linked to the created ball of rays, making each one an “isovist ray”.
- (h)
- When dealing with windows that face outside, the process follows the FLI method [53], which refers to the closing boundaries since they must be specified.
- (i)
- All the above elements have been inputted into the grasshopper script in the Rhinocro.7 plugin with Decoding Space and 3D Convex Hull as shown in Figure 6.


5. Results and Discussion
5.1. Two-Dimensional Isovist Results and Discussion
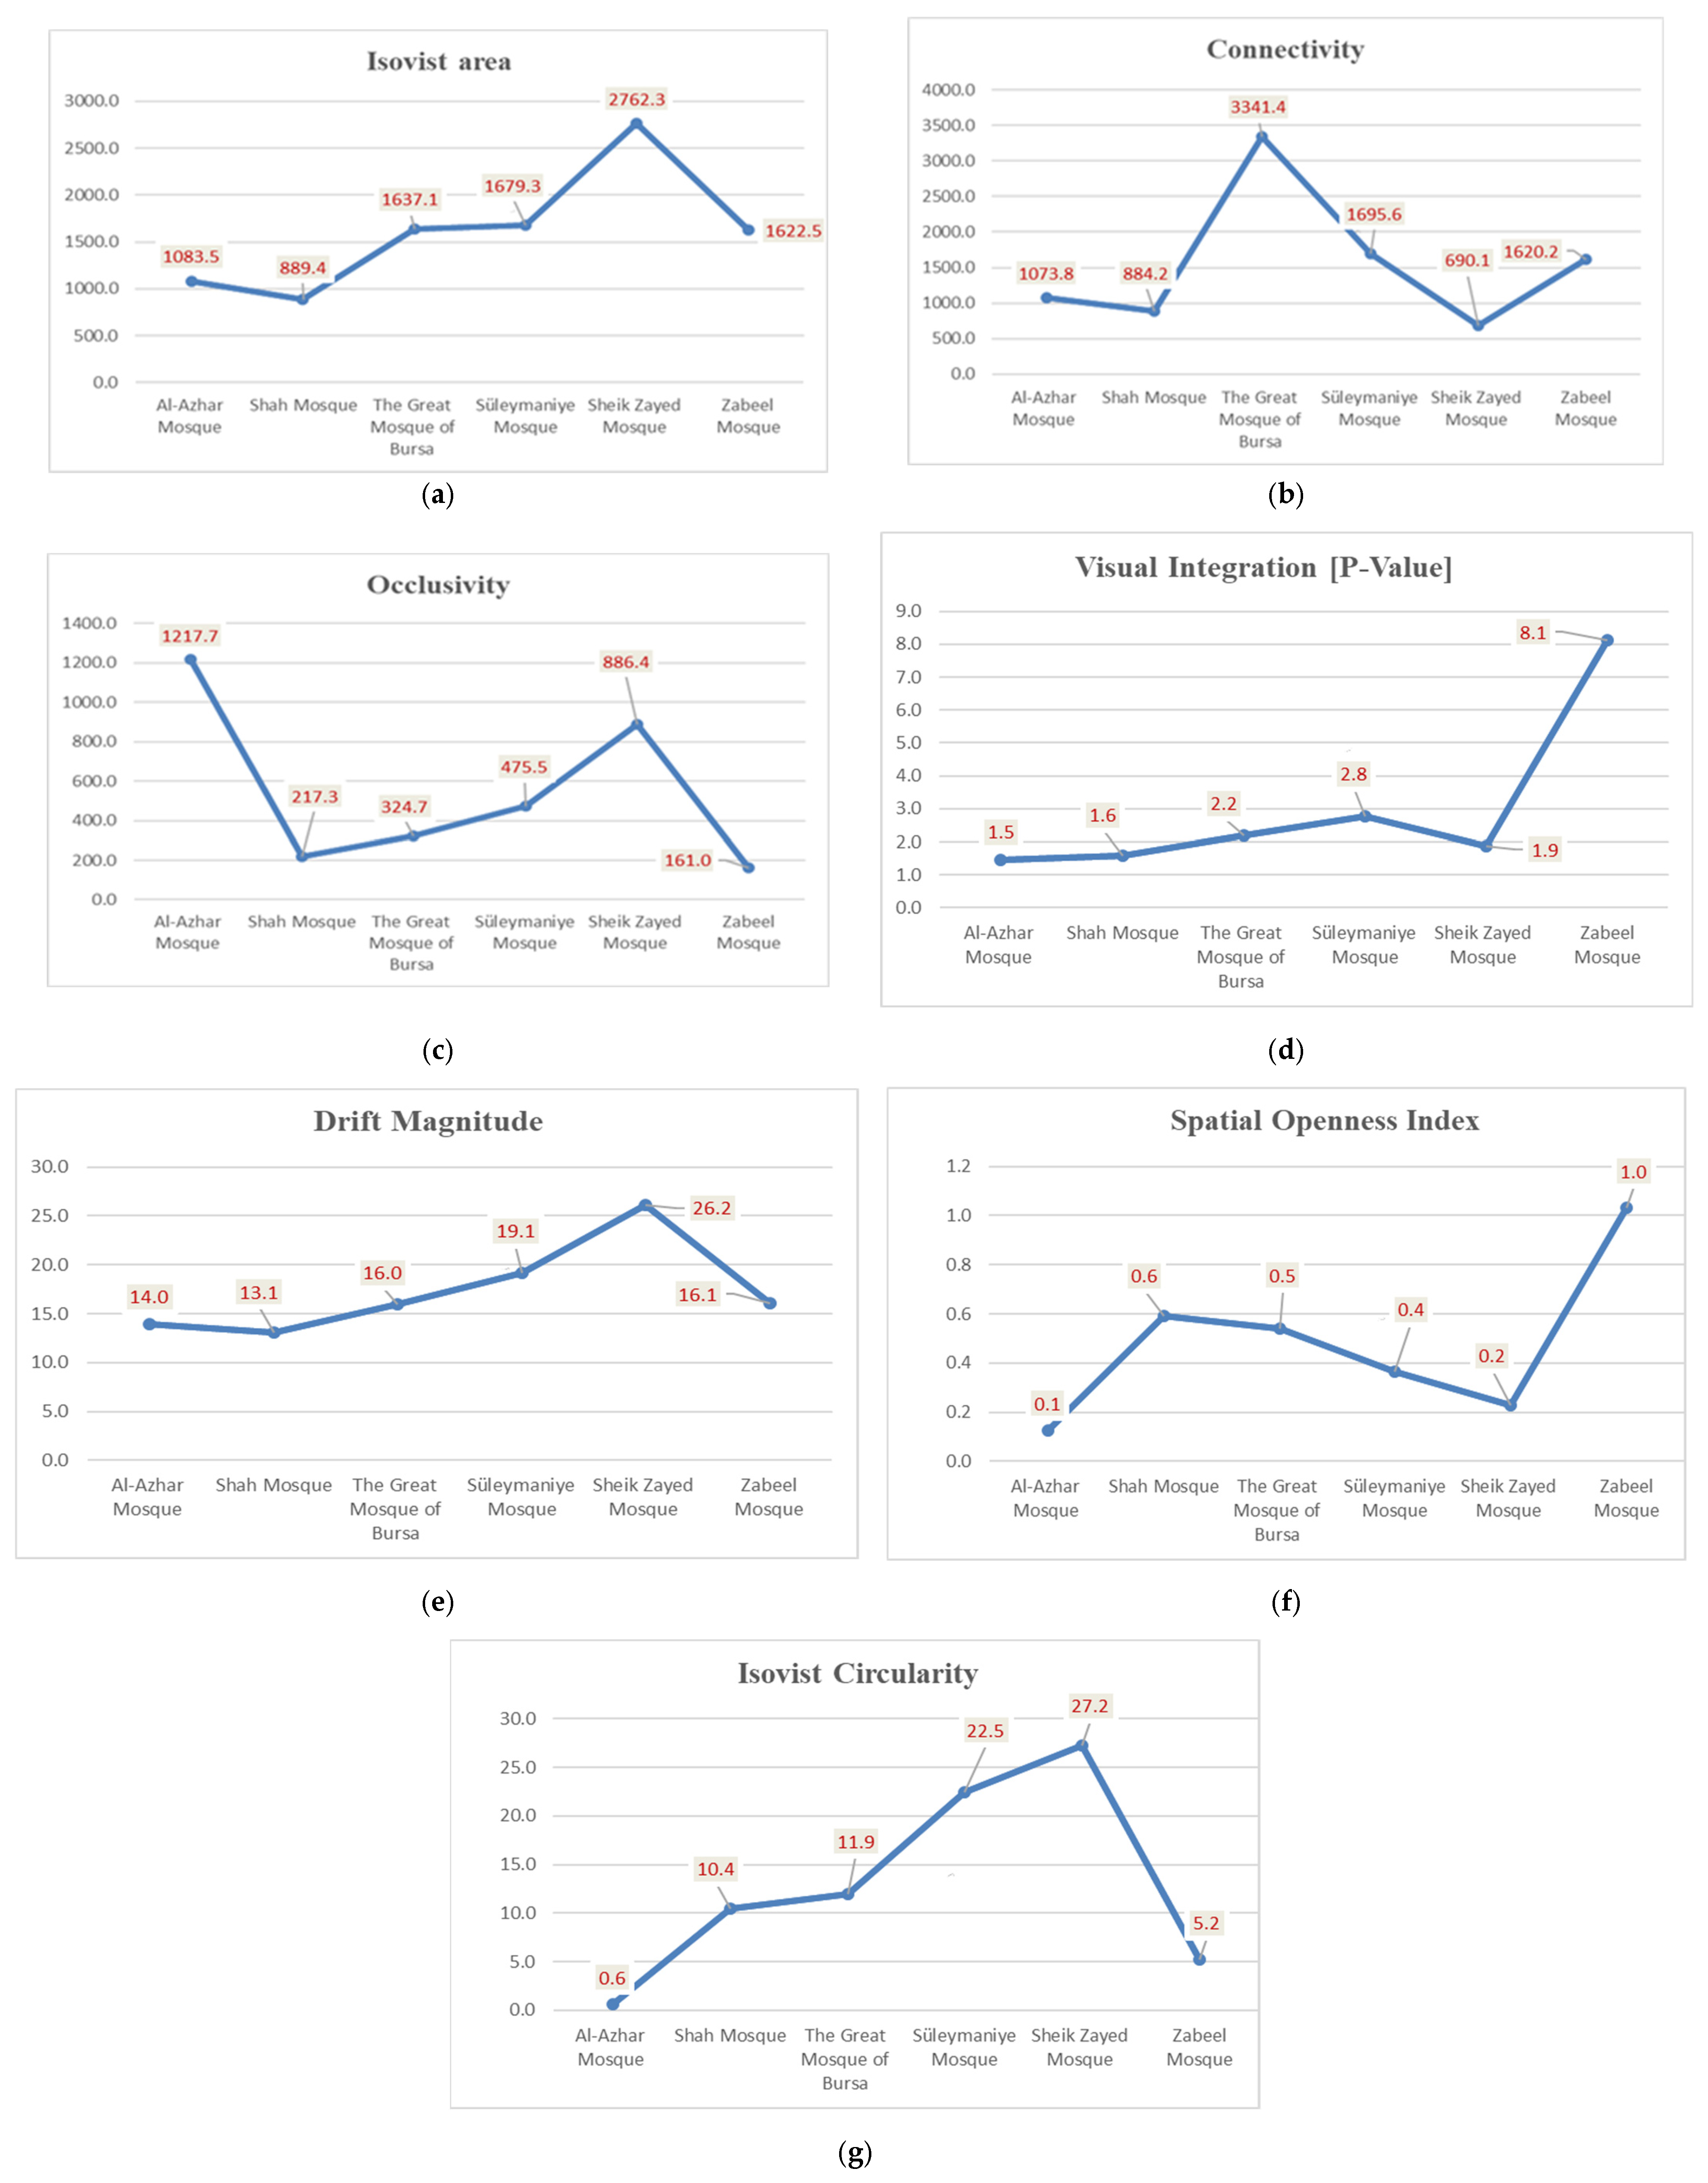
5.1.1. Spatial Visibility Area
5.1.2. Spatial Connectivity
5.1.3. Spatial Complexity
5.1.4. Spatial Integration
5.1.5. Spatial Control
5.1.6. Spatial Openness Index
5.1.7. Spatial Circularity and Enclosure
5.2. Three-Dimensional Isovist Results and Discussion
5.2.1. Space Visible Volume
5.2.2. Volumetric Openness Index
5.2.3. Volumetric Visual Control (VVC)
5.2.4. Three-Dimensional Integration
5.2.5. Volumetric Elongation
6. Conclusions
Author Contributions
Funding
Data Availability Statement
Acknowledgments
Conflicts of Interest
References
- Song, Y.; Mao, F.; Liu, Q. Human comfort in indoor environment: A review on assessment criteria, data collection, and data analysis methods. IEEE Access 2019, 7, 119774–119786. [Google Scholar] [CrossRef]
- Johnson, P.A. The Theory of Architecture: Concepts, Themes and Practices; Wiley: New York, NY, USA, 1994. [Google Scholar]
- Kim, Y.O. Spatial Configuration, Spatial Cognition and Spatial Behaviour: The Role of Architectural Intelligibility in Shaping Spatial Experience; University of London: London, UK; University College London: London, UK, 1999. [Google Scholar]
- Démuth, A. Perception Theories; Trnavská Univerzita: Kraków, Poland, 2013; Volume 2549. [Google Scholar]
- Hillier, B.; Hanson, J. The Social Logic of Space; Cambridge University Press: Cambridge, NY, USA, 1984. [Google Scholar] [CrossRef]
- Turner, A.; Maria, D.; David, O.; Alan, P. From Isovists to Visibility Graphs: A Methodology for the Analysis of Architectural Space. Environ. Plan. B 2001, 28, 103–121. [Google Scholar] [CrossRef] [Green Version]
- Khan, H.U. The architecture of the mosque, an overview and design directions. In Expressions of Islam in Buildings; Salam, H., Ed.; Concept Media/The Aga Khan Award for Architecture: Singapore, 1990; pp. 109–127. [Google Scholar]
- Okuyucu, S.E. Evaluation of spatial fictions, design concepts, aesthetic quests of traditional, modern mosques from past to present and the analysis of mosque samples. Civ. Eng. Archit. 2016, 4, 54–66. [Google Scholar] [CrossRef] [Green Version]
- Macaulay, D. Mosque, 1st ed.; Houghton Mifflin Harcourt: Boston, MA, USA, 2008. [Google Scholar]
- Franz, G.; Wiener, J.M. From space syntax to space semantics: A behaviorally and perceptually oriented methodology for the efficient description of the geometry and topology of environments. Environ. Plan. B Plan. Des. 2008, 35, 574–592. [Google Scholar] [CrossRef] [Green Version]
- Ostwald, M.J.; Dawes, M.J. Using isovists to analyse architecture: Methodological considerations and new approaches. Int. J. Constr. Environ. 2013, 3, 85–106. [Google Scholar] [CrossRef]
- Dosen, A.S.; Ostwald, M.J. Lived space and geometric space: Comparing people’s perceptions of spatial enclosure and exposure with metric room properties and isovist measures. Archit. Sci. Rev. 2016, 60, 62–77. [Google Scholar] [CrossRef]
- Sedlmeier, A.; Feld, S. Learning indoor space perception. J. Locat. Based Serv. 2018, 12, 179–214. [Google Scholar] [CrossRef]
- Batty, M. Exploring isovist fields: Space and shape in architectural and urban morphology. Environ. Plan. B Plan. Des. 2001, 28, 123–150. [Google Scholar] [CrossRef] [Green Version]
- Fisher-Gewirtzman, D.; Shach Pinsly, D.; Wagner, I.A.; Burt, M. View-oriented three-dimensional visual analysis models for the urban environment. Urban Des. Int. 2005, 10, 23–37. [Google Scholar] [CrossRef]
- Fisher-Gewirtzman, D. Internal space layout and functionality as a major aspect influencing visual analysis for environmental and urban systems. WIT Trans. Ecol. Environ. 2010, 129, 431–442. [Google Scholar]
- Koltsova, A.; Tunçer, B.; Schmitt, G. Visibility analysis for 3D urban environments. In Proceedings of the 2013 eCAAde, Delft, The Netherlands, 18–20 September 2013; Models of Computation: Human Factors, Computation and Performance. Delft University of Technology: Delft, The Netherlands, 2013; Volume 2, pp. 375–383. [Google Scholar]
- Fisher-Gewirtzman, D.; Natapov, A. Different approaches of visibility analyses applied on hilly urban environment. Surv. Rev. 2014, 46, 366–382. [Google Scholar] [CrossRef]
- Golub, D.; Doytsher, Y.; Fisher-Gewirtzman, D. 3D visibility analysis indicating quantitative and qualitative aspects of the visible space. Surv. Rev. 2018, 50, 134–146. [Google Scholar] [CrossRef]
- Dalton, N.S.; Dalton, R.C.; Marshall, P.; Pewerett, I.; Clinch, S. Three dimensional isovists for the study of public displays. In Proceedings of the SSS10, 10th International Space Syntax Symposium, London, UK, 13–17 July 2015. [Google Scholar]
- Ünlü, A.; Edgü, E.; Şalgamcıoğlu, M.E.; Çanakçioğlu, N.G.; Yılmaz, E.A. Isometric measurands on perceived spaciousness: Exploring volumetric isovist. In Proceedings of the 12th International Space Syntax Symposium, SSS 2019, Beijing, China, 8–13 July 2019. [Google Scholar]
- Krukar, J.; Manivannan, C.; Bhatt, M.; Schultz, C. Embodied 3D isovists: A method to model the visual perception of space. Environ. Plan. B Urban Anal. City Sci. 2021, 48, 2307–2325. [Google Scholar] [CrossRef]
- Al-Jameel, A.H.; Al-Moula, E.K. Using Three Dimensional Isovist to Detect the Property of Surprise in Architectural Artifacts: Islamic Architecture as A Context. Eurasian J. Sci. Eng. 2023, 9, 14–32. [Google Scholar] [CrossRef]
- Ismail, A.M.; Khalil, H.B.; Mostafa, A. The Soul of Mosques. Mosque Architecture Present Issues and Future Ideas. In Proceedings of the International Conference on Mosque Architecture 2019, Kuala Lumpur, Malaysia, 25–27 November 2019. [Google Scholar]
- Metwally, E. Achieving the visual perception and gestalt psychology in sultan Hassan Mosque building. Open J. Appl. Sci. 2021, 11, 21–40. [Google Scholar] [CrossRef]
- Mustafa, F.A.; Rashid, S.J. Studying the human scale and proportionality of Mosque buildings: Some selected case studies in Erbil city. J. Islam. Archit. 2019, 5, 129–136. [Google Scholar] [CrossRef] [Green Version]
- Kassim, N.; Taib, Z.M. Users’ perception on application of ornamentation motif between excessive and minimal decorated praying hall of community mosque. Procedia-Soc. Behav. Sci. 2014, 153, 99–105. [Google Scholar] [CrossRef] [Green Version]
- Ahmadi, M.; Farkisch, H.; Ahmadi, V.; Khoshnevis, A.M.K. An Insight into the Interrelation between the Mosques’ Architectural Codes and the Quality of Worshipers’ Presence of the Heart: A Case Study of the Safavid Mosques in Isfahan. Cult. Islam. Archit. Urban. J. 2020, 5, 51–74. [Google Scholar] [CrossRef]
- Abbaszadeh, M.J.; Zamani, B. Evaluating Environmental Factors Affecting the Genesis of a Sense of Holy Space in Mosques: Case Studies of Bazar-e-Tehran Mosque, Tehran University Mosque, Al-Jawad Mosque of Tehran. Cult. Islam. Archit. Urban. J. 2020, 5, 105–121. [Google Scholar]
- Abbaszadeh, M.; Sultan, Q.S.; Mohajer, M.A. The Influences of Physical Features of Space on Sense of Place (Case study: Prayer Rooms of Mehrabad International Airport). Int. J. Archit. Urban Dev. 2015, 5, 23–32. [Google Scholar]
- Tarabieh, K.; Nassar, K.; Abu-Obied, N.; Malkawi, F. The statics of space syntax: Analysis for stationary observers. ArchNet-IJAR Int. J. Archit. Res. 2018, 12, 280–306. [Google Scholar] [CrossRef] [Green Version]
- Arslan, H.; Yildirim, K. Perceptual Evaluation of the Mosque Facades of Different Periods: Preference, Complexity, Impressiveness, and Stimulative. Megaron 2017, 12, 511–523. [Google Scholar] [CrossRef] [Green Version]
- Sezer, F.S.; Kaymaz, E. The user’s perception of indoor comfort conditions in historical mosques: The case of Bursa, Turkey. Int. J. Humanit. Soc. Sci. 2016, 6, 43–54. [Google Scholar]
- Ghouchani, M.; Taji, M.; Kordafshari, F. The effect of qibla direction on the hierarchy of movement in mosque: A case study of mosques in Yazd, Iran. Front. Archit. Res. 2016, 8, 396–405. [Google Scholar] [CrossRef]
- Malhis, S. Narratives in Mamluk architecture: Spatial and perceptual analyses of the madrassas and their mausoleums. Front. Archit. Res. 2016, 5, 74–90. [Google Scholar] [CrossRef] [Green Version]
- Adli, L.C.; Chemrouk, N.C. On drafting a new architectural syntax: Case study of the great mosque of Algiers. J. Islam. Archit. 2015, 3, 106–114. [Google Scholar] [CrossRef]
- Munro, K.; Grierson, D. Towards the development of a space/nature syntax at Arcosanti. Open House Int. 2016, 41, 48–55. [Google Scholar] [CrossRef]
- Yaseen, F.R.; Mustafa, F.A. Visibility of nature-connectedness in school buildings: An analytical study using biophilic parameters, space syntax, and space/nature syntax. Ain Shams Eng. J. 2023, 14, 101973. [Google Scholar] [CrossRef]
- Stamps, A.E. Isovists, Enclosure, and Permeability Theory. Environ. Plan. B Plan. Des. 2005, 32, 735–762. [Google Scholar] [CrossRef]
- Dem Bayram, Ç.İ.Ğ.; Lu, Ş. Examining the Occluded Space in a Museum Gallery through User’s Cognition and Space Morphology. In Proceedings of the 13th Space Syntax Symposium, Bergen, Norway, 20–24 June 2022. [Google Scholar] [CrossRef]
- Craig, D.M. Review of “Reviews Vision, by David Marr” San Franclsco: WH Freeman, 1982. ACM SIGDOC Asterisk J. Comput. Doc. 1983, 9, 5–7. [Google Scholar] [CrossRef]
- Gibson, J.J. The Ecological Approach to the Visual Perception; Houghton Mifflin: Boston, MA, USA, 1979. [Google Scholar]
- Gibson, J.J. Reasons for Realism: Selected Essays of James J. Gibson; Lawrence Erlbaum Assoc Incorporated; Lawrence Erlbaum Associates LEA Publishers: London, UK, 1982. [Google Scholar]
- Wang, Z.; Nagai, Y.; Zhu, D.; Liu, J.; Zou, N. Based on Creative Thinking to Museum Lighting Design Influences to Visitors Emotional Response Levels Theory Research. IOP Conf. Ser. Mater. Sci. Eng. 2019, 573, 012093. [Google Scholar] [CrossRef] [Green Version]
- Madhusanka, B.G.D.A.; Jayasekara, A.G.B.P. Design and development of adaptive vision attentive robot eye for service robot in a domestic environment. In Proceedings of the 2016 IEEE International Conference on Information and Automation for Sustainability (ICIAfS), Galle, Sri Lanka, 16–19 December 2016; IEEE: Piscataway, NJ, USA, 2016; pp. 1–6. [Google Scholar]
- Benedikt, M.L. To take hold of space: Isovists and isovist fields. Environ. Plan. B Plan. Des. 1979, 6, 47–65. [Google Scholar] [CrossRef]
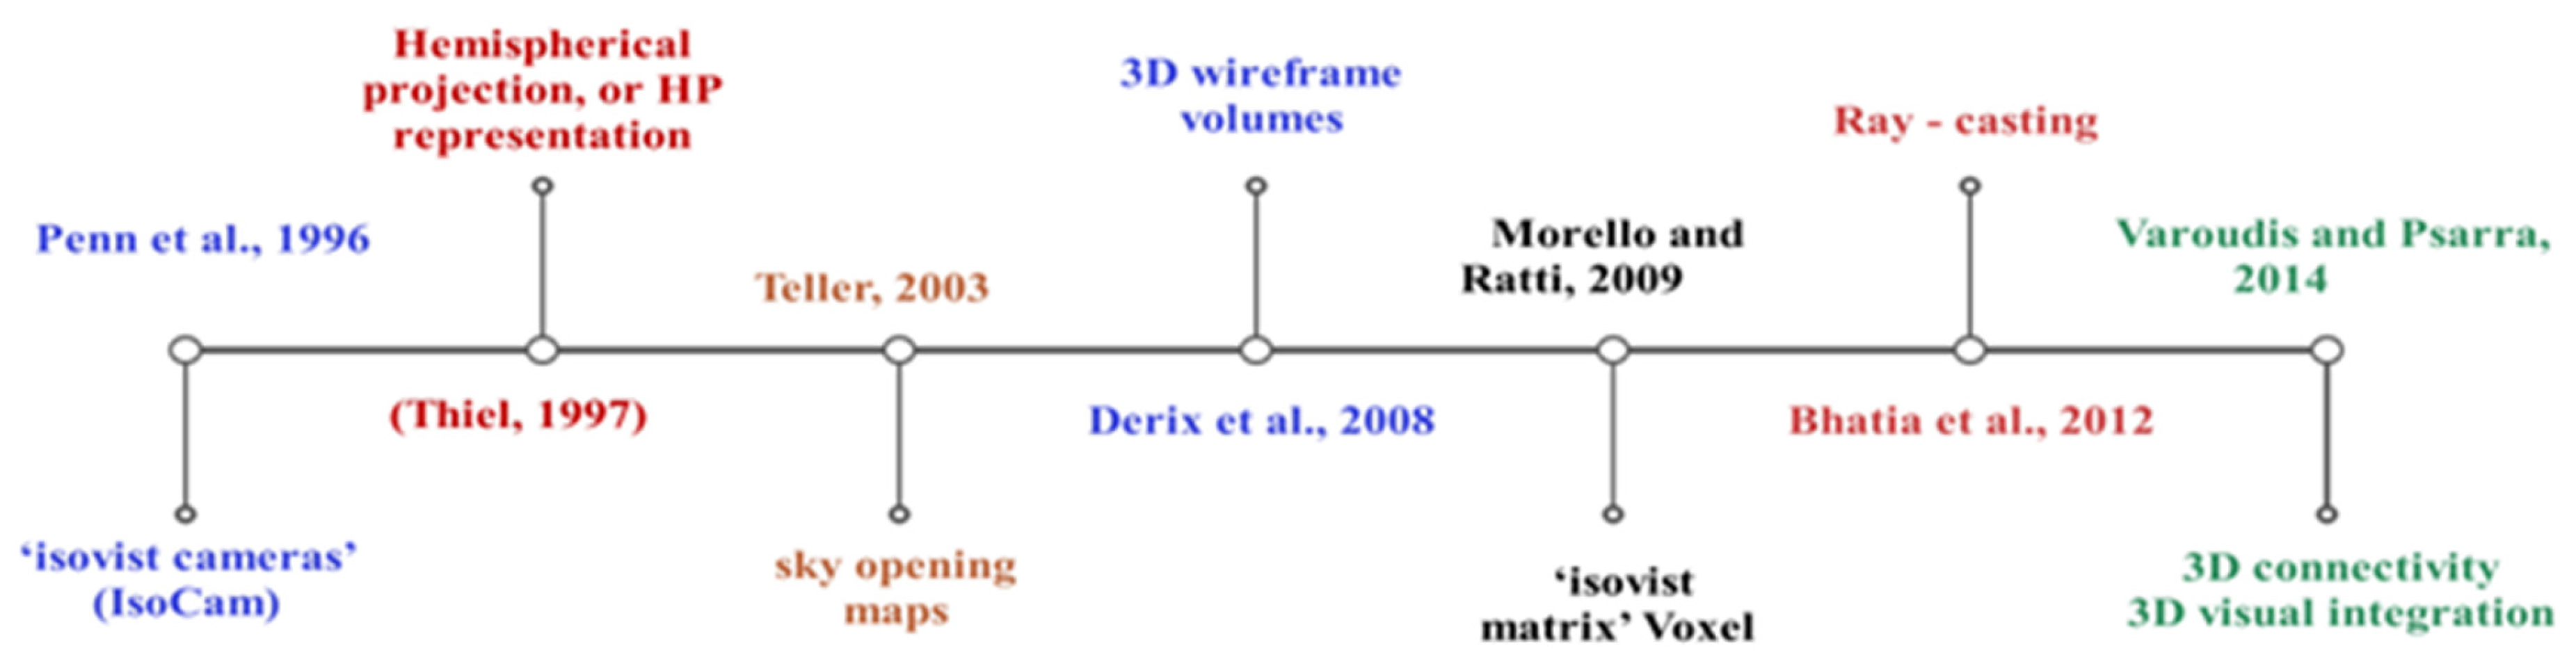
- Morello, E.; Ratti, C. A digital image of the city: 3D isovists in Lynch’s urban analysis. Environ. Plan. B Plan. Des. 2009, 36, 837–853. [Google Scholar] [CrossRef] [Green Version]
- Indraprastha, A.; Shinozaki, M. Computational models for measuring spatial quality of interior design in virtual environment. Build. Environ. 2011, 49, 67–85. [Google Scholar] [CrossRef]
- Penn, A.; Treleavan, P.; Hillier, B.; Bull, L.; Conroy-Dalton, R.; Dalton, N.; Dekker, L.; Mottram, C.; Turner, A. Pangea V2.1b CD and Pangea User Manual [Software]; University College London: London, UK, 1996. [Google Scholar]
- Thiel, P. People, Paths, and Purposes: Notations for a Participatory Envirotecture; University of Washington Press: Seattle, DC, USA, 1997. [Google Scholar]
- Teller, J. A spherical metric for the field-oriented analysis of complex urban open spaces. Environ. Plan. B Plan. Des. 2003, 30, 339–356. [Google Scholar] [CrossRef]
- Derix, C.; Gamlesæter, Å.; Carranza, P.M. 3d Isovists and Spatial Sensations: Two methods and a case study. In Movement and Orientation in Built Environments: Evaluating Design Rationale and User Cognition; University of Freiburg: Freiburg, Germany, 2008; pp. 67–72. [Google Scholar]
- Bhatia, S.; Chalup, S.K.; Ostwald, M.J. Analyzing architectural space: Identifying salient regions by computing 3D isovists. In Proceedings of the 46th Annual Conference of the Architectural Science Association (AN-ZAScA), Gold Coast, Australia, 14–16 November 2012. [Google Scholar]
- Varoudis, T.; Psarra, S. Beyond two dimensions: Architecture through three-dimensional visibility graph analysis. J. Space Syntax 2014, 5, 91–108. [Google Scholar]
- Gibson, J.J. The Senses Considered as Perceptual Systems; Houghton Mifflin: Boston, MA, USA, 1966. [Google Scholar]
- Koutsolampros, P.; Sailer, K.; Varoudis, T.; Haslem, R. Dissecting Visibility Graph Analysis: The metrics and their role in understanding workplace human behavior. In Proceedings of the 12th International Space Syntax Symposium, Beijing, China, 8–13 July 2019; Volume 12. [Google Scholar]
- Franz, G.; Wiener, J.M. Exploring isovist-based correlates of spatial behavior and experience. In Proceedings of the 5th International Space Syntax Symposium, Delft, The Netherlands, 13–17 June 2005; TU Delft Press: Delft, The Netherlands, 2005. [Google Scholar]
- Wiener, J.M.; Franz, G.; Rossmanith, N.; Reichelt, A.; Hanspeter, A.M.; Bülthoff, H.H. Isovist Analysis Captures Properties of Space Relevant for Locomotion and Experience. Perception 2007, 6, 1066–1083. [Google Scholar] [CrossRef] [Green Version]
- Bokharei, S.; Nasar, J.L. Perceived Spaciousness and Preference in Sequential Experience. Hum. Factors 2016, 58, 1069–1081. [Google Scholar] [CrossRef]
- Wise, J.A. The Quantitative Modeling of Human Spatial Habitability; (No. NASA-CR-179716); NASA: Washington, DC, USA, 1985. [Google Scholar]
- Hillier, B. A Configurational Theory of Architecture; Cambridge University Press: Cambridge, UK, 1996. [Google Scholar]
- Turner, A. Depthmap 4—A Researcher’s Handbook; University College London: London, UK, 2004; pp. 9–19. [Google Scholar]
- Conroy, R. Spatial Navigation in Immersive Virtual Environments; University of London: London, UK; University College London: London, UK, 2001. [Google Scholar]
- Sengke, M.M.; Atmodiwirjo, P. Using isovist application to explore visibility area of hospital inpatient ward. IOP Conf. Ser. Mater. Sci. Eng. 2017, 185, 012008. [Google Scholar] [CrossRef] [Green Version]
- Giseop, K.I.M.; Ayoung, K.I.M.; Youngchul, K.I.M. A new 3D space syntax metric based on 3D isovist capture in urban space using remote sensing technology. Comput. Environ. Urban Syst. 2019, 74, 74–87. [Google Scholar]
- Zook, J.B. Spatial Schemata in Museum Floorplans. In Proceedings of the 11th International Space Syntax Symposium 2017, Lisbon, Portugal, 3–7 July 2017. [Google Scholar]
- Ali, L.A.; Mustafa, F.A. The state-of-the-art knowledge, techniques, and simulation programs for quantifying human visual comfort in mosque buildings: A systematic review. Ain Shams Eng. J. 2023, 14, 102128. [Google Scholar] [CrossRef]
- Ali, L.A.; Mustafa, F.A. Mosque Typo-Morphological Classification for Pattern Recognition Using Shape Grammar Theory and Graph-Based Techniques. Buildings 2023, 13, 741. [Google Scholar] [CrossRef]


| Techniques-Based Approach | Representation | |
|---|---|---|
| Penn et al., 1996 [49] | Dalton’s IsoCam (at Pangea), 1996, created a variety of “isovist cameras” (IsoCam) that could be installed in any 3D world as part of his project. The 3D IsoCam was one of these, and it generated a representation based on a set of radial lines originating from the point of creation, with the color of the line corresponding to its length. | Not reliable |
| Thiel, 1997 [50] | The hemispherical projection (HP representation) approximated human vision’s 180° horizontal and 135° vertical field of view. The view from one point is represented as a circle with the horizon line operating through its center and any occluding surface. It is called a space-established element position indicator or SEEPI. |  |
| Teller, 2003 [51] | This study created a hemispheric projection image and then used the calculation to generate “sky opening maps” that indicate the proportion of sky visible from a variety of locations. |  |
| Derix et al., 2008 [52] | The study began with the development of a polyhedral volume, a three-dimensional isovist volume containing all visible vertices. Frequently, polyhedral volumes are shown in the form of partially see-through or wireframe 3D solids. Polyhedral field data are a second class of representations; these data fill the scene with a 3D array of points, the size and color of which can be changed to represent attributes like an integration value or volumetric size. ‘Force and direction’ diagrams show the directionality as a field of floating arrows connecting the isovist’s generating point to its geometric centroid. |  |
| Morello, and Ratti, 2009 [47] | This study used DEMs (digital elevation models); they figured out a way to make isovists in three dimensions. The voxels that can be seen from a single vantage point are identified using line-of-sight analysis and displayed as a point cloud in three dimensions. The Isovistmatrix provides a method to generate a three-dimensional array of points, each of which is given a value that indicates its visibility from the ground level. |  |
| Bhatia, et al., 2012 [53] | Using an extension of traditional ray-casting methods from two dimensions to three, the 3D isovists are built. In this context, “ray casting” means “finding the first object that a ray intersects,” which is also sometimes called “ray testing.” In this method, the isovist rays extend the complete horizontal view orientation (360 degrees) and the full vertical view orientation (0 degrees to 180 degrees). Each viewpoint’s ray projection lengths are measured and added to create an isovist dataset. This projection is repeated at different eye-height increments while the viewpoint remains fixed in the horizontal plane. |  |
| Varoudis and Psarra, 2014 [54] | They demonstrated a three-dimensional version of Turner’s visibility graph analysis (VGA). Two observable values, “3D connectivity” and “3D visual integration,” resulted from filling the visible volume with an array of points and constructing a 3D visibility graph, in which edges connect any two independently visible points in a meta-graph representation. |  |
| Mosques Name & Description | Mosque Plan | Mosque Top View | |
|---|---|---|---|
| 1 | Al-Azhar Mosque–Egypt Type 1. E; hypostyle domed articulated courtyard pattern |  |  |
| 2 | Shah Mosque, Isfahan-Iran Type 2. C; four-Iwan mosque |  |  |
| 3 | The Great Mosque of Bursa-Turkey Type 3. A; no courtyard, duplicated mosque pattern |  |  |
| 4 | Sulaymaniyah Mosque–Turkey Type 4. B; courtyard supported by central dome pattern |  |  |
| 5 | Sheik Zayed Mosque–UAE Type 5. A; massive courtyard, triple dome |  |  |
| 6 | Zabeel Mosque, Dubai, UAE Type 6. B; no courtyard, domed square roof |  |  |
| Spatial Design Metrics | Isovist Metrics | Calculation Method | Simulation Program Used |
|---|---|---|---|
| Spatial Visibility Area | Isovist Area | Directly into Depthmap.10 | |
| Visual Connectivity | Connectivity | Directly into Depthmap.10 | |
| Spatial Complexity | Occlusivity | Directly into Depthmap.10 | |
| Visual Integration | Visual Integration (p-Value) | Directly into Depthmap.10 | |
| Spatial Control | Drift Magnitude | Directly into Depthmap.10 | |
| Spatial Openness Index | Spatial Openness Index | SOI = (Isovist Perimeter-Occlusivity)/Occlusivity | Equation added to Depthmap.10 |
| Spatial Enclosure | Isovist Circularity | Equation added in Depthmap.10 |
| Name of Mosque | Isovist Area | Connectivity | Occlusivity | |
|---|---|---|---|---|
| Visual Integration (p-Value) | Drift Magnitude | Spatial Openness Index | Isovist Circularity | |
| Type .1E | Al-Azhar Mosque, Egypt |  |  |  |
 |  |  |  | |
| Type 2. C | Shah Mosque, Isfahan, Iran |  |  |  |
 |  |  |  | |
| Type 3. A | The Great Mosque of Bursa, Turkey |  |  |  |
 |  |  |  | |
| Type 4-D | Süleymaniye Mosque |  |  |  |
 |  |  |  | |
| Type 5. A | Sheik Zayed Mosque, UAE |  |  |  |
 |  |  |  | |
| Type 6. B | Zabeel Mosque, UAE |  |  |  |
 |  |  |  |
| Mosques | IA | Con. | Oc | VI | DM | SOI | IC | P | |||||||
|---|---|---|---|---|---|---|---|---|---|---|---|---|---|---|---|
| M | SD | M | SD | M | SD | M | SD | M | SD | M | SD | M | SD | ||
| Type.1E | 1083.5 | 459.4 | 1073.8 | 462.9 | 1217.7 | 591.7 | 1.5 | 0.3 | 14.0 | 11.4 | 0.10 | 0.2 | 0.1 | 0.0 | p < 0.001 |
| Type.2C | 889.4 | 437.6 | 884.2 | 433.3 | 217.3 | 127.1 | 1.6 | 0.6 | 13.1 | 9.0 | 0.59 | 0.5 | 10.4 | 7.3 | |
| Type.3A | 1637.1 | 654.3 | 3341.4 | 1336.5 | 324.7 | 169.4 | 2.2 | 0.6 | 16.0 | 13.8 | 0.55 | 0.4 | 11.9 | 13.7 | |
| Type.4D | 1679.3 | 757.7 | 1695.6 | 771.7 | 475.5 | 481.0 | 2.8 | 1.4 | 19.1 | 12.2 | 0.49 | 0.5 | 22.5 | 95.1 | |
| Type.5A | 2762.3 | 1290.4 | 690.1 | 310.5 | 886.4 | 472.2 | 1.9 | 88.6 | 26.2 | 20.5 | 0.24 | 0.2 | 27.2 | 52.3 | |
| Type.6B | 1622.5 | 219.1 | 1620.1 | 2441.0 | 161.0 | 44.2 | 8.1 | 6.9 | 16.1 | 7.9 | 1.0 | 0.4 | 5.2 | 2.3 | |
| Mosque Name and Description | Mosque Plan with Selected Vantage Points | Visibility Volume in Standing Vantage Points | |
|---|---|---|---|
| Visual Controllability | Visibility Elongation in Standing Vantage Points | Visibility Mass in Central Vantage Point | |
| Type .1E | Al-Azhar Mosque, Egypt |  |  |
 |  |  | |
| Type 2. C | Shah Mosque, Isfahan, Iran |  |  |
 |  |  | |
| Type 3. A | The Great Mosque of Bursa, Turkey |  |  |
 |  |  | |
| Type 4-D | Süleymaniye Mosque, Istanbul, Turkey |  |  |
 |  |  | |
| Type 5. A | Sheik Zayed Mosque, UAE |  |  |
 |  |  | |
| Type 6. B | Zabeel Mosque, Erbil, Iraq |  |  |
 |  |  |
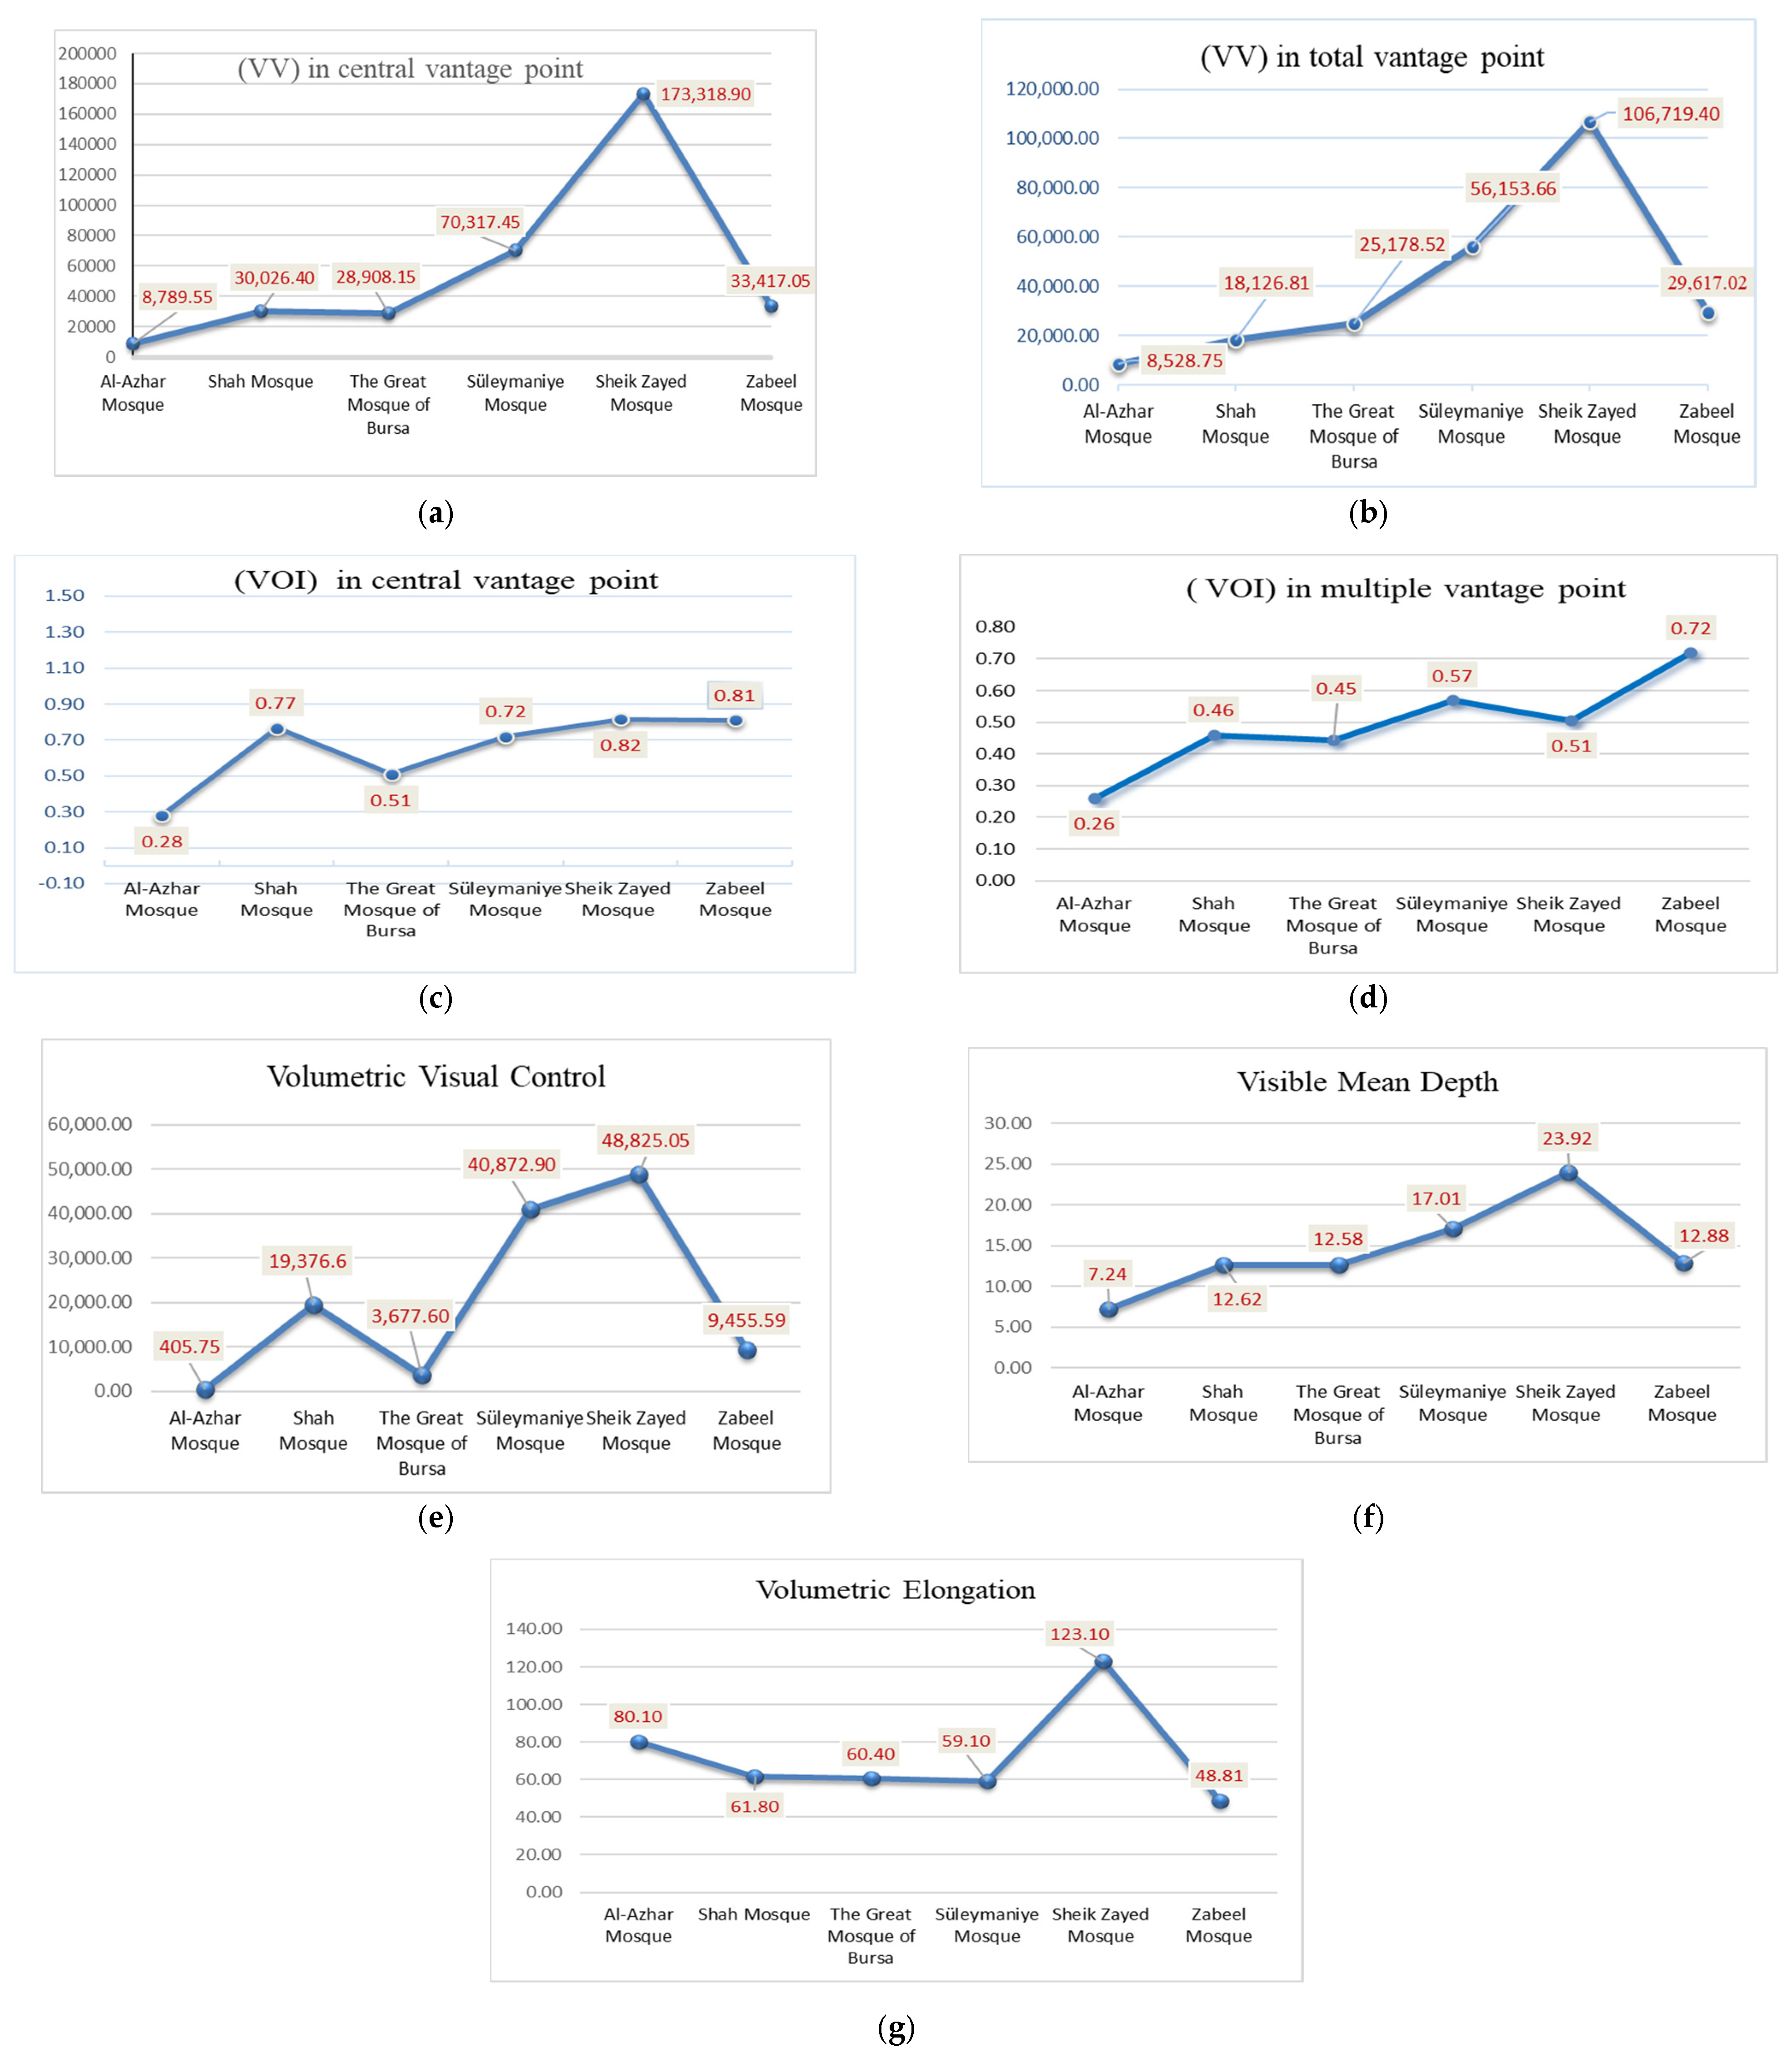
| Mosques | C.VV | T.VV | C.VOI | T.VOI | VMD | VVC | VE | P | |||||||
|---|---|---|---|---|---|---|---|---|---|---|---|---|---|---|---|
| M | SD | M | SD | M | SD | M | SD | M | SD | M | SD | M | SD | ||
| Type.1E | 8789.55 | 196.65 | 8528.75 | 56.21 | 0.28 | 0.00 | 0.26 | 0.01 | 7.24 | 0.35 | 405.75 | 0.21 | 80.10 | 0.00 | p < 0.001 |
| Type.2C | 30,026.40 | 207.32 | 18,126.81 | 198.34 | 0.77 | 0.01 | 0.46 | 0.00 | 12.62 | 0.30 | 19,376.6 | 448.2 | 61.80 | 0.00 | |
| Type.3A | 28,908.15 | 346.41 | 25,178.52 | 49.36 | 0.51 | 0.01 | 0.45 | 0.01 | 12.58 | 0.22 | 3677.60 | 53.74 | 60.40 | 0.00 | |
| Type.4D | 70,317.45 | 616.95 | 56,153.66 | 170.41 | 0.72 | 0.01 | 0.57 | 0.00 | 17.01 | 0.10 | 40,872.9 | 2652 | 59.10 | 0.28 | |
| Type.5A | 173,318.90 | 1075.51 | 106,719.40 | 364.58 | 0.82 | 0.01 | 0.51 | 0.01 | 23.92 | 0.16 | 57,825.0 | 778.4 | 123.1 | 0.28 | |
| Type.6B | 33,417.0468755 | 28.92 | 29,617.02 | 165.96 | 0.81 | 0.01 | 0.72 | 0.00 | 12.88 | 0.23 | 9455.5 | 42.71 | 48.81 | 0.00 | |
| Hight | N | Mean | Std. Deviation | p | |
|---|---|---|---|---|---|
| Central vantage point visible volume | 1 | 6 | 53,234.57 | 62,565.57 | p > 0.05 (n.s) * |
| 1.68 | 6 | 53,542.50 | 63,218.88 | ||
| Central vantage point visibility openness ratio | 1 | 6 | 0.65 | 0.21 | p > 0.05 (n.s) * |
| 1.68 | 6 | 0.65 | 0.22 | ||
| Total vantage point visible volume | 1 | 6 | 37,108.93 | 38,317.06 | p > 0.05 (n.s) * |
| 1.68 | 6 | 37,124.28 | 38,479.35 | ||
| Visibility openness ratio | 1 | 6 | 0.51 | 0.17 | p > 0.05 (n.s) * |
| 1.68 | 6 | 0.50 | 0.17 | ||
| Visual controllability volume | 1 | 6 | 20,745.02 | 23,404.99 | p > 0.05 (n.s) * |
| 1.68 | 6 | 21,294.97 | 23,682.21 | ||
| Visible mean depth | 1 | 6 | 13.44 | 6.09 | p > 0.05 (n.s) * |
| 1.68 | 6 | 13.76 | 6.21 | ||
| Volumetric elongation | 1 | 6 | 69.43 | 30.48 | p > 0.05 (n.s) * |
| 1.68 | 6 | 69.30 | 30.61 |
Disclaimer/Publisher’s Note: The statements, opinions and data contained in all publications are solely those of the individual author(s) and contributor(s) and not of MDPI and/or the editor(s). MDPI and/or the editor(s) disclaim responsibility for any injury to people or property resulting from any ideas, methods, instructions or products referred to in the content. |
© 2023 by the authors. Licensee MDPI, Basel, Switzerland. This article is an open access article distributed under the terms and conditions of the Creative Commons Attribution (CC BY) license (https://creativecommons.org/licenses/by/4.0/).
Share and Cite
Ali, L.A.; Mustafa, F.A. Mosque Morphological Analysis: The Impact of Indoor Spatial–Volumetric Visibility on Worshipers’ Visual Comfort. Sustainability 2023, 15, 10376. https://doi.org/10.3390/su151310376
Ali LA, Mustafa FA. Mosque Morphological Analysis: The Impact of Indoor Spatial–Volumetric Visibility on Worshipers’ Visual Comfort. Sustainability. 2023; 15(13):10376. https://doi.org/10.3390/su151310376
Chicago/Turabian StyleAli, Lana Abubakr, and Faris Ali Mustafa. 2023. "Mosque Morphological Analysis: The Impact of Indoor Spatial–Volumetric Visibility on Worshipers’ Visual Comfort" Sustainability 15, no. 13: 10376. https://doi.org/10.3390/su151310376