Article

Analysis of the Impact of Livelihood Capital on Livelihood Strategies of Leased-In Farmland Households: A Case Study of Jiangxi Province, China

1
School of Business Administration, Zhongnan University of Economics and Law, Wuhan 430073, China
2
School of Economics and Management, Jiangxi Agricultural University, Nanchang 330045, China
3
School of Land Resources and Environment, Jiangxi Agricultural University, Nanchang 330045, China
*
Author to whom correspondence should be addressed.
Sustainability 2023, 15(13), 10245; https://doi.org/10.3390/su151310245
Submission received: 25 May 2023 / Revised: 8 June 2023 / Accepted: 11 June 2023 / Published: 28 June 2023
(This article belongs to the Section Sustainable Agriculture)

Abstract

:
In the context of the implementation of the rural revitalization strategy, the industrialization of agriculture and rural areas is rapidly increasing, and more and more capable people in rural management are actively leasing land to develop modern agriculture, broaden diversified livelihood channels, and pursue sustainable development. We used leased-in farmland households as an entry point, focusing on the development of rural industries and the choice of livelihood strategies to fill a gap in the existing literature. Based on sustainable livelihood theory, we constructed a sustainable livelihood analysis framework for leased-in farmland households using the survey data of 283 leased-in farmland households in Yudu County. A livelihood capital indicator system was constructed, and the entropy value method and other measurement methods were used. Firstly, we analyzed and comprehensively evaluated the livelihood capital and livelihood strategies of leased-in farmland households in Yudu County, Jiangxi Province. We then used binary logistic regression models and polynomial logistic regression models to analyze the influence of the differentiation in leased-in farmland households’ livelihood capital on the choice of livelihood strategies and their transformation and conducted robustness tests on the relevant findings. Different types of livelihood capital have different effects on agriculture-led livelihood strategies. Natural capital and physical capital have significant positive effects on agriculture-led livelihood strategies, but financial capital, human capital, and social capital have negative effects. Natural capital has a significant negative effect on the pluriactivity strategy, while physical, human, and social capital have insignificant effects on it. For off-farm livelihood strategies, natural capital and financial capital have insignificant effects, physical capital has a significant negative effect, and human capital and social capital have a significant positive contribution.

1. Introduction

Along with the large scale industrialization and urbanization process in China, a large surplus of the agricultural population has migrated to cities and towns as well as off-farm sectors in an orderly manner, and thus rural land resources are in urgent need of further effective allocation to avoid idleness or even abandonment [1]. Although the rural household contract responsibility system has been effective in promoting the enthusiasm of rural households’ input and improving production efficiency between income growth under traditional smallholder management and the industrialization model, which has become increasingly prominent [2], the national No. 1 document of the central government has repeatedly mentioned the need to increase rural households’ property income for many years. Facing these difficulties, promoting farmland lease has become an effective way of improving the efficiency of farmland resource allocation, realizing the largescale operation of agricultural production, and then improving agricultural productivity and promoting rural households’ income growth [3]. The lease of farmland contract management rights is an important way of solving the “Three Rural Problems” and achieving the coordinated development of urban and rural areas. As current agricultural production methods and labor costs have increased significantly in China, leasing in farmland to achieve scale is an effective way of creating economic returns and developing modern agriculture. Therefore, there are a large number of households in China’s rural areas engaged in diversified livelihood activities to support their families while leasing in a large amount of unused land.
In the context of the implementation of the rural revitalization strategy, the industrialization of agriculture and rural areas is rapidly increasing, and more and more capable people in rural management are actively leasing in farmland to develop modern agriculture, broaden diversified livelihood channels, and pursue sustainable development. For a long time, farmland has been the material basis for the survival of rural farming families in China. Nowadays, there is a group of leased-in farmland households that are the backbone of rural agricultural production and rural revitalization. According to data published by the Policy and Reform Department of the Ministry of Agriculture and Rural Affairs in 2020, the area of arable leased farmland in China exceeded 555 million mu, which indicates that the actual number of management personnel in China’s rural areas has changed significantly, and the number of leased-in farmland households has gradually increased. China has also accelerated policy guidance and support policies according to the country’s current situation regarding the development and cultivation of farmland leased to households. Relevant policies have clearly pointed out that the cultivation of new agricultural business entities in rural areas should be accelerated under the background of rural households’ lease-in of land. China’s modernized agricultural development today cannot be separated from production units based on rural households and will remain in this state for a long time. Therefore, the issue of how to maintain the livelihood development and diversified livelihood strategies of farmland-leasing households deserves attention and has a certain practical significance.
International research on livelihood capital has mainly focused on rural poverty [4,5,6]. Considered by many international scholars as one of the main ways to increase farmers’ economic income, they have paid particular attention to the impact of livelihood capital on poverty alleviation. For example, it is widely believed that off-farm activities play a great role in breaking the vicious cycle of poverty. Ansoms and McKay (2010) [7] and Alemu (2012) [8] conducted similar studies in poverty alleviation, although they did not explicitly mention off-farm livelihood strategies. Their studies pointed out the important role of access to off-farm income activities for poor households. They argued that rural poverty can be alleviated using off-farm activities rather than local agricultural development. Similarly, Soltani et al. (2012) [9] argued that there is a positive correlation between off-farm income activities and poverty reduction. Van den Berg (2010) [10] provided a unique perspective on the relationship between natural disasters and household income. He pointed out the need for rurally situated poor households to engage in nonagricultural strategies.
Based on the systematic elaboration of related theories, this study expands the DFID sustainable livelihood analysis framework, constructs a sustainable livelihood analysis framework for leased-in farmland households, and studies the influence of rural households’ livelihood capital on the choice of livelihood strategies. We establish an econometric model to clarify the internal logic of livelihood capital influencing livelihood strategies, explore the internal law of the occurrence and development of farmland lease-in behavior, and try to reveal the economic phenomena and laws involved in the process of farmland lease-ins. Studying the internal mechanisms and external drivers of farmland lease-in behavior and livelihood decisions will help enrich the theoretical literature on farmland leasing and sustainable livelihoods.
Against a background of the increasing scale of farmland leases today, issues such as livelihood capital status and diversified livelihood strategies of leased-in farmland households are receiving increasing attention. In the context of the continuous lease of farmland to households, their labor employment allocation decisions and household resource allocation decisions change accordingly. It is crucial to actively promote the livelihood upgrading of farmland leased-in households and to maintain the diversification and sustainability of their livelihood strategies. Additionally, variations in livelihood capital arise among these households due to differences in the size of the leased land or labor allocation within the household. What is the impact of the change in livelihood capital on the choice of livelihood strategies after leasing to farmland? To address this question, this paper analyzed the livelihood strategy choices of farmland leased-in households and their transitions from the perspective of farmland livelihood capital based on the framework of sustainable livelihood analysis, revealed the relevant influence mechanism behind farmland lease-in households, and provided empirical analysis and a scientific basis for promoting the sustainable development of farmland leased-in households’ livelihood model and the integrated development of rural industrial upgrading, as well as the overall prosperity of rural revitalization.
Previously, many scholars mainly focused on the impact of multidimensional rural policies, such as relocation policies, risk management, and land improvement, on rural households. In the context of transformative rural economic development, policy changes and liberalized resource market allocation play crucial roles in ensuring the sustainable livelihoods of rural households. However, this study will feature a literature review on land leased-in and farmers’ livelihoods, clarify relevant concepts and generalize indicators of farmers’ livelihood capital, select the impact of farmers’ livelihood capital on livelihood strategies as an entry point, construct an econometric model, and analyze the underlying mechanism of livelihood strategy choice. Additionally, the research in this paper focuses on the following three aspects: First, the livelihood strategies are classified based on the characteristics and choices of rural Chinese households’ livelihood strategies using the household income structure measure. Second, a binary logistics model is employed to analyze the impact of livelihood capital on the livelihood strategies of households leasing from agricultural land. Last, a polynomial logistic model was utilized to assess the impact of livelihood capital on livelihood strategy transformation among land leased-in households.
The practical significance of this study is that this paper is a meticulous examination of farmland leased-in households in a specific region, namely Yudu County, Jiangxi Province, to clarify the new needs of and changes in farmland leases in the context of the separation of three rights to innovate the premise of the collective land ownership system, based on the family contract system, taking family farms and other farmland lease-in households as the core subjects. We will promote a new model of largescale agricultural development by enriching the forms of farmland lease and revitalizing farmland resources. This study may be influential in terms of the following respects: First, it provides guidance for rural households to engage in farmland leasing in a rational manner, thereby accelerating the process of farmland lease-in and raising the overall standard of farmland leasing practices. Second, through the scale of the operation of livelihood capital, it explores significant breakthroughs in transforming our country's agricultural management methods and offers innovative insights for future agricultural management. Additionally, this study contributes to the understanding of the dynamics and mechanisms surrounding farmland lease-in households, providing valuable insights for policymakers, researchers, and practitioners involved in rural development and agricultural revitalization.

2. Literature Review and Theoretical Framework

2.1. Literature Review

The international research on the livelihood capital of rural households has a long history and has been widely discussed in many aspects. The first is the connotation and definition of livelihood capital. As early as the research of Chambers and Conway in 1992, livelihood capital was considered the means for individuals or families to make a living, including the resources of individuals and families, activities, and access to these resources [11]. Subsequently, many scholars explained and expanded the connotation of livelihood capital on this basis [12,13]. With continuous expansion, livelihood capital gradually stabilized and formed a relatively stable definition, that is, “livelihood capital” represents five interconnected core types of capital, namely human, material, financial, social, and natural capital [14]. Such capital is widely regarded as a key indicator of people’s living conditions because capital is considered a stock that can be stored, accumulated, exchanged, and used as productive inputs to generate income [15,16]. In addition, livelihood capital can assess and measure people’s living standards and plays a fundamental role in shaping livelihood strategies and influencing livelihood choices [17].
Based on the extensive discussion on the connotation and definition of livelihood capital in the academic community, the UK Department for International Development (DFID) proposed the sustainable livelihood analysis framework (SLA) in 2000 which has been highly recognized and empirically used by the academic community [18]. The DFID believes that households can improve their livelihoods through capital accumulation or other poverty reduction measures, that organizational structures and structural processes influence household livelihood strategies, and that the way they build their capital mix can positively contribute to livelihood outputs and goals. To date, a considerable number of studies have used the sustainable livelihood framework (SLA) to analyze vulnerability contexts, policies, or strategies [19]. In terms of the application of livelihood capital, scholars in Mali [20], Peru [21], Nepal [22], Ethiopia [23], and other regions found that human capital promoted the adoption of livelihood strategies with a low dependence on the environment. However, few scholars have attempted to measure livelihood assets in specific locations [24,25].
Regarding research on livelihood strategies, Walker et al. [26] defined livelihood strategies as “a set of organized lifestyle choices, goals and values, and activities influenced by biophysical, political and legal, economic, social, cultural and psychological factors”. However, livelihood strategies will vary in different regions, between different houses in the same region, and over time [27,28]. Studies have shown that livelihood strategies affect the social, natural, and economic capacities of rural households and may expose them to external shocks, such as climate change, policy interventions, and economic downturns [29,30]. At the same time, the livelihood strategy will lead to an increase in off-farm activities and a decrease in agricultural labor [31,32].
The presence of abundant livelihood capital within households serves as the foundation for diversified livelihood strategies. The impact of livelihood capital on livelihood strategy will be examined across different dimensions of livelihood capital. First of all, natural capital in livelihood capital constitutes the primary basis for families to choose and change livelihood patterns, and access to land capital will hinder families from leaving agriculture [33]. Some scholars have found that the higher the natural capital, the larger the area of land leased-in [34]. Moreover, the livelihood of the rural poor in developing countries often depends on the exploitation of natural resources, exacerbating environmental degradation and perpetuating poverty cycles [35,36]. Climate change is also exerting multiple pressures on livelihoods and wellbeing [37].
Second, human capital is widely regarded as the foremost household livelihood capital in the transformation of household livelihood strategies, which enables individuals or households to adopt various livelihood strategies [38]. It mainly indicated the number of household labors as well as their quality, including skills, knowledge, work ability, health status, and so on. In the context of urbanization and industrialization, rural labor tends to travel to urban areas to improve the probability of getting a job. A number of studies have found that more educated households are more likely to participate in labor markets such as the higher paying business sector, and households engaged in agricultural activities, and other activities such as fishing and livestock livelihoods tend to have a larger number of household laborers, although many of these laborers possess limited or no formal education [39,40].
The household’s financial capital mainly reflects the cash needed to purchase subsistence and production and the loans available [41]. Financial capital is the basic subsistence capital that supports any livelihood activity of the household. Because it permits the development and accumulation of other assets, the type of housing is an important indicator of the household’s financial assets. It has been argued that households with dilapidated houses have less financial capital and therefore they allocate more labor to agricultural activities, and the allocation of labor to agriculture increases household agricultural activities [42]. Conversely, some scholars have concluded that the higher the financial capital, the higher the probability that the land will be transferred out. Furthermore, some scholars also have concluded that the higher the financial capital of farm households [34], the more they prefer a contracting livelihood strategy compared to an expanding livelihood strategy [43].
The household’s physical assets include the household’s productive and non-productive assets, such as equipment, basic infrastructure, and real estate. Household fixed assets, agricultural tools, and household durable goods belonging to rural households are the main indicators of measurement [44]. Moreover, in developing countries, the degree of livestock development is usually positively correlated with the rate of arable land use. This is because livestock are able to provide fertilizer for the land and the land is able to provide food for livestock [45]. Consequently, households possessing physical capital can derive economic benefits from livestock and invest in agricultural technology and farm equipment, thereby enhancing farm productivity. Physical capital (mainly livestock) is an important factor for survival in arid and semi-arid areas [46,47]. Unlike financial capital, scholarly research suggested that the higher the physical capital, the more rural households are likely to choose expanded livelihood strategies than adjusted ones [43].
A household’s social capital typically refers to the resources available to individuals and groups through membership in social networks [48]. Empirical studies have demonstrated that households with higher endowments of social assets have better access to stable paying jobs [49], and a more developed social network provides households with more off-farm opportunities; rich household social capital allows a richer diversity of household livelihood strategies that are not limited to agricultural dominance [50].
Some scholars discovered that the livelihood strategies of rural households in different types of villages had different effects on various types of livelihood capital. For mountain villages, human and financial capital had significant positive effects on livelihood strategies, while natural and social capital exerted significant negative effects on livelihood strategies. Physical capital had no significant effects on livelihood strategies, whereas for plain villages, human and physical capital had a significant positive impact on livelihood strategies, while natural capital had a significant negative impact on livelihood strategies and financial and social capital had no significant impact on livelihood strategies [51].
The definition of specific indicators for the five categories of livelihood capital in the available literature has some similarities, but there are also significant differences, mainly in the determination of indicators for physical capital and financial capital, while specific indicators for natural capital, human capital, and social capital are easier to find a basis for their definition. In terms of research methods, regression analysis, particularly logit models, is prevalent. Some scholars discuss and deal with endogeneity issues, such as the instrumental variable method in the model testing part. Most scholars focus on changes in livelihood capital and the livelihood strategy adjustment of land leased-out households, while fewer scholars take land leased-in households as the main research object to explore the rational differentiation of livelihood capital and the optimal choice of livelihood strategy. In-depth research in this area could help clarify the mechanism of livelihood capital on livelihood strategy and help guide rural households to rationally leased-in land for rational operation, promoting agricultural and rural development.
Currently, both domestic and international research methods on rural households’ livelihoods in the context of land lease are becoming increasingly sophisticated, and the research on the relationship between land lease and rural households’ livelihoods is gradually becoming a hot issue. The current research in this area focuses on four aspects: First, the impact of land lease on livelihood capital and livelihood strategies; second, the influence of rural households’ livelihood capital status or livelihood strategies on whether to participate in land lease; third, the trend of livelihood capital differentiation and the direction of livelihood strategy transformation; and last, the livelihood capital status of rural households involved in land lease and the influence of their livelihood strategy choice, focusing on the influence of livelihood capital on livelihood strategy. In the construction of the indicator system, livelihood capital is usually subdivided into five major categories. Some scholars also summarize psychological capital or ecological capital and group them into a sixth category of livelihood capital. This type of livelihood capital indicator innovation has some merits but lacks widespread recognition in the academic community.

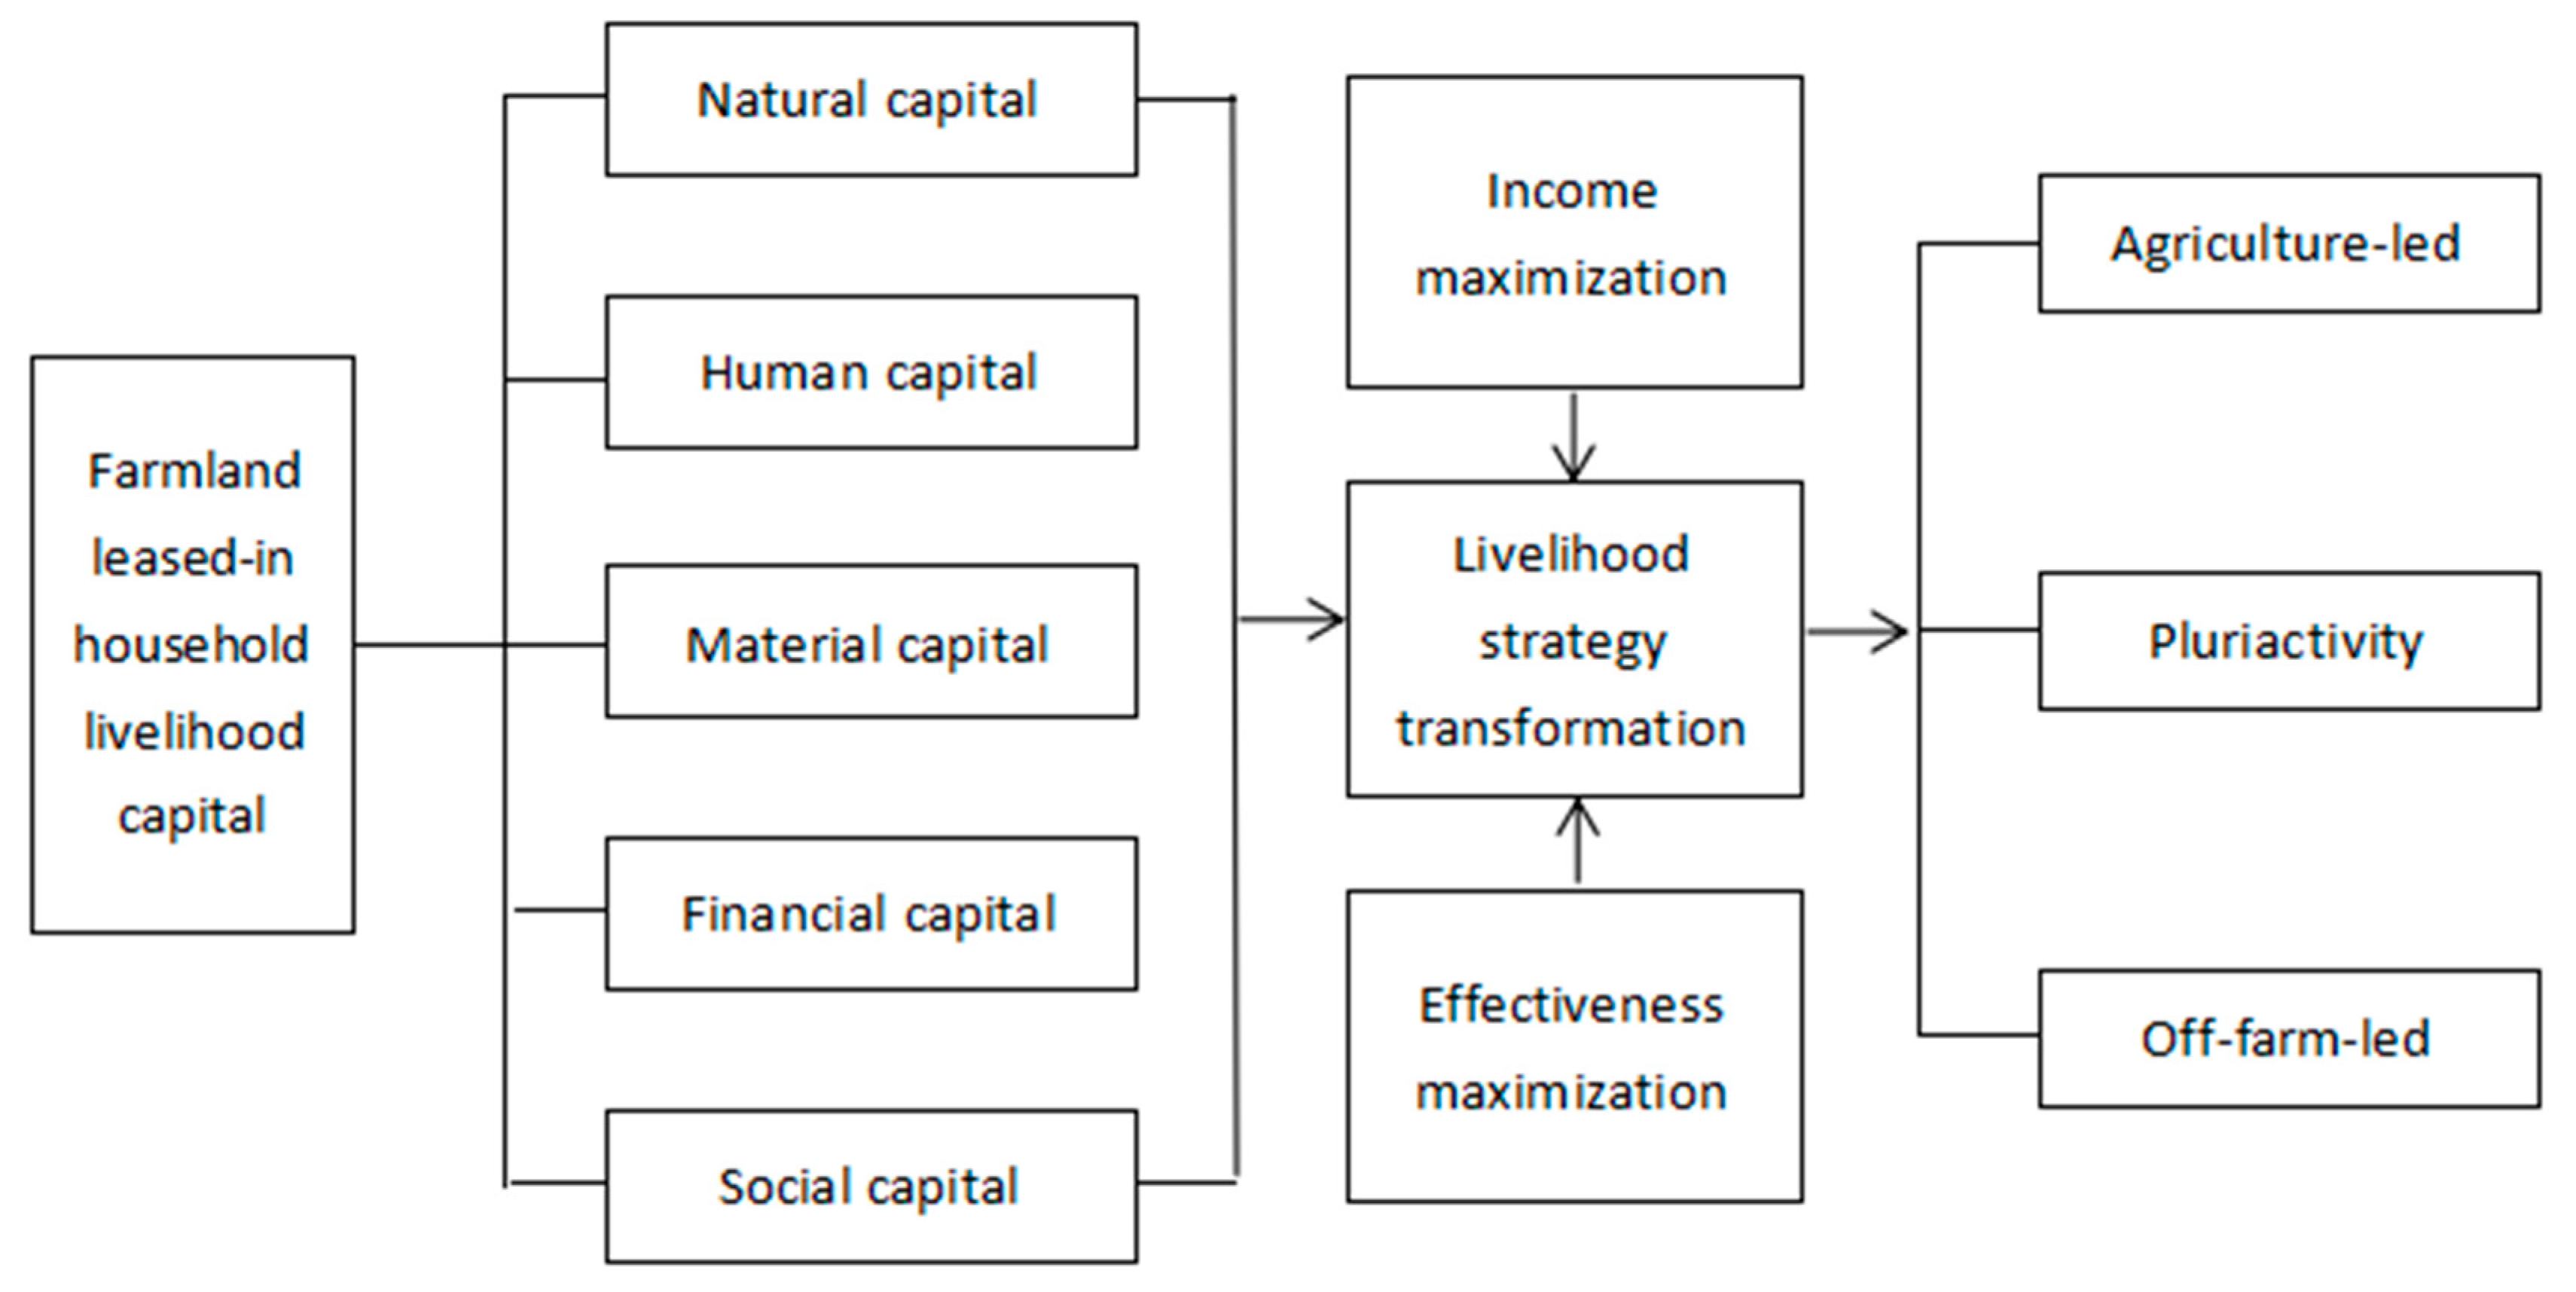
2.2. Theoretical Framework

The sustainable livelihoods analysis framework provided a theoretical basis and methods and ideas for analyzing the impact of farmland leased-in households’ livelihood capital on livelihood strategy choices and transitions. Based on the sustainable livelihood analysis framework of DFID [18], we analyzed the dynamic and interactive process of “environmental difference—livelihood capital difference—livelihood strategy difference”, and constructed the analysis framework of the impact of farmland leased-in households’ livelihood capital on livelihood strategy. In this analytical framework, the livelihood capital of farmland lease-in households is the core of the whole analytical framework, which is the basis for households to make livelihood strategy choices. As can be seen from the logical analysis in Figure 1, we provide a new way of thinking in analyzing the relationship between livelihood capital and livelihood strategies of farmland leased-in households.
This framework treats farmland leased-in households as surviving in a certain policy context, social environment, with varying contexts and circumstances, and some differences in the nature of livelihood capital and production status among rural households, leading to the choice of different livelihood strategies. The framework is divided into two parts as follows.
(1)
Environmental differences—livelihood capital differences
In the above mentioned analytical framework of the impact of farmland leased-in households’ livelihood capital on livelihood strategies, farmland leased-in households are treated as pursuing diverse livelihood strategies based on their own household livelihood capital in a certain environmental context. Farmland leased-in households with higher overall livelihood capital have richer options and a better ability to use their livelihood capital to secure household livelihoods and avoid livelihood vulnerability.
Differences in environment directly lead to differences in livelihood capital, which, on the one hand, can contribute to the growth of local rural households’ livelihood capital, but, on the other hand, can destroy the livelihood capital of rural households. For example, the process of building infrastructure, social institutions, and technical training by the local government is a process of creating local rural households’ physical, social, and human capital. However, natural disasters can diminish farmland, production equipment, and the health of household members, resulting in a reduction in natural, physical, and human capital. Furthermore, local policies and institutions can also influence the level of livelihood capital and choices made by farmland leased-in households. At the same time, local policies and institutions may also have a moderating effect on the current level of livelihood capital and choices of local farmland leased-in households. For example, current government policies on agricultural production incentives, farmland subsidies, and training in various production skills will regulate the structure and level of household livelihood capital of farmland leased-in households.
(2)
Differences in livelihood capital—differences in livelihood strategies
Drawing upon the theoretical foundation of the sustainable livelihood framework, we hypothesized that the livelihood strategy choices of farmland leased-in households and their shifts are influenced by the structure of their household livelihood capital as well as the external livelihood context. Based on the findings of existing studies, we found that the employment choice of individual household labor tends to obey the maximization of household utility, which means that the current rural households in China are allocating labor resources from the perspective of maximizing the effect of the whole rural household [52]. Therefore, the base unit and sample set in this study is the whole rural household [53]. In this context, the amount of rural households’ livelihood capital largely determines the scope of their livelihood strategy decisions. There are different effects of different types of livelihood capital on farm-led livelihood strategies. Due to the differences in farmland leasing farmers in terms of the land lease method, lease scale, and land quality, these will affect the choice of livelihood strategy to a certain extent [53].
The livelihood strategy choice of rural households is a crucial aspect in the study of the sustainable livelihoods of rural households, and the mechanisms and trends of changes in livelihood strategies are still worth further investigation today. The livelihood activities of farmland leased-in households depend largely on the availability and nature of livelihood capital, and they can diversify their livelihood strategies by mixing and combining different livelihood capital. For example, in remote villages, the farmland leased-in household livelihood strategy may be maintained mainly through the use of natural capital. If the scale of leasing is insufficient or soil fertility is limited, natural capital alone cannot sustain the sustainable livelihood of the whole household. Consequently, farmland leased-in households will consider the combination of other livelihood strategies, such as casual work or urban off-farm work. Considering the actual situation that the research area is located in the hilly region of southern China, the livelihood strategies of farmland leased-in households in this paper can be divided into “agriculture-led”, “part-time business”, and “off-farm-led”. The livelihood strategy of the rural households is to adjust with the change in the livelihood capital status of the rural households. Differences in the livelihood capital of rural households include differences in the quantity of livelihood capital and differences in its structure.
Guided by the SLA framework proposed by DFID, we focused on the effect of different types of livelihood capital on the impact of farm-led livelihood strategies. In addition, we explored the impact of the differentiation of farmland leased-in households’ livelihood capital on livelihood strategy choice and its transformation in order to better understand the correlation between livelihood capital and livelihood strategies. This information can inform the formulation of livelihood improvement policies for different types of farmland leased-in rural households.

3. Data and Methods

3.1. Data Source

The research was conducted in Yudu County, Jiangxi Province, which is a significant rice and vegetable growing area in the southern hilly region of Jiangxi Province. At present, the vegetable industry in Yudu County is a pillar industry of local agricultural development, with a relatively large share of vegetable sowing area, with a vegetable output of over 450,000 tons, and a total output value of nearly CNY 2 billion throughout the year. The place already has 5000 mu selenium-rich vegetable bases and a 10,000 mu vegetable industrial park. Meanwhile, the lease of agricultural land in Yudu County is frequent, and the agricultural industry led by vegetables has become an important support for the revitalization of the countryside and the enrichment of rural households in the area. The field study of farmland leased-in households in this area is representative and therefore an ideal research area to study the sustainable livelihood of farmland leased-in households.
Data were acquired between June 2021 and October 2021. This survey adopted the principle of stratified sampling. Six townships were randomly selected in Yudu County according to the distribution conditions of local natural resources and the level of social and economic development, and 3–7 sample villages were selected from each township. In each sample village, 5–18 agricultural land areas were transferred to households according to different village-level characteristics, and a total of 283 farmers were selected for questionnaire interviews. The research on the farmland leased-in households in the town generally focused on local relevant agricultural technology training in order to induce an aggregation effect on farmland lease-in households.
Yudu County is geographically located in the east of Ganzhou City, Jiangxi Province, with Ruijin City in the east, Anyuan County and Huichang County in the south, Ganxian District in Ganzhou City in the west, and Ningdu County and Xingguo County in the north. Yudu County has a total area of 2893 square kilometers, with a length of 83.25 km from north to south and a width of 63.33 km from east to west. There are 9 towns and 14 townships within the county’s jurisdiction.
According to the data of the seventh census, the resident population of Yudu County is 905,439 people. Regarding the industrial development of Yudu County, the added value of the primary industry in Yudu County has grown slowly with small ups and downs in the past decade. The added value of the secondary industry has grown more obviously and reached its peak in 2018, and the added value of the tertiary industry has also shown a growth trend. In addition, the gross regional product of Yudu County is also rising steadily and has increased more in recent years, and economic development has a certain vitality.
Regarding the income situation of residents in Yudu County, the per capita disposable income of urban residents and the disposable income of rural residents in Yudu County both show a steady upward trend, with the per capita disposable income of urban residents increasing more, from CNY 18,357.08 in 2013 to CNY 31,372.5 in 2019, which is almost twice the increase in the per capita disposable income of rural residents. There is still a certain income gap between urban and rural residents. The details of the questionnaire are shown in Appendix B.

3.2. Variables Selection and Definition

3.2.1. Indicators for Livelihood Capital Measurement

Table 1 shows the definitions of indicators in independent variable livelihood capital and the basis for the source of the indicators in this study. The natural capital indicators are measured by six refined indicators: the area of owned land, the area of leased land, whether a written contract for lease is signed, the number of years the land is leased-in operation, whether the land is concentrated and contiguous, and the self-assessment of soil fertility. Physical capital mainly consists of five indicators: the total value of production equipment, the total value of living equipment, the total area of houses, whether broadband is installed, and the value of livestock and livestock breeding stock of rural households. Financial capital mainly consists of the existence of deposits in banks, the availability of loans from relatives and friends, the total amount of loans obtained from banks and other financial institutions, and the ease of obtaining loans from banks. Labor capital is composed of seven indicators, including the number of household laborers, the proportion of household laborers, the education level of household laborers, the health status of household members, whether the main household laborer has received employment or entrepreneurship training, whether the main household laborer has mastered a certain off-farm skill and whether the main household laborer has mastered a certain agricultural skill. Last, the social capital of households transferred from farmland is measured by the number of urban relatives, the number of village or township cadres or other public officials among the relatives, the number of households that can seek help for off-farm work, the number of helpers in the household if a red or white event is held, the cost of communication for the household head, whether the household participates in organizations such as plantation associations, and the number of village affairs meetings attended. The main reference for these indicators of livelihood capital is based on the studies of the corresponding scholars in Table 1. With reference to previous studies [54,55] and in order to control for the possible influence of other variables on livelihood strategies, we chose the willingness to engage in long-term agricultural production in the future and distance from the house of the household to the town center as the control variables in the research.
Table 1. Livelihood capital indicators and their sources.
Livelihood CapitalIndicator MeasurementsBasis for Indicator Literature Sources
Natural capitalOwned land area (mu)Deininger et al. (2014) [56]
Area of land leased-in (mu)Rogers et al. (2021) [57]
Whether a written lease contract is signed (1 = yes; 0 = no)Gao et al. (2018) [58]
Years of land lease (years)Xu et al. (2018) [59]
Whether the land operated is concentrated and contiguous (1 = yes; 0 = no)Hu et al. (2021) [60]
Soil fertility self-assessment
(1 = very unfertile; 5 = very fertile)
Zhang et al. (2014) [61]
Physical capitalProduction equipment value (CNY ten thousand)Xiao et al. (2022) [3]
Living equipment value (CNY ten thousand)Xiao et al. (2022) [3]
Total area of the house (m2)Yang et al. (2021) [62]
Whether broadband is installed (1 = yes; 0 = no)You et al. (2019) [63]
Livestock stock value of farm livestock breeding (CNY ten thousand)Xiao et al. (2022) [3]
Financial CapitalAvailability of deposits in banks (1 = Yes; 0 = No)You et al. (2019) [63]
Availability of loans from friends and relatives
(very difficult to access = 1; difficult to access = 2; to a fair extent = 3; easier to access = 4; very easy to access = 5)
You et al. (2019) [63]
Total amount of loans ever obtained from banks and other financial institutions (CNY ten thousand)Xiao et al. (2022) [3]
Ease of obtaining loans from banks
(Very difficult = 1; difficult = 2; fair = 3.
Easier = 4; Very easy = 5)
You et al. (2019) [63]
Human capitalNumber of household labor (person)Xiao et al. (2022) [3]
Household labor share (%)Yang et al. (2021) [62]
Average education of household labor (years)Xiao et al. (2022) [3]
Health status of the family members
(1 = very unhealthy; 5 = very healthy)
Xiao et al. (2022) [3]
Whether the main household labor has received employment or entrepreneurship training
(1 = yes; 2 = no)
Martinho (2020) [64]
Whether the main household laborer has a certain non-farm skill
(1 = yes; 2 = no)
Shui et al. (2022) [65]
Whether the main household laborer has a certain farm kill
(1 = yes; 2 = no)
Stallman and James (2015) [66]
Social capitalNumber of urban relative households (household)
Number of village or township officials or other public officials among relatives (people)Zhang and Han (2018) [67]
Number of households available for non-farm work (household)Schulz et al. (2018) [68]
How many people come to help if the family has a wedding and funeral (people)Wang et al. (2021) [69]
Head of household communication costs (CNY)Haglund et al. (2011) [70]
Whether to participate in planting associations, cooperatives, and other organizations
(1 = yes; 0 = no)
Singh et al. (2013) [71]
Number of village meetings attended (times)Liu et al. (2021) [72]
Control variableWillingness to engage in long-term agricultural production in the future
(1 = very reluctant, 5 = very willing)
Turner et al. (2021) [54]
Distance from the house of the household to the town center (kilometers)Li et al. (2020) [55]

3.2.2. Livelihood Capital Indicator Weights and Measurement Methods

The steps in this paper regarding the calculation of the entropy method in the livelihood capital of land lease households are mainly based on the study by [73], and the specific steps and operations of the calculation are shown below.
(1) Indicator setting. Given ϕ rural households, t years, and n indicators, X ϕ t n is the n th indicator value in the t th year of rural household ϕ .
(2) Standardization of indicators. In order to eliminate the influence of different indicators, this study uses the extreme value method to standardize the data of each indicator, converting the data values to between 0 and 1. In this study, all indicators were standardized as positive indicators.
Standardization of positive indicators:
X θ i j = X θ i j X min X max X min
Standardization of negative indicators:
X θ i j = X max X θ i j X max X min
(3) Coordinate translation. Based on the actual results calculated from standardized data, this study shifted by 0.0001 units.
X θ i j = X θ i j + 0.0001 .
(4) Determine the proportion of indicators, that is, the normalization treatment.
P θ i j = X θ i j θ X θ i j
(5) Entropy calculation. The entropy value of the index is calculated; the smaller the entropy value is, the greater the information utility value of the index is, and the more important the index is. The calculation formula is as follows:
e j = k θ i θ i j ln ( p θ i j )
k = 1 ln ( t φ )
In the above equation, k > 0, ej is between 0 and 1, k is related to the number of rural households, and t is the number of years.
(6) Calculate the difference coefficient of the index.
G j = 1 e j
(7) Calculate the weight of each index. The results of the calculated weights for the criteria present in the manuscript are shown in Appendix A.
w j = G j j G j
(8) Calculate the comprehensive score.
H θ i = j ( w j X θ i j )

3.2.3. Division of Rural Households’ Livelihood Strategies

The definitions of the livelihood strategies of the rural households involved in the leased-in farmland are shown in Table 2. The criteria for classifying the livelihood strategies of rural households are based on the studies of Li, J. (2016) [74]. The main classification step is to classify the livelihood strategies of leased-in farmland rural households according to the proportion of agricultural income in the rural household income structure. If the share of agricultural income is less than 0.5 and more than or equal to 0.25, the rural household is classified as “pluriactivity”; if the share of agricultural income is less than 0.25, the rural household is classified as “off-farm-led”. After dividing the rural households according to the above classification steps, the smallest number of “agriculture-led” rural households in the sample was 77,121 “pluriactivity” households and 85 “off-farm-led” rural households. The criteria for classifying the livelihood strategies of rural households’ farmland leased-in are shown in Table 2.

3.3. Model Methods

In this study, the types of livelihood strategies of farmland leased-in households are set as dependent variables (Y), that is, “agriculture-led”, “part-time” and “off-farm-led”. The livelihood capital of the leased-in households is set as the independent variable (X), which is the natural capital, physical capital, financial capital, human capital, and social capital of the leased-in households, respectively. The control variables include the willingness to engage in long-term agricultural production in the future and the distance of the household’s house to the town center.

3.3.1. Construction a Binary Logistic Regression Model

Firstly, a binary logistic regression model was used to analyze the factors influencing the choice of different livelihood strategies of farmland leased-in households in Nadu County. Therefore, there were three types of dependent variables (Y): agriculture-led, part-time, and off-farm-led. For example, when analyzing the factors influencing the choice of agricultural-led livelihood strategies, the agricultural-led livelihood strategy is assigned a value of 1 and the part-time and off-farm-led livelihood strategies are assigned a value of 0. By analogy, a binary logistic regression model is constructed for the part-time and off-farm-led livelihood strategies. A binary logistic regression model for part-time and off-farm-led livelihood strategies was constructed using the following equations.
ln P y 1 / 1 P y 1 = b 10 + b 11 X 1 + + b 1 m X i
ln P y 2 / 1 P y 2 = b 20 + b 21 X 1 + + b 2 m X i
ln P y 3 / 1 P y 3 = b 30 + b 31 X 1 + + b 3 m X i
where Xi is the explanatory variable, that is, the five types of livelihood capital, b10b1m, b20b2m, b30b3m, and others are proxy estimation coefficients for the explanatory variables.

3.3.2. Construction a Multinomial Logistic Regression Model

In this sub-section, in order to reveal the factors influencing the transformation of farmland leased-in households’ livelihood strategies from off-farm-dominated to farm-dominated and part-time farmers, this study assigns a value of 1, 2, and 3 to off-farm-dominated, farm-dominated, and pluriactivity strategies, respectively, and uses off-farm-dominated livelihood strategies as a reference to analyze the factors influencing the transformation of off-farm-dominated livelihood strategies to farm-dominated and pluriactivity strategies and the extent of their influence. The specific formulae are as follows.
ln P y 2 / P y 1 = b 210 + b 211 X 1 + + b 21 m X i
ln P y 3 / P y 1 = b 310 + b 311 X 1 + + b 31 m X i
where Xi is the explanatory variable, that is, the five types of livelihood capital, and b210b21m, b310b31m, and others are the coefficients of proxy estimates of the explanatory variables.

4. Empirical Results

Before presenting the empirical results, a description of the summary statistics is in order.

4.1. Descriptive Statistics

A descriptive analysis of the sample in this study is shown in Table 3. Among the farmland leased-in household research sample, the majority of household heads were male, with an average age of about 53 years old, an average education level of elementary school graduation, and twice as many household heads with a particular agricultural skill as with a particular non-agricultural skill. Regarding household characteristics, the mean value of household size was 5.586 persons, the mean value of household rice cultivation experience was 27.515 years, the mean value of cash crop cultivation experience was 9.614 years, the mean value of household agricultural net production and business income was CNY 38,039.110, the mean value of wage income was CNY 44,245.460, and the mean value of off-farm net production and business income was CNY 12,107.520. In terms of farmland lease-in, the average size of farmland lease-in is 84.267 mu, and the unit price of farmland leased-in is USD 322.551 per year. Regarding village characteristics, the average value of proportion of village laborers working outside the village was 65.9%, and the village per capita income was CNY 14,504.320.

4.2. Estimated Results

The literature review and previous analysis have indicated that different types of livelihood capital have different effects on the choice of livelihood strategies, but more data are still needed to verify the effects for farmland leased-in households, and the direction and extent of the effects need to be further explored. Therefore, based on a binary logistic regression model, this paper empirically analyzed the influence of farmland leased-in households’ livelihood capital on livelihood strategies and analyzed the influencing factors of different livelihood strategies in detail using multiple regressions. The results are shown in Table 4, Table 5 and Table 6. The results in Table 4 indicated the effect of livelihood capital on agriculture-dominated livelihood strategies, the results in Table 5 indicated the effect of livelihood capital on pluriactivity strategies, and the results in Table 6 indicated the effect of livelihood capital on off-farm-dominated livelihood strategies. Among them, models 1–5, models 7–11, and models 13–17 are the estimation results of each type of livelihood capital put into the model individually in turn, while models 6, 12, and 18 are the estimation results of all independent variables after substitution as the main analysis. In the specific analysis, because the values of each type of livelihood capital have been measured and processed by the entropy method, the meanings represented by them have changed compared with the original data, resulting in the comparability of the absolute magnitude of the coefficients of each influence factor in the model estimation results is weak, and it is not suitable to further transform the coefficients into the odds ratio for interpretation, so the impact effect analysis mainly focuses on the influence reflected by the direction of the coefficient.

4.2.1. Impact of Livelihood Capital on Agriculture-Led Livelihood Strategies

As shown in model 6 of Table 4, different effects of different livelihood capital on agriculture-led livelihood strategies exist. Among the core independent variables, the coefficients of natural capital and physical capital on agriculture-led livelihood strategies are positive with coefficients of 3.565 and 4.709, respectively, which have a significant positive effect, indicating that for farmland leased-in households, the higher the natural capital and physical capital, the more likely they are to choose agriculture-led livelihood strategies. This coincides with the reality that the possession of natural and physical capital is highly correlated with agricultural production activities. Higher natural capital means more owned and leased land area, better quality, and better land management conditions, which promote farmland leased-in households to choose agriculture-led livelihood strategies, that is, to earn income mainly by engaging in agricultural production activities; meanwhile, rural households with higher physical capital have more livestock. At the same time, farmers with higher physical capital have more livestock, production or living equipment, especially production equipment, and thus are more inclined to choose the agriculture-led livelihood strategy and have a higher share of total income from agriculture.
The coefficients of the effects of financial capital, human capital, and social capital are negative and significant at the 5% or 1% level, indicating that they hurt the choice of agriculture-led livelihood strategies. Possible reasons are that the higher the financial capital of rural households, the stronger the availability of loans or borrowing, and the more they can provide a solid basis for choosing other livelihood strategies, not only limited to engaging in agricultural production activities. The higher the human capital, the higher the education level of the main household labor, and usually they will move to off-farm sectors according to the human capital status they possess, and even as farmland leased-in households, their share of agricultural income may not be high. The more social capital represents the more developed social network relations of rural households, the more they can obtain development opportunities from external conditions, leading to the diversification and off-farming of livelihood strategies, and inhibiting the choice of agriculture-led livelihood strategies. It is worth noting that rural households with higher financial, human, and social capital do not necessarily have lower farm incomes but have lower shares of total income from agriculture and are less likely to choose an agriculture-led livelihood strategy.
Regarding the control variables, the effect of distance to the town center on agricultural dominant livelihood strategies was not significant, which was related to the improvement in rural transportation conditions in the context of rural revitalization, and agricultural production activities were not dependent on accessibility. A significant positive effect of willingness to engage in long-term agricultural production is consistent with the expectation that the stronger the willingness to engage in long-term agricultural production, the greater the general tendency to increase agricultural production and business inputs as well as to rely on the primary sector as the main source of household income, and the greater the potential likelihood of choosing an agriculture-led livelihood strategy.

4.2.2. Impact of Livelihood Capital on Pluriactivity Strategies

The effect of livelihood capital on the pluriactivity strategy is shown in Table 5. In model 12, the coefficient of the effect of natural capital is −2.882 and is significant at a 1% statistical level, indicating that natural capital has a significant negative effect and the higher the natural capital, the lower the likelihood of choosing pluriactivity strategy. This finding aligns with a previous analysis regarding agriculture-led livelihood strategies. It is understandable that an increase in natural capital inhibits the likelihood of choosing pluriactivity strategies. For farmland leased-in households with abundant natural capital, concentrating household resources to develop agricultural production can help form scale and specialization, but if they blindly choose to operate part-time, it may lead to too much diversion of farmers’ energy, which is counterproductive and wastes the comparative advantage of abundant natural capital to maximize benefits, so farmland leased-in households with high natural capital holdings are less likely to choose pluriactivity strategies.
The coefficient of the effect of financial capital is 1.919, indicating a positive effect on the choice of pluriactivity strategy, and the coefficient is significant at the 1% level. The higher the financial capital, the stronger the household economic strength is usually, the larger the amount of credit that can be obtained, and the stronger the ability to expand the scale of production and operation and resist risks, which is conducive to the diversification of rural households, and the tendency to increase multi-channel with the effective support of economic and financial strength. The increase in financial capital will therefore increase the likelihood of land lease-in households to choose pluriactivity strategies. It also inspires us that we should accelerate the construction and improvement of a modernized financial system in rural areas, which can help promote the diversification of farmers’ part-businesses.
The effects of physical capital, human capital, and social capital were not significant, indicating that the effects of changes in the status of these three types of livelihood capital would not be decisive for pluriactivity strategies. The reason for the insignificant effect of these three types of livelihood capital may be that the pluriactivity strategy is between the agriculture-dominated and off-farm-dominated types, and the livelihood capital status of this part of the farming households is more complex, and the real situation of the share of internal agricultural income varies to some extent. Farmers with more physical, human, and social capital may not be inclined to choose the pluriactivity strategy but not so much as to form a resistance, and there is no obvious preference or orientation, making the effect of physical, human, and social capital insignificant. The effect of the three influences needs to be further studied and can be achieved by expanding the sample size or by further subdividing the pluriactivity strategies.
The effect of willingness to engage in agricultural production among the control variables was not significant, while the effect of distance of the household to the town center on the pluriactivity strategy was significantly positive, and farmers who were farther away from the town center tended to choose the part-time development model. As the distance to the town center increases, the livelihood options of farming households are more variable, and the possibility of choosing a pluriactivity strategy increases with a certain degree of reasonableness, and part-time business can, to a certain extent, increase the ability of land leased-in households to resist risks and better cope with changes in the natural environment or market conditions, and this mentality is more obvious among farming households far from the town center; although the impact coefficient is small, this phenomenon cannot be ignored.

4.2.3. Impact of Livelihood Capital on Off-Farm-Led Livelihood Strategies

For the off-farm-dominated livelihood strategy, the effect of livelihood capital is shown in Table 6. Model 18 shows that the effect of natural capital and financial capital is not significant; the reason for the insignificant effect of natural capital may be that there exists a part of rural households with low natural capital ownership themselves who choose the off-farm-dominated livelihood strategy, but there also exists a part of land leased-in households with higher-than-average natural capital ownership, such as the livelihood strategy, which is because the absolute value and proportion of agricultural income are still far from adequate compared with non-agricultural income, and this part of farming households actively or forcibly choose non-agricultural livelihood strategies. For farmers willing to engage in agricultural production and operation, they have to expand their off-farm income sources to meet the needs of their families. Thus, how to improve agricultural income is still a critical issue for agricultural and rural development in the long run. The reason for the insignificant effect of financial capital may be that the current rural financial system is still not sound enough to effectively play the role of financial capital in promoting off-farm production and operation, so the effect of financial capital among the influencing factors for choosing off-farm-led livelihood strategies is insignificant.
The impact coefficient of physical capital is −5.815, and the absolute value of the coefficient is large and significant at the 1% statistical level, indicating that physical capital has a significant negative impact. This is because the ownership of farm machinery and equipment accounts for a large proportion of the physical capital measures. Land leased-in households with more farm machinery and equipment are richer in physical capital and less likely to choose off-farm-dominated livelihood strategies. The reason for this is that the ownership of farm machinery and equipment has a large weight in the measure of physical capital.
The coefficient of the influence of human capital is 3.097, and the coefficient of the influence of social capital is 4.255, both significant at the 1% level, indicating a significant positive contribution of human capital and social capital. The core independent variables of human capital and social capital have a positive influence on the choice of off-farm-dominated livelihood strategies, which is consistent with the findings of the previous literature, and the mechanism of influence is relatively easy to understand. Off-farm production and operation are closely related to the possession of human capital and social capital. The richer the human capital, the more opportunities for household members to transition to other sectors outside the agricultural field. The richer social capital represents stronger access to external information, more developed family social network relationships, not limited to engaging in agricultural production activities, and livelihood strategies toward off-farming. Farmers with higher human and social capital have a relatively smaller share of farm income in their household income structure and are more likely or more inclined to choose off-farm-led livelihood strategies. In addition, the absolute values of the impact coefficients of both human capital and social capital are not low, and the coefficient of social capital is slightly higher, which indicates that for off-farm production and operation, the accumulation of both human capital and social capital is important, and the role of social capital, in particular, should be given extra attention.
Among the control variables, the farther from the town center, the less favorable the choice of the off-farm-dominated livelihood strategy; obviously, the closer to the town center, the better the conditions for off-farm production and operation, while the farther from the town center, the relatively lower the possibility of engaging in off-farm production and operation. The effect of willingness to engage in long-term agricultural production is significantly negative, which is in line with the real situation and expected estimation, and laterally reflects the model construction and estimation results. The effect of long-term engagement in agricultural production is significantly negative, which is consistent with the realistic situation and the expected estimation.

4.3. Robustness Test

The robustness test in this paper was conducted by the substitution model method to validate the conclusions drawn from the relevant empirical part, and the specific model is divided into the following two main ideas for testing. The first is to test the previous empirical results using binary logit robust regression based on the baseline regression binary logit model. Table 7 shows the robust regression table of the binary logit model of livelihood capital on the choice of livelihood strategy. As shown in model 20, model 20 is a binary logit model robust regression of livelihood capital on agriculture-led livelihood strategies. Among the core independent variables, natural capital and physical capital have a positive coefficient with a significant positive effect on agriculture-led livelihood strategies. The coefficients of the effects of financial capital, human capital, and social capital are negative and significant at the 5% or 1% level. Among the control variables, distance to the town center did not significantly affect agricultural dominant livelihood strategies. The results show that the significance levels of the regression coefficients do not change for either the main core independent variables or the control variables, and tend to be consistent with the baseline regression results, indicating good robustness, confirming once again that natural capital and physical capital have a significant positive effect on the choice of agriculture-led livelihood strategies in the livelihood capital differentiation; financial capital, human capital, and social capital have a significant negative effect on the choice of agriculture-led livelihood strategies. The negative impact of financial capital, human capital, and social capital on the choice of farm-led livelihood strategies is significant.
Model 21 and model 22 present the results of robustness tests of livelihood capital to pluriactivity strategies and off-farm-led livelihood strategies, respectively. Natural capital has a significant negative effect on model 21, and financial capital has a positive effect on the choice of pluriactivity strategy; the effects of physical, human, and social capital are not significant. The effect of willingness to engage in agricultural production among the control variables was not significant, while the effect of distance from the household to the town center on pluriactivity strategies was significantly positive. The effects of natural and financial capital on off-farm-dominated livelihood strategies in model 22 are not significant. Physical capital has a significant negative effect; human capital and social capital have a significant positive contribution. The significance levels of the regression coefficients did not change and converged with the baseline regression results, indicating good robustness.
Table 8 reveals the robust regression table of the multivariate unordered logit model of livelihood capital on livelihood strategy choice. Model 20 is a robust multivariate unordered logit model regression of livelihood capital on livelihood strategy switching. With the off-farm-dominated livelihood strategy as the reference case, the regressions for the shift to agricultural domination have a significantly positive effect on natural and physical capital, a significantly negative effect on human and social capital, and a non-significant effect on financial capital. The regressions for the shift to part-time hurt natural capital, a significantly positive effect on physical capital, a non-significant effect on financial capital, and significantly negative coefficients for human capital and social capital, and an increase in the distance from the rural household to the town center promotes the shift from off-farm dominant livelihood strategies to part-time. The significance levels of the regression coefficients did not change and converged with the baseline regression results, indicating good robustness.
Table 9 shows the regression table of the binary probit model of livelihood capital on the choice of livelihood strategy. Model 24 shows the results of the binary probit model regression of livelihood capital on agriculture-dominated livelihood strategies. Among them, natural capital and physical capital have a significantly positive effect on the choice of agriculture-led livelihood strategies. Financial capital, human capital, and social capital have significantly negative effects. Among the control variables, distance to the town center did not significantly affect agricultural dominant livelihood strategies. The results show that the significance levels of the regression coefficients do not change for either the main core independent variables or the control variables and they tend to be consistent with the baseline regression results, indicating good robustness.
Models 25 and 26 show the results of robustness tests of binary probit models of livelihood capital on the choice of part-time and off-farm-dominated livelihood strategies, respectively. Natural capital has a significant negative effect, while financial capital has a positive effect on model 25; the effects of physical, human, and social capital are not significant. The effects of natural and financial capital on off-farm-dominated livelihood strategies in model 26 are not significant. Physical capital has a significant negative effect; human capital and social capital have a significant positive contribution. The significance levels of the regression coefficients did not change and remained consistent with the baseline regression results, indicating the stability of the regression conclusions.

5. Discussion

We have conducted a sustainable livelihood analysis framework that can be applied to households involved in farmland lease and investigated how rural households’ livelihood capital influences their choice of livelihood strategies. Using field survey data, an econometric analysis model is developed to clarify the underlying logic of the impact of livelihood capital on livelihood strategies and to explore the underlying patterns of farmland lease behavior. The aim of this study is to reveal the economic phenomena and patterns that emerge during the process of rural land lease.
We have reviewed the literature on land lease and rural households’ livelihoods, clarified related concepts, and summarized the indicators of rural households’ livelihood capital. We selected the impact of livelihood capital on livelihood strategies as an entry point, constructed an econometric model, and analyzed the underlying mechanisms of livelihood strategy choice. Land lease is typically divided into two aspects: land leased-in and land leased-out. The main objective of this study was to serve the theme of the dissertation, which is to explore how to promote agricultural scale management and rural industrial development and to encourage “new farmers” towards leased-in the land for modern farming operations. Focusing on one aspect of land lease helps ensure overall logic and control and avoids excessive research content that cannot be effectively elaborated. Furthermore, using land lease as the entry point focuses on the development of rural industries and the choice of livelihood strategies, while the previous literature tended to analyze the transformation of rural households’ livelihoods after losing their land and focused on social security and manpower development. Few studies used land lease as the main entry point, which helps ensure academic quality while enhancing the innovation of this study, which can be a potential innovation point. Using the framework of sustainable livelihood analysis for rural households, we applied it to the field situation in Yudu County, Jiangxi Province. The empirical analysis results are used to provide relevant policy implications for the sustainable development of farmland lease households.
The contributions of this study are mainly in the following three aspects. First, in terms of the research perspective, unlike the research of Yang, A et al. (2022) [75], who studied the effects of farmland lease on rural households’ livelihood capital and livelihood strategies and who found that rural households’ livelihood capital was spatially heterogeneous and affected rural households’ choice of livelihood strategies after farmland lease, our conclusions coincide with the findings of the previous studies, but we cut from the perspective of farmland lease-in and divide rural households’ livelihood strategies into “Agricultural-led”, “Pluriactivity”, and “Off-farm-led”. This classification takes into account the fact that the study area is located in the southern hilly region, and the livelihood strategies of farmers are adjusted according to the changes in their livelihood capital. We focused on the impact of capital, land tenant, and livelihood capital on the transformation of livelihood strategies and contribution to largescale farming operations and rural industrial development. The conclusions from the study encourage “new farmers” to lease land for modern agriculture and livestock operations and provide policy implications for the sustainable development of land tenants. In addition, we also emphasized the importance of studying the sustainable livelihood development of land tenants in the context of China’s rural economic and social transformation. Second, in terms of data and an econometric approach, we conducted an econometric analysis using a large panel dataset and an instrumental variable approach to explore the relationship between livelihood capital and strategies. All five capital indicator measures vary across time and space in our study. To address potential endogeneity issues, we focused on two key points: we classified livelihood strategies based on Chinese rural households’ income structure measures and the characteristics and choices of their strategies, and we employed binary logistic models to analyze the impact of livelihood capital on the strategies of agricultural land leasing households.
Third, we used a polynomial logistic model to assess the impact of livelihood capital on the transformation of land leasing households’ strategies. Regarding the variability of our findings, this study confirms previous research [76,77] in the way that different types of livelihood capital have different effects on agriculture-led livelihood strategies. Specifically, our results indicate that natural and physical capital have significant positive effects on agriculture-led strategies, while financial, human, and social capital have negative effects. This differs from other studies [78] that did not take into account the differences in natural environments and socioeconomic conditions, which we highlight in the literature.
The results of this study provide new insights into how rural household livelihood capital influences livelihood strategy choice within the framework of sustainable livelihood analysis for farmland lease households. Our findings complement previous research on the influential effects of different types of livelihood capital on agricultural-led livelihood strategies. Moreover, this study combined a binary logistic regression model and a multinomial logistic regression model to reveal the factors and mechanisms that influence the choice of livelihood strategies for farmland lease households. There are several limitations to this study that could be addressed in future research. First, this study used data from 283 farmland transfer households in the year of 2021, which is limited in geographical location and long-term tracking and research. Because livelihood capital is a topic of long-term dynamic change for rural households, panel data would be more suitable for exploring it. Therefore, future studies could consider long-term dynamic monitoring to obtain more supporting data to compensate for this limitation. Second, the data in this study only involved data from Yudu County within Jiangxi Province, which is one of the important rice and vegetable growing regions in the southern hills of Jiangxi Province, and land lease is frequent in this area. In order to make the conclusions more representative, we suggest that future studies extrapolate our findings to other regions where natural resources, environmental conditions, and demographic and institutional characteristics may differ to further prove the applicability of the findings of this study to other regions. Finally, we regret that the data available to us cannot provide a more comprehensive picture of the impact of livelihood capital on the livelihood strategies of farmland lease households for the whole country. Therefore, we hope that future studies will take this perspective into account and provide more detailed and comprehensive data.

6. Conclusions and Implications

This section used binary logit and multi-categoricity logit models for empirical analysis, while logit robust regression, binary probit, and multinomial probit were used to test the results for the robustness of the empirical results in the previous section. Natural and physical capital have a significant positive effect on agriculture-led livelihood strategies. Financial capital, human capital, and social capital hurt the choice of agriculture-led livelihood strategies. Among the control variables, distance to the town center did not significantly affect the agricultural dominant livelihood strategies. Natural capital has a significant negative effect on the choice of pluriactivity strategies. The effects of physical capital, human capital, and social capital on the choice of pluriactivity strategies were not significant. For the off-farm-led livelihood strategy, the effects of natural and financial capital are insignificant, physical capital has a significant negative effect, and human and social capital have a significant positive contribution. In the case of off-farm-led livelihood strategy as a reference, the effect of each variable on agricultural-led livelihood strategy was significantly positive for natural capital and physical capital. Among the factors influencing the shift to pluriactivity strategies, natural capital has a negative effect, physical capital has a significantly positive effect, financial capital has a non-significant effect, and human capital and social capital have some inhibitory effects.

Author Contributions

Conceptualization: L.H. and X.L.; formal analysis: L.H., C.L. and X.G.; investigation: all authors; writing—original draft preparation: L.H. and X.L.; supervision, L.H.; project administration, X.L.; funding acquisition, Y.L. and X.L. All authors have read and agreed to the published version of the manuscript.

Funding

This research was funded by Humanities and Social Sciences in Jiangxi Universities (GL22234); Entrusted project by Jiangxi Selenium-rich Agricultural Research Institute in 2021 (JXFX21-ZD11); Key Project of the 13th Five-Year Plan of Jiangxi Province (No.: 19ZD023); National Social Science Foundation (No.: 18BJY135).

Institutional Review Board Statement

Not applicable.

Informed Consent Statement

Not applicable.

Data Availability Statement

Not applicable.

Acknowledgments

The contents of this paper are solely the responsibility of the authors and do not represent the official views of the aforementioned institutes and funding agencies.

Conflicts of Interest

The authors declare no conflict of interest.

Appendix A

Table A1. The calculated weights for the criteria in relations 3–8.
Livelihood CapitalIndicator MeasurementsWeights
Natural capitalOwned land area (mu)0.163
Area of land leased-in (mu)0.222
Whether a written lease contract is signed (1 = yes; 0 = no)0.124
Years of land lease (years)0.172
Whether the land operated is concentrated and contiguous (1 = yes; 0 = no)0.282
Soil fertility self-assessment
(1 = very unfertile; 5 = very fertile)
0.037
Physical capitalProduction equipment value (CNY ten thousand)0.313
Living equipment value (CNY ten thousand)0.338
Total area of the house (m2)0.099
Whether broadband is installed (1 = yes; 0 = no)0.152
Livestock stock value of farm livestock breeding (CNY ten thousand)0.098
Financial capitalAvailability of deposits in banks (1 = Yes; 0 = No)0.116
Availability of loans from friends and relatives
(very difficult to access = 1; difficult to access = 2; to a fair extent = 3; easier to access = 4; very easy to access = 5)
0.368
Total amount of loans ever obtained from banks and other financial institutions (CNY ten thousand)0.215
Ease of obtaining loans from banks
(Very difficult = 1; difficult = 2; fair = 3.
Easier = 4; Very easy = 5)
0.301
Human capitalNumber of household labor (person)0.098
Household labor share (%)0.039
Average education of household labor (years)0.101
Health status of the family members
(1 = very unhealthy; 5 = very healthy)
0.025
Whether the main household labor has received employment or entrepreneurship training
(1 = yes; 2 = no)
0.225
Whether the main household laborer has a certain non-farm skill
(1 = yes; 2 = no)
0.104
Whether the main household laborer has a certain farm kill
(1 = yes; 2 = no)
0.408
Social capitalNumber of urban relative households (household)0.096
Number of village or township officials or other public officials among relatives (people)0.298
Number of households available for non-farm work (household)0.095
How many people come to help if the family has a wedding and funeral (people)0.063
Head of household communication costs (CNY)0.039
Whether to participate in planting associations, cooperatives, and other organizations
(1 = yes; 0 = no)
0.224
Number of village meetings attended (times)0.185

Appendix B. Survey Questionnaire

(The content of this survey is for research purposes only)
Rural household interview questionnaire.
1. Basic household information
1.1. Characteristics of the head of household
Age of the head of the household; gender of the head of the household; health status.
Schooling; whether to master a certain agricultural technology; whether to master a non-farm technology.
Note: gender: 0 = female; 1 = male. Health status: 1 = very unhealthy; 2 = relatively unhealthy; 3 = average; 4 = relatively healthy; 5 = very healthy. Whether to master: 0 = no; 1 = yes.
1.2. Household characteristics
Number of household members; whether household members participate in the New Agricultural Cooperative. Household has years of experience in rice cultivation; household has years of experience in cash crop cultivation.
Note: Whether to participate: 0 = no; 1 = yes.
1.3. Land lease status
Whether to lease agricultural land; scale of lease (mu); unit price of leased land (CNY/mu/year); mode of lease.
Note: Whether to transfer in: 0 = no; 1 = yes. Transfer mode: 1 = village collective unified organization transfer 2 = private transfer between enterprises and farmers 3 = private transfer between farmers and farmers 4 = personal transfer.
1.4. Household income status
Statistical yearAgricultural production and operation income (CNY)Wage income (CNY)Non-farm production and operation income (CNY)Transfer income (CNY)Property income (CNY)Other income (CNY)Total annual income (CNY)
In 2020
1.5. Village-level characteristics
Proportion of labor force working outside the village where it is located; village per capita income (CNY).
1.6. Other information
Distance of the household’s permanent house to the town center (km); willingness to engage in long-term agricultural production in the future.
Note: Willingness: 1 = very unwilling; 2 = relatively unwilling; 3 = average; 4 = relatively willing; 5 = very willing.
2. Household livelihood capital
2.1. Household natural capital
Owned land area (mu)Area of leased land (mu)Whether to sign a written contract for leaseNumber of years of land lease (years)Whether the land operated is concentrated and contiguousSoil fertility self-assessment
      
Note: Whether contract is signed, whether concentrated and contiguous: 0 = no; 1 = yes. Self-assessment of soil fertility: 1 = very barren; 2 = poor; 3 = fair; 4 = fertile; 5 = very fertile.
2.2. Household physical capital
Number and estimated value of the following items in your household:
TypeTractorTillerHarvesterElectric vehicleMotorized three-wheelCarLorryTVRefrigerator/Cabinet
Quantity
Buy time
Total Value
TypeWashing machineCell phoneAir conditionerWater HeaterCombination furnitureComputerElectric heaterWater PumpOther
Quantity
Buy time
Total value
Note: If there are more than one type of item, the time of purchase is listed as far as possible, and the statistical value is the total value of the type of items. Total value of production equipment accounting summary (CNY million); total value of living equipment accounting summary (CNY million).
Total area of your house (square meters)Which year it was built or boughtTotal estimated value of home house (million CNY)Whether broadband is installedIf equipped with broadband, when was the year of installationValue of farm household livestock and livestock breeding stock (million CNY)
      
 Note: Whether or not broadband is installed: 0 = no; 1 = yes.
2.3. Household financial capital
Whether there is deposit in the bankWhether had loans from banks and other financial institutionsTotal amount of loans ever obtained from banks and other financial institutions (million CNY)Ease of getting a loan from a bankAvailability of borrowing from friends and relatives
     
 Note: Availability, accessibility: 0 = no; 1 = yes. Difficulty, accessibility: 1 = very difficult; 2 = more difficult; 3 = fair; 4 = easy; 5 = very easy.
2.4. Household human capital
Number of household members; number of household labor force.
Average years of education of household labor force; average health status of household members.
Whether the main household labor force has received employment or entrepreneurship training.
Whether the main household labor force has mastered a certain non-agricultural skill; whether the main household labor force has mastered a certain agricultural skill.
Note: Field summation of indicators involving the whole household. Health status: 1 = very unhealthy; 2 = relatively unhealthy; 3 = average; 4 = relatively healthy; 5 = very healthy. Mastery or not: 0 = no; 1 = yes.
2.5. Household social capital
Number of relatives’ households in urban areasHow many of your relatives are village or township cadres or other public officialsHow many families can help your family when they are looking for non-farm jobs?How many people can help with family celebrations?Whether or not they participate in planting associations, cooperatives, and other organizations
     
Monthly communication expenses of the head of household (CNY)Monthly transportation expenses of the head of household (CNY)Monthly household communication expenses (CNY)Monthly household transportation expenses (CNY)How many village affairs meetings were attended in a year
     
 Note: Whether to participate: 0 = no; 1 = yes.

References

  1. Liu, Y. Introduction to land use and rural sustainability in China. Land Use Policy 2018, 74, 1–4. [Google Scholar] [CrossRef]
  2. Shao, J.A.; Wei, C.; Xie, D.; Liu, J. Farmers’ responses to land transfer under the household responsibility system in Chongqing (China): A case study. J. Land Use Sci. 2007, 2, 79–102. [Google Scholar] [CrossRef]
  3. Xiao, H.; Xiao, J.; Xie, F. Impact Assessment of Farmland Lease-Out on Rural Households’ Livelihood Capital and Livelihood Strategy. Sustainability 2022, 14, 10736. [Google Scholar] [CrossRef]
  4. Baulch, R.; Hoddinot, J. Economic mobility and poverty dynamics in developing countries. J. Dev. Stud. 2000, 36, 1–24. [Google Scholar] [CrossRef]
  5. Dartanto, T.; Nurkholis. The determinants of poverty dynamics in Indonesia: Evidence from panel data. Bull. Indones. Econ. Stud. 2013, 49, 61–84. [Google Scholar]
  6. Nega, F.; Mathijs, E.; Deckers, J. Rural Poverty Dynamics and Impact of Intervention Programs upon Chronic and Transitory Poverty in Northern Ethiopia. Afr. Dev. Rev. 2010, 22, 92–114. [Google Scholar] [CrossRef] [Green Version]
  7. Ansoms, A.; McKay, A. A quantitative analysis of poverty and livelihood profiles: The case of rural Rwanda. Food Policy 2010, 35, 584–598. [Google Scholar] [CrossRef]
  8. Alemu, Z.G. Livelihood Strategies in Rural South Africa: Implications for Poverty Reduction; No. 1007-2016-79737. 2012, pp. 2–24. Available online: https://ageconsearch.umn.edu/record/125411/ (accessed on 20 February 2023).
  9. Soltani, A.; Angelsen, A.; Eid, T.; Naieni, M.S.N.; Shamekhi, T. Poverty, sustainability, and household livelihood strategies in Zagros, Iran. Ecol. Econ. 2012, 79, 60–70. [Google Scholar] [CrossRef]
  10. Van den Berg, M. Household income strategies and natural disasters: Dynamic livelihoods in rural Nicaragua. Ecol. Econ. 2010, 69, 592–602. [Google Scholar] [CrossRef]
  11. Chambers, R.; Conway, G. Sustainable Rural Livelihoods: Practical Concepts for the 21st Century; IDS Discussion Paper No. 296; Institute of Development Studies: Brighton, UK, 1992; p. 296. [Google Scholar]
  12. Sen, A.K. Human capital and human capability. World Dev. 1997, 25, 1959–1961. [Google Scholar] [CrossRef]
  13. Carney, D. Sustainable Livelihoods Approaches: Progress and Possibilities for Change; Department for International Development (DFID): London, UK, 1998. [Google Scholar]
  14. Scoones, I. Livelihoods perspectives and rural development. J. Peasant. Stud. 2009, 36, 171–196. [Google Scholar] [CrossRef]
  15. Ellis, F. Rural Livelihoods and Diversity in Developing Countries; University Press: Oxford, UK, 2000. [Google Scholar]
  16. Shen, F.; Hughey, K.F.; Simmons, D.G. Connecting the sustainable livelihoods approach and tourism: A review of the literature. J. Hosp. Tour. Manag. 2008, 15, 19–31. [Google Scholar] [CrossRef]
  17. Begum, H.; Moinuddin, G. Livelihood framework: Understanding poverty and vulnerability and coping strategies of the urban poor in Dhaka. J. Soc. Sci. Res. 2018, 4, 101–108. [Google Scholar]
  18. DFID. Sustainable Livelihoods Guidance Sheets; Department for International Development: London, UK, 2000; pp. 68–125. [Google Scholar]
  19. Tolossa, D. Some realities of the urban poor and their food security situations: A case study of Berta Gibi and Gemechu Safar in the city of Addis Ababa, Ethiopia. Environ. Urban. 2010, 22, 179–198. [Google Scholar] [CrossRef]
  20. Abdulai, A.; CroleRees, A. Determinants of income diversification amongst rural households in Southern Mali. Food Policy 2001, 26, 437–452. [Google Scholar] [CrossRef]
  21. Escobal, J.A. The Determinants of Nonfarm Income Diversification in Rural Peru. World Dev. 2001, 29, 97–508. [Google Scholar] [CrossRef]
  22. Adhikari, B.; Falco, S.D.; Lovett, J.C. Household characteristics and forest dependency: Evidence from common property forest management in Nepal. Ecol. Econ. 2004, 48, 245–257. [Google Scholar] [CrossRef]
  23. Babulo, B.; Muys, B.; Nega, F.; Tollens, E.; Nyssen, J.; Deckers, J.; Mathijs, E. Household livelihood strategies and forest dependence in the highlands of Tigray, Northern Ethiopia. Agric. Syst. 2008, 98, 147–155. [Google Scholar] [CrossRef]
  24. Chen, H.; Zhu, T.; Krott, M.; Calvo, J. Measurement and evaluation of livelihood assets in sustainable forest commons governance. Land. Use Policy 2013, 30, 908–914. [Google Scholar] [CrossRef]
  25. Mahama, A.K.; Maharjan, K.L. Determining the nature and spatial-temporal changes of the livelihood asset pentagon and its relationship with livelihood opportunities in Ghana. Community Dev. 2019, 50, 460–483. [Google Scholar] [CrossRef]
  26. Walker, J.; Mitchell, B.; Wismer, S. Livelihood strategy approach to community- based planning and assessment: A case study of Molas, Indonesia. Proj. Apprais. 2001, 19, 297–309. [Google Scholar] [CrossRef]
  27. Jansen, H.G.; Pender, J.L.; Damon, A.; Schipper, R.A. Rural Development Policies and Sustainable Land Use in the Hillside Areas of Honduras: A Quantitave Livelihoods Approach; International Food Policy Research Institute: Washington, DC, USA, 2006. [Google Scholar]
  28. Tittonell, P.; Muriuki, A.; Shepherd, K.D.; Mugendi, D.; Kaizzi, K.C.; Okeyo, J.; Verchot, L.; Coe, R.; Vanlauwe, B. The diversity of rural livelihoods and their influence on soil fertility in agricultural systems of East Africa—A typology of smallholder farms. Gallimard 2011, 103, 83–97. [Google Scholar] [CrossRef]
  29. Paavola, J. Livelihoods, vulnerability and adaptation to climate change in Morogoro, Tanzania. Environ. Sci. Policy 2008, 11, 642–654. [Google Scholar] [CrossRef]
  30. Ding, W.; Ren, W.-B.; Li, P.; Hou, X.; Sun, X.; Li, X.; Xie, J.; Ding, Y. Evaluation of the livelihood vulnerability of pastoral households in Northern China to natural disasters and climate change. Rangel. J. 2014, 36, 535–543. [Google Scholar] [CrossRef] [Green Version]
  31. Barrett, C.B.; Reardon, T.; Webb, P. Nonfarm income diversification and household livelihood strategies in rural Africa: Concepts, dynamics, and policy implications. Food Policy 2001, 26, 315–331. [Google Scholar] [CrossRef]
  32. Hua, Q. Rural-to-Urban Labor Migration, Household Livelihoods, and the Rural Environment in Chongqing Municipality, Southwest China. Hum. Ecol. 2010, 38, 675–690. [Google Scholar]
  33. Huang, X.; Huang, X.; He, Y.; Yang, X. Assessment of livelihood vulnerability of land-lost farmers inurbanfringes: A case study of Xi’an, China. Habitat Int. 2017, 59, 1–9. [Google Scholar] [CrossRef]
  34. Yang, H.; Huang, K.; Deng, X.; Xu, D. Livelihood capital and land transfer of different types of farmers: Evidence from panel data in Sichuan province, China. Land 2021, 10, 532. [Google Scholar] [CrossRef]
  35. Pour, M.D.; Motiee, N.; Barati, A.A.; Taheri, F.; Azadi, H.; Gebrehiwot, K.; Lebailly, P.; Van Passel, S.; Witlox, F. Impacts of the Hara Biosphere Reserve on Livelihood and Welfare in Persian Gulf. Ecol. Econ. 2017, 141, 76–86. [Google Scholar] [CrossRef]
  36. Yang, H.; Dietz, T.; Yang, W.; Zhang, J.; Liu, J. Changes in Human Well-being and Rural Livelihoods Under Natural Disasters. Ecol. Econ. 2018, 151, 184–194. [Google Scholar] [CrossRef]
  37. Shah, K.U.; Dulal, H.B.; Johnson, C.; Baptiste, A. Understanding livelihood vulnerability to climate change: Applying the livelihood vulnerability index in Trinidad and Tobago. Geoforum 2013, 47, 125–137. [Google Scholar] [CrossRef]
  38. Tuyen, Q.T. A review on the link between nonfarm employment, land and rural livelihoods in developing countries and Vietnam. Ekon. Horiz. 2014, 16, 113–123. [Google Scholar] [CrossRef]
  39. Coulibaly-Lingani, P.; Tigabu, M.; Savadogo, P.; Oden, P.-C.; Ouadba, J.-M. Determinants of access to forest products in southern Burkina Faso. For. Policy Econ. 2009, 1, 516–524. [Google Scholar] [CrossRef]
  40. Godoy, R.; Kathleen O'neill; Groff, S.; Kostishack, P.; Cubas, A.; Demmer, J.; Mcsweeney, K.; Overman, J. Household determinants of deforestation by Amerindians in Honduras. World Develop. 1997, 25, 977–987. [Google Scholar] [CrossRef]
  41. Liu, Z.; Liu, L. Characteristics and driving factors of rural livelihood transition in the east coastal region of China: A case study of suburban Shanghai. J. Rural. Stud. 2016, 43, 145–158. [Google Scholar] [CrossRef]
  42. MATSHE, I. Off-farm labour allocation decisions in small-scale rural households in Zimbabwe. Agric. Econ. 2004, 30, 175–186. [Google Scholar] [CrossRef]
  43. Yang, X.; Guo, S.; Deng, X.; Xu, D. Livelihood adaptation of rural households under livelihood stress: Evidence from Sichuan Province, China. Agriculture 2021, 11, 506. [Google Scholar] [CrossRef]
  44. Pour, M.D.; Barati, A.A.; Azadi, H.; Scheffran, J. Revealing the role of livelihood assets in livelihood strategies: Towards enhancing conservation and livelihood development in the Hara Biosphere Reserve, Iran. Ecol. Indic. 2018, 94, 336–347. [Google Scholar] [CrossRef]
  45. Alary, V.; Corniaux, C.; Gautier, D. Livestock’s Contribution to Poverty Alleviation: How to Measure It? World Dev. 2011, 39, 1638–1648. [Google Scholar] [CrossRef]
  46. Hossain, S. Poverty, household strategies and coping with urban life: Examining ‘livelihood framework’ in Dhaka City, Bangladesh. Bangladesh E-J. Sociol. 2005, 2, 1–8. [Google Scholar]
  47. Tesfaye, Y.; Roos, A.; Campbell, B.M.; Bohlin, F. Livelihood strategies and the role of forest income in participatory-managed forests of Dodola area in the bale highlands, southern Ethiopia. For. Policy Econ. 2011, 13, 258–265. [Google Scholar] [CrossRef]
  48. Carrillo Álvarez, E.; Riera Romaní, J. Measuring social capital: Further insights. Gac. Sanit. 2017, 31, 57–61. [Google Scholar] [CrossRef] [Green Version]
  49. Gautam, Y.; Andersen, P. Rural livelihood diversification and household well-being: Insights from Humla, Nepal. J. Rural Stud. 2016, 44, 239–249. [Google Scholar] [CrossRef] [Green Version]
  50. Kibwage, J.K.; Odondo, A.J.; Momanyi, G.M. Assessment of livelihood assets and strategies among tobacco and non tobacco growing households in south Nyanza region, Kenya. Afr. J. Agric. Res. 2009, 4, 294–304. [Google Scholar]
  51. Xu, D.; Deng, X.; Guo, S.; Liu, S. Sensitivity of livelihood strategy to livelihood capital: An empirical investigation using nationally representative survey data from rural China. Soc. Indic. Res. 2019, 144, 113–131. [Google Scholar] [CrossRef]
  52. Xiaobing, W.A.N.G.; Herzfeld, T.; Glauben, T. Labor allocation in transition: Evidence from Chinese rural households. China Econ. Rev. 2007, 18, 287–308. [Google Scholar]
  53. Lazarus, N.W. Coping capacities and rural livelihoods: Challenges to community risk management in southern Sri Lanka. Appl. Geogr. 2011, 31, 20–34. [Google Scholar] [CrossRef]
  54. Turner, M.D.; Ayantunde, A.A.; Patterson, K.P.; Patterson III, E.D. Livelihood transitions and the changing nature of farmer–herder conflict in Sahelian West Africa. J. Dev. Stud. 2011, 47, 183–206. [Google Scholar] [CrossRef] [PubMed]
  55. Li, M.; Wang, J.; Zhao, P.; Chen, K.; Wu, L. Factors affecting the willingness of agricultural green production from the perspective of farmers’ perceptions. Sci. Total Environ. 2020, 738, 140289. [Google Scholar] [CrossRef]
  56. Deininger, K.; Jin, S.; Xia, F.; Huang, J. Moving off the farm: Land institutions to facilitate structural transformation and agricultural productivity growth in China. World Dev. 2014, 59, 505–520. [Google Scholar] [CrossRef] [Green Version]
  57. Rogers, S.; Wilmsen, B.; Han, X.; Wang, Z.J.H.; Duan, Y.; He, J.; Wong, C. Scaling up agriculture? The dynamics of land transfer in inland China. World Dev. 2021, 146, 105563. [Google Scholar] [CrossRef]
  58. Gao, L.; Zhang, W.; Mei, Y.; Sam, A.G.; Song, Y.; Jin, S. Do farmers adopt fewer conservation practices on rented land? Evidence from straw retention in China. Land Use Policy 2018, 79, 609–621. [Google Scholar] [CrossRef] [Green Version]
  59. Xu, Y.; Huang, X.; Bao, H.X.; Ju, X.; Zhong, T.; Chen, Z.; Zhou, Y. Rural land rights reform and agro-environmental sustainability: Empirical evidence from China. Land Use Policy 2018, 74, 73–87. [Google Scholar] [CrossRef]
  60. Hu, X.; Su, K.; Chen, W.; Yao, S.; Zhang, L. Examining the impact of land consolidation titling policy on farmers’ fertiliser use: Evidence from a quasi-natural experiment in China. Land. Use Policy 2021, 109, 105645. [Google Scholar] [CrossRef]
  61. Zhang, Y.; Li, X.; Song, W. Determinants of cropland abandonment at the parcel, household and village levels in mountain areas of China: A multi-level analysis. Land Use Policy 2014, 41, 186–192. [Google Scholar] [CrossRef]
  62. Wang, W.; Gong, J.; Wang, Y.; Shen, Y. Exploring the effects of rural site conditions and household livelihood capitals on agricultural land transfers in China. Land Use Policy 2021, 108, 105523. [Google Scholar] [CrossRef]
  63. You, H.; Hu, X.; Bie, C.; Zhou, D. 2019 Impact of livelihood assets on farmland-transferred households’ willingness to urbanism and policies implications for farmland transfer: Evidence from Zhejiang, China. Discret. Dyn. Nat. Soc. 2019, 2019, 9631701. [Google Scholar]
  64. Martinho, V.J.P.D. Agricultural entrepreneurship in the European Union: Contributions for a sustainable development. Appl. Sci. 2020, 10, 2080. [Google Scholar] [CrossRef] [Green Version]
  65. Shui, W.; Zhang, Y.; Wang, X.; Liu, Y.; Wang, Q.; Duan, F.; Wu, C.; Shui, W. Does Tibetan Household Livelihood Capital Enhance Tourism Participation Sustainability? Evidence from China’s Jiaju Tibetan Village. Int. J. Environ. Res. Public Health 2022, 19, 9183. [Google Scholar] [CrossRef] [PubMed]
  66. Stallman, H.R.; James, H.S., Jr. Determinants affecting farmers’ willingness to cooperate to control pests. Ecol. Econ. 2015, 117, 182–192. [Google Scholar] [CrossRef]
  67. Zhang, X.; Han, L. Which Factors Affect Farmers’ Willingness for rural community remediation? A tale of three rural villages in China. Land Use Policy 2018, 74, 195–203. [Google Scholar] [CrossRef]
  68. Schulz, N.; Breustedt, G.; Latacz-Lohmann, U. Assessing farmers’ willingness to accept “greening”: Insights from a discrete choice experiment in Germany. J. Agric. Econ. 2014, 65, 26–48. [Google Scholar] [CrossRef]
  69. Wang, J.; Xu, Y.; Zou, L.; Wang, Y. Does Culture Affect Farmer Willingness to Transfer Rural Land? Evidence from Southern Fujian, China. Land 2021, 10, 594. [Google Scholar] [CrossRef]
  70. Haglund, E.; Ndjeunga, J.; Snook, L.; Pasternak, D. Dry land tree management for improved household livelihoods: Farmer managed natural regeneration in Niger. J. Environ. Manag. 2011, 92, 1696–1705. [Google Scholar] [CrossRef] [Green Version]
  71. Singh, A.K. Income and livelihood issues of farmers: A field study in Uttar Pradesh. Agric. Econ. Res. Rev. 2013, 26, 89–96. [Google Scholar]
  72. Liu, M.Y.; Feng, X.L.; Wang, S.G.; Zhong, Y. Does poverty-alleviation-based industry development improve farmers’ livelihood capital? J. Integr. Agric. 2021, 20, 915–926. [Google Scholar] [CrossRef]
  73. Sun, Y.; Gan, X.; Lu, Y.H. Research on the evaluation of green development level of main apple producing areas based on entropy value method. For. Econ. 2020, 42, 87–96. (In Chinese) [Google Scholar]
  74. Li, J. Livelihood adaptation strategy and perceived adaptive capacity of rural relocated households in Southern Shaanxi province, China. Resour. Environ. 2016, 26, 44–52. [Google Scholar]
  75. Yang, A.; Ye, J.; Wang, Y. Coupling and Coordination Relationship between Livelihood Capital and Livelihood Stability of Farmers in Different Agricultural Regions. Land 2022, 11, 2049. [Google Scholar] [CrossRef]
  76. Ao, Y.; Tan, L.; Feng, Q.; Tan, L.; Li, H.; Wang, Y.; Wang, T.; Chen, Y. Livelihood Capital Effects on Famers’ Strategy Choices in Flood-Prone Areas—A Study in Rural China. Int. J. Environ. Res. Public Health 2022, 19, 7535. [Google Scholar] [CrossRef]
  77. de Sherbinin, A.; VanWey, L.K.; McSweeney, K.; Aggarwal, R.; Barbieri, A.; Henry, S.; Hunter, L.M.; Twine, W.; Walker, R. Rural household demographics, livelihoods and the environment. Glob. Environ. Chang. 2008, 18, 38–53. [Google Scholar] [CrossRef] [PubMed] [Green Version]
  78. Su, F.; Saikia, U.; Hay, I. Relationships between livelihood risks and livelihood capitals: A case study in Shiyang River Basin, China. Sustainability 2018, 10, 509. [Google Scholar] [CrossRef] [Green Version]
Figure 1. Block diagram of the mechanism of the role of farmland lease-in household livelihood capital in livelihood strategy choice.
Sustainability 15 10245 g001
Table 2. Classification criteria for livelihood strategy of farmland leased-in rural households.
Farmland Lease-In Households
Types of Household Livelihood Strategies
Classification CriteriaNumber of Rural Households
Agriculture-ledY1 ≥ 0.577
Pluriactivity0.25 ≤ Y2 < 0.5121
Off-farm-ledY3 < 0.2585
Table 3. Descriptive analysis of sample characteristics.
Variable CategoryVariable DefinitionMeanS.D.
Householder characteristicsGender of the head of household0.8300.375
Age of head of household53.4489.610
Years of education of the head of household7.6392.274
Health status of the head of household4.3250.895
Whether the household head has mastered a particular agricultural technology0.4550.498
Whether the household head has a certain off-farm skill0.2570.438
Number of family members5.5862.105
Whether family members participate in the new agricultural cooperation0.8720.333
Family characteristicsHow many years of rice farming experience does the family have27.51514.481
How many years of cash crop farming experience does the family have9.61411.183
Land leaseLease-in to scale84.26784.591
Lease-in to land unit price322.551100.672
Lease method1.7981.027
Household income statusPure production and operating income from agriculture38,039.11032,745.020
Wage income44,245.46029,715.890
Off-farm net production and business income12,107.52015,938.310
Transfer income2906.9655784.737
Property income968.4384608.503
Other income802.0143055.047
Total annual revenue99,026.72041,714.570
Village characteristicsThe proportion of village laborers working outside the village0.6590.142
Village income per capita14,504.3202943.894
Note: Compiled from field research data.
Table 4. Impact of livelihood capital on agriculture-led livelihood strategies.
Model 1Model 2Model 3Model 4Model 5Model 6
Variables(Dependent variable: whether or not to choose an agriculture-led livelihood strategy)
Natural capital3.304 ***
(0.984)
3.565 ***
(1.090)
Physical capital 3.235 **
(1.557)
4.709 **
(1.859)
Financial capital −1.574 **
(0.744)
−2.161 **
(0.864)
Human capital −3.496 ***
(0.759)
−4.492 ***
(0.884)
Social capital −2.293 **
(1.073)
−2.364 **
(1.205)
Distance from the household to the town center0.027
(0.064)
0.021
(0.063)
0.013
(0.064)
0.035
(0.067)
0.032
(0.063)
0.037
(0.073)
Willingness to engage in long-term agricultural production0.523 ***
(0.123)
0.602 ***
(0.119)
0.634 ***
(0.118)
0.722 ***
(0.124)
0.661 ***
(0.117)
0.482 ***
(0.134)
Constant term−4.250 ***
(0.597)
−3.849 ***
(0.577)
−2.318 ***
(0.663)
−2.142 ***
(0.548)
−2.548 ***
(0.589)
−1.655 *
(0.914)
Number of samples283283283283283283
LR chi2(3) or LR chi2(7)50.4042.4242.4863.0742.5595.25
Prob > chi20.0000.0000.0000.0000.0000.000
Pseudo R20.1520.1280.1280.1900.1280.288
Log-likelihood−140.444−144.438−144.405−134.110−144.373−118.023
Note: *, ** and *** indicate significant at the 10%, 5%, and 1% statistical levels, respectively. Standard deviations are in parentheses.
Table 5. Impact of livelihood capital on pluriactivity strategies.
Model 7Model 8Model 9Model 10Model 11Model 12
Variables(Dependent variable: whether pluriactivity strategy was chosen)
Natural capital−2.544 ***
(0.769)
−2.882 ***
(0.807)
Physical capital 0.884
(1.299)
1.591
(1.391)
Financial capital 1.711 ***
(0.658)
1.919 ***
(0.683)
Human capital 0.059
(0.528)
0.120
(0.558)
Social capital −1.287
(0.896)
−1.544
(0.941)
Distance from the household to the town center0.159 ***
(0.061)
0.160 ***
(0.059)
0.172 ***
(0.061)
0.161 ***
(0.060)
0.167 ***
(0.060)
0.176 ***
(0.062)
Willingness to engage in long-term agricultural production−0.031
(0.099)
−0.159 *
(0.094)
−0.113
(0.092)
−0.143
(0.091)
−0.146
(0.091)
−0.008
(0.103)
Constant term0.295
(0.422)
−0.525
(0.427)
−1.455 ***
(0.559)
−0.398
(0.429)
0.055
(0.470)
−0.651
(0.730)
Number of samples283283283283283283
LR chi2(3) or LR chi2(7)22.5011.6718.1711.2213.2834.49
Prob > chi20.0000.0090.0000.0110.0040.000
Pseudo R20.0580.0300.0470.0290.0340.089
Log-likelihood−181.930−187.346−184.093−187.572−186.538−175.936
Note: * and *** indicate significant at the 10% and 1% statistical levels, respectively. Standard deviations are in parentheses.
Table 6. Impact of livelihood capital on off-farm-led livelihood strategies.
Model 13Model 14Model 15Model 16Model 17Model 18
Variables(Dependent variable: whether non-dominant livelihood strategies are chosen)
Natural capital0.162
(0.852)
0.712
(0.959)
Physical capital −4.639 ***
(1.536)
−5.815 ***
(1.667)
Financial capital −0.447
(0.730)
−0.437
(0.801)
Human capital 2.668 ***
(0.633)
3.097 ***
(0.687)
Social capital 3.912 ***
(1.057)
4.255 ***
(1.162)
Distance from the household to the town center−0.274 ***
(0.079)
−0.270 ***
(0.080)
−0.275 ***
(0.079)
−0.282 ***
(0.081)
−0.304 ***
(0.082)
−0.309 ***
(0.086)
Willingness to engage in long-term agricultural production−0.446 ***
(0.112)
−0.394 ***
(0.110)
−0.447 ***
(0.107)
−0.475 ***
(0.112)
−0.470 ***
(0.111)
−0.482 ***
(0.129)
Constant term1.228 **
(0.488)
2.142 ***
(0.532)
1.548 **
(0.617)
0.192
(0.494)
0.060
(0.539)
−0.173
(0.868)
Number of samples283283283283283283
LR chi2(3) or LR chi2(7)30.7440.2131.0849.9645.4877.86
Prob > chi20.0000.0000.0000.0000.0000.000
Pseudo R20.0890.1160.0900.1440.1320.225
Log-likelihood−157.589−152.855−157.418−147.980−150.221−134.030
Note: **, *** indicate significant at the 5% and 1% statistical levels, respectively. Standard deviations are in parentheses.
Table 7. Robustness test: impact of livelihood capital on strategies chose.
Model 20Model 21Model 22
Natural capital3.565 ***
(1.147)
−2.882 ***
(0.812)
0.712
(1.048)
Physical capital4.709 ***
(1.736)
1.591
(1.392)
−5.815 ***
(1.591)
Financial capital−2.161 ***
(0.826)
1.919 ***
(0.653)
−0.437
(0.764)
Human capital−4.492 ***
(0.782)
0.120
(0.546)
3.097 ***
(0.661)
Social capital−2.364 **
(1.198)
−1.544
(0.941)
4.255 ***
(1.199)
Distance from the household to the town center0.037
(0.061)
0.176 **
(0.068)
−0.309 **
(0.120)
Willingness to engage in long-term agricultural production0.482 ***
(0.144)
−0.008
(0.105)
−0.482 ***
(0.139)
Constant term−1.655 *
(0.989)
−0.651
(0.747)
−0.173
(0.943)
Number of samples283283283
LR chi2(7)65.4229.7848.40
Prob > chi20.00000.00010.0000
Pseudo R20.28750.08930.2251
Log-likelihood−118.02258−175.93591−134.0295
Note: *, **, *** indicate significant at the 10%, 5%, and 1% statistical levels, respectively. Standard deviations are in parentheses.
Table 8. Robustness test: impact of livelihood capital on strategies shift.
Model 23
VariablesShift to agriculture-led
(Off-farm-dominated as a reference group)
Shift to a part-time business
(Off-farm-dominated as a reference group)
Natural capital2.351 *
(1.407)
−1.678
(1.042)
Physical capital8.133 ***
(2.072)
5.114 ***
(1.712)
Financial capital−1.385
(0.995)
1.131
(0.787)
Human capital−5.925 ***
(0.908)
−2.180 ***
(0.691)
Social capital−5.001 ***
(1.514)
−3.882 ***
(1.241)
Distance from the household to the town center0.261 **
(0.120)
0.309 **
(0.123)
Willingness to engage in long-term agricultural production0.732 ***
(0.177)
0.362 **
(0.145)
Constant term−1.159
(1.222)
−0.295
(0.964)
Number of samples283283
LR chi293.49
Prob > chi20.0000
Pseudo R20.2371
Log-likelihood−232.89101
Note: *, ** and *** indicate significant at the 10%, 5%, and 1% statistical levels, respectively. Standard deviations are in parentheses.
Table 9. Robustness test: impact of livelihood capital on strategies.
Model 24Model 25Model 26
Natural capital1.984 ***
(0.605)
−1.781 ***
(0.488)
0.237
(0.541)
Physical capital2.896 ***
(1.072)
1.005
(0.844)
−3.470 ***
(0.970)
Financial capital−1.261 **
(0.493)
1.186 ***
(0.416)
−0.225
(0.468)
Human capital−2.623 ***
(0.498)
0.064
(0.341)
1.830 ***
(0.394)
Social capital−1.475 **
(0.687)
−0.923
(0.572)
2.421 ***
(0.660)
Distance from the household to the town center0.024
(0.043)
0.106 ***
(0.036)
−0.164 ***
(0.043)
Willingness to engage in long-term agricultural production0.268 ***
(0.075)
−0.008
(0.063)
−0.266 ***
(0.072)
Constant term−0.882 *
(0.515)
−0.400
(0.443)
−0.117
(0.495)
Number of samples283283283
LR chi2(7)94.9634.6977.25
Prob > chi20.00000.00000.0000
Pseudo R20.28660.08980.2233
Log-likelihood−118.16559−175.83358−134.33372
Note: *, ** and *** indicate significant at the 10%, 5%, and 1% statistical levels, respectively. Standard deviations are in parentheses.
Disclaimer/Publisher’s Note: The statements, opinions and data contained in all publications are solely those of the individual author(s) and contributor(s) and not of MDPI and/or the editor(s). MDPI and/or the editor(s) disclaim responsibility for any injury to people or property resulting from any ideas, methods, instructions or products referred to in the content.

