
Evaluation of Index-Based Methods for Impervious Surface Mapping from Landsat-8 to Cities in Dry Climates; A Case Study of Buraydah City, KSA

Abstract
:1. Introduction
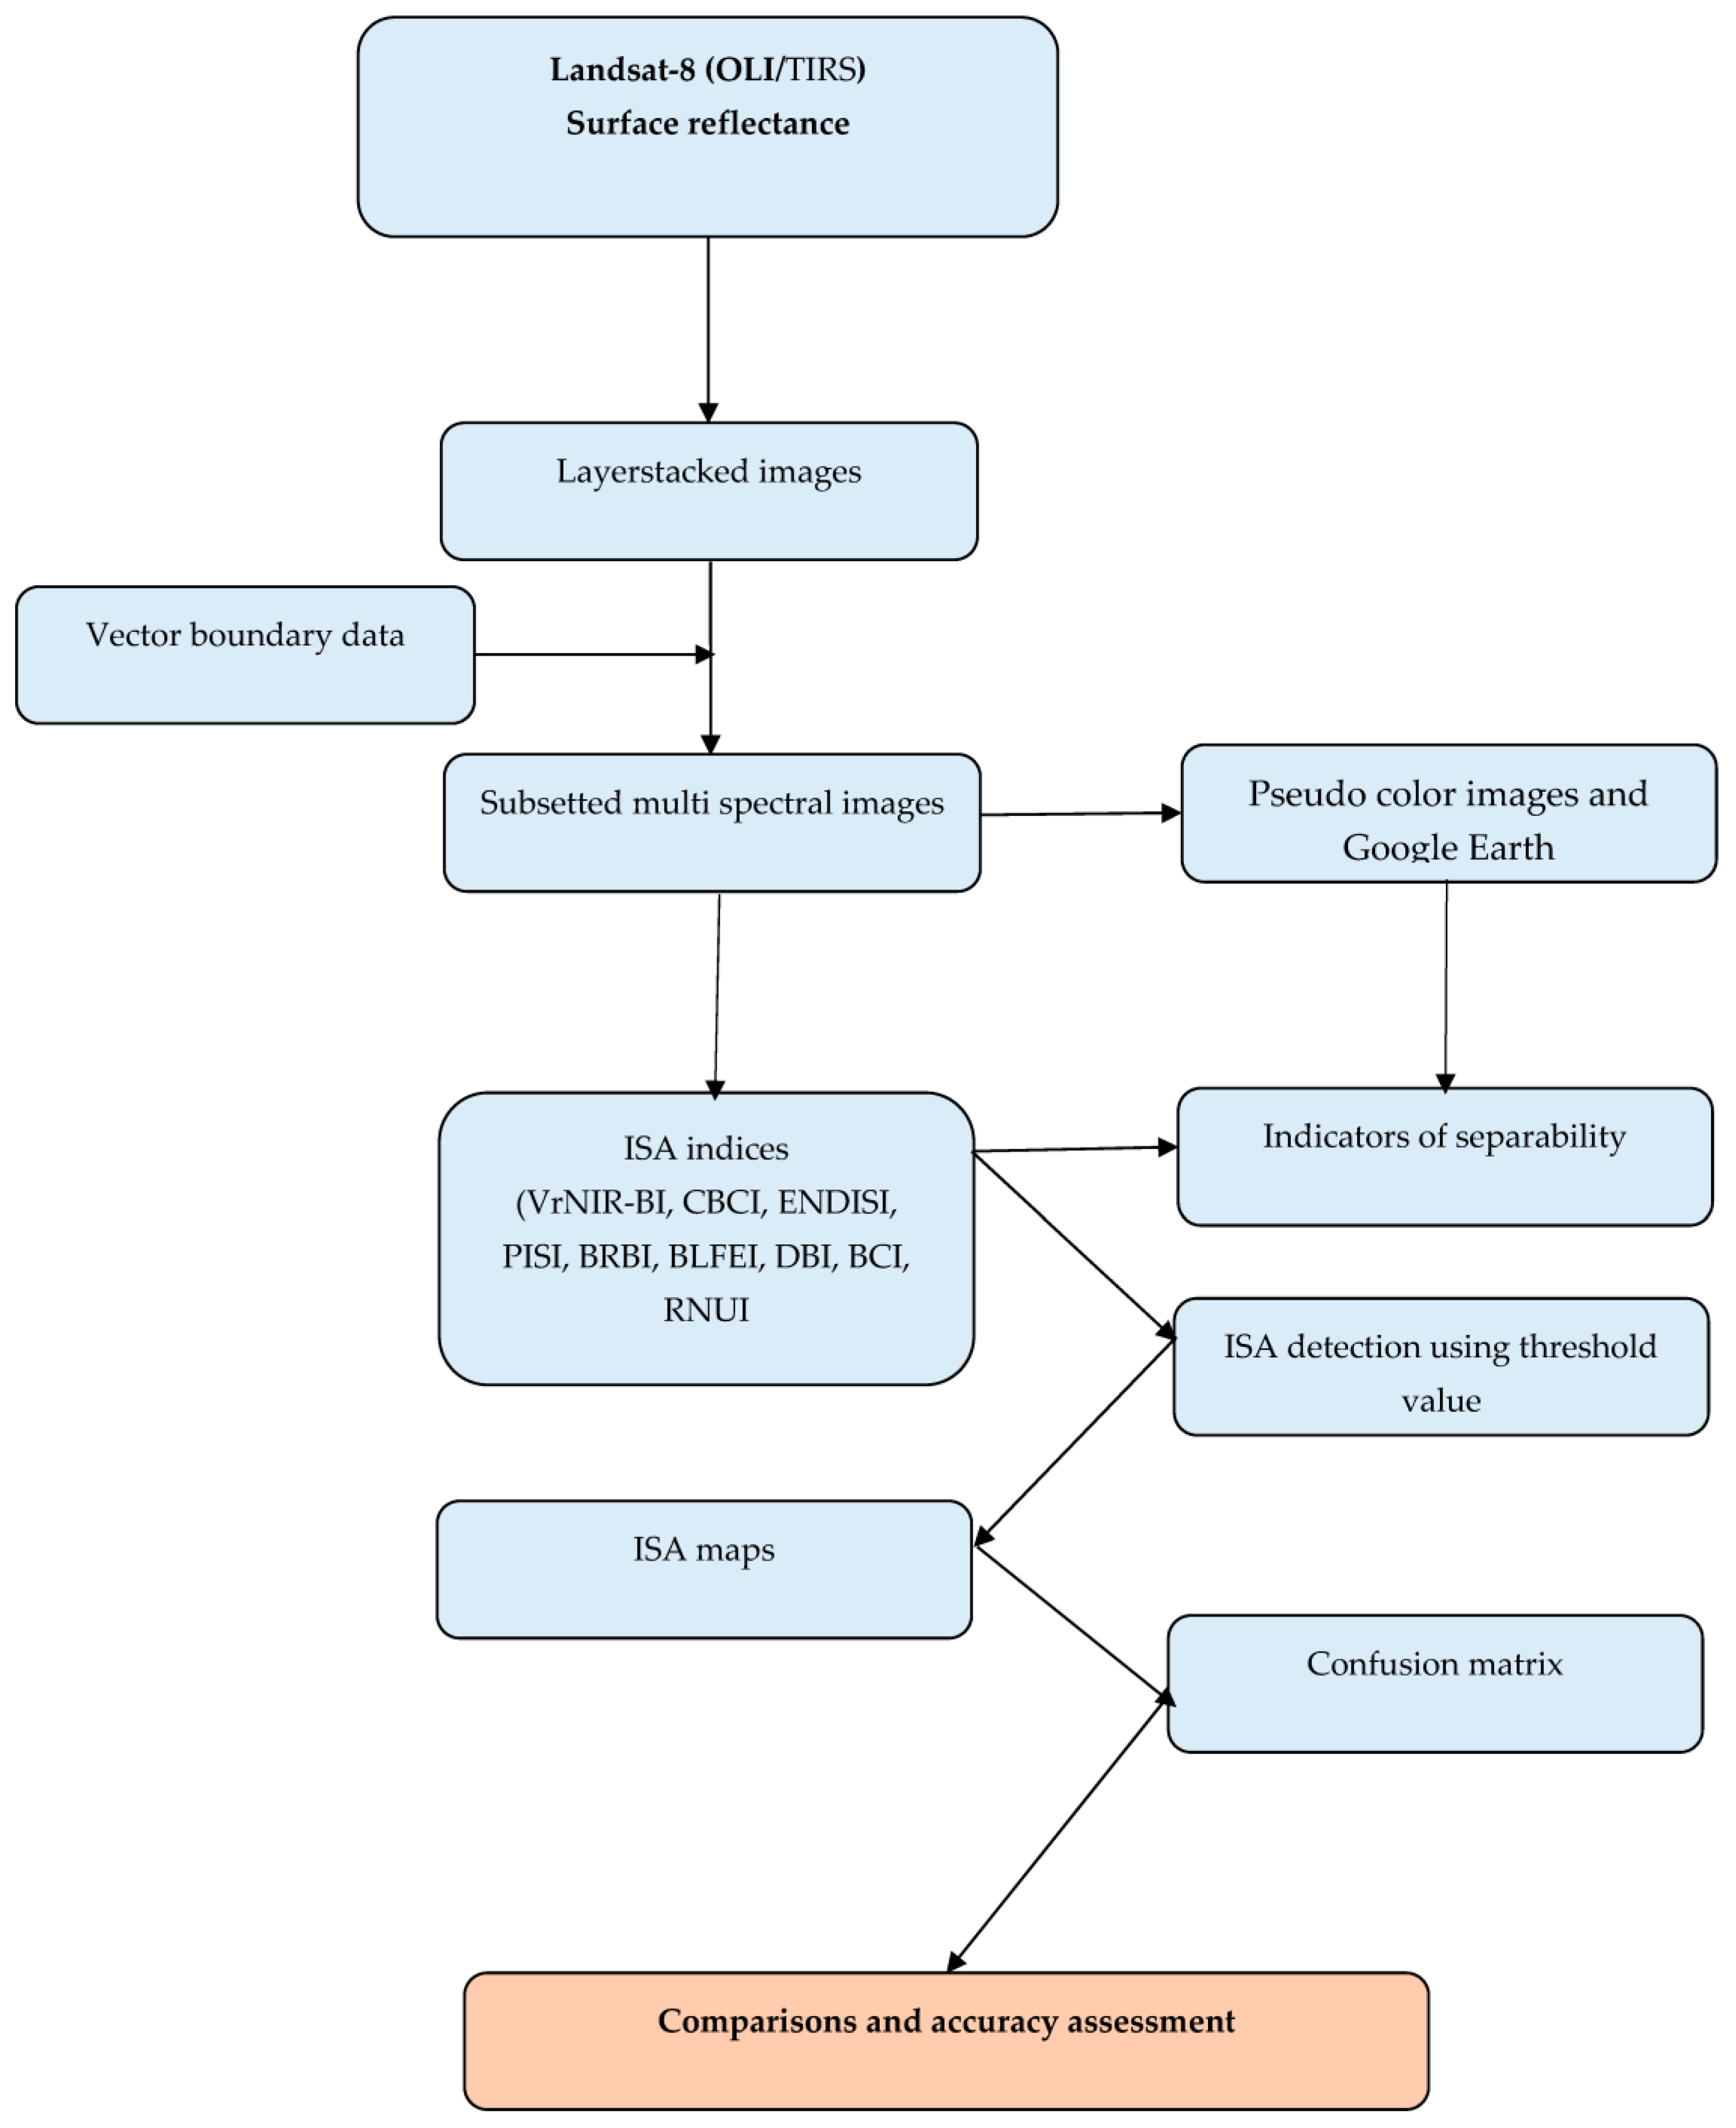
2. Materials and Methods
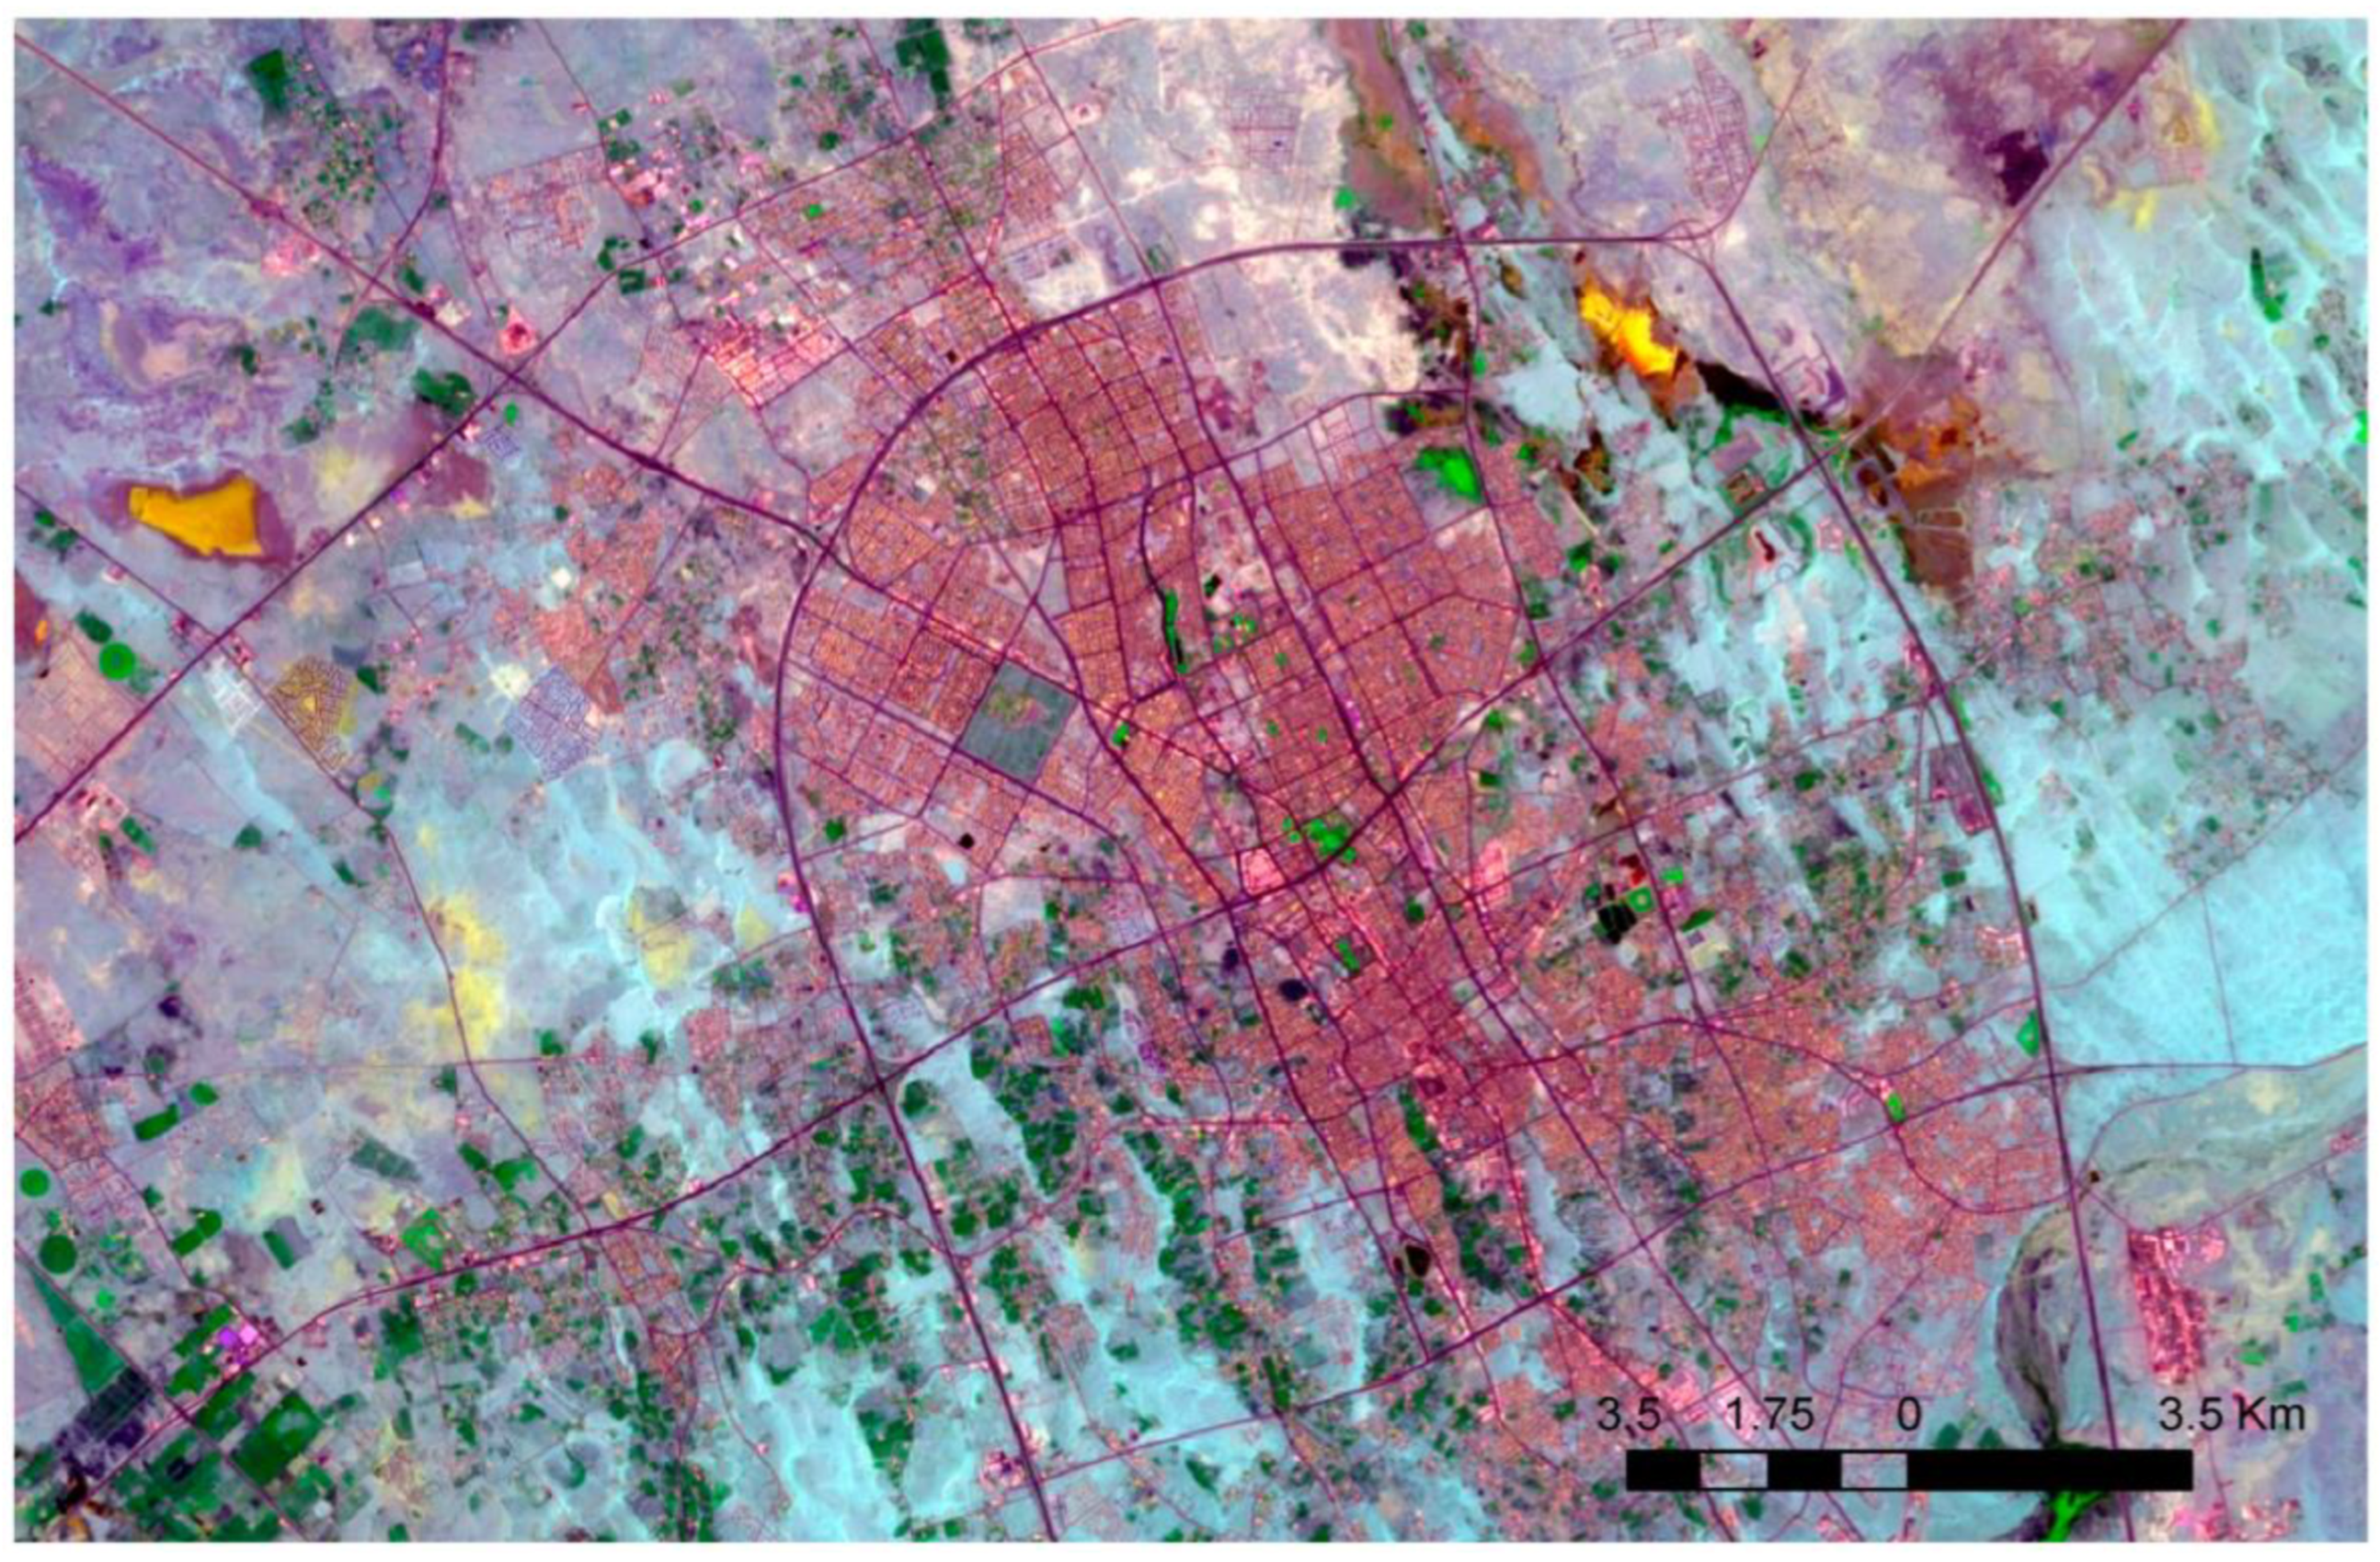
2.1. Study Area
2.2. Method
2.2.1. Data
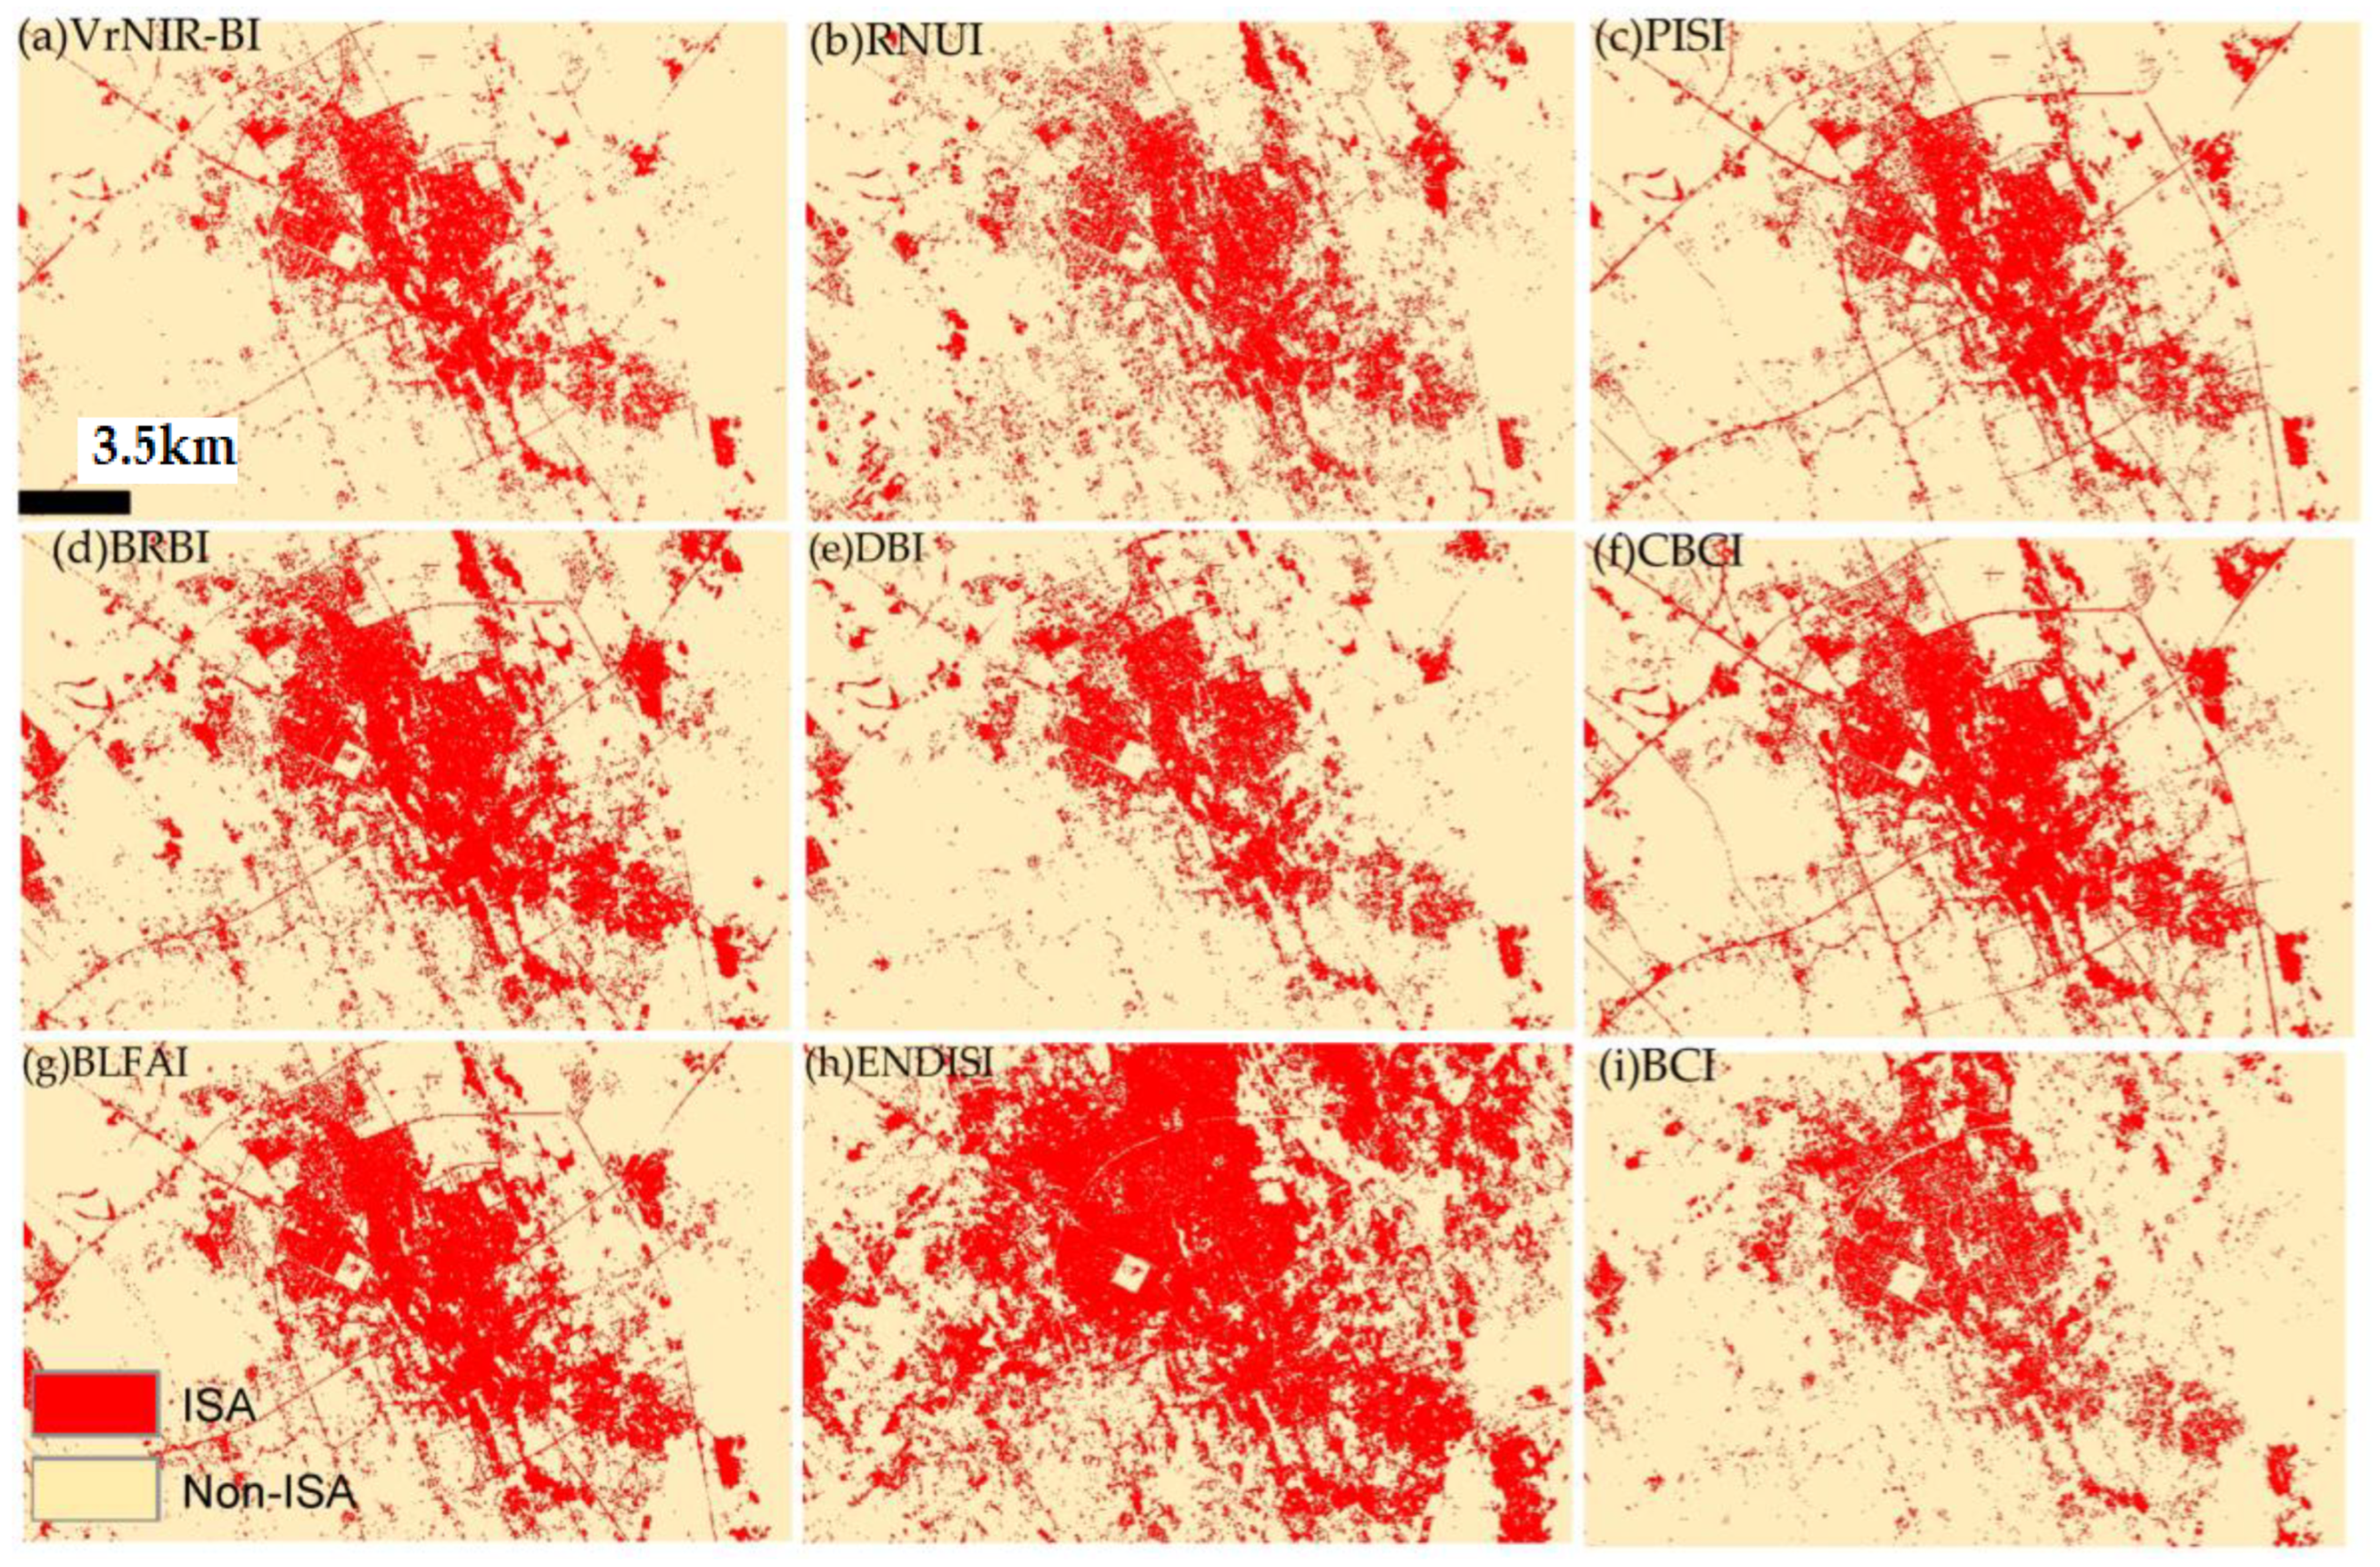
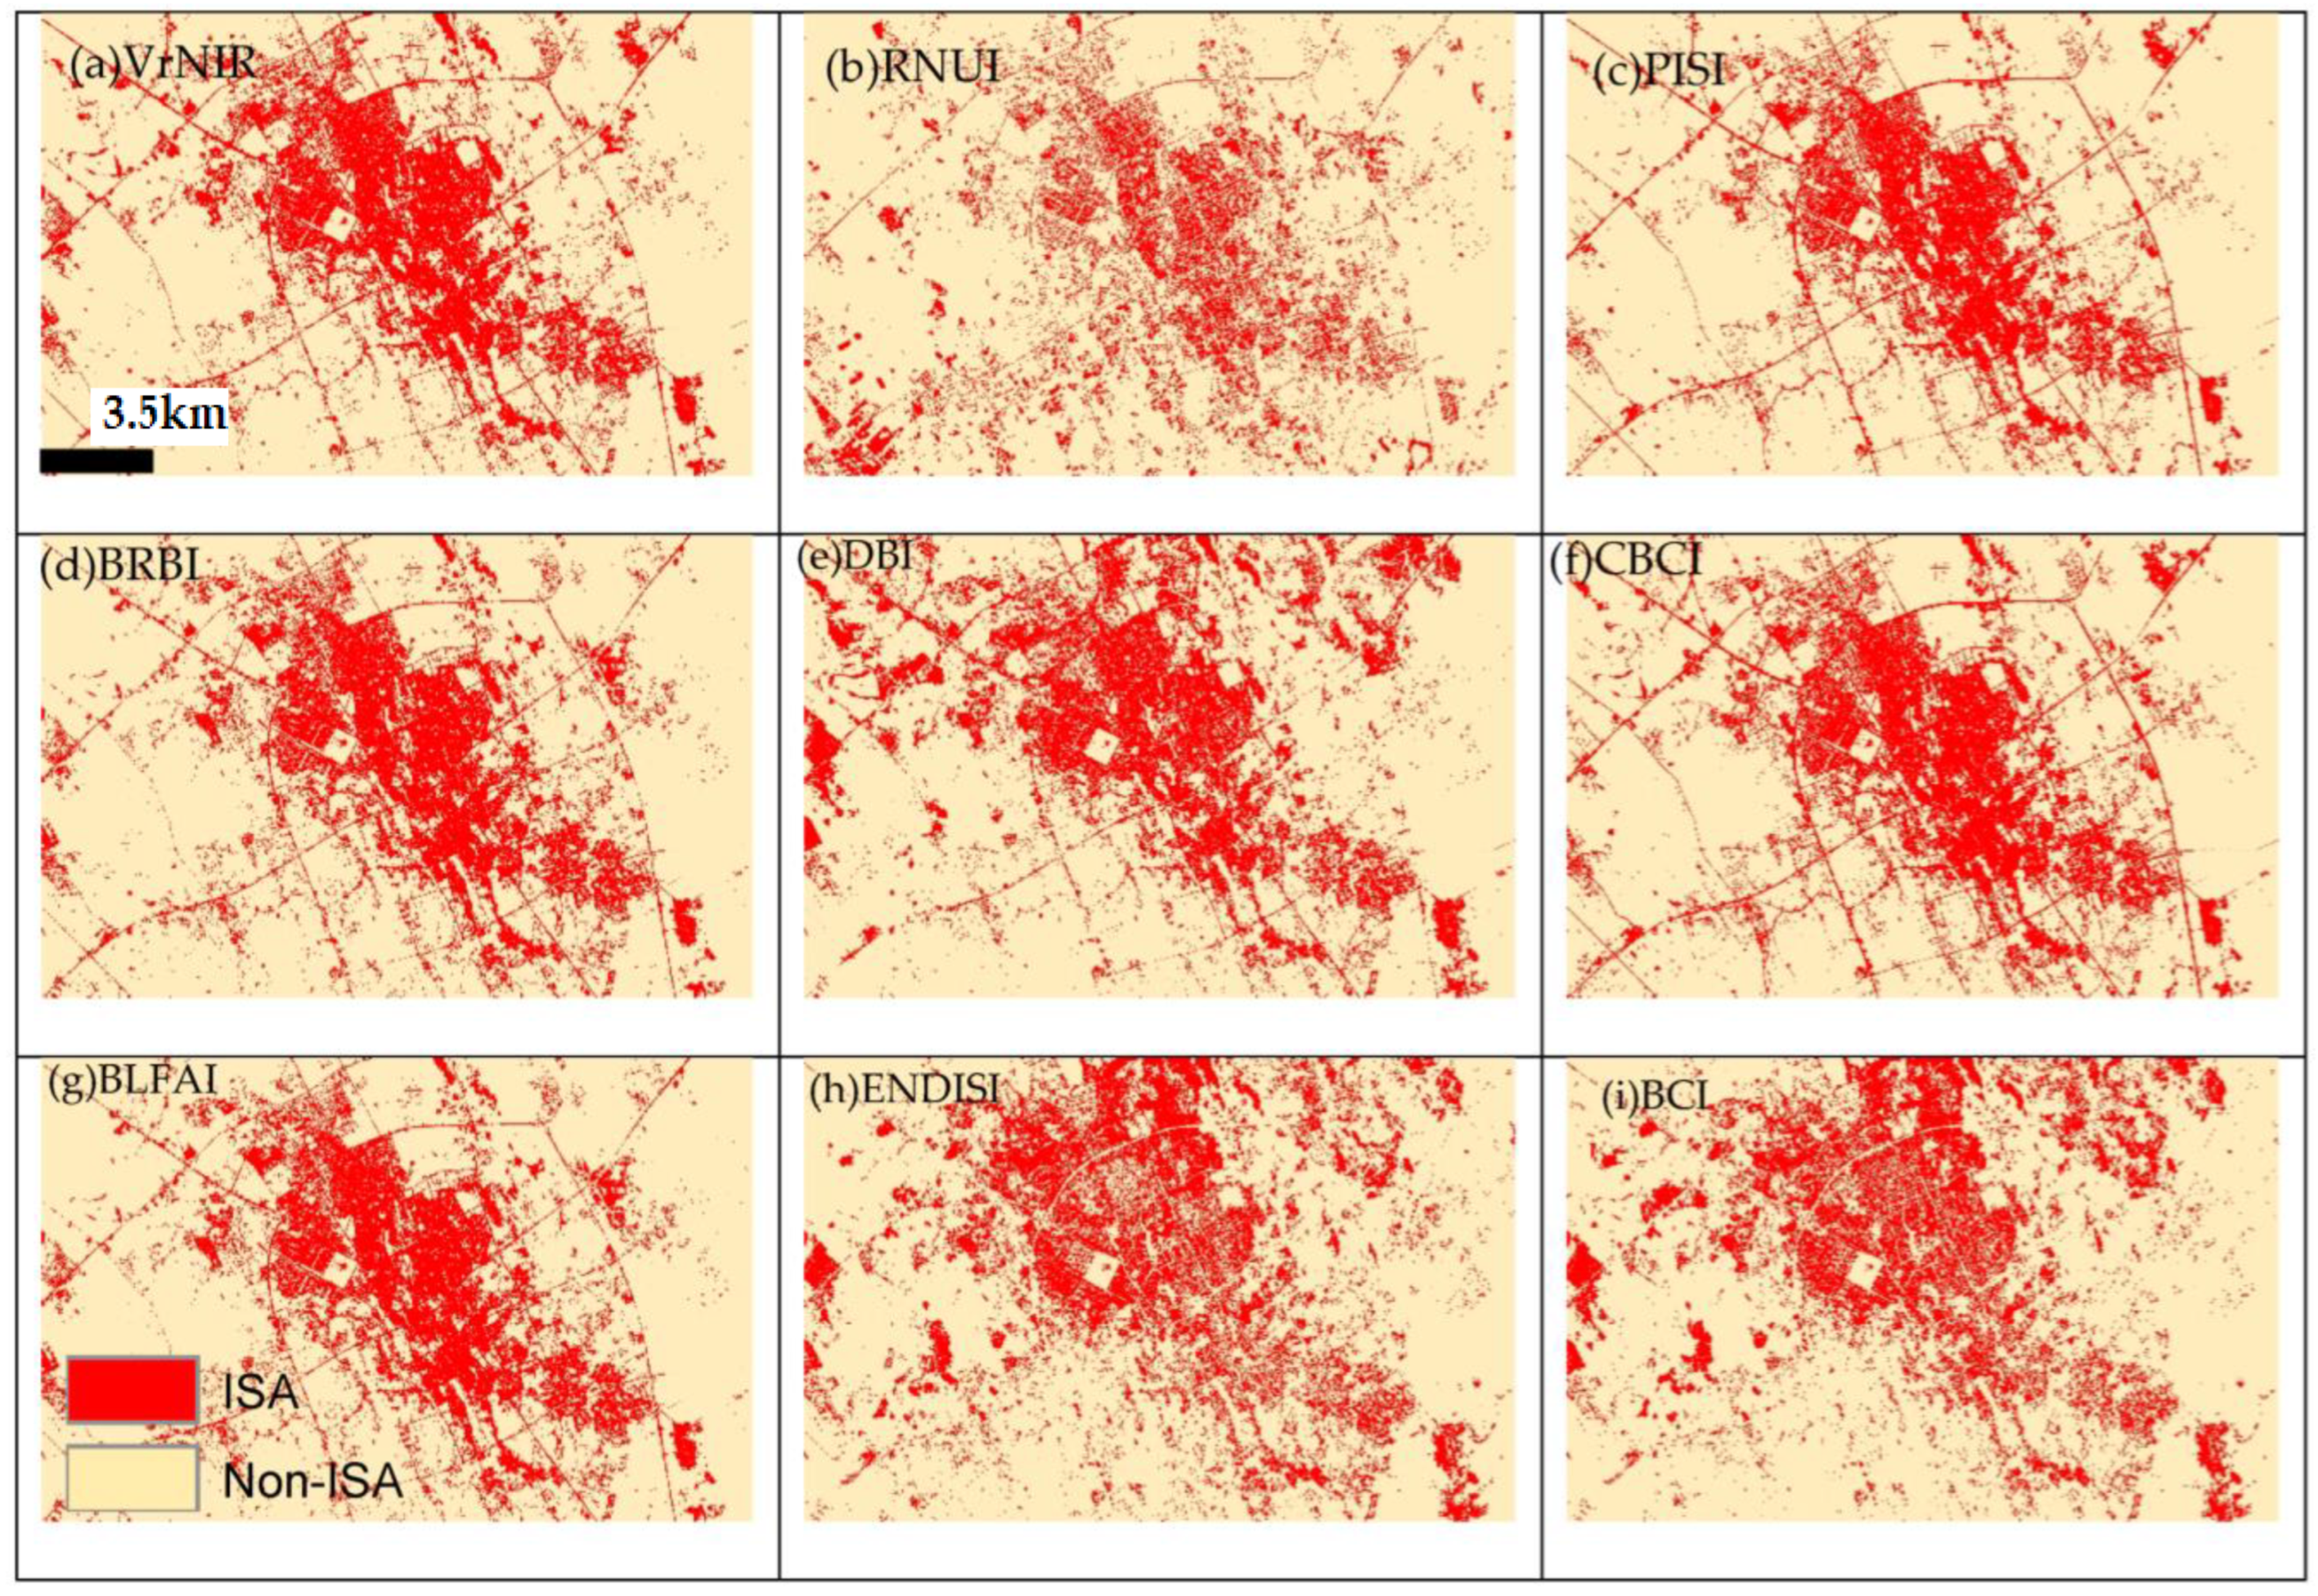
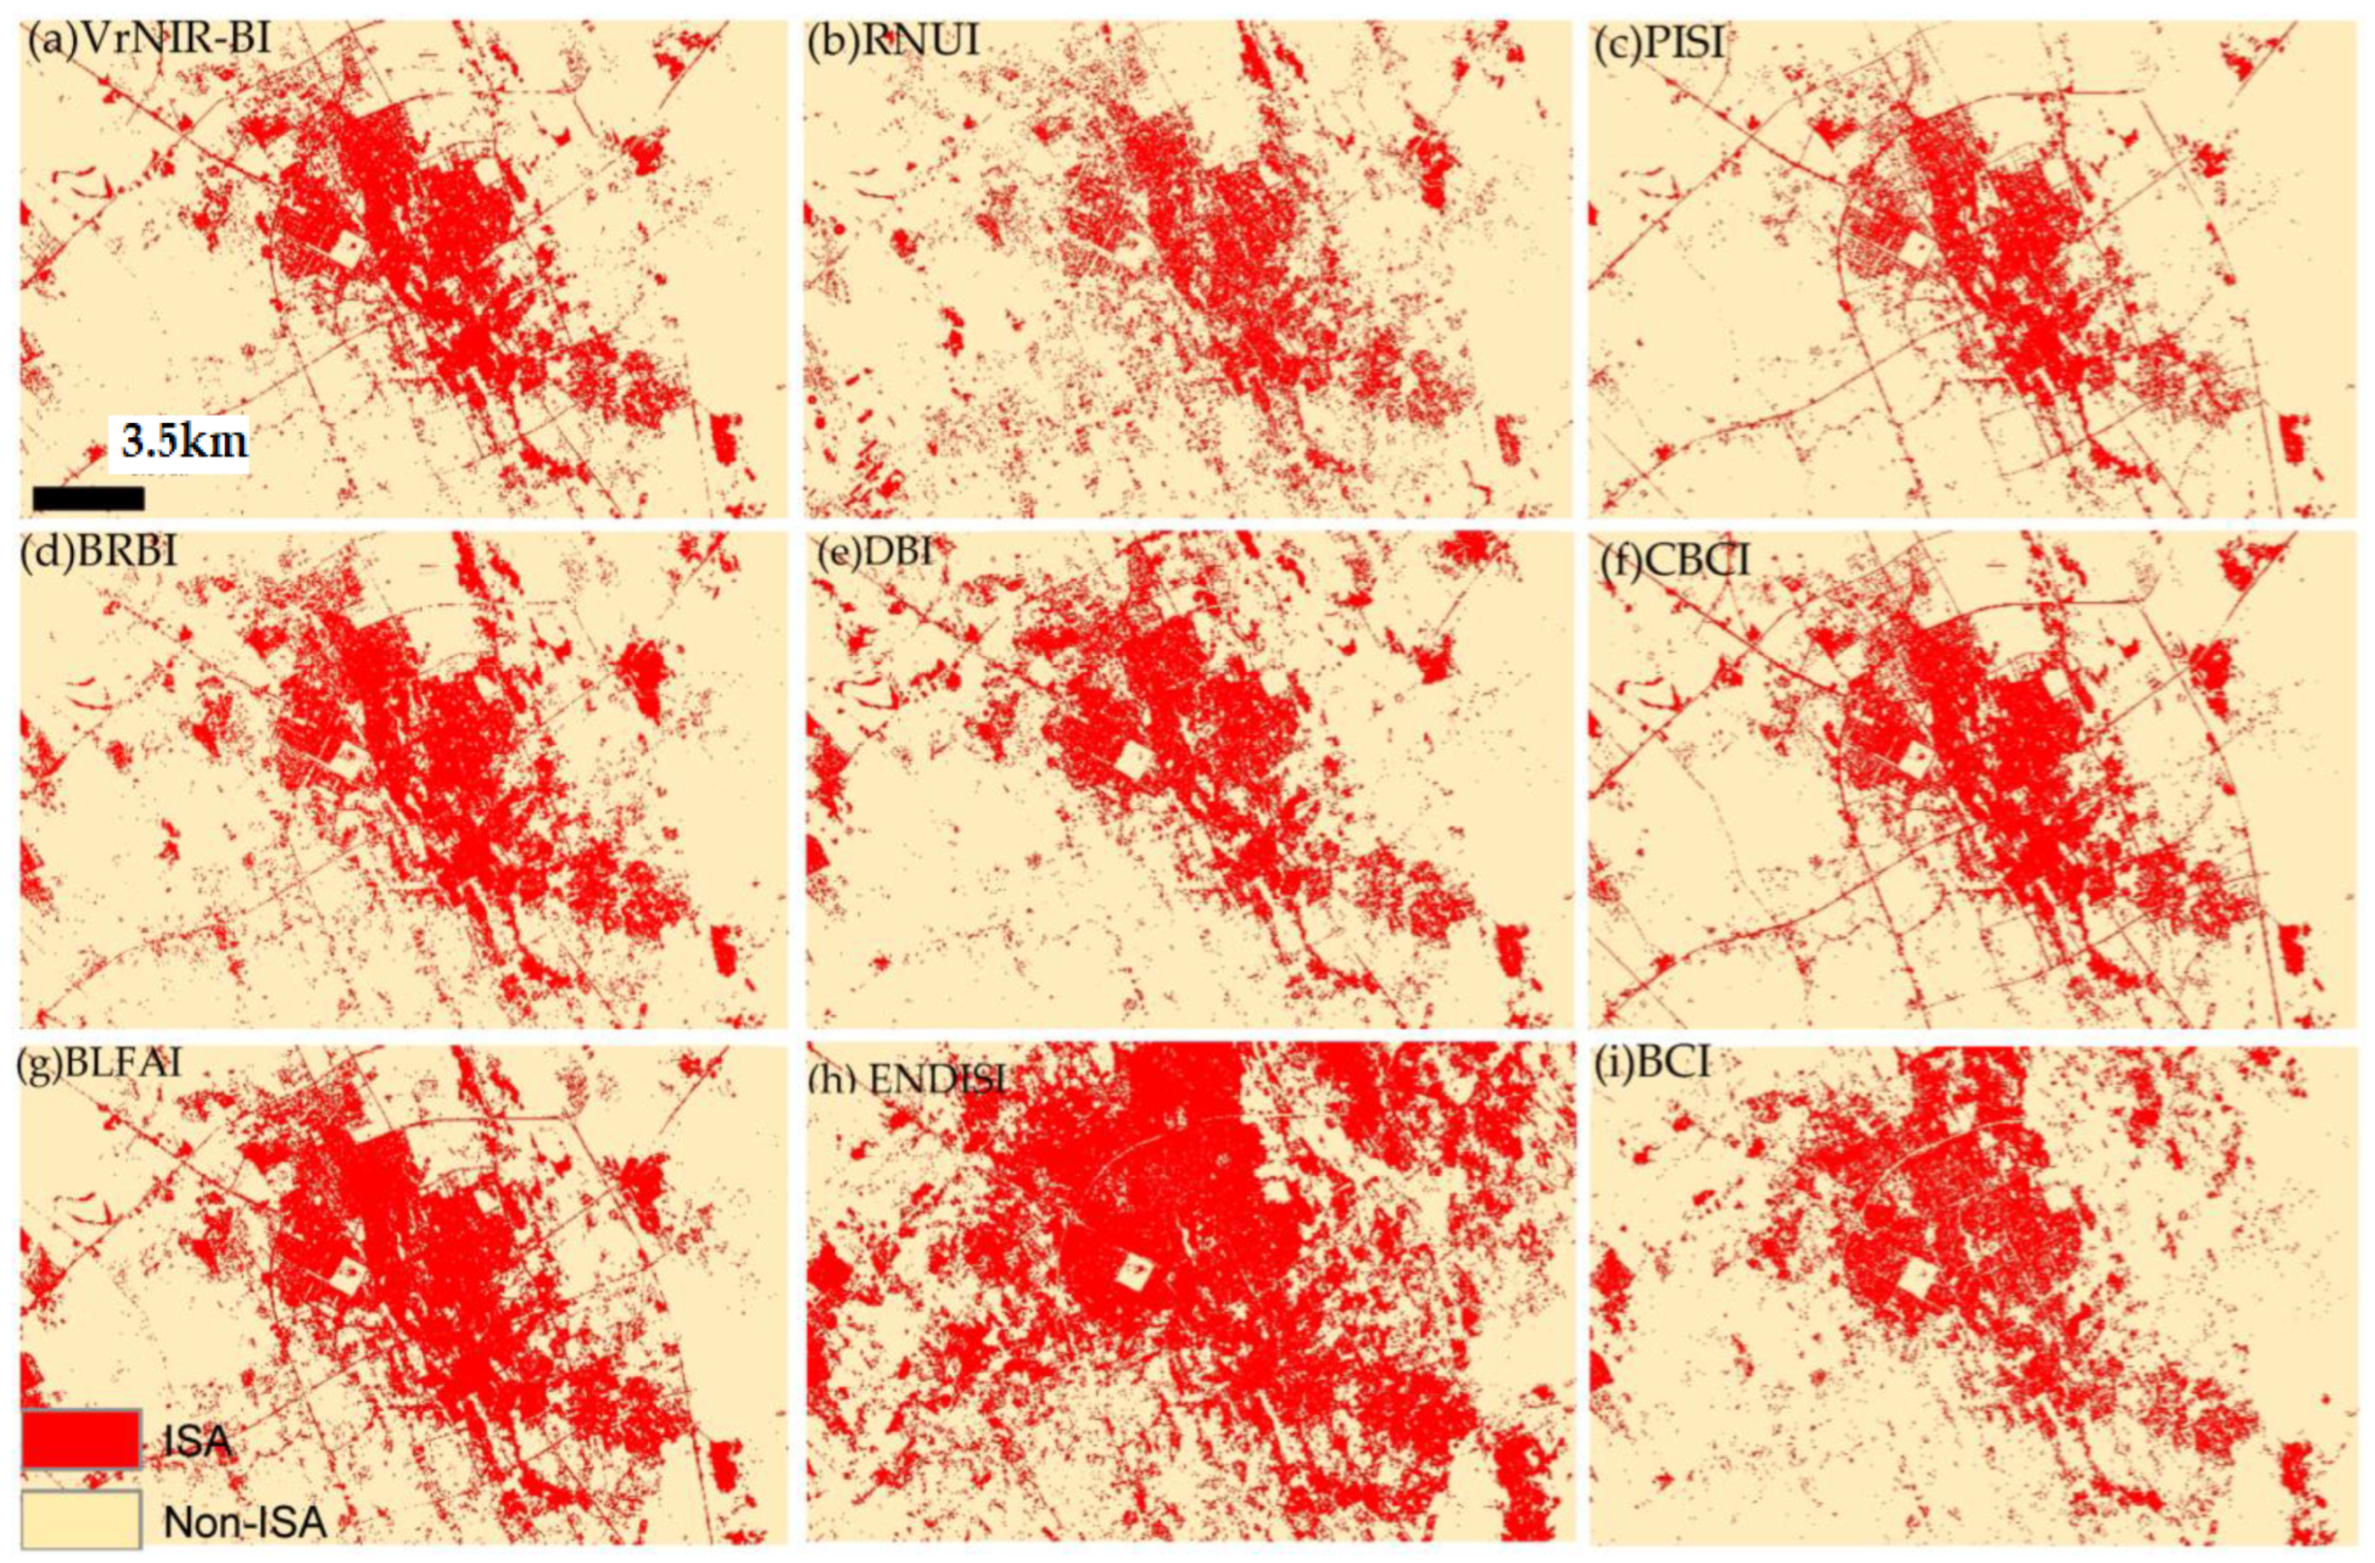
Impervious Surface Indices
- The biophysical composition index (BCI): the BCI was proposed by Deng and Wu [40] to identify different urban biophysical compositions based on the Tasseled Cap (TC) transform, a transformation able to compress spectral information from multiple bands into fewer space scenes, highlighting spectral characteristics of different land cover types [3]. It is calculated as:
- Built-up land features extraction index (BLFEI): Bouhennache et al. [33] developed a built-up land features extraction index (BLFEI) using green, red, SWIR1, and SWIR2 operational land imager (OLI) bands. Because asphalt-like roads and arid soil have nearly similar spectral responses for the spectrum from NIR to SWIR1, the NIR spectral channel was not utilized. In BLFEI, vegetation had the lowest value, while water had the greatest. The values of impervious surface areas were lower than water and higher than bare soil areas. It is calculated as:
- Perpendicular Impervious Surface Index (PISI): Tian et al. (2018) [34] proposed a reference line equation known as the PISI, which distinguishes ISA from bare soil, using feature spaces in the blue and NIR bands. Though it uses only two bands, it has higher accuracy in separating the impervious area from the bare soil area up to this point in time. PISI performed significantly better than the BCI and NDBI indices. It applies to most optical sensors due to the use of only blue and NIR bands. The example of PISI can be replicated in numerous other RS applications. Similar to BBI, PISI increases the separability between ISA and bare soil and between ISA and vegetation areas. The formula for PISI can be expressed as follows:
- City Biophysical Component Index (CBCI): The modified bare soil index (MBSI) and optimized soil adjusted vegetation index (OSAVI) were merged by Zhang et al. [27] to create the city biophysical component index (CBCI), which effectively shows the four major biophysical components of cities. The following are the formulas:
- Band ratio for built-up area (BRBA): Waqar et al. introduced two new BRBA [24] that were employed to extract the built-up areas of Islamabad city, Pakistan. Here, BRBA used red and only one SWIR band. The study claimed to increase built-up extraction accuracy by 10–13% compared to NDBI and NBI. BRBA is computed according to the expression:
- Dry buildup index (DBI): Rasul et al. [4] suggested a DBI based on Landsat OLI blue and thermal bands. The DBI assumes that built-up regions have less vegetation and, therefore, low NDVI values. Therefore, a reduction in NDVI can further improve the characteristics of built-up areas. DBI has an overall classification accuracy for urban areas of 93% for an arid climate, as is the case in the city of Erbil. DBI is not suitable in densely forested urban areas. There are several limitations to the thermal data that must be considered before use: The spectral difference in thermal bands is small and often shows phenological and diurnal differences between urban and non-urban areas.
- Enhanced Normalized Difference Impervious Surfaces Index (ENDISI): Chen et al. [41] developed the enhanced normalized difference impervious surface index (ENDISI) to amplify the difference between impervious surfaces (ISs) and pervious surfaces (PSs), where preprocessing, such as removing waterbodies, is not required. The SWIR-1 band to SWIR-2 band ratio, the MNDWI, and the blue band are chosen by ENDISI as enhancement and inhibitor factors, respectively. The equation is how ENDISI is written (9):
- Normalized Ratio Urban Index (NRUI) Piyoosh and Ghosh [31] have proposed the NRUI, and they have mentioned that using the panchromatic (PAN) band (Band 8) of Landsat 8 data leads to an overall improvement in discriminating between ISA, bare soil, and vegetation. Subsequently, the MNDSI was utilized to develop a new normalized ratio urban index (NRUI) by improving the capability of the BCI in two phases. First, a ratio urban index (RUI) was developed, which discriminates urban and soil better than the BCI. Second, the RUI was further improved, which then became known as NRUI and is able to distinguish urban areas from the ground even better than the RUI.
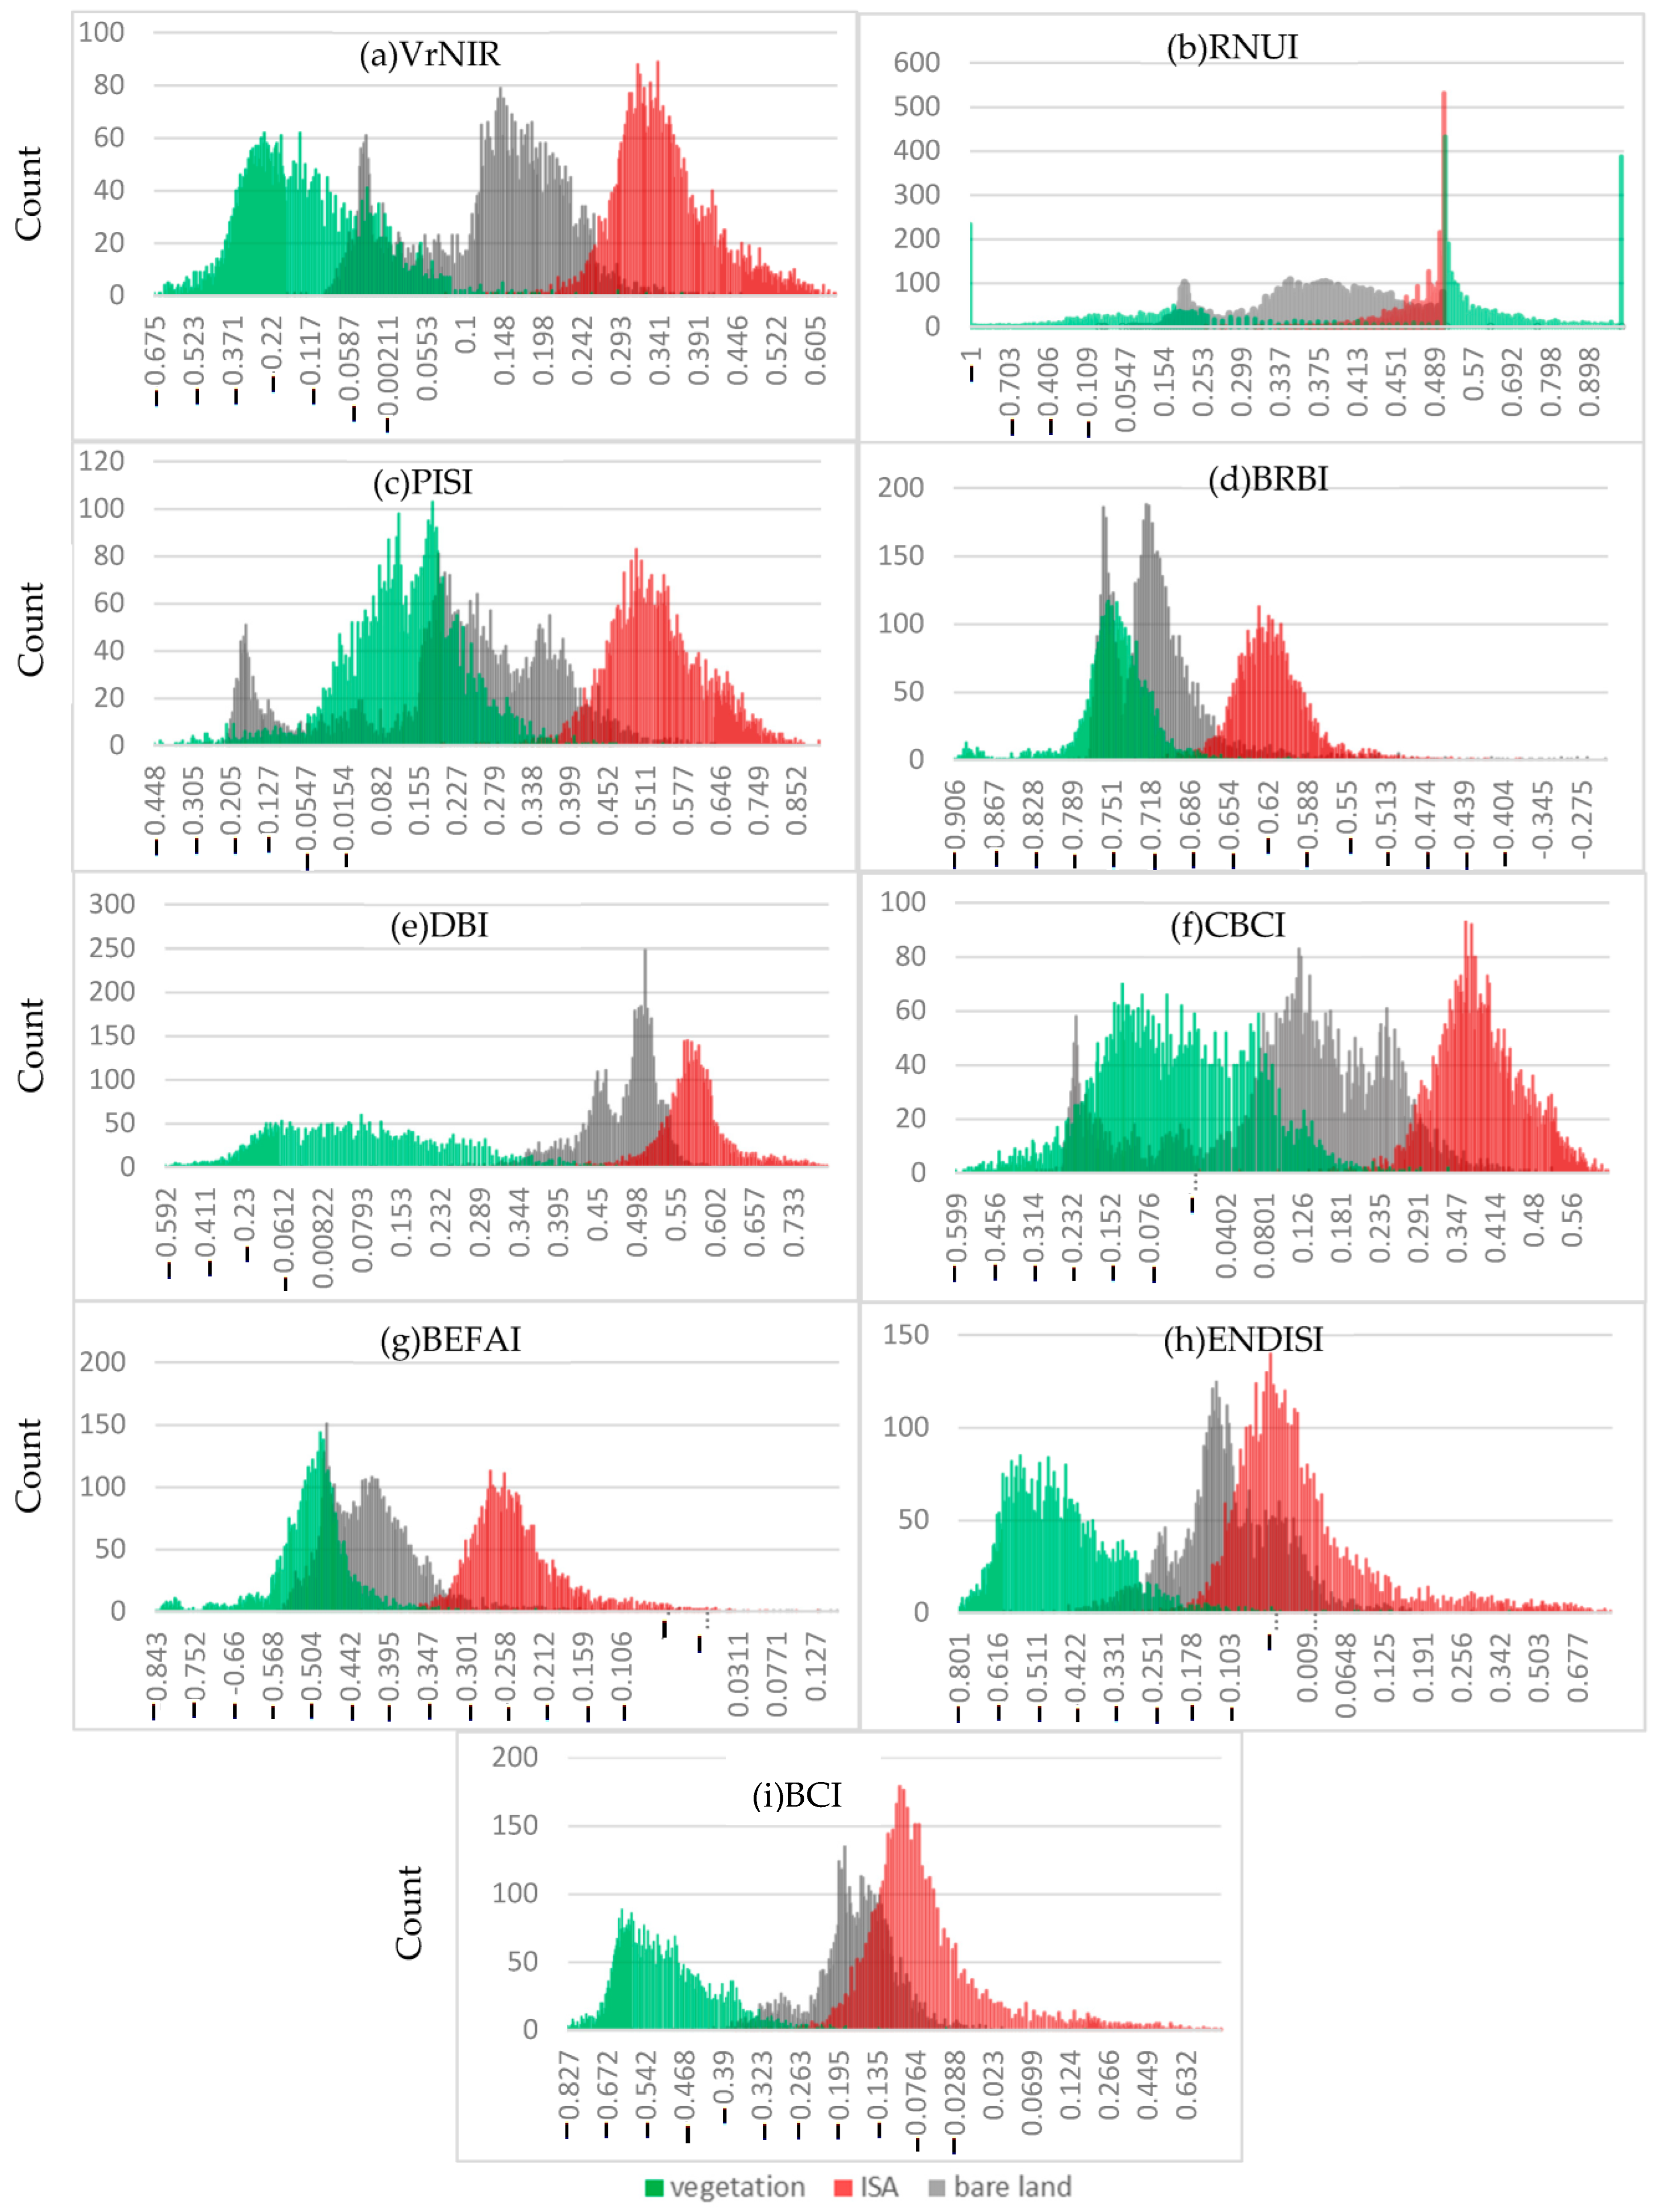
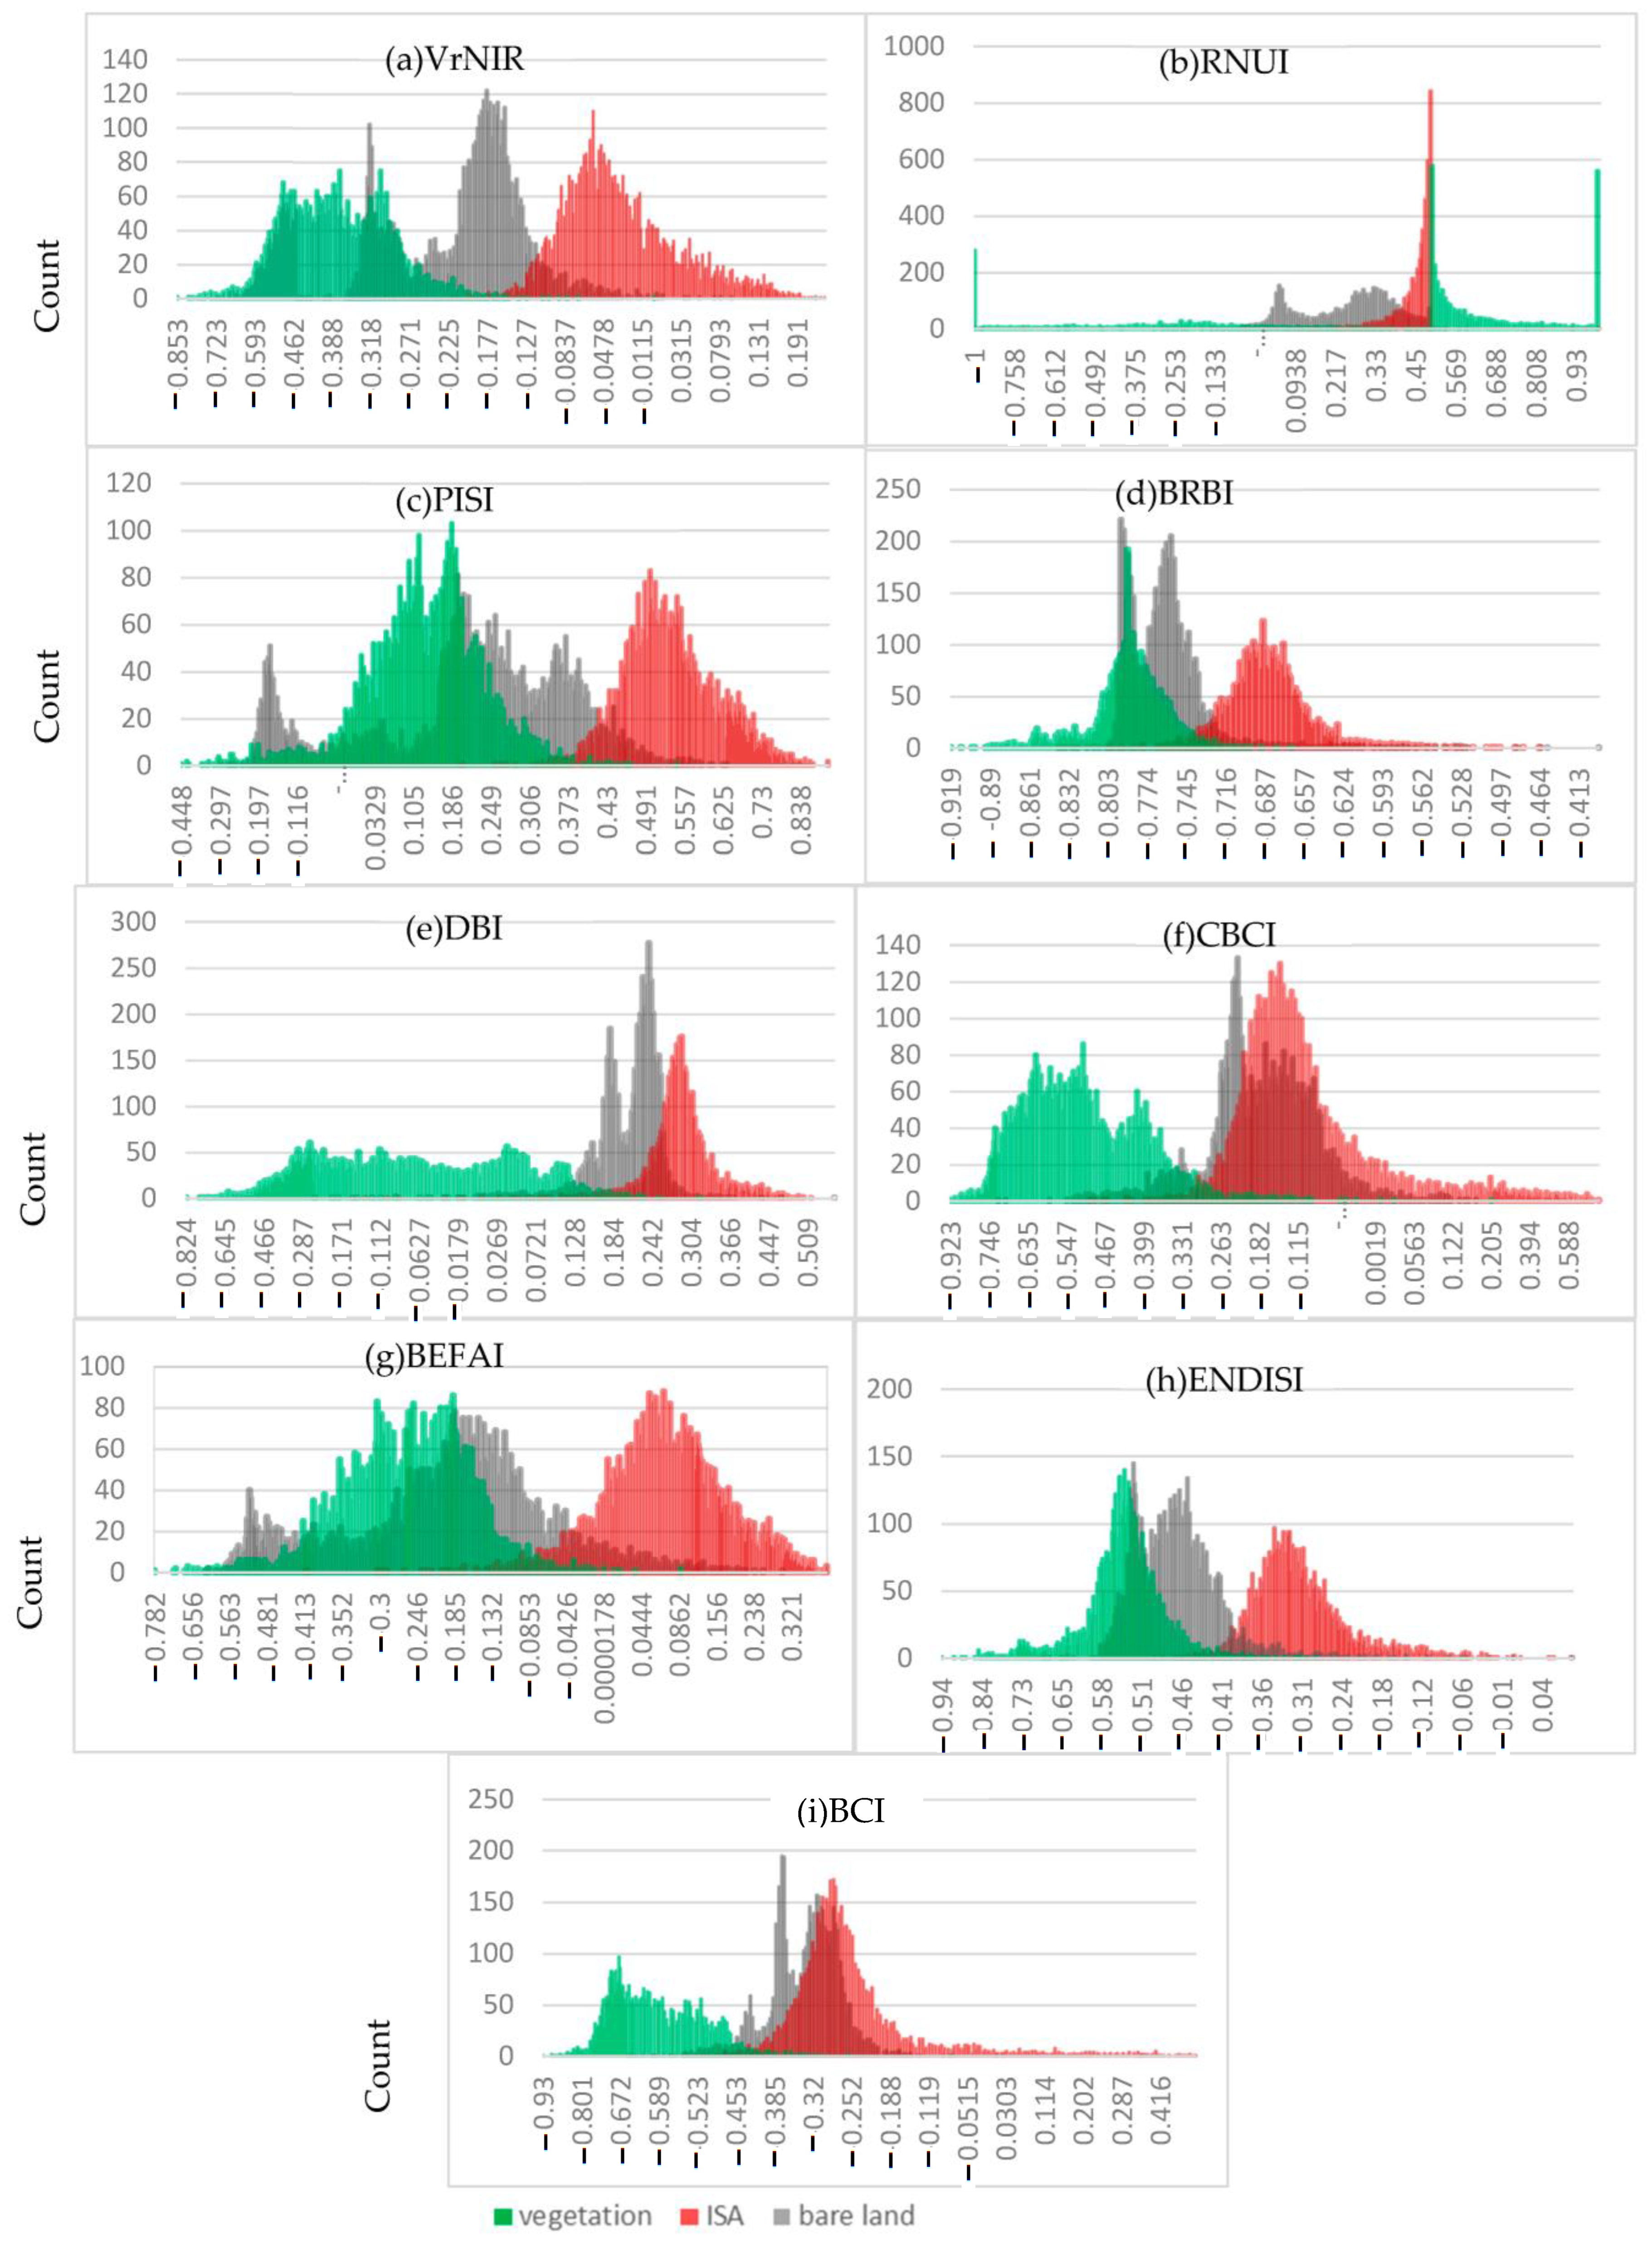
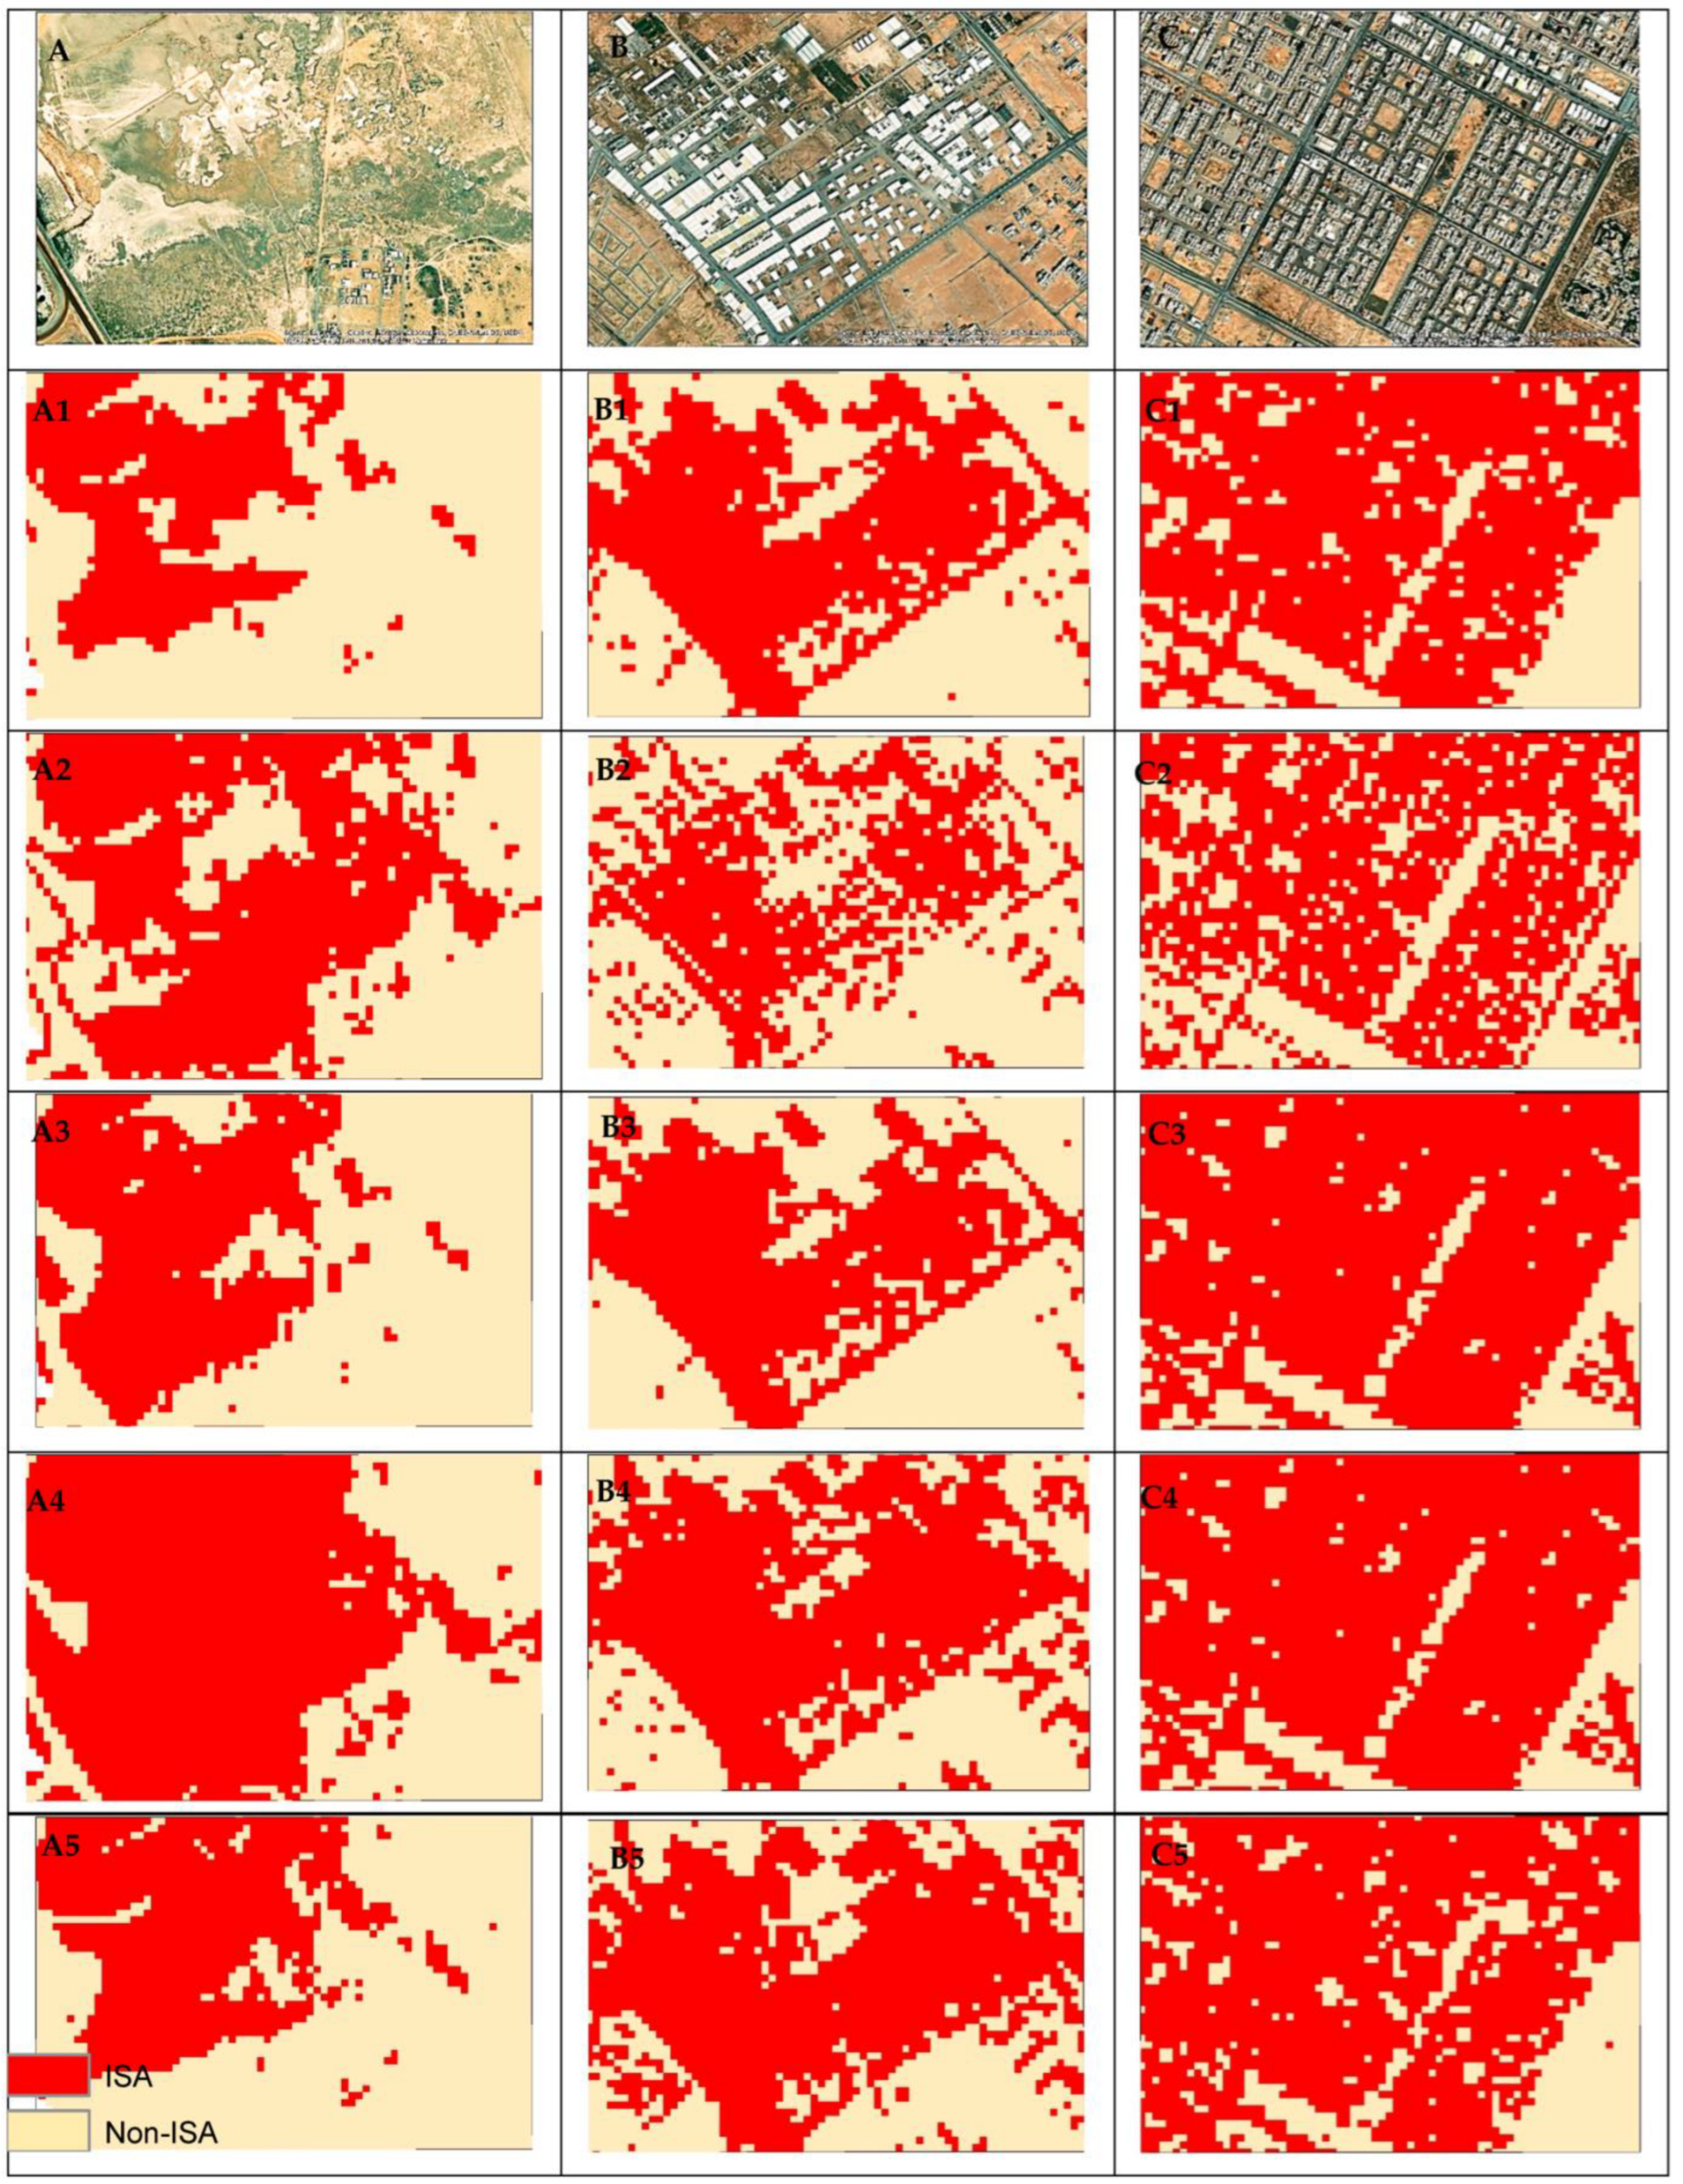
2.2.2. Separability Analysis
Accuracies Assessment
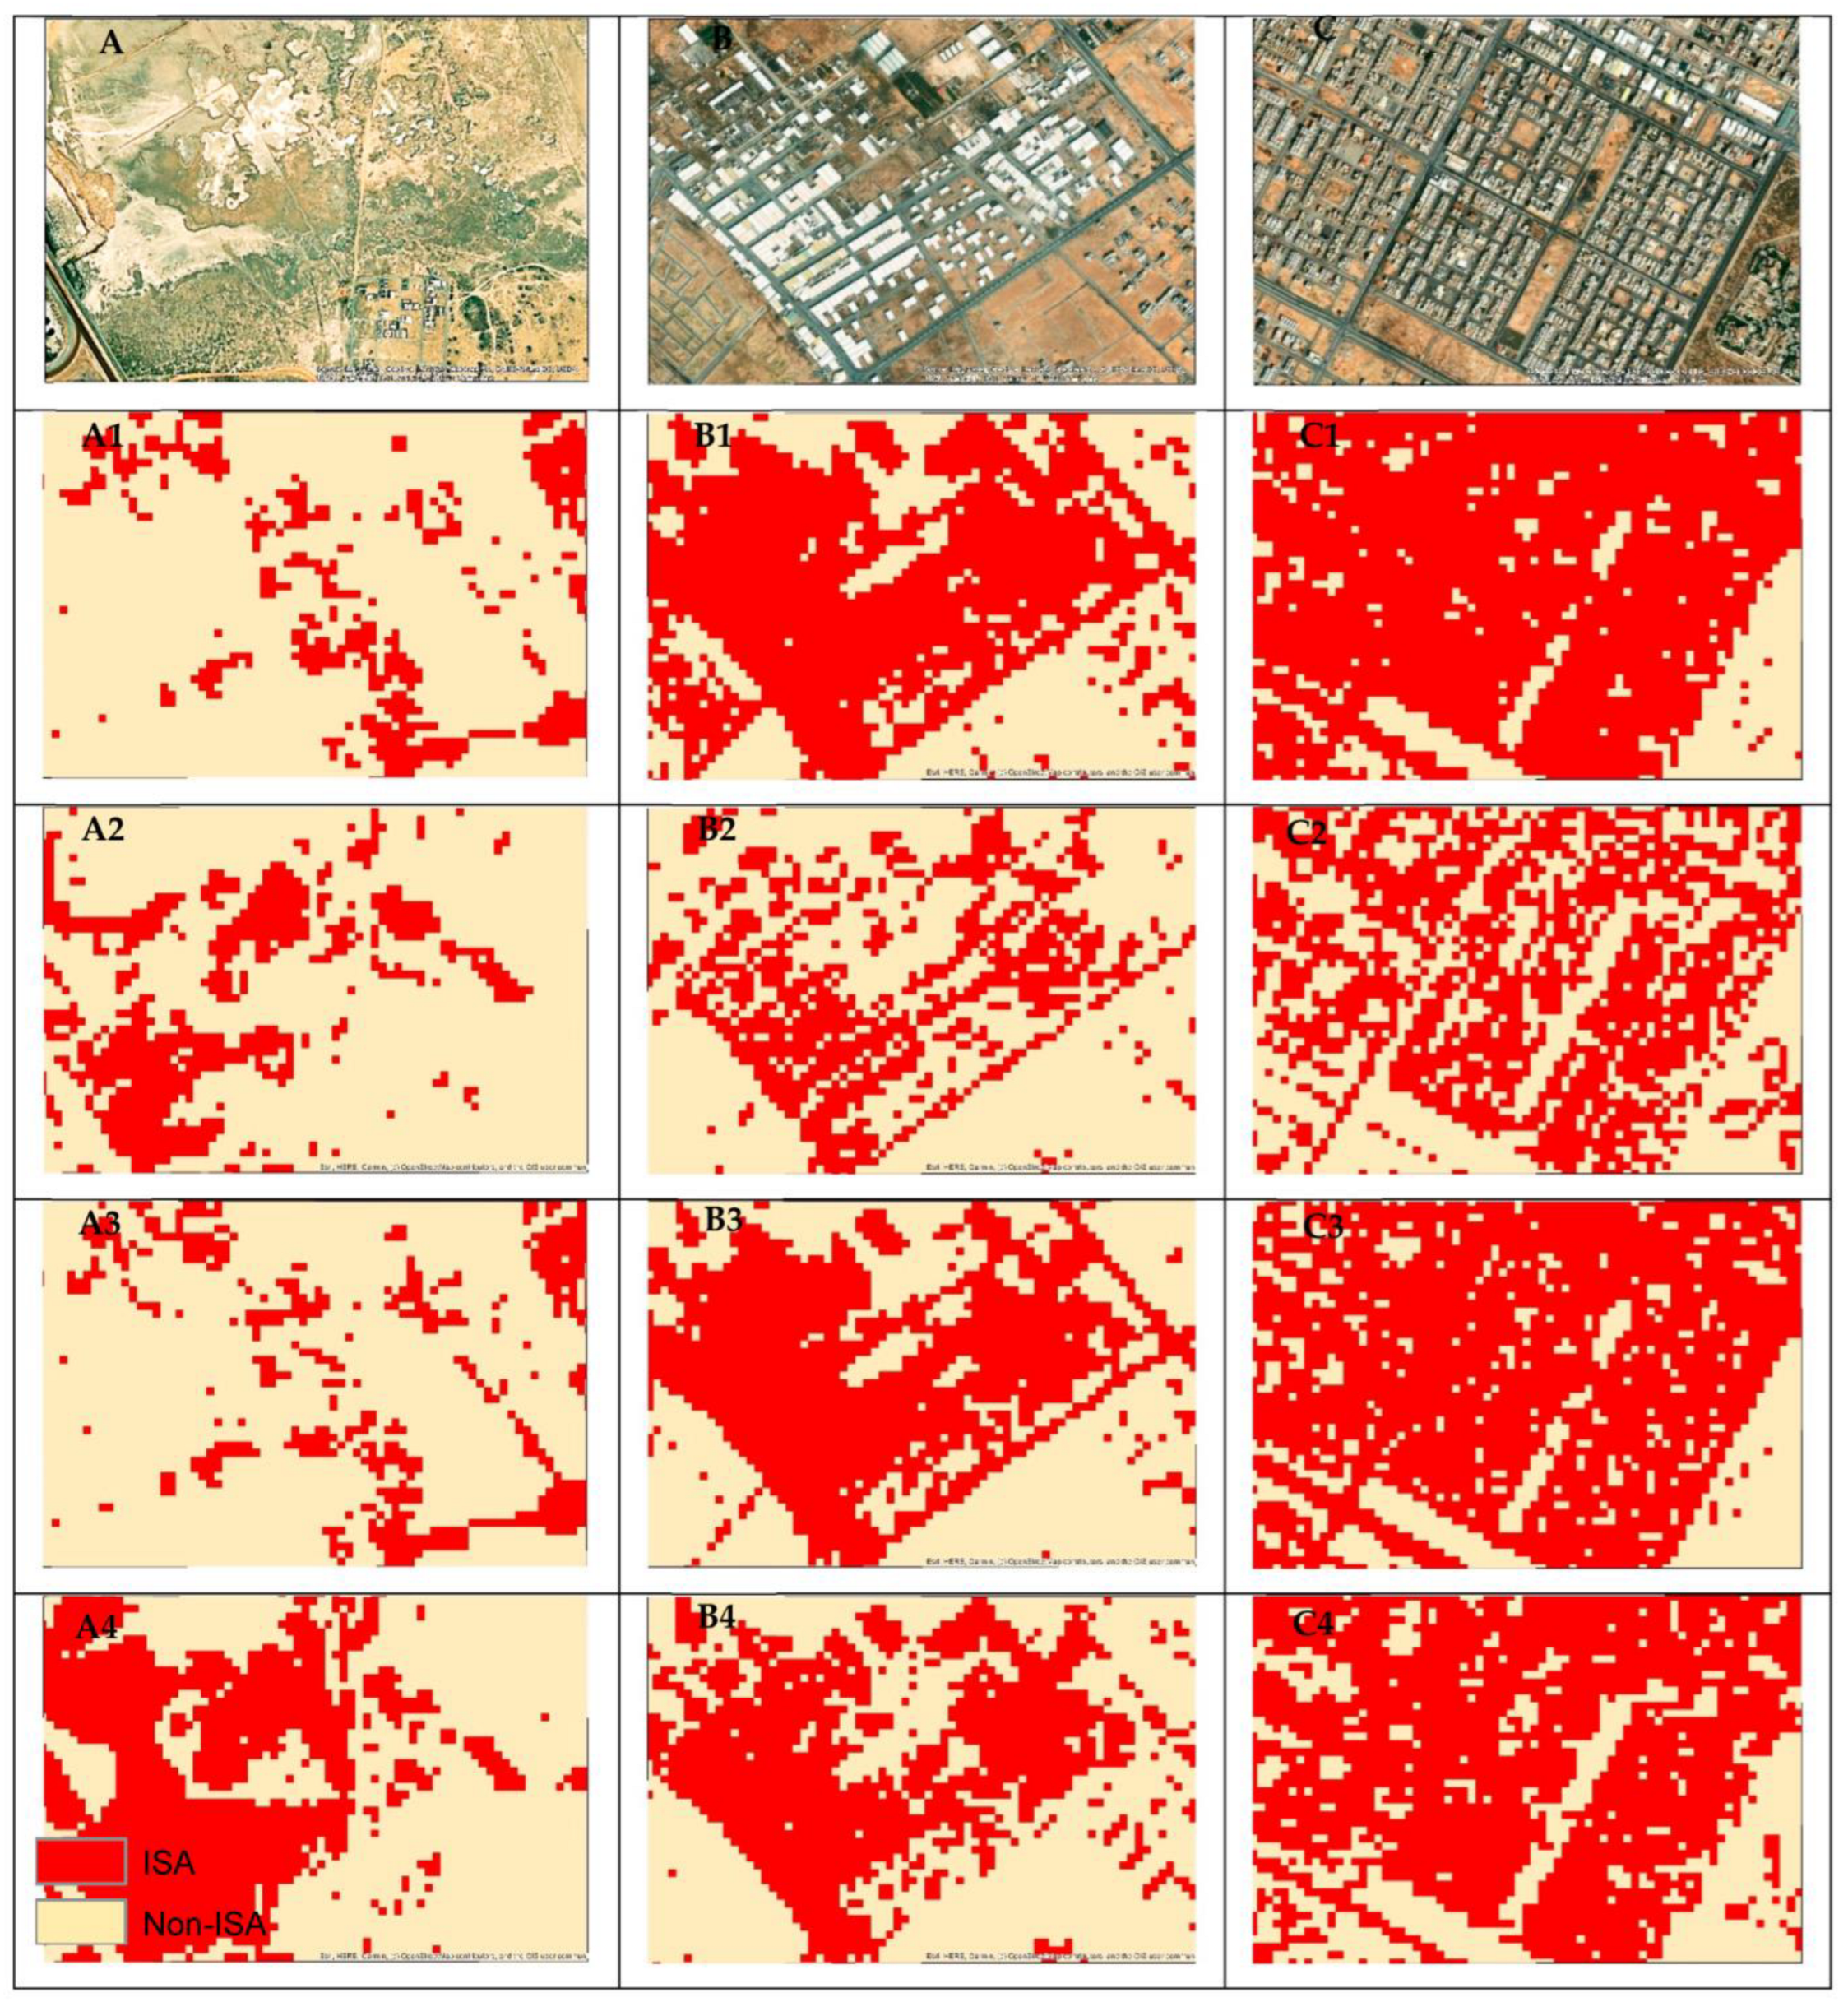
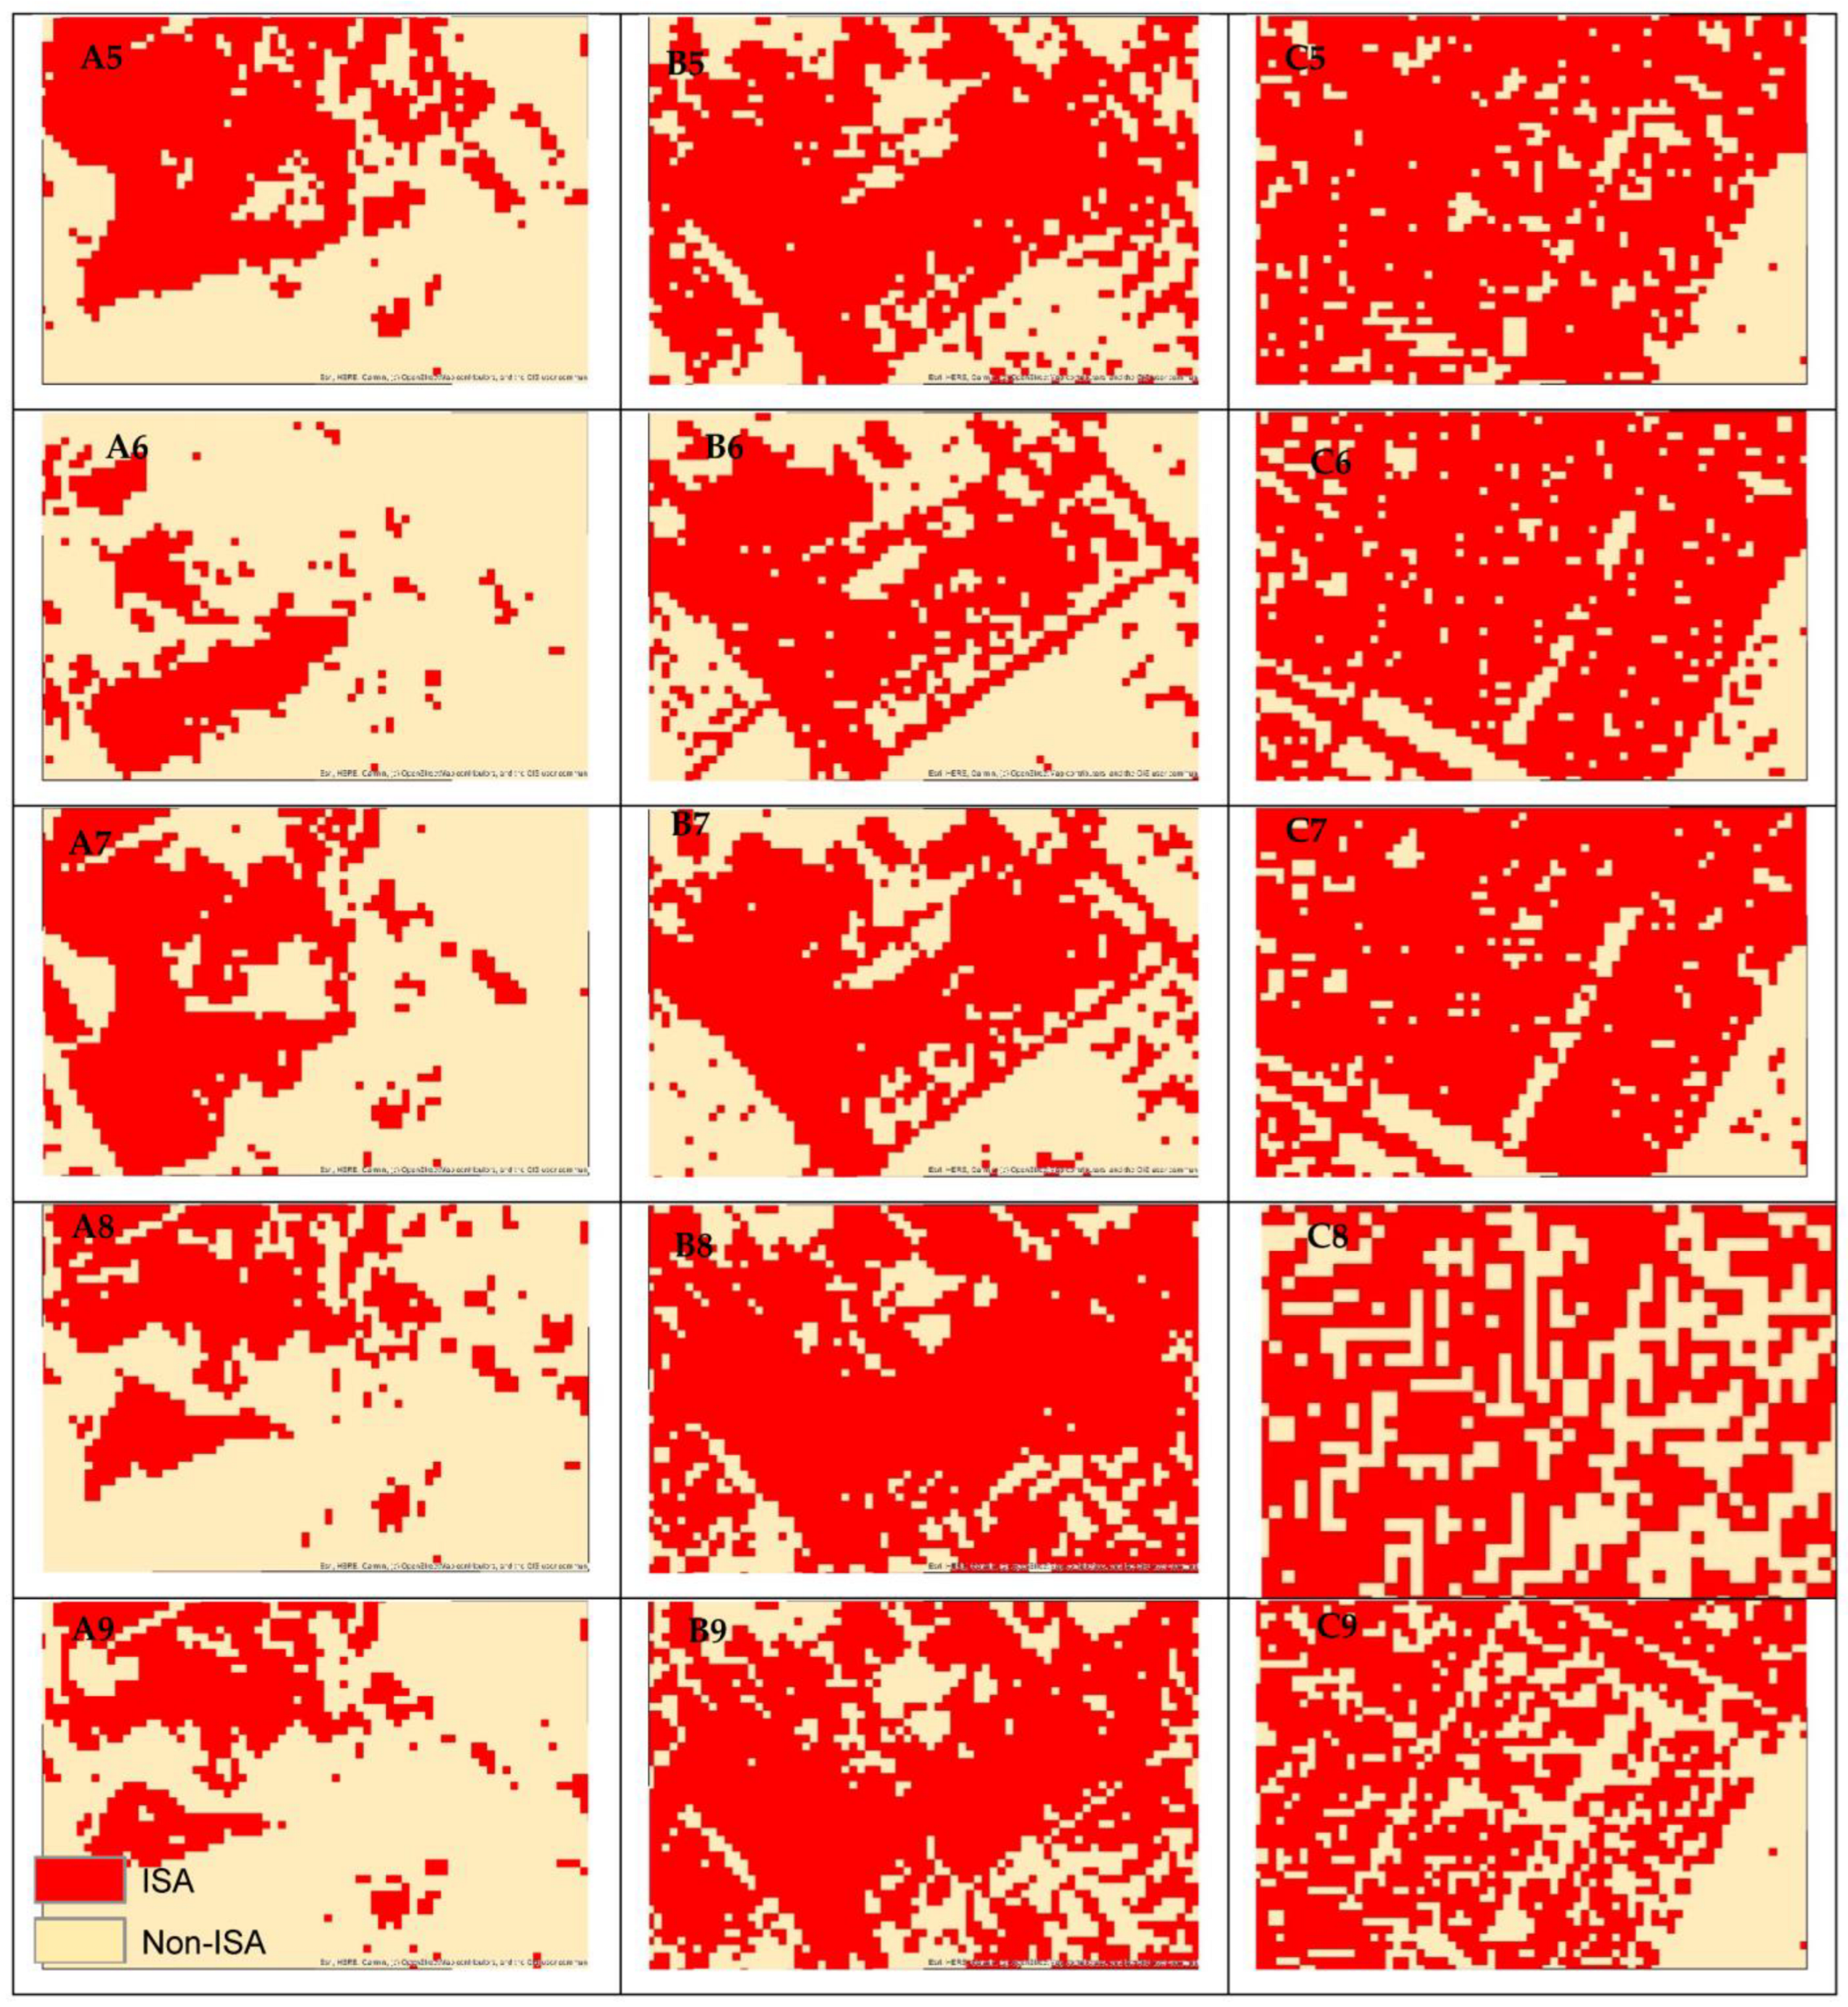
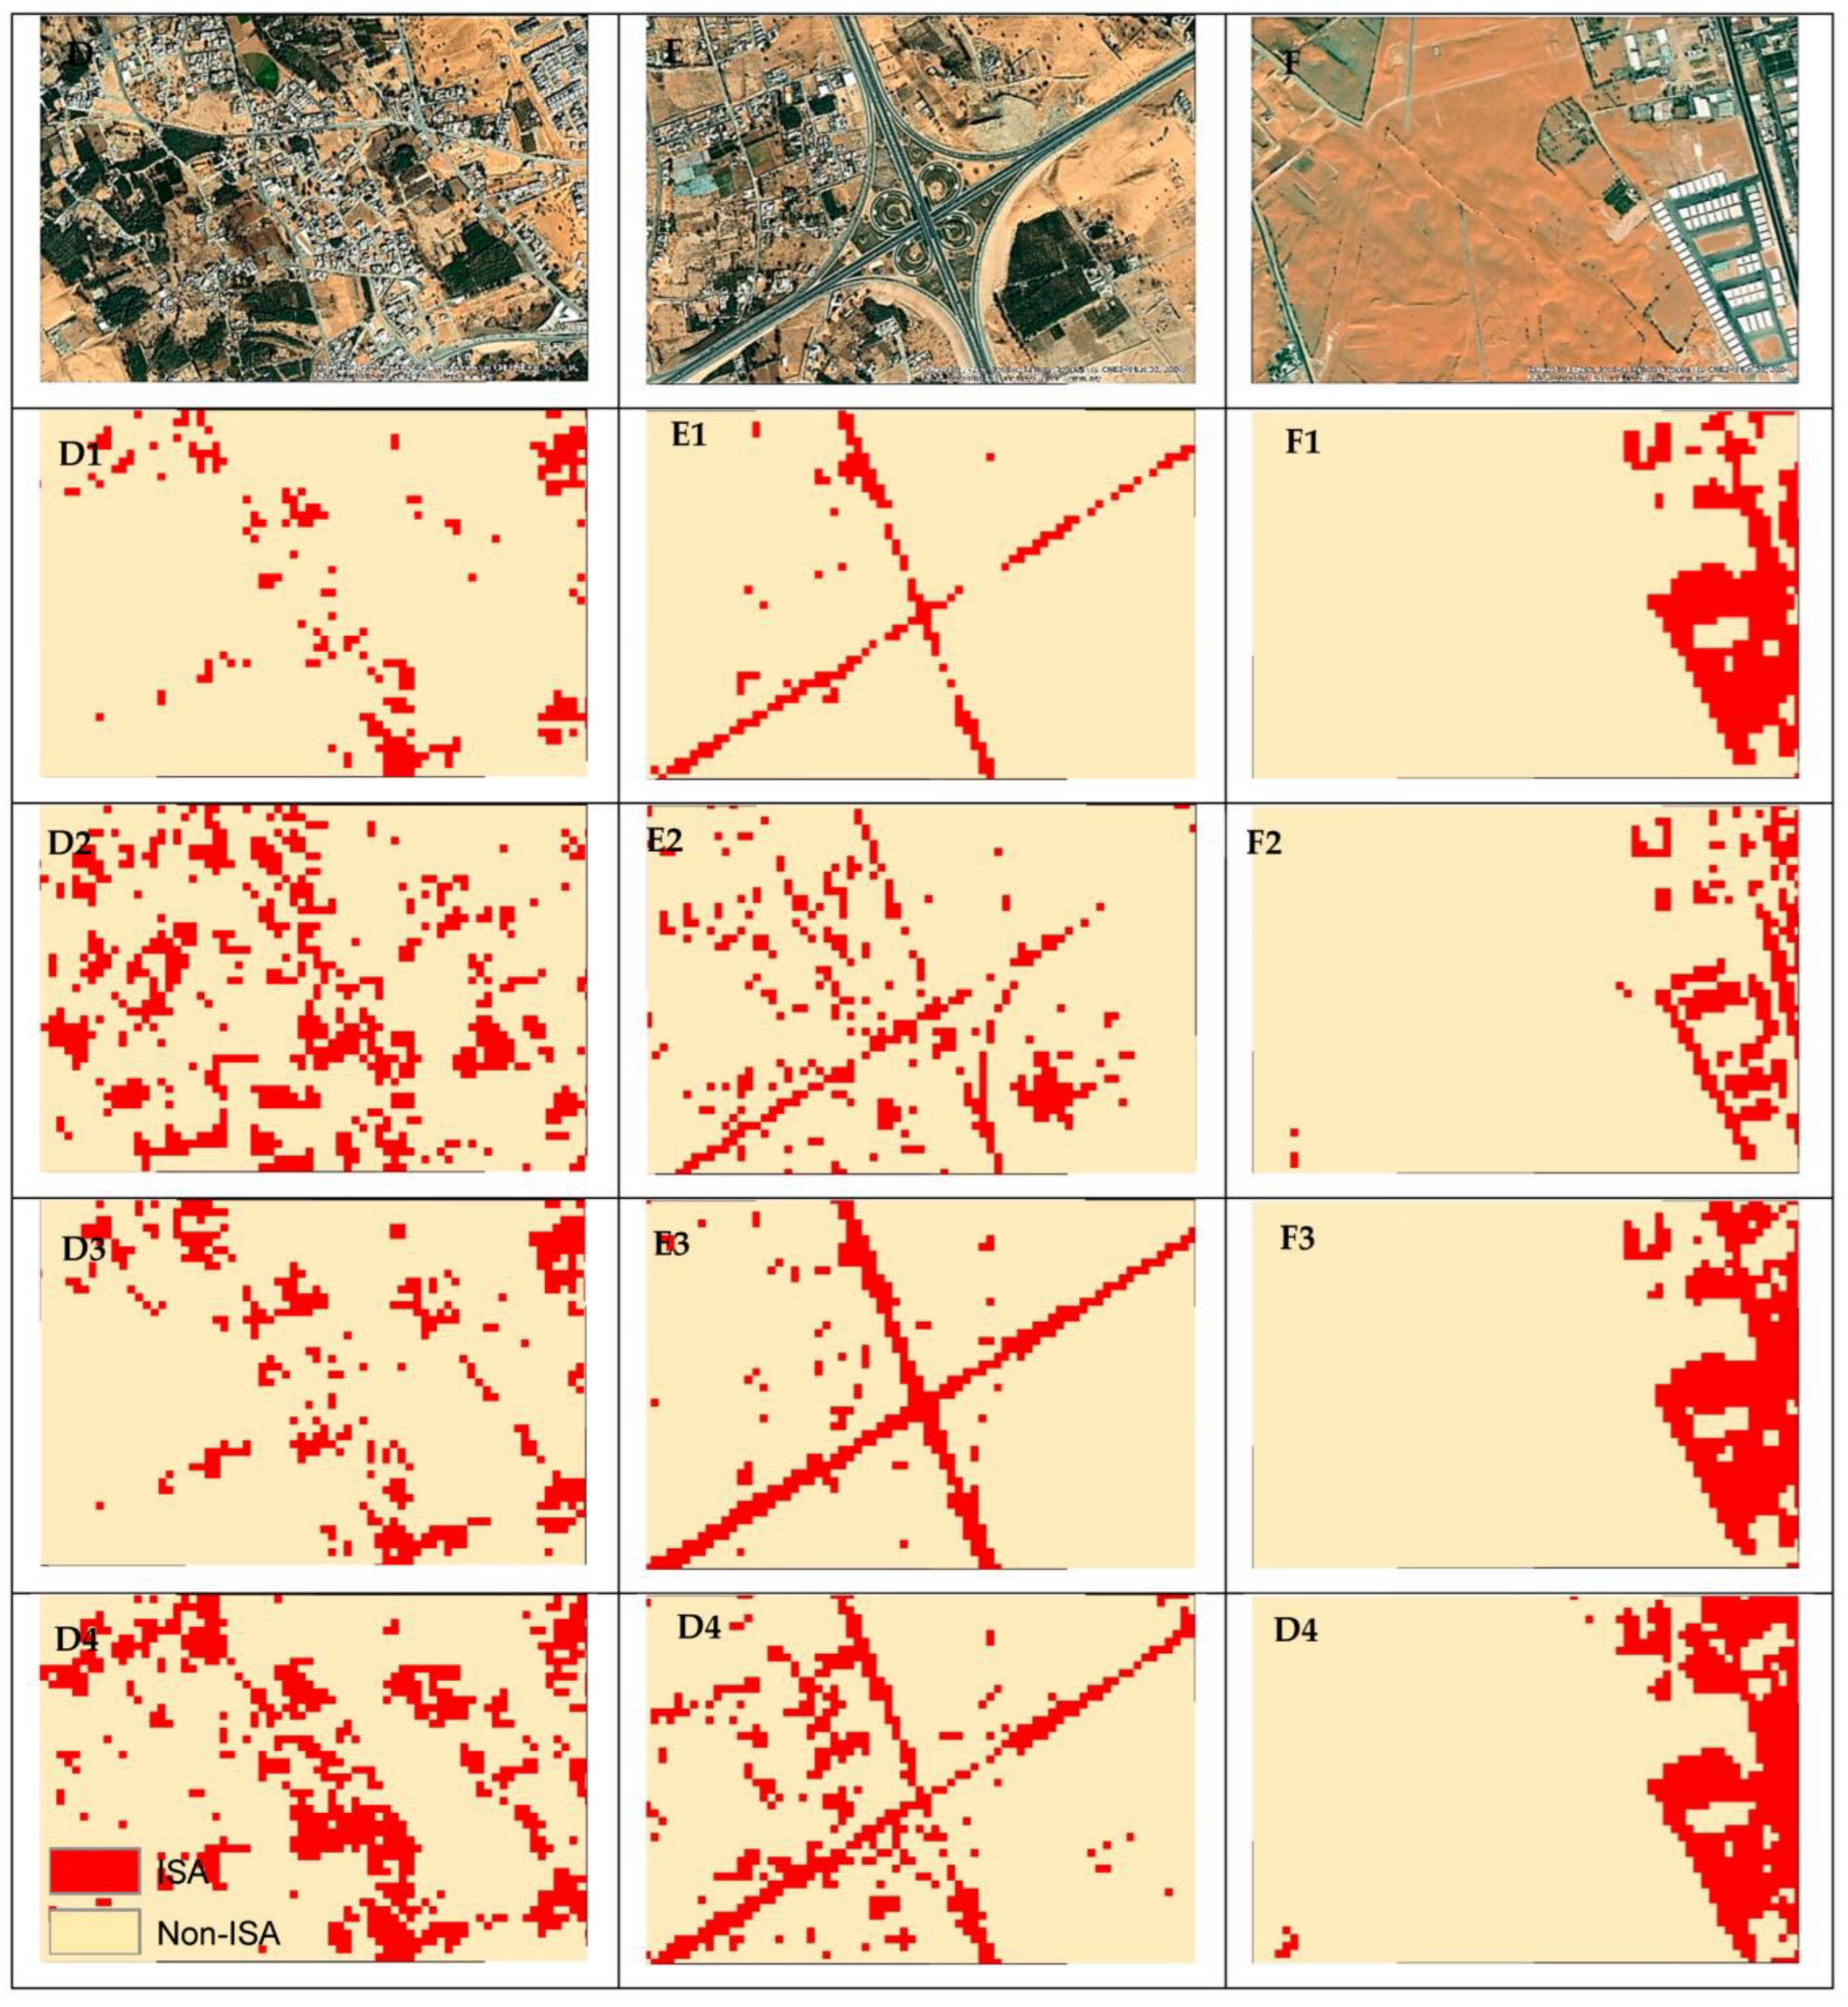
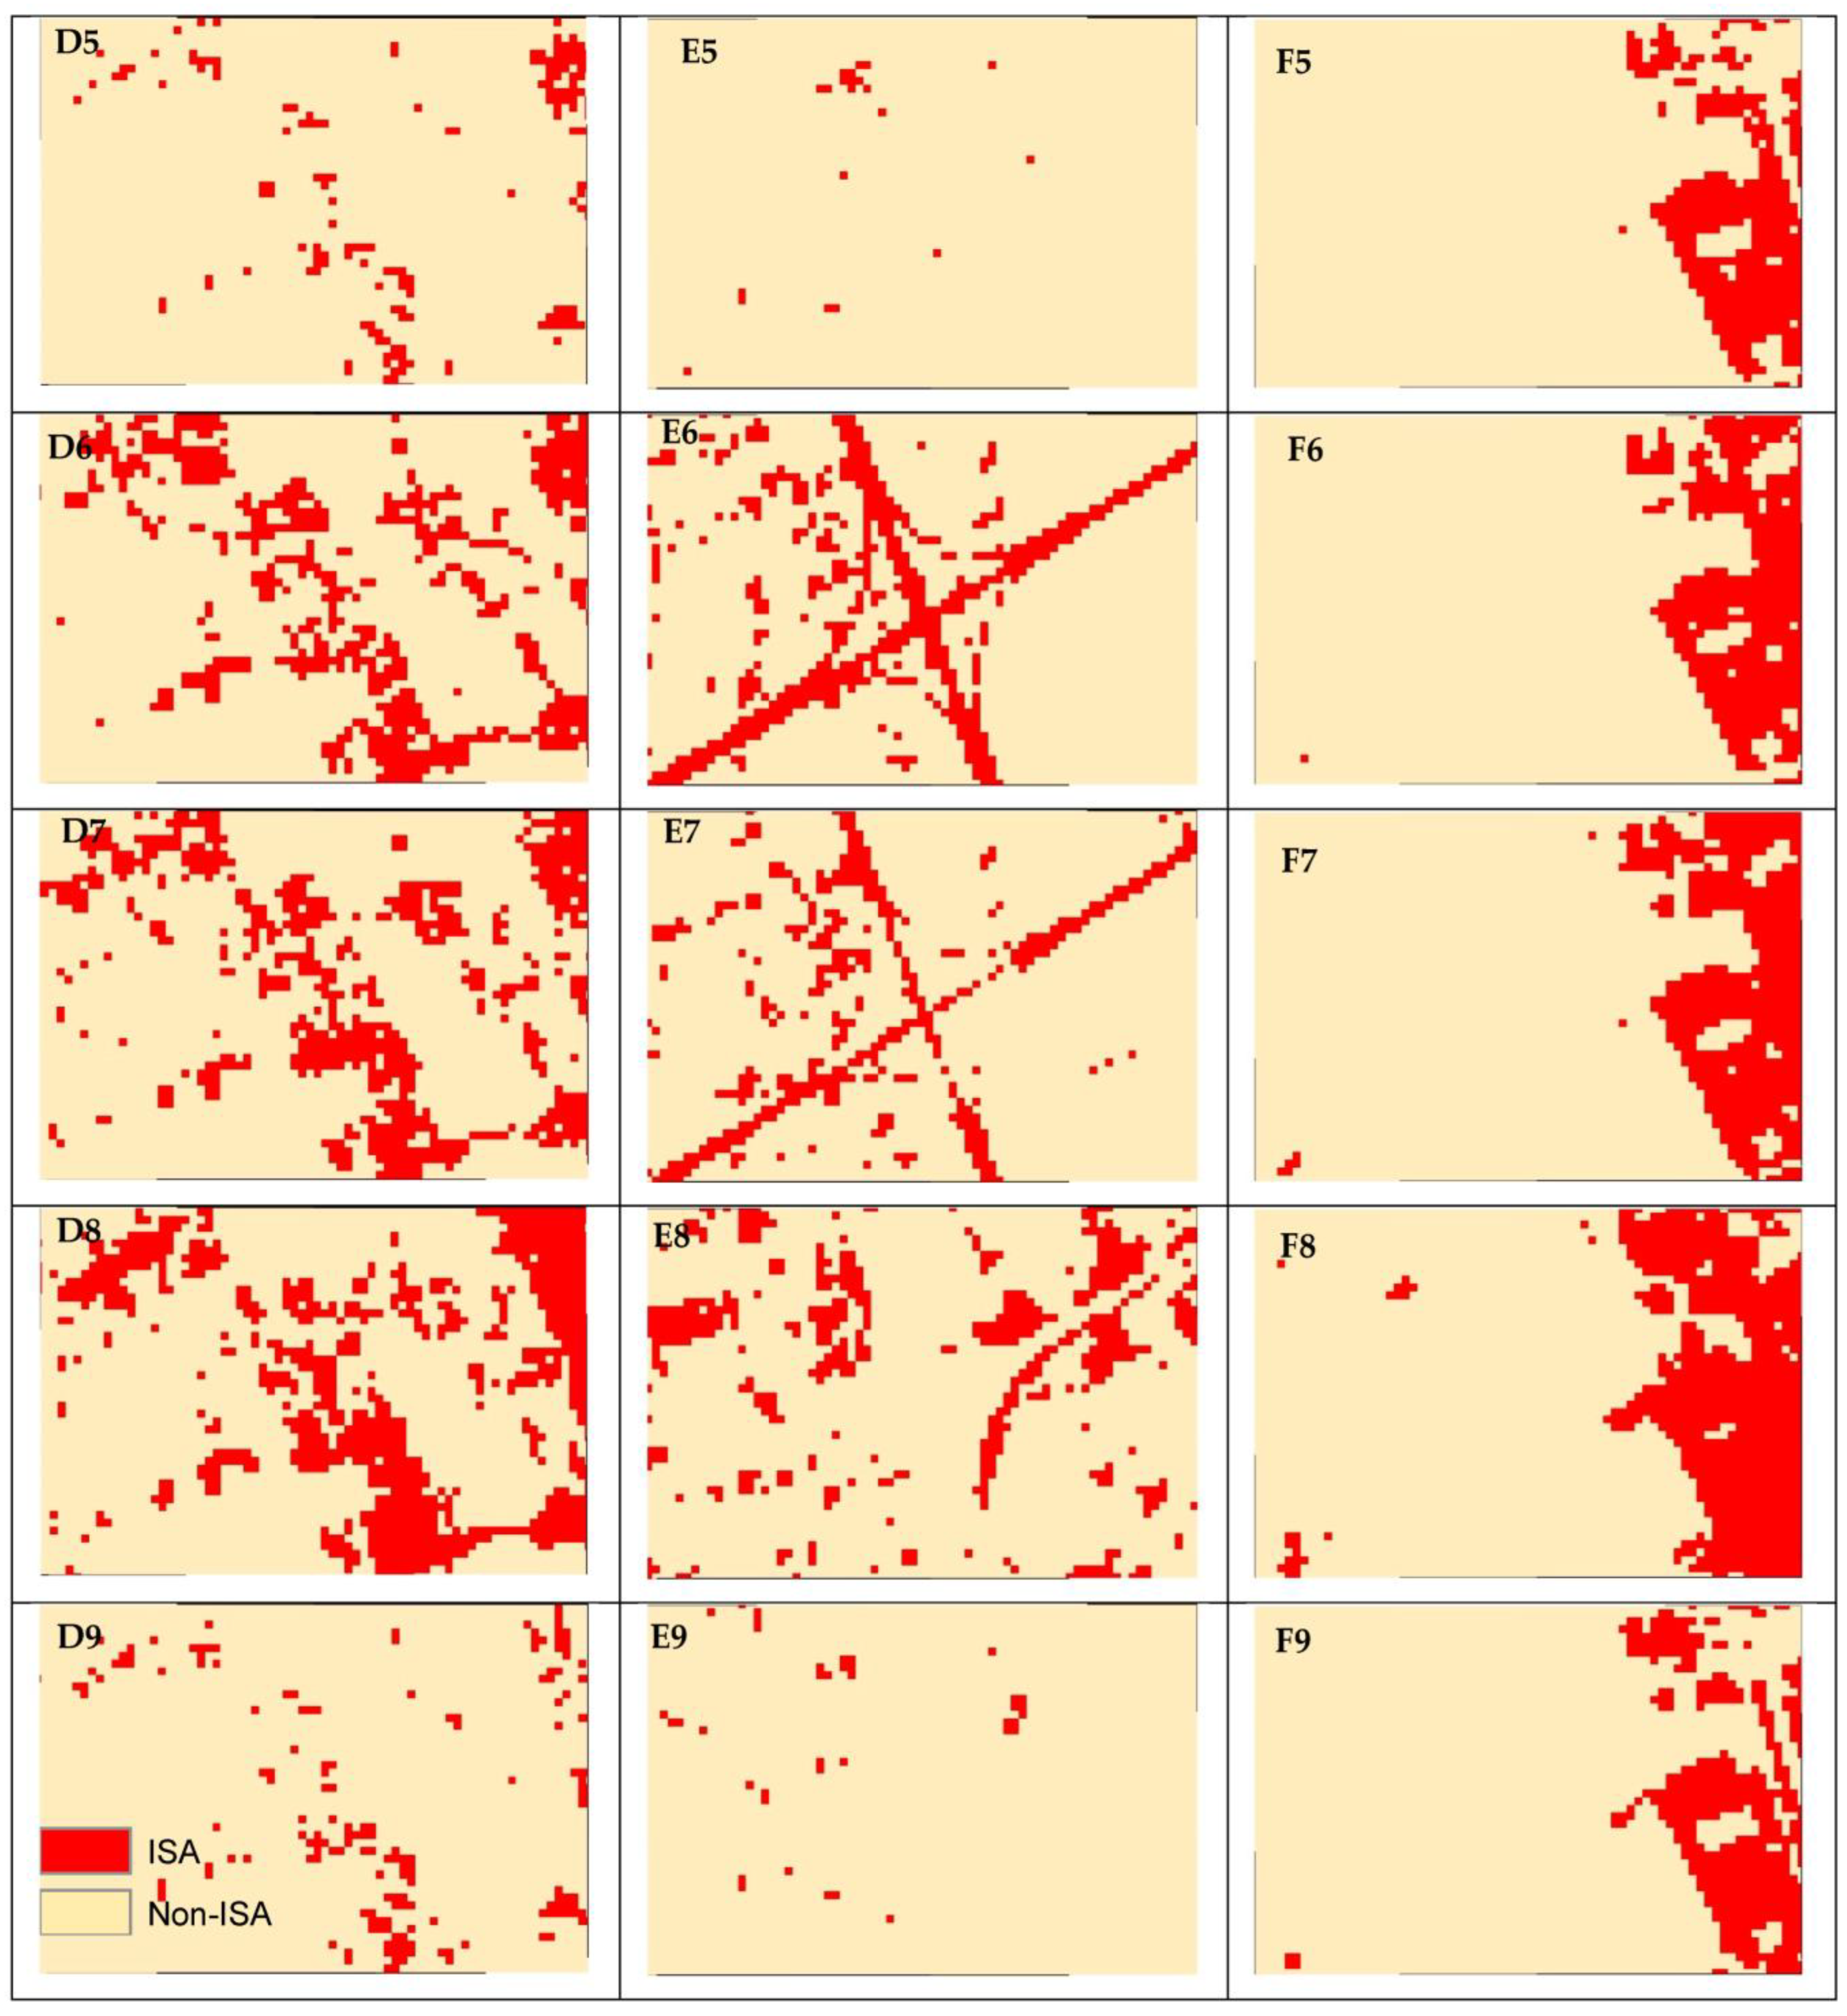
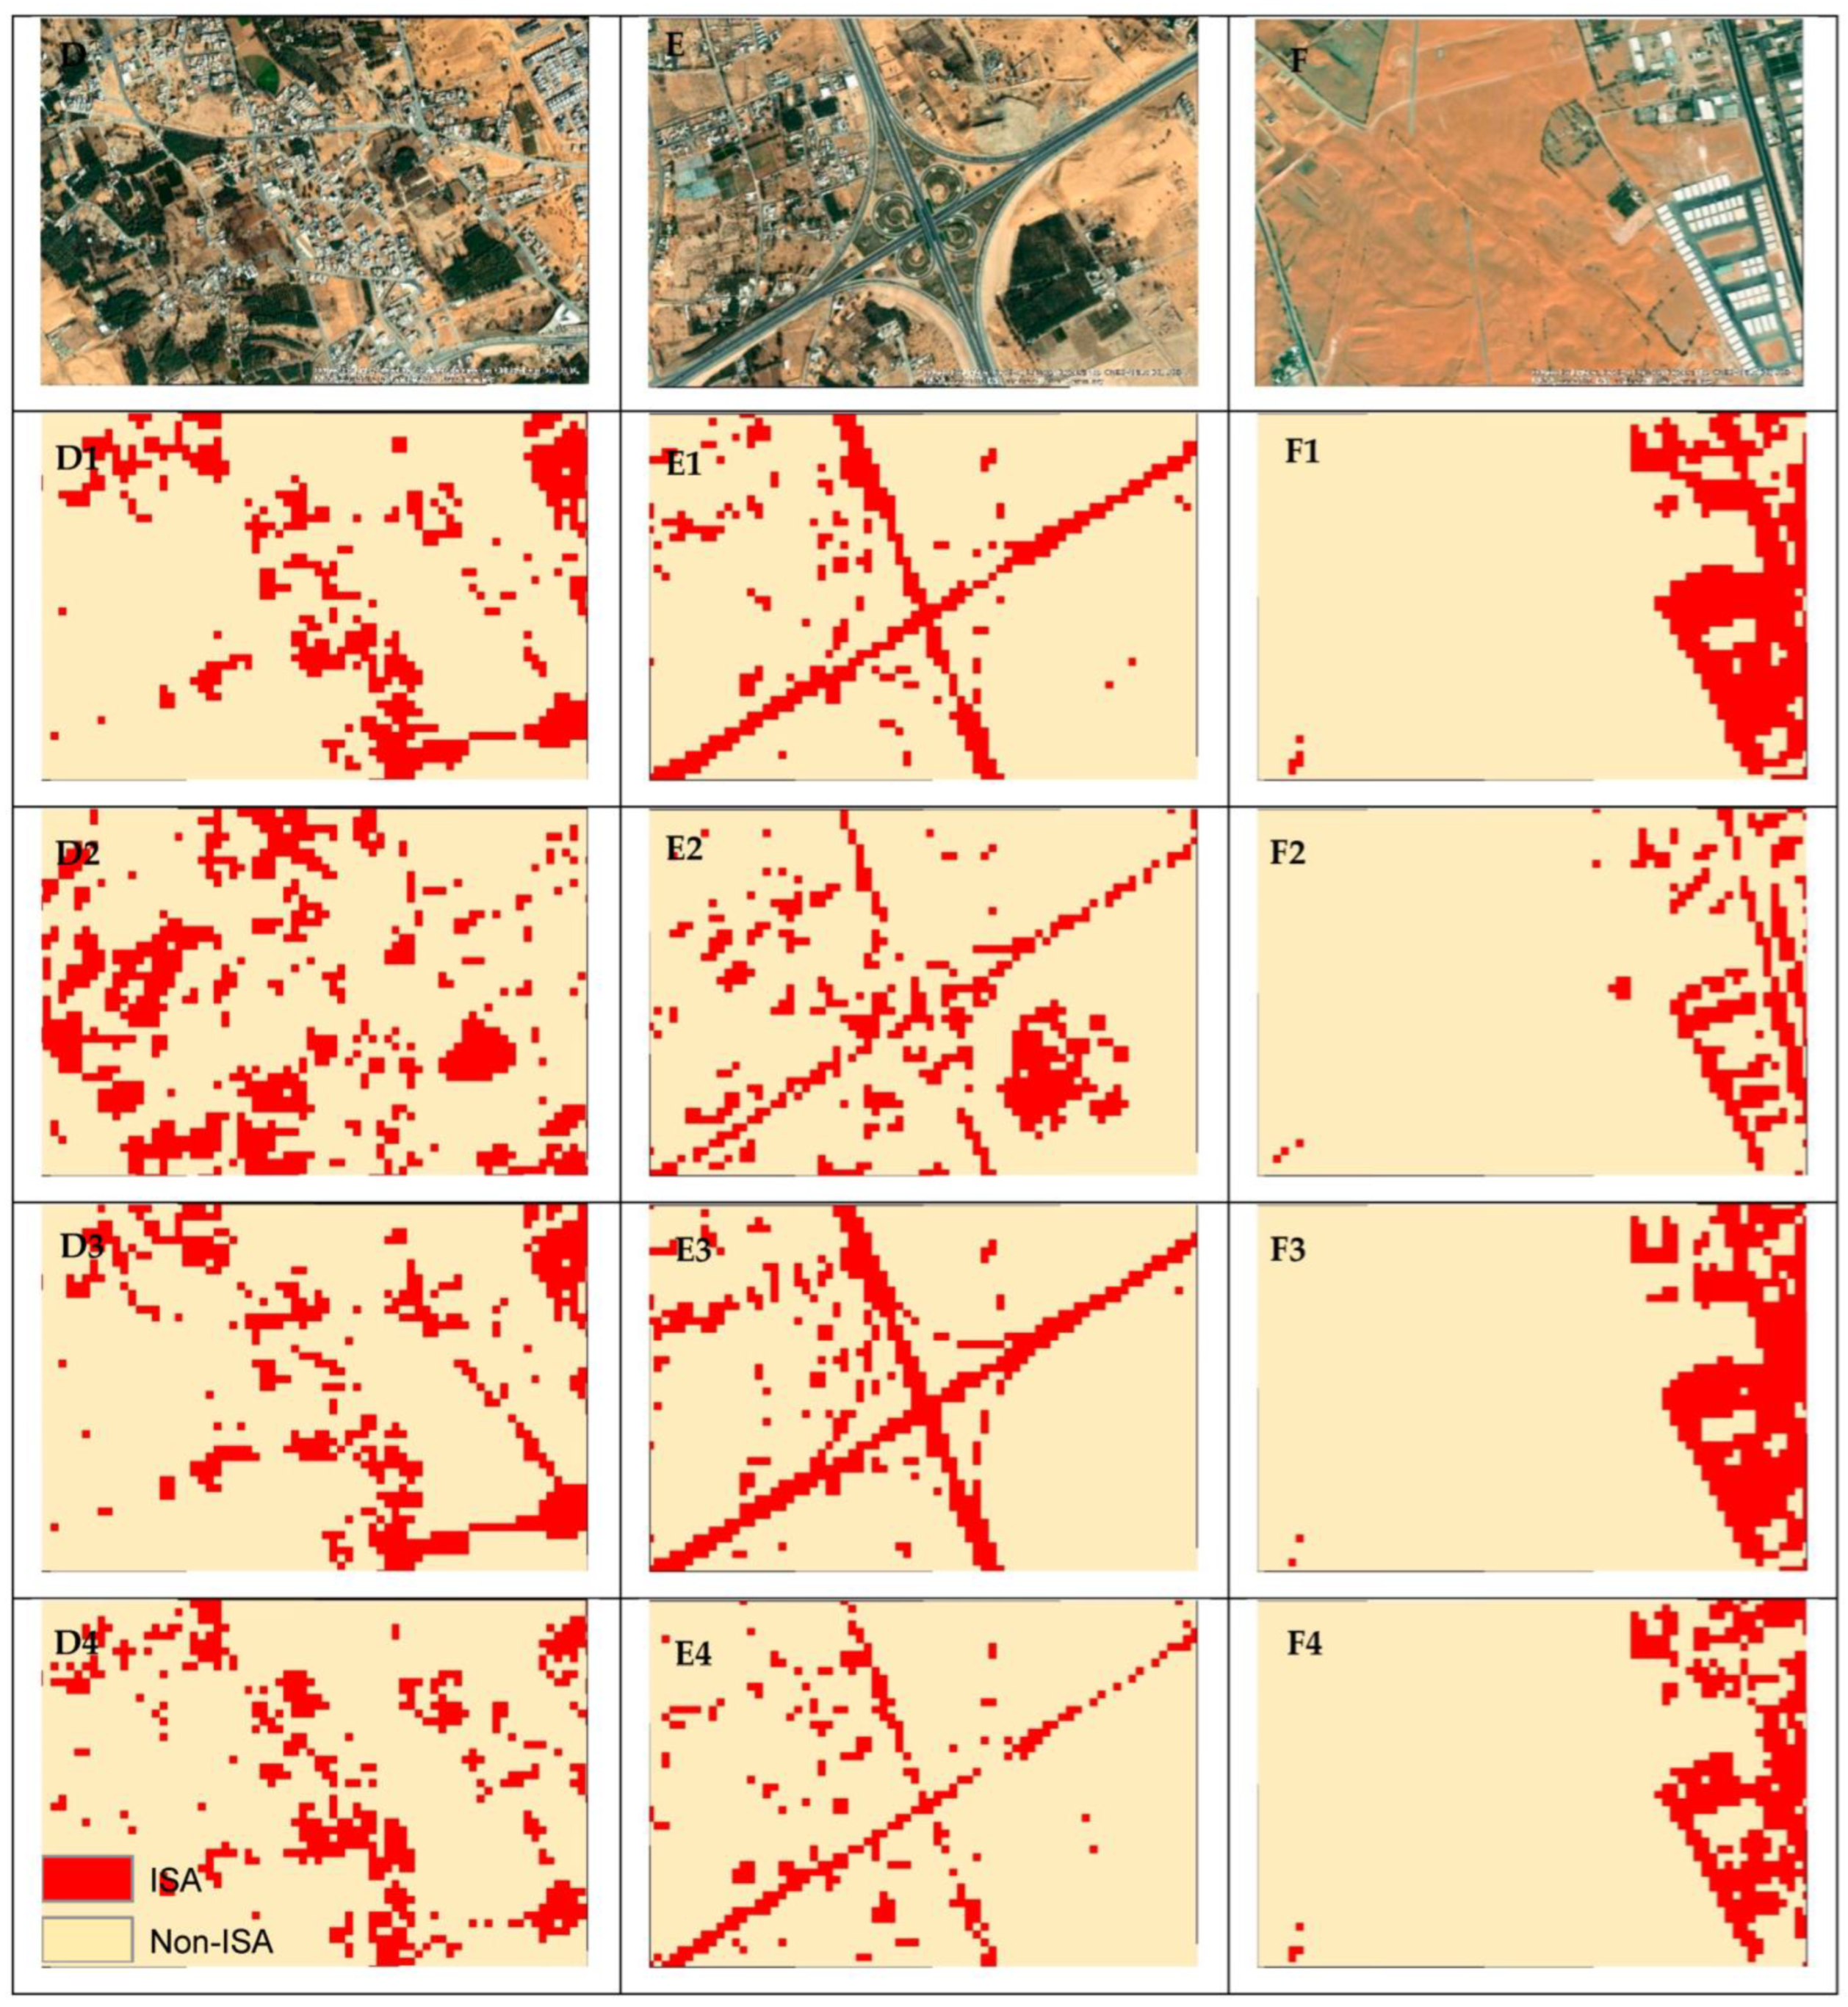
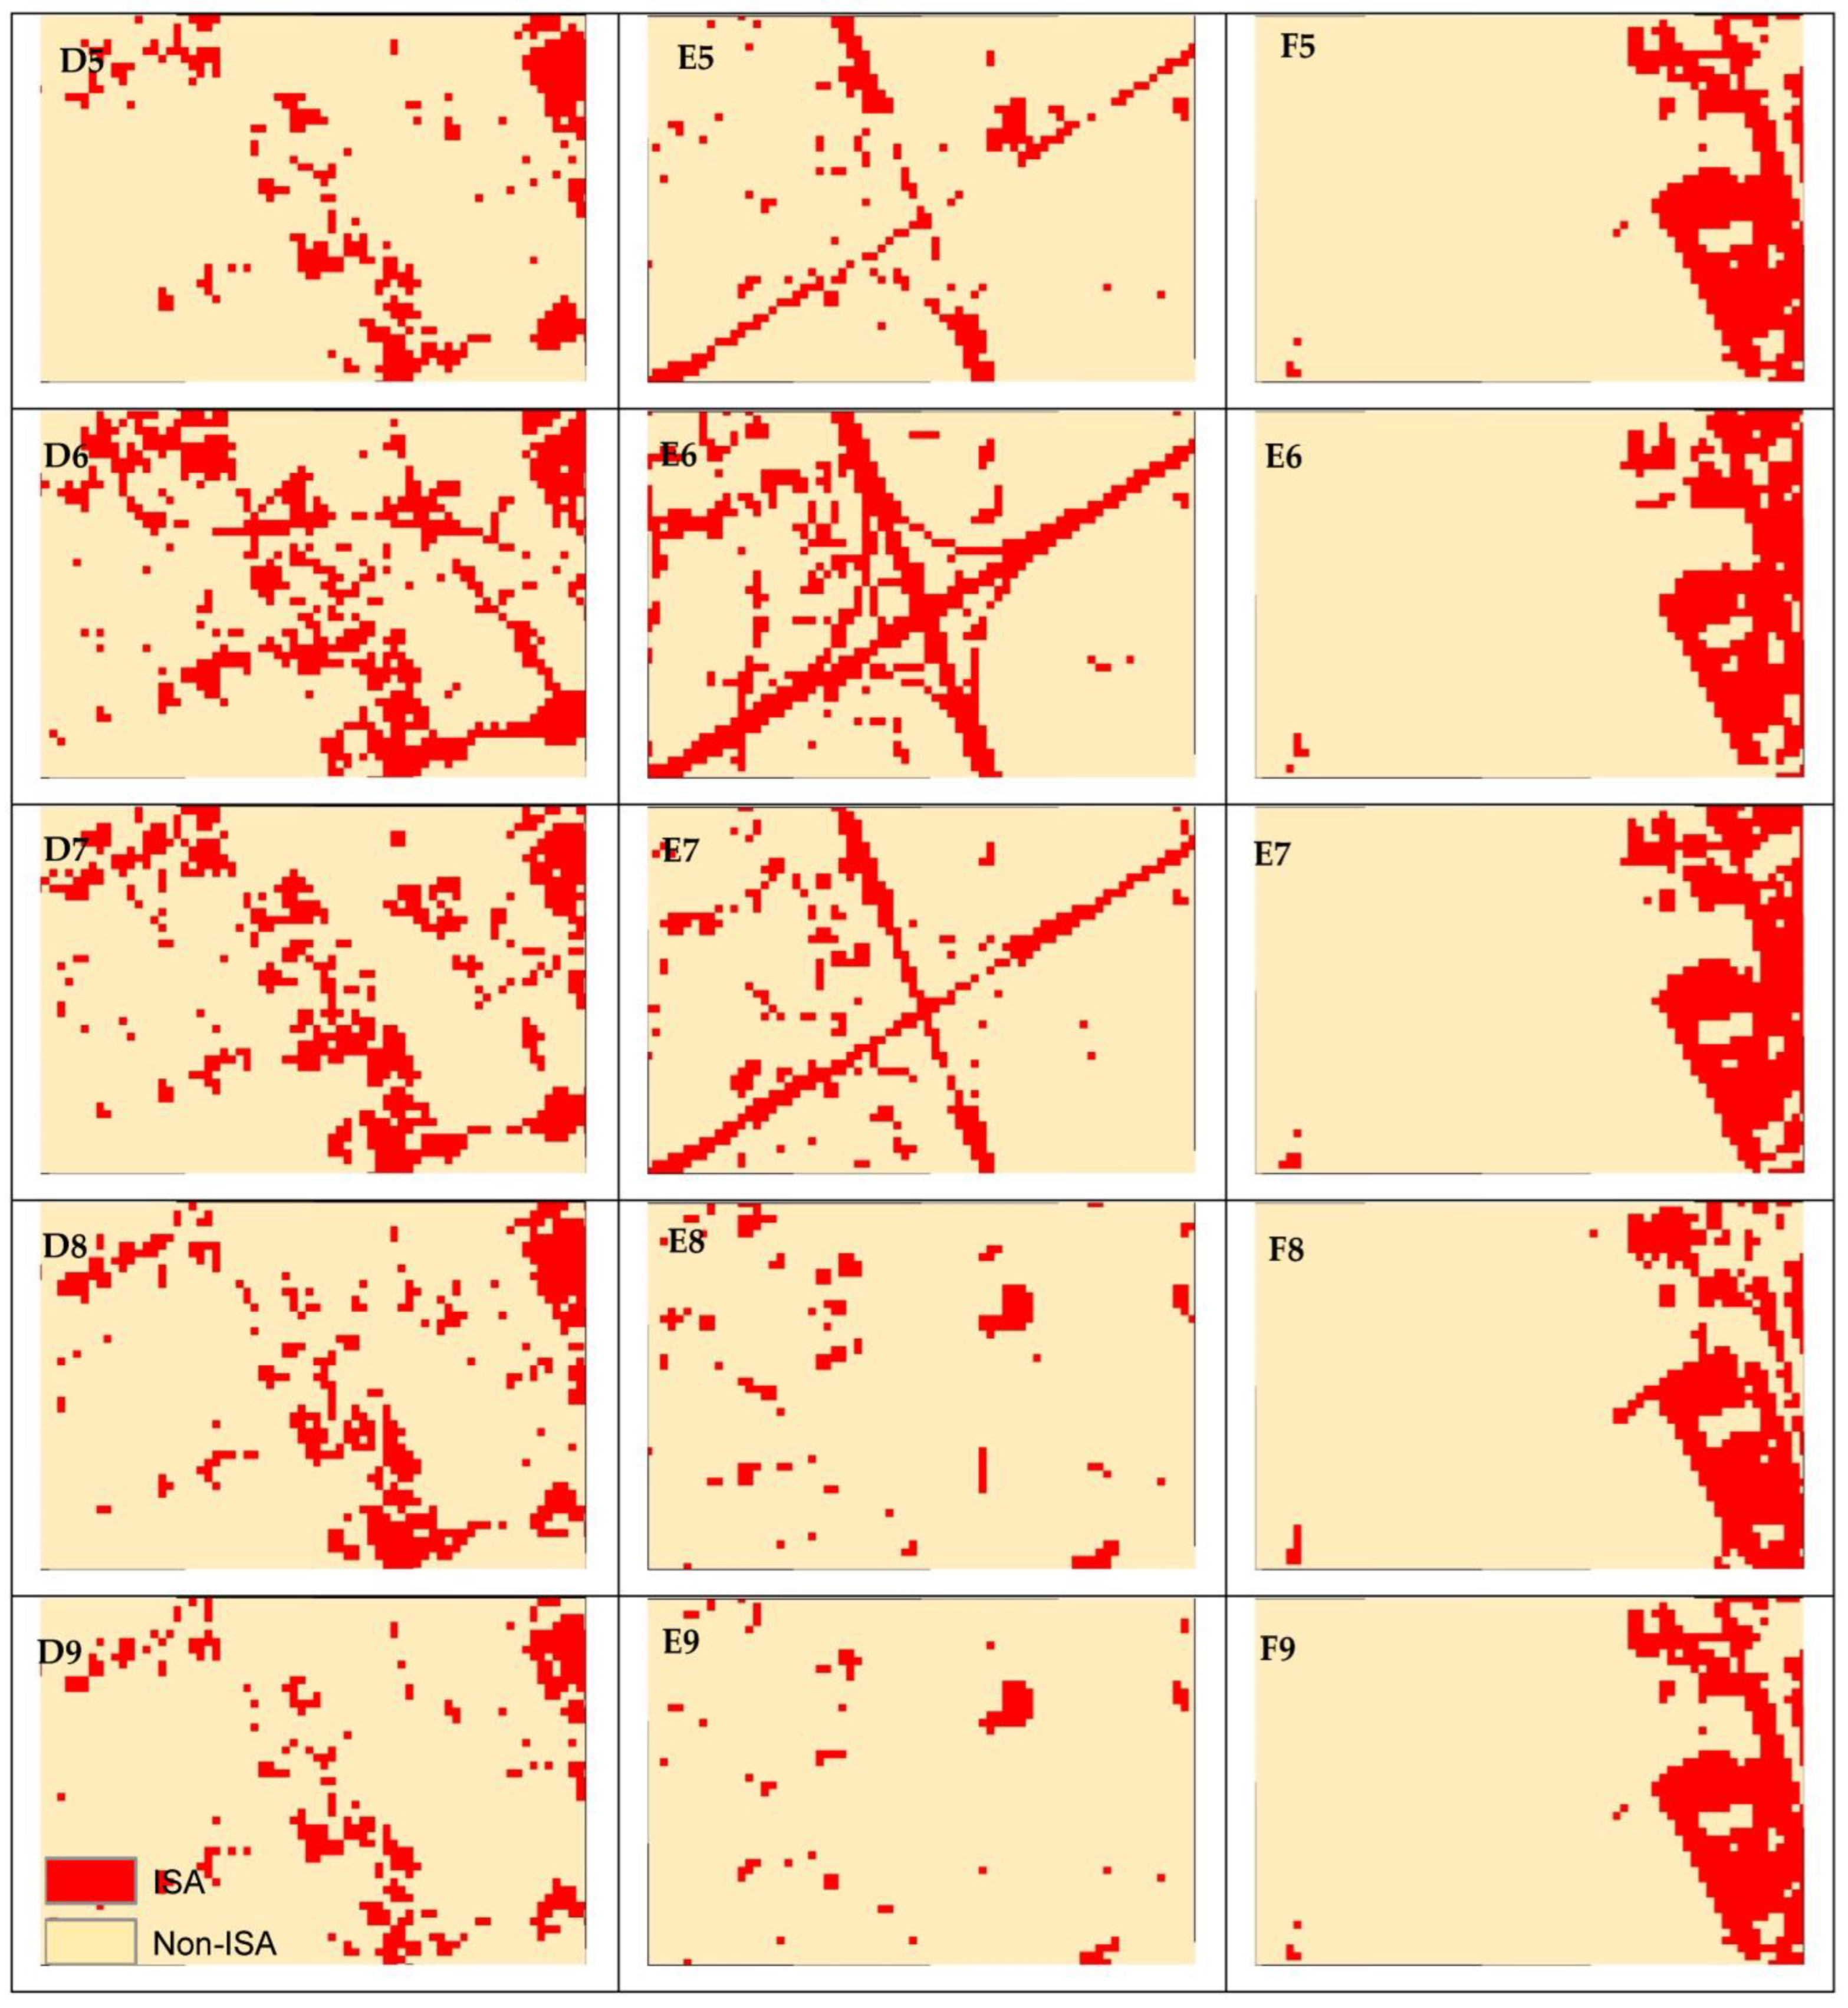
3. Results
3.1. Separability Analysis
3.2. ISA Classification Using Thresholding
3.3. Performance Assessment
4. Discussion
5. Conclusions
Author Contributions
Funding
Institutional Review Board Statement
Informed Consent Statement
Data Availability Statement
Acknowledgments
Conflicts of Interest
References
- As-syakur, A.R.; Adnyana, I.W.S.; Arthana, I.W.; Nuarsa, I.W. Enhanced Built-UP and Bareness Index (EBBI) for Mapping Built-UP and Bare Land in an Urban Area. Remote Sens. 2012, 4, 2957–2970. [Google Scholar] [CrossRef] [Green Version]
- Zhou, Y.; Yang, G.; Wang, S.; Wang, L.; Wang, F.; Liu, X. A New Index for Mapping Built-up and Bare Land Areas from Landsat-8 OLI Data. Remote Sens. Lett. 2014, 5, 862–871. [Google Scholar] [CrossRef]
- Bhatti, S.S.; Tripathi, N.K. Built-up Area Extraction Using Landsat 8 OLI Imagery. GIScience Remote Sens. 2014, 51, 445–467. [Google Scholar] [CrossRef] [Green Version]
- Rasul, A.; Balzter, H.; Ibrahim, G.R.F.; Hameed, H.M.; Wheeler, J.; Adamu, B.; Ibrahim, S.; Najmaddin, P.M. Applying Built-up and Bare-Soil Indices from Landsat 8 to Cities in Dry Climates. Land 2018, 7, 81. [Google Scholar] [CrossRef] [Green Version]
- Hameed, H.M.; Faqe, G.R.; Rasul, A. Effects of Land Cover Change on Surface Runoff Using GIS and Remote Sensing: A Case Study Duhok Sub-Basin BT—Environmental Remote Sensing and GIS in Iraq; Al-Quraishi, A.M.F., Negm, A.M., Eds.; Springer International Publishing: Cham, Switzerland, 2020; pp. 205–223. ISBN 978-3-030-21344-2. [Google Scholar]
- Chen, J.; Chen, S.; Yang, C.; He, L.; Hou, M.; Shi, T. A Comparative Study of Impervious Surface Extraction Using Sentinel-2 Imagery. Eur. J. Remote Sens. 2020, 53, 274–292. [Google Scholar] [CrossRef]
- Fatah, K.K.; Mustafa, Y.T.; Hassan, I.O. Flood Susceptibility Mapping Using an Analytic Hierarchy Process Model Based on Remote Sensing and GIS Approaches in Akre District, Kurdistan Region, Iraq. Iraqi Geol. J. 2022, 55, 121–149. [Google Scholar] [CrossRef]
- Refice, A.; Huang, W.; Li, S.; Ravan, S.; Rahman, A.; Amen, M.; Mustafa, A.; Kareem, D.A.; Hameed, H.M.; Mirza, A.A.; et al. Mapping of Flood-Prone Areas Utilizing GIS Techniques and Remote Sensing: A Case Study of Duhok, Kurdistan Region of Iraq. Remote Sens. 2023, 15, 1102. [Google Scholar] [CrossRef]
- Santra, A.; Mitra, S.S.; Sinha, S.; Routh, S. Performance Testing of Selected Spectral Indices in Automated Extraction of Impervious Built-up Surface Features Using Resourcesat LISS-III Image. Arab. J. Geosci. 2020, 13, 1229. [Google Scholar] [CrossRef]
- Nguyen, C.T.; Chidthaisong, A.; Diem, P.K.; Huo, L.Z. A Modified Bare Soil Index to Identify Bare Land Features during Agricultural Fallow-Period in Southeast Asia Using Landsat 8. Land 2021, 10, 231. [Google Scholar] [CrossRef]
- Nuthammachot, N.; Stratoulias, D. Fusion of Sentinel-1A and Landsat-8 Images for Improving Land Use/Land Cover Classification in Songkla Province, Thailand. Appl. Ecol. Environ. Res. 2019, 17, 3123–3135. [Google Scholar] [CrossRef]
- Muhammed, H.H.; Mustafa, A.M.; Kolerski, T. Hydrological Responses to Large-Scale Changes in Land Cover of River Watershed: Review. J. Water Land Dev. 2021, 50, 108–121. [Google Scholar]
- Getachew, B.; Manjunatha, B.R.; Bhat, H.G. Modeling Projected Impacts of Climate and Land Use/Land Cover Changes on Hydrological Responses in the Lake Tana Basin, Upper Blue Nile River Basin, Ethiopia. J. Hydrol. 2021, 595, 125974. [Google Scholar] [CrossRef]
- Xiao, R.B.; Ouyang, Z.Y.; Zheng, H.; Li, W.F.; Schienke, E.W.; Wang, X.K. Spatial Pattern of Impervious Surfaces and Their Impacts on Land Surface Temperature in Beijing, China. J. Environ. Sci. 2007, 19, 250–256. [Google Scholar] [CrossRef] [PubMed]
- Flanagan, M.; Civco, D. Subpixel Impervious Surface Mapping. In Proceedings of the 2001 ASPRS Annual Convention, St. Louis, MO, USA, 23–27 April 2001; pp. 13–25. [Google Scholar]
- Hu, X.; Weng, Q. Estimating Impervious Surfaces from Medium Spatial Resolution Imagery Using the Self-Organizing Map and Multi-Layer Perceptron Neural Networks. Remote Sens. Environ. 2009, 113, 2089–2102. [Google Scholar] [CrossRef]
- Dennison, P.E.; Roberts, D.A. Endmember Selection for Multiple Endmember Spectral Mixture Analysis Using Endmember Average RMSE. Remote Sens. Environ. 2003, 87, 123–135. [Google Scholar] [CrossRef]
- Fan, F.; Fan, W.; Weng, Q. Improving Urban Impervious Surface Mapping by Linear Spectral Mixture Analysis and Using Spectral Indices. Can. J. Remote Sens. 2015, 41, 577–586. [Google Scholar] [CrossRef]
- Goetz, S.J.; Wright, R.K.; Smith, A.J.; Zinecker, E.; Schaub, E. IKONOS Imagery for Resource Management: Tree Cover, Impervious Surfaces, and Riparian Buffer Analyses in the Mid-Atlantic Region. Remote Sens. Environ. 2003, 88, 195–208. [Google Scholar] [CrossRef]
- Bian, X.; Zhang, T.; Zhang, X. Combining Clustering and Classification for Remote-Sensing Images Using Unlabeled Data. Chin. Opt. Lett. 2011, 9, 11002. [Google Scholar] [CrossRef]
- Zhang, J.; Foody, G.M. Fully-Fuzzy Supervised Classification of Sub-Urban Land Cover from Remotely Sensed Imagery: Statistical and Artificial Neural Network Approaches. Int. J. Remote Sens. 2010, 22, 615–628. [Google Scholar] [CrossRef]
- Grippa, T.; Lennert, M.; Beaumont, B.; Vanhuysse, S.; Stephenne, N.; Wolff, E. An Open-Source Semi-Automated Processing Chain for Urban Obia Classification. Remote Sens. 2016, 9, 358. [Google Scholar] [CrossRef] [Green Version]
- Kebede, T.A.; Hailu, B.T.; Suryabhagavan, K.V. Evaluation of Spectral Built-up Indices for Impervious Surface Extraction Using Sentinel-2A MSI Imageries: A Case of Addis Ababa City, Ethiopia. Environ. Chall. 2022, 8, 100568. [Google Scholar] [CrossRef]
- Waqar, M.M.; Mirza, J.F.; Mumtaz, R.; Hussain, E. Development of New Indices for Extraction of Built-Up Area & Bare Soil. Open Access Sci. Rep. 2012, 1, 136. [Google Scholar] [CrossRef]
- Hidayati, I.N.; Suharyadi, R. A Comparative Study of Various Indices for Extraction Urban Impervious Surface of Landsat 8 OLI. Forum Geogr. 2019, 33, 162–172. [Google Scholar] [CrossRef]
- Sekertekin, A.; Abdikan, S.; Marangoz, A.M. The Acquisition of Impervious Surface Area from LANDSAT 8 Satellite Sensor Data Using Urban Indices: A Comparative Analysis. Environ. Monit. Assess. 2018, 190, 381. [Google Scholar] [CrossRef]
- Zhang, S.; Yang, K.; Li, M.; Ma, Y.; Sun, M. Combinational Biophysical Composition Index (CBCI) for Effective Mapping Biophysical Composition in Urban Areas. IEEE Access 2018, 6, 41224–41237. [Google Scholar] [CrossRef]
- Zha, Y.; Gao, J.; Ni, S. Use of Normalized Difference Built-up Index in Automatically Mapping Urban Areas from TM Imagery. Int. J. Remote Sens. 2003, 24, 583–594. [Google Scholar] [CrossRef]
- Zhao, H.; Chen, X. Use of Normalized Difference Bareness Index in Quickly Mapping Bare Areas from TM/ETM+. In Proceedings of the International Geoscience and Remote Sensing Symposium (IGARSS), Seoul, Republic of Korea, 29 July 2005; Volume 3, pp. 1666–1668. [Google Scholar]
- Estoque, R.C.; Murayama, Y. Classification and Change Detection of Built-up Lands from Landsat-7 ETM+ and Landsat-8 OLI/TIRS Imageries: A Comparative Assessment of Various Spectral Indices. Ecol. Indic. 2015, 56, 205–217. [Google Scholar] [CrossRef]
- Piyoosh, A.K.; Ghosh, S.K. Development of a Modified Bare Soil and Urban Index for Landsat 8 Satellite Data. Geocarto Int. 2018, 33, 423–442. [Google Scholar] [CrossRef]
- Sun, G.; Chen, X.; Jia, X.; Yao, Y.; Wang, Z. Combinational Build-Up Index (CBI) for Effective Impervious Surface Mapping in Urban Areas. IEEE J. Sel. Top. Appl. Earth Obs. Remote Sens. 2016, 9, 2081–2092. [Google Scholar] [CrossRef]
- Bouhennache, R.; Bouden, T.; Taleb-Ahmed, A.; Cheddad, A. A New Spectral Index for the Extraction of Built-up Land Features from Landsat 8 Satellite Imagery. Geocarto Int. 2019, 34, 1531–1551. [Google Scholar] [CrossRef]
- Tian, Y.; Chen, H.; Song, Q.; Zheng, K. A Novel Index for Impervious Surface Area Mapping: Development and Validation. Remote Sens. 2018, 10, 1521. [Google Scholar] [CrossRef] [Green Version]
- Li, F.; Liu, X.; Liao, S.; Jia, P. The Modified Normalized Urban Area Composite Index: A Satelliate-Derived High-Resolution Index for Extracting Urban Areas. Remote Sens. 2021, 13, 2350. [Google Scholar] [CrossRef]
- Bouzekri, S.; Lasbet, A.A.; Lachehab, A. A New Spectral Index for Extraction of Built-Up Area Using Landsat-8 Data. J. Indian Soc. Remote Sens. 2015, 43, 867–873. [Google Scholar] [CrossRef]
- Li, C.; Shao, Z.; Zhang, L.; Huang, X.; Zhang, M. A Comparative Analysis of Index-Based Methods for Impervious Surface Mapping Using Multiseasonal Sentinel-2 Satellite Data. IEEE J. Sel. Top. Appl. Earth Obs. Remote Sens. 2021, 14, 3682–3694. [Google Scholar] [CrossRef]
- National Geographic Society Köppen Climate Classification System. Available online: https://education.nationalgeographic.org/resource/koppen-climate-classification-system/ (accessed on 23 December 2022).
- Macrotrends Buraydah, Saudi Arabia Metro Area Population 1950-2023|MacroTrends. Available online: https://www.macrotrends.net/cities/22415/buraydah/population (accessed on 23 December 2022).
- Deng, C.; Wu, C. BCI: A Biophysical Composition Index for Remote Sensing of Urban Environments. Remote Sens. Environ. 2012, 127, 247–259. [Google Scholar] [CrossRef]
- Chen, J.; Yang, K.; Chen, S.; Yang, C.; Zhang, S.; He, L. Enhanced Normalized Difference Index for Impervious Surface Area Estimation at the Plateau Basin Scale. J. Appl. Remote Sens. 2019, 13, 16502. [Google Scholar] [CrossRef] [Green Version]
- Javed, A.; Cheng, Q.; Peng, H.; Altan, O.; Li, Y.; Ara, I.; Huq, E.; Ali, Y.; Saleem, N. Review of Spectral Indices for Urban Remote Sensing. Photogramm. Eng. Remote Sens. 2021, 87, 513–524. [Google Scholar] [CrossRef]
- Kaufman, Y.J.; Remer, L.A. Detection of Forests Using Mid-IR Reflectance: An Application for Aerosol Studies. IEEE Trans. Geosci. Remote Sens. 1994, 32, 672–683. [Google Scholar] [CrossRef]
- Pereira, J.M.C. A Comparative Evaluation of NOAA/AVHRR Vegetation Indexes for Burned Surface Detection and Mapping. IEEE Trans. Geosci. Remote Sens. 1999, 37, 217–226. [Google Scholar] [CrossRef]
- Swain, P.H.; Davis, S.M. Remote Sensing: The Quantitative Approach; McGraw-Hill College: New York, NY, USA, 1979; ISBN 978-0070625761. [Google Scholar]
- Mausel, P.W.; Kramber, W.J.; Lee, J.K. Optimum Band Selection for Supervised Classification of Multispectral Data. Photogramm. Eng. Remote Sens. 1990, 56, 55–60. [Google Scholar]
- Thomas, I.L.; Ching, N.P.; Benning, V.M.; D’Aguanno, J.A. Review Article A Review of Multi-Channel Indices of Class Separability. Int. J. Remote Sens. 2007, 8, 331–350. [Google Scholar] [CrossRef]
- Jensen, J. Introductory Digital Image Processing: A Remote Sensing Perspective; Kindle Direct Publishing: Seattle, WA, USA, 2005; p. 526. [Google Scholar]
- Firozjaei, M.K.; Fathololoumi, S.; Mijani, N.; Kiavarz, M.; Qureshi, S.; Homaee, M.; Alavipanah, S.K. Evaluating the Spectral Indices Efficiency to Quantify Daytime Surface Anthropogenic Heat Island Intensity: An Intercontinental Methodology. Remote Sens. 2020, 12, 2854. [Google Scholar] [CrossRef]
- Stathakis, D.; Perakis, K.; Savin, I. Efficient Segmentation of Urban Areas by the VIBI. Int. J. Remote Sens. 2012, 33, 6361–6377. [Google Scholar] [CrossRef]
- Valdiviezo-N, J.C.; Télle-Quiñones, A.; Salazar-Garibay, A.; López-Caloca, A.A. Built-up Index Methods and Their Applications for Urban Extraction from Sentinel 2A Satellite Data: Discussion. J. Opt. Soc. Am. A 2018, 35, 35. [Google Scholar] [CrossRef] [PubMed]


| Landsat Scene Identifier (Path/Row: 168/042) | Sensing Date | Sensor Identifier | Cloud (%) | Season |
|---|---|---|---|---|
| LC81680422020243LGN00 | 2020/08/30 | OLI_TIRS | 0.0 | Summer |
| LC81660432021071LGN00 | 2021/03/12 | OLI_TIRS | 0.0 | Spring |
| Class of Separability | J–M | TD | SDI |
|---|---|---|---|
| very good separability | 1.3–1.414 | 1900< | 2< |
| moderate separability | 1–1.299 | 1700–1900 | 1–1.99 |
| low separability | <0.999 | <1700 | 0.99 |
| Summer | Spring | |||||
| ISA and Barre Soil | J–M | TD | SDI | J–M | TD | SDI |
| BLFAI | 1092 | 1225 | 1.30 | 1095 | 1262 | 1.31 |
| BCI | 607 | 498 | 0.44 | 706 | 687 | 0.61 |
| BRBI | 1054 | 1118 | 1.28 | 1003 | 1114 | 1.18 |
| CBCI | 1075 | 1290 | 1.31 | 1073 | 1510 | 1.28 |
| DBI | 753 | 582 | 0.81 | 841 | 708 | 0.94 |
| ENDISI | 508 | 316 | 0.37 | 642 | 505 | 0.59 |
| VegNIR | 1053 | 1112 | 1.27 | 1098 | 1258 | 1.36 |
| NRUI | 945 | 1264 | 0.98 | 1004 | 1384 | 1.04 |
| PISI | 1094 | 1309 | 1.30 | 1078 | 1480 | 1.30 |
| Summer | Spring | |||||
| ISA and Vegetation | J–M | TD | SDI | J–M | TD | SDI |
| BLFAI | 1278 | 1635 | 1.84 | 1312 | 1746 | 1.99 |
| BCI | 1231 | 1577 | 1.69 | 1318 | 1760 | 2.02 |
| BRBI | 1254 | 1594 | 1.76 | 1313 | 1726 | 1.99 |
| CBCI | 1293 | 1673 | 1.90 | 1358 | 1933 | 2.31 |
| DBI | 1289 | 1989 | 1.95 | 1348 | 1999 | 2.33 |
| ENDISI | 1186 | 1453 | 1.56 | 1257 | 1602 | 1.70 |
| VrNIR-BI | 1364 | 1914 | 2.33 | 1387 | 1983 | 2.64 |
| NRUI | 1246 | 1978 | 1.37 | 1155 | 1970 | 1.34 |
| PISI | 1311 | 1729 | 2.13 | 1338 | 1806 | 2.13 |
| ISA Indices | Summer | Spring | ||
|---|---|---|---|---|
| Manual | ISO Cluster | Manual | ISO Cluster | |
| CBCI | −0.0787 | −0.1354 | 0.2014 | 0.2307 |
| IPIS | 0.2014 | 0.2274 | 0.3796 | 0.4135 |
| BCI | −0.3022 | −0.3186 | −0.1192 | −0.1287 |
| VrNIR-BI | −0.1419 | −0.1101 | 0.2419 | 0.2143 |
| BLFAI | −0.4172 | −0.4321 | −0.3832 | −0.3916 |
| BRBA | −0.7333 | −0.7421 | −0.7034 | −0.6934 |
| DBI | 0.2371 | 0.2362 | 0.5216 | 0.5140 |
| ENDISI | −0.1419 | −0.1220 | −0.1216 | −0.0042 |
| NRUI | 0.4427 | 0.4321 | 0.4201 | 0.4342 |
| ISA Indices | Accuracy | Manual | ISO Data | ||||
|---|---|---|---|---|---|---|---|
| Spring | Summer | Average | Spring | Summer | Average | ||
| VrNIR-BI | OA (%) | 88.5 | 86.5 | 87.5 | 86 | 85.5 | 85.75 |
| Kappa | 0.77 | 0.75 | 0.76 | 0.72 | 0.73 | 0.725 | |
| RNUI | OA (%) | 79 | 78 | 78.5 | 78 | 79.5 | 78.75 |
| Kappa | 0.6 | 0.59 | 0.595 | 0.56 | 0.59 | 0.575 | |
| PISI | OA (%) | 89 | 88 | 88.5 | 87.5 | 85.5 | 86.5 |
| Kappa | 0.77 | 0.75 | 0.76 | 0.75 | 0.71 | 0.73 | |
| BRBI | OA (%) | 83 | 85 | 84.5 | 84.5 | 83.5 | 84 |
| Kappa | 0.69 | 0.71 | 0.7 | 0.7 | 0.69 | 0.695 | |
| DBI | OA (%) | 76.5 | 74.5 | 76 | 74.5 | 73.5 | 74 |
| Kappa | 0.53 | 0.52 | 0.525 | 0.52 | 0.51 | 0.515 | |
| CBCI | OA (%) | 88.5 | 87.5 | 88 | 87 | 86.5 | 86.75 |
| Kappa | 0.77 | 0.73 | 0.76 | 0.74 | 0.73 | 0.735 | |
| BLFAI | OA (%) | 85 | 82.5 | 83.75 | 84.5 | 83 | 83.75 |
| Kappa | 0.7 | 0.65 | 0.675 | 0.69 | 0.66 | 0.675 | |
| ENDISI | OA (%) | 76 | 75 | 75.5 | 69.5 | 72.5 | 71 |
| Kappa | 0.52 | 0.5 | 0.51 | 0.39 | 0.45 | 0.42 | |
| BCI | OA (%) | 78 | 77 | 77.5 | 77 | 76.5 | 76.75 |
| Kappa | 0.56 | 0.55 | 0.555 | 0.57 | 0.57 | 0.57 | |
Disclaimer/Publisher’s Note: The statements, opinions and data contained in all publications are solely those of the individual author(s) and contributor(s) and not of MDPI and/or the editor(s). MDPI and/or the editor(s) disclaim responsibility for any injury to people or property resulting from any ideas, methods, instructions or products referred to in the content. |
© 2023 by the authors. Licensee MDPI, Basel, Switzerland. This article is an open access article distributed under the terms and conditions of the Creative Commons Attribution (CC BY) license (https://creativecommons.org/licenses/by/4.0/).
Share and Cite
Almohamad, H.; Alshwesh, I.O. Evaluation of Index-Based Methods for Impervious Surface Mapping from Landsat-8 to Cities in Dry Climates; A Case Study of Buraydah City, KSA. Sustainability 2023, 15, 9704. https://doi.org/10.3390/su15129704
Almohamad H, Alshwesh IO. Evaluation of Index-Based Methods for Impervious Surface Mapping from Landsat-8 to Cities in Dry Climates; A Case Study of Buraydah City, KSA. Sustainability. 2023; 15(12):9704. https://doi.org/10.3390/su15129704
Chicago/Turabian StyleAlmohamad, Hussein, and Ibrahim Obaid Alshwesh. 2023. "Evaluation of Index-Based Methods for Impervious Surface Mapping from Landsat-8 to Cities in Dry Climates; A Case Study of Buraydah City, KSA" Sustainability 15, no. 12: 9704. https://doi.org/10.3390/su15129704