
Landscape Ecological Risk Assessment of Zhoushan Island Based on LULC Change

Abstract
:1. Introduction
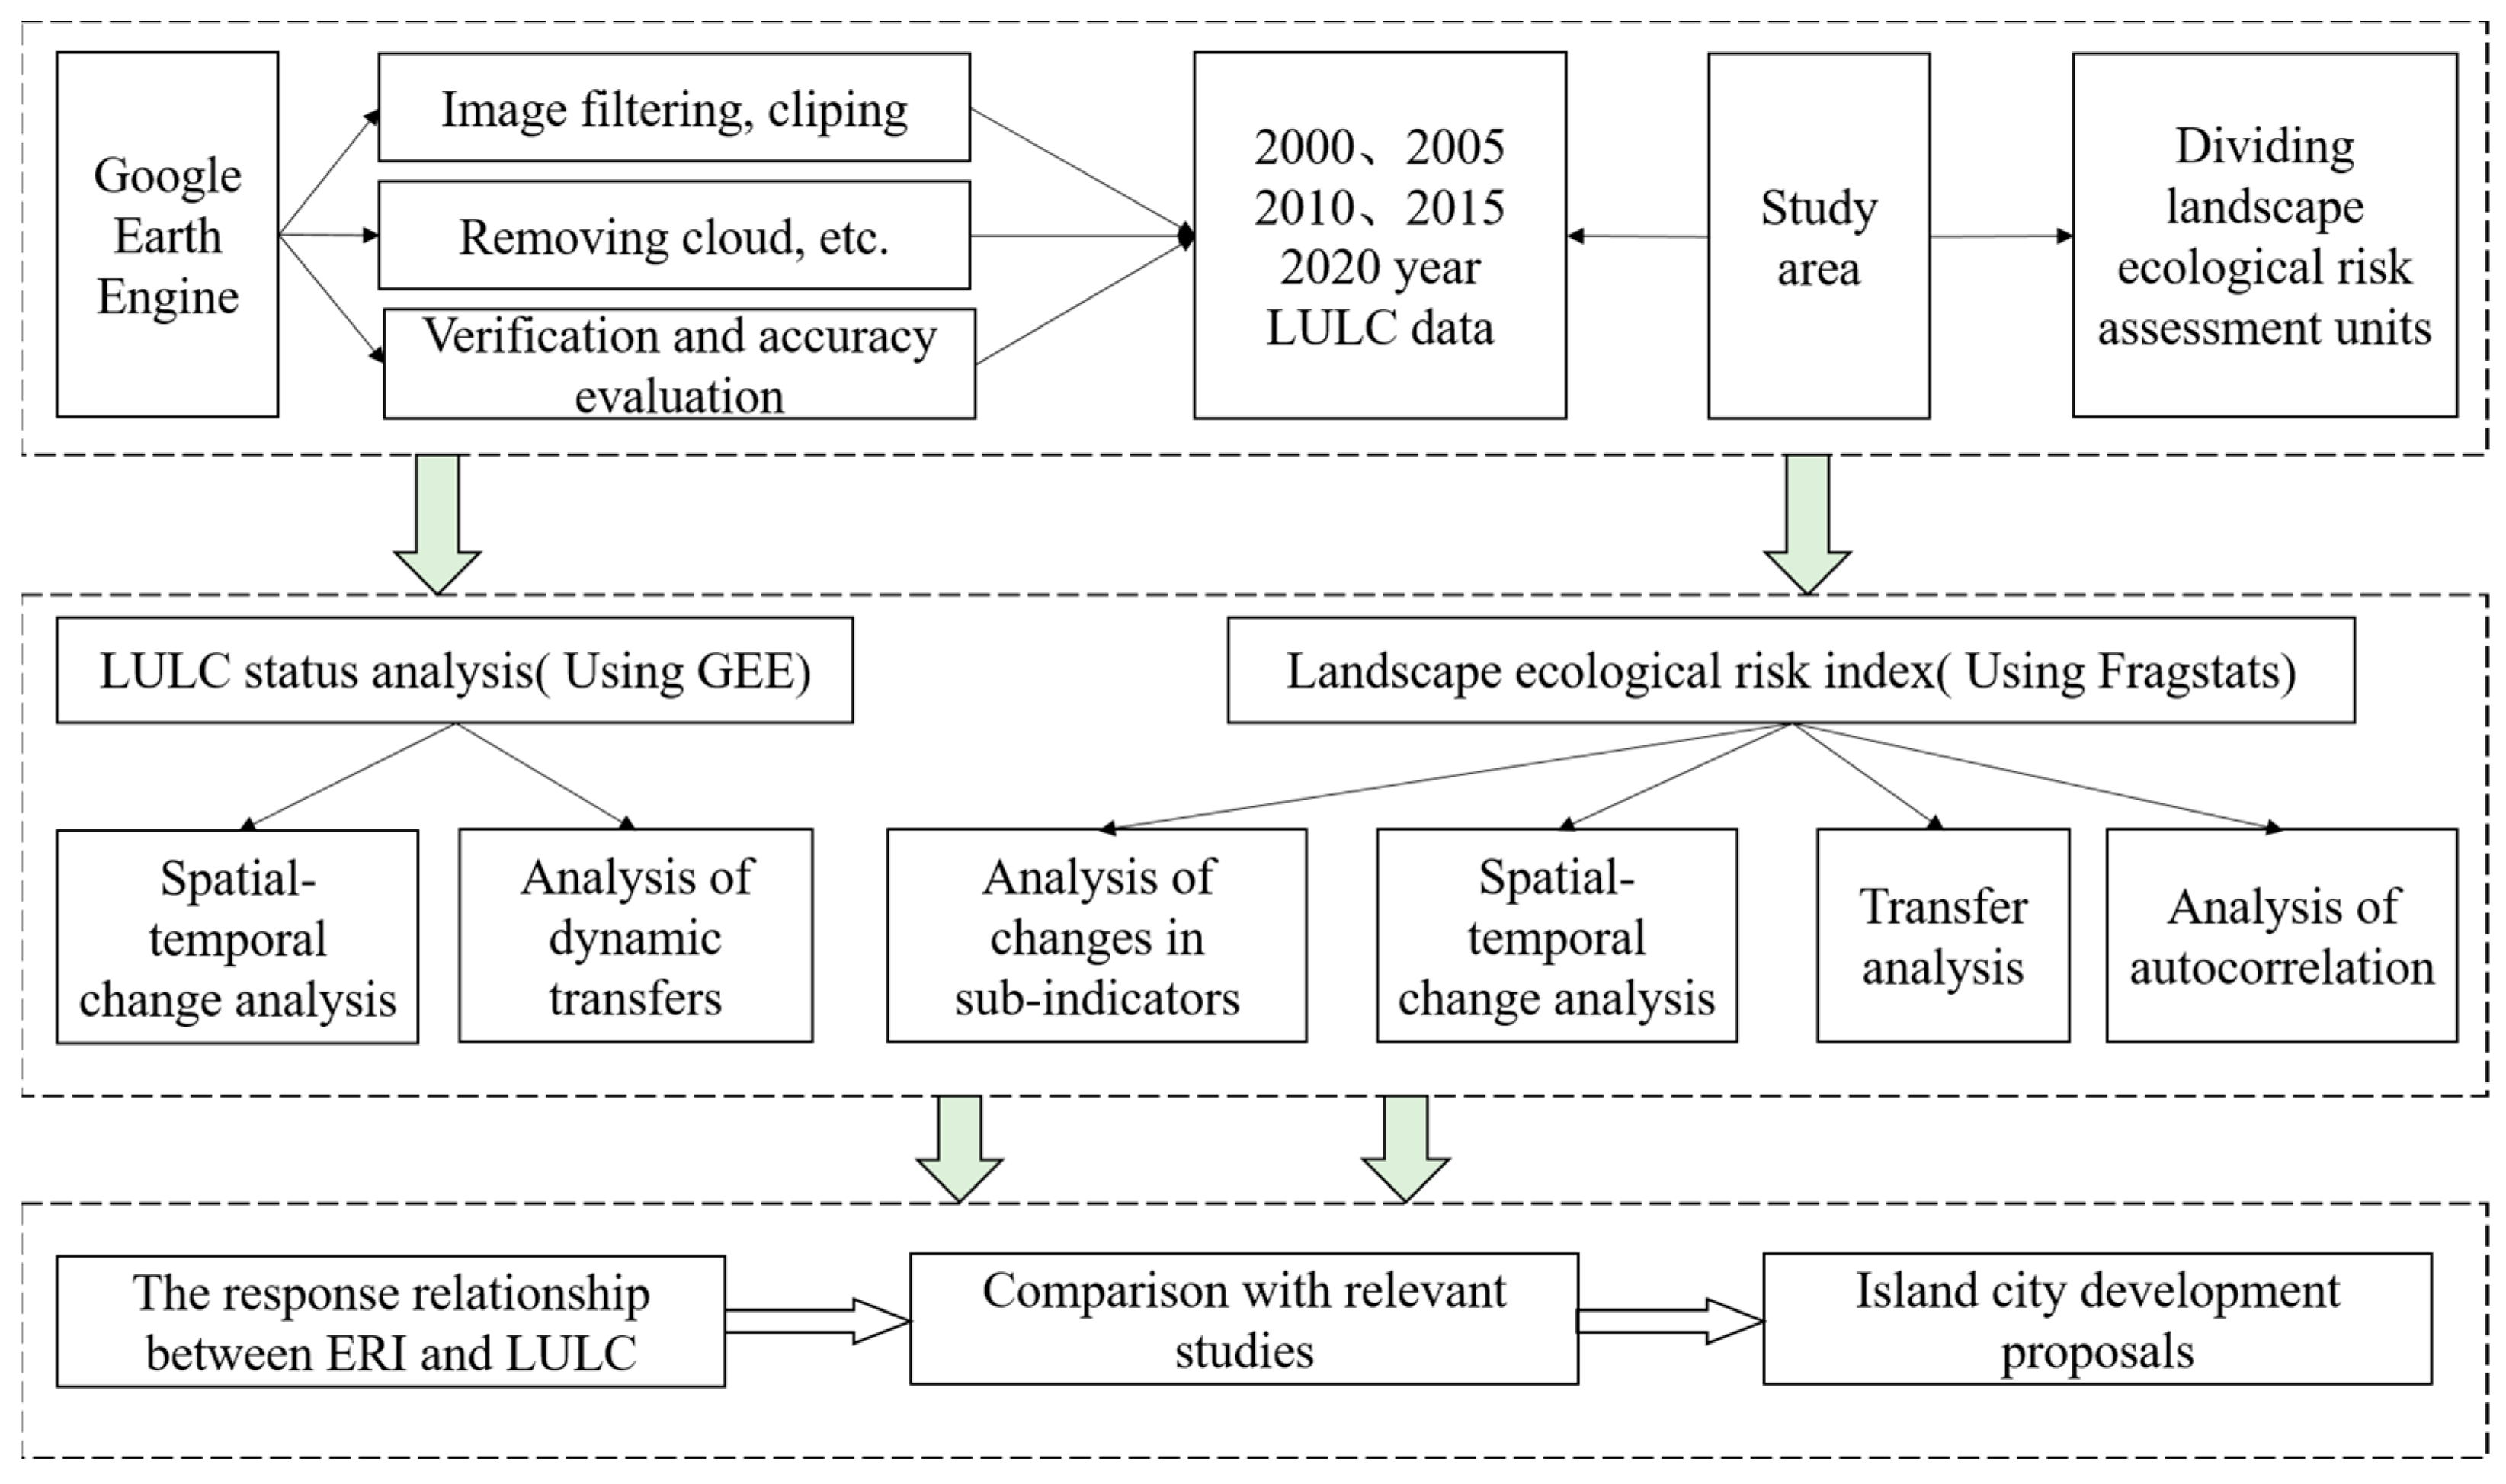
2. Data and Methods
2.1. Study Area
2.2. Data Sources
2.3. Methods
2.3.1. LULC Dynamics
2.3.2. Analysis of LULC Transfer Matrices
2.3.3. Division of Landscape Ecological Risk Assessment Units
2.3.4. Construction of Landscape Risk Index
2.3.5. Spatial Autocorrelation Analysis
3. Results and Analysis
3.1. Spatial–Temporal Analysis of LULC Change in Zhoushan Island
3.1.1. Spatial Distribution Characteristics of LULC and Changes in Use Structure
3.1.2. LULC Dynamics Analysis and Transfer Analysis
3.2. Spatial–Temporal Analysis of Landscape Ecological Risk Changes in Zhoushan Island
3.2.1. Changes in Landscape Indices of Zhoushan Island
3.2.2. Temporal Evolution Characteristics of Landscape Ecological Risks in Zhoushan Island
3.2.3. Spatial Evolution of Landscape Ecological Risks in Zhoushan Island
3.3. Spatial Correlation Analysis of Landscape Ecological Risks
4. Discussion
4.1. Response Relationship between LULC and Landscape Ecological Risks
4.2. Comparison with Existing Studies
4.3. Recommendations for Future Development
5. Conclusions
Author Contributions
Funding
Institutional Review Board Statement
Informed Consent Statement
Data Availability Statement
Conflicts of Interest
References
- Hernandez, Y.; Guimarães Pereira, Â.; Barbosa, P. Resilient Futures of a Small Island: A Participatory Approach in Tenerife (Canary Islands) to Address Climate Change. Environ. Sci. Policy 2018, 80, 28–37. [Google Scholar] [CrossRef]
- Minx, J.C.; Callaghan, M.; Lamb, W.F.; Garard, J.; Edenhofer, O. Learning about Climate Change Solutions in the IPCC and Beyond. Environ. Sci. Policy 2017, 77, 252–259. [Google Scholar] [CrossRef]
- Chi, Y.; Liu, D.; Xing, W.; Wang, J. Island Ecosystem Health in the Context of Human Activities with Different Types and Intensities. J. Clean. Prod. 2021, 281, 125334. [Google Scholar] [CrossRef]
- Teniwut, W.A.; Hamid, S.K.; Makailipessy, M.M. Developing a Masterplan for a Sustainable Marine Sector in a Small Islands Region: Integrated MCE Spatial Analysis for Decision Making. Land Use Policy 2022, 122, 106356. [Google Scholar] [CrossRef]
- Chi, Y.; Liu, D.; Zhang, M. Island Carrying Capacity for Three Development Types: Ecological Resource, Agricultural Production, and Urban Construction. Heliyon 2022, 8, e12232. [Google Scholar] [CrossRef] [PubMed]
- Li, J.; Lu, Y.; Li, X.; Wang, R.; Sun, Y.; Liu, Y.; Yao, K. Evaluation and Analysis of Development Status of Yellow River Beach Area Based on Multi-Source Data and Coordination Degree Model. Sustainability 2023, 15, 6086. [Google Scholar] [CrossRef]
- Wei, X.; Song, W.; Shao, Y.; Cai, X. Progress of Ecological Restoration Research Based on Bibliometric Analysis. Int. J. Environ. Res. Public. Health 2023, 20, 520. [Google Scholar] [CrossRef]
- Zhang, Y.; Li, Y.; Lv, J.; Wang, J.; Wu, Y. Scenario Simulation of Ecological Risk Based on Land Use/Cover Change—A Case Study of the Jinghe County, China. Ecol. Indic. 2021, 131, 108176. [Google Scholar] [CrossRef]
- Yonaba, R.; Koïta, M.; Mounirou, L.A.; Tazen, F.; Queloz, P.; Biaou, A.C.; Niang, D.; Zouré, C.; Karambiri, H.; Yacouba, H. Spatial and Transient Modelling of Land Use/Land Cover (LULC) Dynamics in a Sahelian Landscape under Semi-Arid Climate in Northern Burkina Faso. Land Use Policy 2021, 103, 105305. [Google Scholar] [CrossRef]
- Tan, L.; Luo, W.; Yang, B.; Huang, M.; Shuai, S.; Cheng, C.; Zhou, X.; Li, M.; Hu, C. Evaluation of Landscape Ecological Risk in Key Ecological Functional Zone of South–to–North Water Diversion Project, China. Ecol. Indic. 2023, 147, 109934. [Google Scholar] [CrossRef]
- Ju, H.; Niu, C.; Zhang, S.; Jiang, W.; Zhang, Z.; Zhang, X.; Yang, Z.; Cui, Y. Spatiotemporal Patterns and Modifiable Areal Unit Problems of the Landscape Ecological Risk in Coastal Areas: A Case Study of the Shandong Peninsula, China. J. Clean. Prod. 2021, 310, 127522. [Google Scholar] [CrossRef]
- Zhang, W.; Chang, W.J.; Zhu, Z.C.; Hui, Z. Landscape Ecological Risk Assessment of Chinese Coastal Cities Based on Land Use Change. Appl. Geogr. 2020, 117, 102174. [Google Scholar] [CrossRef]
- Karimian, H.; Zou, W.; Chen, Y.; Xia, J.; Wang, Z. Landscape Ecological Risk Assessment and Driving Factor Analysis in Dongjiang River Watershed. Chemosphere 2022, 307, 135835. [Google Scholar] [CrossRef]
- Lapointe, M.; Gurney, G.G.; Cumming, G.S. Urbanization Alters Ecosystem Service Preferences in a Small Island Developing State. Ecosyst. Serv. 2020, 43, 101109. [Google Scholar] [CrossRef]
- Zhang, H.; Xiao, Y.; Deng, Y. Island Ecosystem Evaluation and Sustainable Development Strategies: A Case Study of the Zhoushan Archipelago. Glob. Ecol. Conserv. 2021, 28, e01603. [Google Scholar] [CrossRef]
- Chen, C.; Liang, J.; Xie, F.; Hu, Z.; Sun, W.; Yang, G.; Yu, J.; Chen, L.; Wang, L.; Wang, L.; et al. Temporal and Spatial Variation of Coastline Using Remote Sensing Images for Zhoushan Archipelago, China. Int. J. Appl. Earth Obs. Geoinf. 2022, 107, 102711. [Google Scholar] [CrossRef]
- Zheng, W.; Cai, F.; Chen, S.; Zhu, J.; Qi, H.; Cao, H.; Zhao, S. Beach Management Strategy for Small Islands: Case Studies of China. Ocean Coast. Manag. 2020, 184, 104908. [Google Scholar] [CrossRef]
- China Natural Resources Statistics Bulletin 2022; Ministry of Natural Resources of the People’s Republic of China: Beijing, China, 2023; Volume 4.
- Wu, Y.; Zhang, T.; Zhang, H.; Pan, T.; Ni, X.; Grydehøj, A.; Zhang, J. Factors Influencing the Ecological Security of Island Cities: A Neighborhood-Scale Study of Zhoushan Island, China. Sustain. Cities Soc. 2020, 55, 102029. [Google Scholar] [CrossRef]
- Lin, Y.; Yang, Y.; Li, P.; Feng, C.; Ding, J.; Zhou, J.; Jiang, Q.; Ye, G. Spatial-Temporal Evaluation of Marine Ecological Civilization of Zhejiang Province, China. Mar. Policy 2022, 135, 104835. [Google Scholar] [CrossRef]
- Cao, W.; Li, R.; Chi, X.; Chen, N.; Chen, J.; Zhang, H.; Zhang, F. Island Urbanization and Its Ecological Consequences: A Case Study in the Zhoushan Island, East China. Ecol. Indic. 2017, 76, 1–14. [Google Scholar] [CrossRef]
- Pan, Y.; Zhai, M.; Lin, L.; Lin, Y.; Cai, J.; Deng, J.; Wang, K. Characterizing the Spatiotemporal Evolutions and Impact of Rapid Urbanization on Island Sustainable Development. Habitat Int. 2016, 53, 215–227. [Google Scholar] [CrossRef]
- Foga, S.; Scaramuzza, P.L.; Guo, S.; Zhu, Z.; Dilley, R.D.; Beckmann, T.; Schmidt, G.L.; Dwyer, J.L.; Joseph Hughes, M.; Laue, B. Cloud Detection Algorithm Comparison and Validation for Operational Landsat Data Products. Remote Sens. Environ. 2017, 194, 379–390. [Google Scholar] [CrossRef] [Green Version]
- Xin, X.; Zhang, T.; He, F.; Zhang, W.; Chen, K. Assessing and Simulating Changes in Ecosystem Service Value Based on Land Use/Cover Change in Coastal Cities: A Case Study of Shanghai, China. Ocean Coast. Manag. 2023, 239, 106591. [Google Scholar] [CrossRef]
- Foody, G.M. Explaining the Unsuitability of the Kappa Coefficient in the Assessment and Comparison of the Accuracy of Thematic Maps Obtained by Image Classification. Remote Sens. Environ. 2020, 239, 111630. [Google Scholar] [CrossRef]
- Alves, A.; Marcelino, F.; Gomes, E.; Rocha, J.; Caetano, M. Spatiotemporal Land-Use Dynamics in Continental Portugal 1995–2018. Sustainability 2022, 14, 15540. [Google Scholar] [CrossRef]
- Ai, J.; Yu, K.; Zeng, Z.; Yang, L.; Liu, Y.; Liu, J. Assessing the Dynamic Landscape Ecological Risk and Its Driving Forces in an Island City Based on Optimal Spatial Scales: Haitan Island, China. Ecol. Indic. 2022, 137, 108771. [Google Scholar] [CrossRef]
- Li, J.; Pu, R.; Gong, H.; Luo, X.; Ye, M.; Feng, B. Evolution Characteristics of Landscape Ecological Risk Patterns in Coastal Zones in Zhejiang Province, China. Sustainability 2017, 9, 584. [Google Scholar] [CrossRef] [Green Version]
- Wang, H.; Liu, X.; Zhao, C.; Chang, Y.; Liu, Y.; Zang, F. Spatial-Temporal Pattern Analysis of Landscape Ecological Risk Assessment Based on Land Use/Land Cover Change in Baishuijiang National Nature Reserve in Gansu Province, China. Ecol. Indic. 2021, 124, 107454. [Google Scholar] [CrossRef]
- Wang, D.; Chai, H.; Wang, Z.; Wang, K.; Wang, H.; Long, H.; Gao, J.; Wei, A.; Wang, S. Dynamic Monitoring and Ecological Risk Analysis of Lake Inundation Areas in Tibetan Plateau. Sustainability 2022, 14, 13332. [Google Scholar] [CrossRef]
- Getis, A. Reflections on Spatial Autocorrelation. Reg. Sci. Urban Econ. 2007, 37, 491–496. [Google Scholar] [CrossRef]
- Yang, H.; Zhong, X.; Deng, S.; Nie, S. Impact of LUCC on Landscape Pattern in the Yangtze River Basin during 2001–2019. Ecol. Inform. 2022, 69, 101631. [Google Scholar] [CrossRef]
- Liu, Y.; Xu, W.; Hong, Z.; Wang, L.; Ou, G.; Lu, N. Assessment of Spatial-Temporal Changes of Landscape Ecological Risk in Xishuangbanna, China from 1990 to 2019. Sustainability 2022, 14, 10645. [Google Scholar] [CrossRef]


| Landscape Index | Expression and Formula | Meaning |
|---|---|---|
| Landscape Loss Index (Ri) | , Ei and Vi represent the landscape disturbance index and landscape vulnerability index, respectively. | Ri reflects the interaction of external influences on the landscape with its own characteristic [12]. |
| Landscape Disturbance Index (Ei) | a, b, c are the weights of each index, Ci, Ni, and Fi represents the landscape fragmentation index, landscape separation index, and landscape fractal dimension. | Ei is a quantitative expression of the degree of disturbance of different landscapes. The higher the value, the greater the degree of disturbance. In this study, the weight coefficients a, b, and c are 0.5, 0.3, and 0.2, respectively [27]. |
| Landscape Fragmentation Index (Ci) | ni represents the number of patches of landscape; Ai represents the total area of landscape of type i. | Landscape fragmentation is a process in which the internal properties of the landscape gradually become complex for various reasons, forming various heterogeneous and discontinuous patch mosaics [8]. This index indicates the degree of fragmentation of the landscape; the larger the value, the higher the degree of fragmentation. |
| Landscape Separation Index (Ni) | A represents the total area of the landscape. | Ni represents the degree of dispersion in the spatial distribution of different patches of a landscape type [29]. The higher this value, the more chaotic the separation. |
| Landscape Fractal Dimension (Fi) | Li represents the perimeter of landscape type i. | Fi means the fractal dimension index of the internal geometry of the patch, with larger values indicating more complex landscape patch structures and variations [30]. |
| Landscape Vulnerability Index Vi | Landscape vulnerability is an intrinsic factor affecting regional ecological risks and refers to the resilience of landscapes to external risk activities [8]. In this paper, six different landscape types are assigned and the assigned values are normalized according to the assigned value: from smallest to largest, built-up land 1, woodland 2, grassland 3, waterbodies 4, sea areas 5, mudflats 6. The normalized vulnerability coefficients are respectively 0.0476, 0.0952, 0.1429, 0.1905, 0.2381, and 0.2857. | |
| 2000–2005 | 2005–2010 | 2010–2015 | 2015–2020 | ||
|---|---|---|---|---|---|
| Single LULC dynamics | Built-up land | −5.26 | 33.14 | −4.80 | 11.52 |
| Waterbodies | 34.80 | −13.89 | −10.05 | 19.82 | |
| Woodland | 2.94 | 0.91 | −5.73 | 10.11 | |
| Grassland | −2.54 | −5.18 | 20.01 | −11.42 | |
| Mudflat | −11.80 | 5.63 | −19.00 | 13.33 | |
| Sea area | −0.20 | −10.63 | −7.28 | −15.84 | |
| Comprehensive land use dynamics | 2.03 | 3.06 | 4.66 | 5.56 | |
| Landscape Type | Year | PA/ha | NP | Ci | Ni | Fi | Ei | Vi | Ri |
|---|---|---|---|---|---|---|---|---|---|
| Built-up land | 2000 | 5425.72 | 6535 | 0.6536 | 0.0627 | 1.2983 | 0.2787 | 0.0476 | 0.0133 |
| 2005 | 3932.35 | 3406 | 0.4678 | 0.0721 | 1.3516 | 0.2921 | 0.0139 | ||
| 2010 | 10,320.60 | 8863 | 0.6227 | 0.0460 | 1.2952 | 0.2730 | 0.0130 | ||
| 2015 | 8023.46 | 7535 | 0.6187 | 0.0533 | 1.3365 | 0.2835 | 0.0135 | ||
| 2020 | 12,260.66 | 5589 | 0.3905 | 0.0354 | 1.2354 | 0.2578 | 0.0123 | ||
| Waterbodies | 2000 | 1242.19 | 2897 | 0.7081 | 0.1215 | 1.4730 | 0.3314 | 0.1905 | 0.0631 |
| 2005 | 3552.25 | 11,390 | 1.0621 | 0.0712 | 1.3371 | 0.2891 | 0.0551 | ||
| 2010 | 1021.48 | 1868 | 0.5509 | 0.1236 | 1.5568 | 0.3487 | 0.0664 | ||
| 2015 | 506.96 | 534 | 0.1829 | 0.1093 | 1.5467 | 0.3424 | 0.0652 | ||
| 2020 | 1004.62 | 1051 | 0.3303 | 0.1118 | 1.4894 | 0.3317 | 0.0632 | ||
| Woodland | 2000 | 21,026.35 | 5294 | 0.2452 | 0.0209 | 1.1186 | 0.2301 | 0.0952 | 0.0219 |
| 2005 | 24,046.58 | 4473 | 0.1936 | 0.0168 | 1.1113 | 0.2273 | 0.0217 | ||
| 2010 | 25,096.26 | 6335 | 0.2162 | 0.0157 | 1.1466 | 0.2341 | 0.0223 | ||
| 2015 | 18,027.71 | 4717 | 0.2411 | 0.0237 | 1.2026 | 0.2477 | 0.0236 | ||
| 2020 | 27,101.56 | 4986 | 0.2025 | 0.0163 | 1.1228 | 0.2295 | 0.0219 | ||
| Grassland | 2000 | 18,185.92 | 6989 | 0.2848 | 0.0196 | 1.1218 | 0.2303 | 0.1429 | 0.0329 |
| 2005 | 15,833.94 | 6356 | 0.3294 | 0.0263 | 1.1626 | 0.2405 | 0.0344 | ||
| 2010 | 12,028.29 | 11,830 | 0.4753 | 0.0268 | 1.2379 | 0.2557 | 0.0365 | ||
| 2015 | 23,565.07 | 7933 | 0.2340 | 0.0125 | 1.1625 | 0.2363 | 0.0338 | ||
| 2020 | 10,337.70 | 8937 | 0.4405 | 0.0313 | 1.2381 | 0.2571 | 0.0367 | ||
| Mudflat | 2000 | 2434.01 | 2016 | 0.3939 | 0.0842 | 1.3760 | 0.3007 | 0.2857 | 0.0859 |
| 2005 | 1000.13 | 934 | 0.1779 | 0.0861 | 1.3992 | 0.3059 | 0.0874 | ||
| 2010 | 1279.06 | 1448 | 0.2857 | 0.0847 | 1.4567 | 0.3170 | 0.0906 | ||
| 2015 | 73.67 | 436 | 0.1803 | 0.1795 | 1.7226 | 0.3988 | 0.1139 | ||
| 2020 | 115.75 | 642 | 0.2992 | 0.1739 | 1.6275 | 0.3781 | 0.1080 | ||
| Sea area | 2000 | 2670.3162 | 1261 | 0.4822 | 0.1431 | 1.4743 | 0.3382 | 0.2381 | 0.0805 |
| 2005 | 2619.2525 | 763 | 0.1252 | 0.0552 | 1.2743 | 0.2716 | 0.0647 | ||
| 2010 | 1238.7937 | 894 | 0.3034 | 0.1427 | 1.5646 | 0.3561 | 0.0848 | ||
| 2015 | 787.6216 | 627 | 0.2045 | 0.1088 | 1.5471 | 0.3424 | 0.0815 | ||
| 2020 | 164.2063 | 241 | 0.0781 | 0.0970 | 1.5133 | 0.3320 | 0.0791 |
| Ecological Risk Level | Area (km2) | Proportion (%) | ||||||||
|---|---|---|---|---|---|---|---|---|---|---|
| 2000 | 2005 | 2010 | 2015 | 2020 | 2000 | 2005 | 2010 | 2015 | 2020 | |
| Lowest risk | 8.02 | 3.65 | 8.17 | 7.89 | 22.97 | 1.57 | 0.72 | 1.60 | 1.55 | 4.51 |
| Lower risk | 231.73 | 235.11 | 322.94 | 213.73 | 395.60 | 45.47 | 46.12 | 63.35 | 41.93 | 77.60 |
| Medium risk | 225.34 | 234.69 | 157.41 | 283.96 | 90.44 | 44.22 | 46.04 | 30.88 | 55.70 | 17.74 |
| Higher risk | 27.18 | 25.15 | 9.58 | 3.95 | 0.70 | 5.33 | 4.93 | 1.88 | 0.78 | 0.14 |
| Highest risk | 17.33 | 11.14 | 11.65 | 0.23 | 0.05 | 3.40 | 2.19 | 2.29 | 0.05 | 0.01 |
| Year | Moran’s I Index | p Value | Variance | Z Score |
|---|---|---|---|---|
| 2000 | 0.446468 | <0.0001 | 0.000121 | 40.678154 |
| 2005 | 0.432329 | <0.0001 | 0.000121 | 39 391520 |
| 2010 | 0.473517 | <0.0001 | 0.000121 | 43.164383 |
| 2015 | 0.403730 | <0.0001 | 0.000121 | 36.784233 |
| 2020 | 0.428432 | <0.0001 | 0.000121 | 39.029934 |
Disclaimer/Publisher’s Note: The statements, opinions and data contained in all publications are solely those of the individual author(s) and contributor(s) and not of MDPI and/or the editor(s). MDPI and/or the editor(s) disclaim responsibility for any injury to people or property resulting from any ideas, methods, instructions or products referred to in the content. |
© 2023 by the authors. Licensee MDPI, Basel, Switzerland. This article is an open access article distributed under the terms and conditions of the Creative Commons Attribution (CC BY) license (https://creativecommons.org/licenses/by/4.0/).
Share and Cite
Li, S.; Wang, L.; Zhao, S.; Gui, F.; Le, Q. Landscape Ecological Risk Assessment of Zhoushan Island Based on LULC Change. Sustainability 2023, 15, 9507. https://doi.org/10.3390/su15129507
Li S, Wang L, Zhao S, Gui F, Le Q. Landscape Ecological Risk Assessment of Zhoushan Island Based on LULC Change. Sustainability. 2023; 15(12):9507. https://doi.org/10.3390/su15129507
Chicago/Turabian StyleLi, Sizheng, Liuzhu Wang, Sheng Zhao, Feng Gui, and Qun Le. 2023. "Landscape Ecological Risk Assessment of Zhoushan Island Based on LULC Change" Sustainability 15, no. 12: 9507. https://doi.org/10.3390/su15129507