Article

A Hybrid Multi-Criteria Decision Analysis to Explore Barriers to the Circular Economy Implementation in the Food Supply Chain

by
Fahime Lotfian Delouyi
1,*,
Meisam Ranjbari
2 and
Zahra Shams Esfandabadi
3,*
1
Department of Mechanical Engineering, Faculty of Engineering, University of Zabol, Zabol 98613-35856, Iran
2
Department of Economics and Statistics “Cognetti de Martiis”, University of Turin, 10153 Turin, Italy
3
Department of Management, University of Turin, 10134 Turin, Italy
*
Authors to whom correspondence should be addressed.
Sustainability 2023, 15(12), 9506; https://doi.org/10.3390/su15129506
Submission received: 3 May 2023 / Revised: 1 June 2023 / Accepted: 8 June 2023 / Published: 13 June 2023

Abstract

:
This research aims to identify, categorize, and prioritize the barriers hindering the implementation of the circular economy (CE) within food supply chains. To do so, a hybrid multi-criteria decision analysis method, combining a decision-making trial and evaluation laboratory (DEMATEL) and the analytical network process (ANP), is used to analyze multiple determinants extracted from the target literature and the expert panel opinions. As a result, the key barriers to implementing the CE in the food sector were identified and ranked through the hybrid multi-criteria decision analysis. The practicality and validity of the model in the case of causal relationships that have hindered the CE transition in the food sector in Iran, as a developing country, are examined. A total of 15 barriers in six dimensions were analyzed. The “technical and technological capabilities”, “financial issues”, and “production issues” were distinguished as the most important dimensions. Moreover, “lack of circular design and innovative packaging to reduce food waste”, “high cost of CE implementation”, and “insufficient use of reusable, recyclable, and recoverable materials” were identified as the key barriers in the CE transition in food supply chains. The findings of this study revealed that “government policies”, “culture”, and “financial issues” were the most significant “cause” dimensions, which could leverage the elimination of “effect” dimensions, including “technical and technological capabilities”, “management and collaboration issues”, and “production issues”. The identified challenges and barriers pave the way for CE implementation and outline focal points for decision makers to mobilize their efforts in this regard. The findings can effectively contribute to the domain by providing insightful guidelines for the government and associated authorities, policymakers, and all stakeholders within the food supply chain to support the CE transition in the food sector.

1. Introduction

The traditional business models mainly operate based on the “take–make–dispose” model, in which virgin raw material is extracted and products are produced and sold to end customers; these products become waste at their end-of-life and are discarded by the customers [1,2]. This linear-based approach of production and consumption depletes non-renewable resources and leads to severe ecological, economic, and social impacts on the global community [3]. Hence, due to global concerns about the sustainable environment and resource efficiency, the transition from a linear economy to a circular economy (CE) has gained momentum in recent years as a solution to tackle the associated challenges by increasing resource efficiency, minimizing waste, and reducing emissions during product lifecycles [4,5].
The CE with a regenerative nature focusing on closing the supply chain loops significantly relies on effective waste management practices, from waste prevention at the top of the waste hierarchy to disposal at the bottom [6]. In this regard, implementing the CE within the various ranges of industries and sectors—such as the automobile industry [7], the construction industry [8], the textile and clothing industry [9], food supply chains [10,11], biofuel industries [12], and municipal solid waste treatment systems [13,14]—has been under intense investigation. Nevertheless, putting the CE in place faces significant challenges, and it is still unexplored due to the primary focus on the linear economy model [15].
The food industry as a global complex network of various businesses to provide people with food is one of the largest industries in the world. In this vein, food waste is significant in supply chains due to the increasing population and the need to mass produce food on an industrial scale, resulting in a wide range of adverse effects on society, the economy, and the environment. After mobility and housing, the provision of food for nutrition is the third biggest contributor to global emissions, contributing approximately 10 billion tonnes of emissions [16]. Based on the food waste index report provided by the United Nations Environment Program, around 8–10% of global greenhouse gas emissions are linked to food waste and loss [17]. For instance, the current agricultural system in Europe generates approximately 700 million tonnes of agro-food waste per year [18]. Hence, through better use of resources, the industry needs to change the way food is produced in a CE framework, especially in cities where approximately 80% of food will be consumed by 2050 [19]. There is an utmost need to reduce food waste and loss by rethinking, redesigning, and operating all practices within the food supply chain in a more sustainable and CE-based setting. In this vein, effective policies and actions are needed to support food systems in tackling food waste and loss towards achieving sustainable development goals, in particular, goals 2 (zero hunger) and 12 (sustainable consumption and production) launched by the United Nations [20].
The agri-food sector has notable potential in transitioning toward a CE as well as a low-carbon and climate-friendly economy since food waste is considered a significant contributor to global waste generation [21]. However, due to the complexity of food systems and potential conflicts among involved stakeholders within the food supply chain, creating closed loops and circularity within this industry face multiple challenges. Food waste in developed countries is mainly seen in the consumption stage, whereas due to poor handling and storage facilities in developing and emerging economies, production and post-harvest phases generate more waste [15]. Mehmood et al. [21] introduced environmental, policy and economic, and financial benefits as the most important drivers of the CE implementation in the agri-food supply chain, while institutional, financial, and technological risks appeared as the most challenging associated barriers. In an empirical survey to identify the main barriers to the implementation of sustainable food consumption and production in China, Liu et al. [22] identified that the lack of environmental regulations and education plays a key role.
However, although the contribution of the food industry to the CE transition has been investigated from different perspectives, from farm production to household consumption, the empirical research in this area is still in its infancy stage. In this vein, identifying the most critical drivers and barriers to implementing CE within the food supply chain is of great importance. Therefore, this research aims at identifying, categorizing, and prioritizing the barriers to implementing CE in food supply chains and highlighting their causal relationships in Iran, as a developing country. In this regard, the following two questions are answered in this research: (i) What are the main barriers to implementing a CE in the food sector in Iran, and (ii) how are such barriers prioritized for action? To this end, a hybrid multi-criteria decision analysis (MCDA) method, combining a decision-making trial and evaluation laboratory (DEMATEL) and the analytical network process (ANP), is used to analyze multiple determinants extracted from the literature and expert opinions. MCDA methods have been widely used to support decision-making processes by identifying the best solution among a finite set of parameters within a wide range of domains, such as risk management [23], sustainable development [24], and project management [25].
While few pieces of research differentiated between hard barriers and soft barriers [26], to the best of our knowledge, none of them has quantified the impact of hard barriers and soft barriers. This study identified the impact of these types of barriers and determined the causal relationship between them.
The majority of the research on the CE has predominantly emphasized the context of developed countries, while studies specifically focusing on developing countries remain scarce [27]. Implementing CE in Iran, as a developing country, is still unexplored. Although several contributions have been made to support the CE transition in different industries and sectors—such as the water sector [28], and the cable and wire industry [29]—these studies have mainly focused on optimization models in closed-loop supply chains. As a result, there is still a significant gap in comprehensively understanding the barriers to the CE, especially within the food supply chains. Consequently, further research is necessary to address this issue. To the best of the authors’ knowledge, the current study is the first research in the literature that explores the main barriers to CE implementation in the food supply chain in Iran. Hence, the discoveries have the potential to contribute to the domain by offering valuable recommendations to policymakers, aiding the transition towards a circular economy in the food sector.
The remainder of the current research is structured as follows. Section 2 provides an overview of the MCDA applications in identifying barriers and drivers in implementing the CE within different industries. The applied method and data collection procedure are described in detail in Section 3. Section 4 delivers the analysis results and the main findings of the research, including identified barriers, the influential network relations map, and influential weights of the CE implementation barriers. A discussion of the main results is presented in Section 5, followed by concluding remarks, implications, limitations, and future research avenues for further developments in Section 6.

2. CE Barriers: An Overview
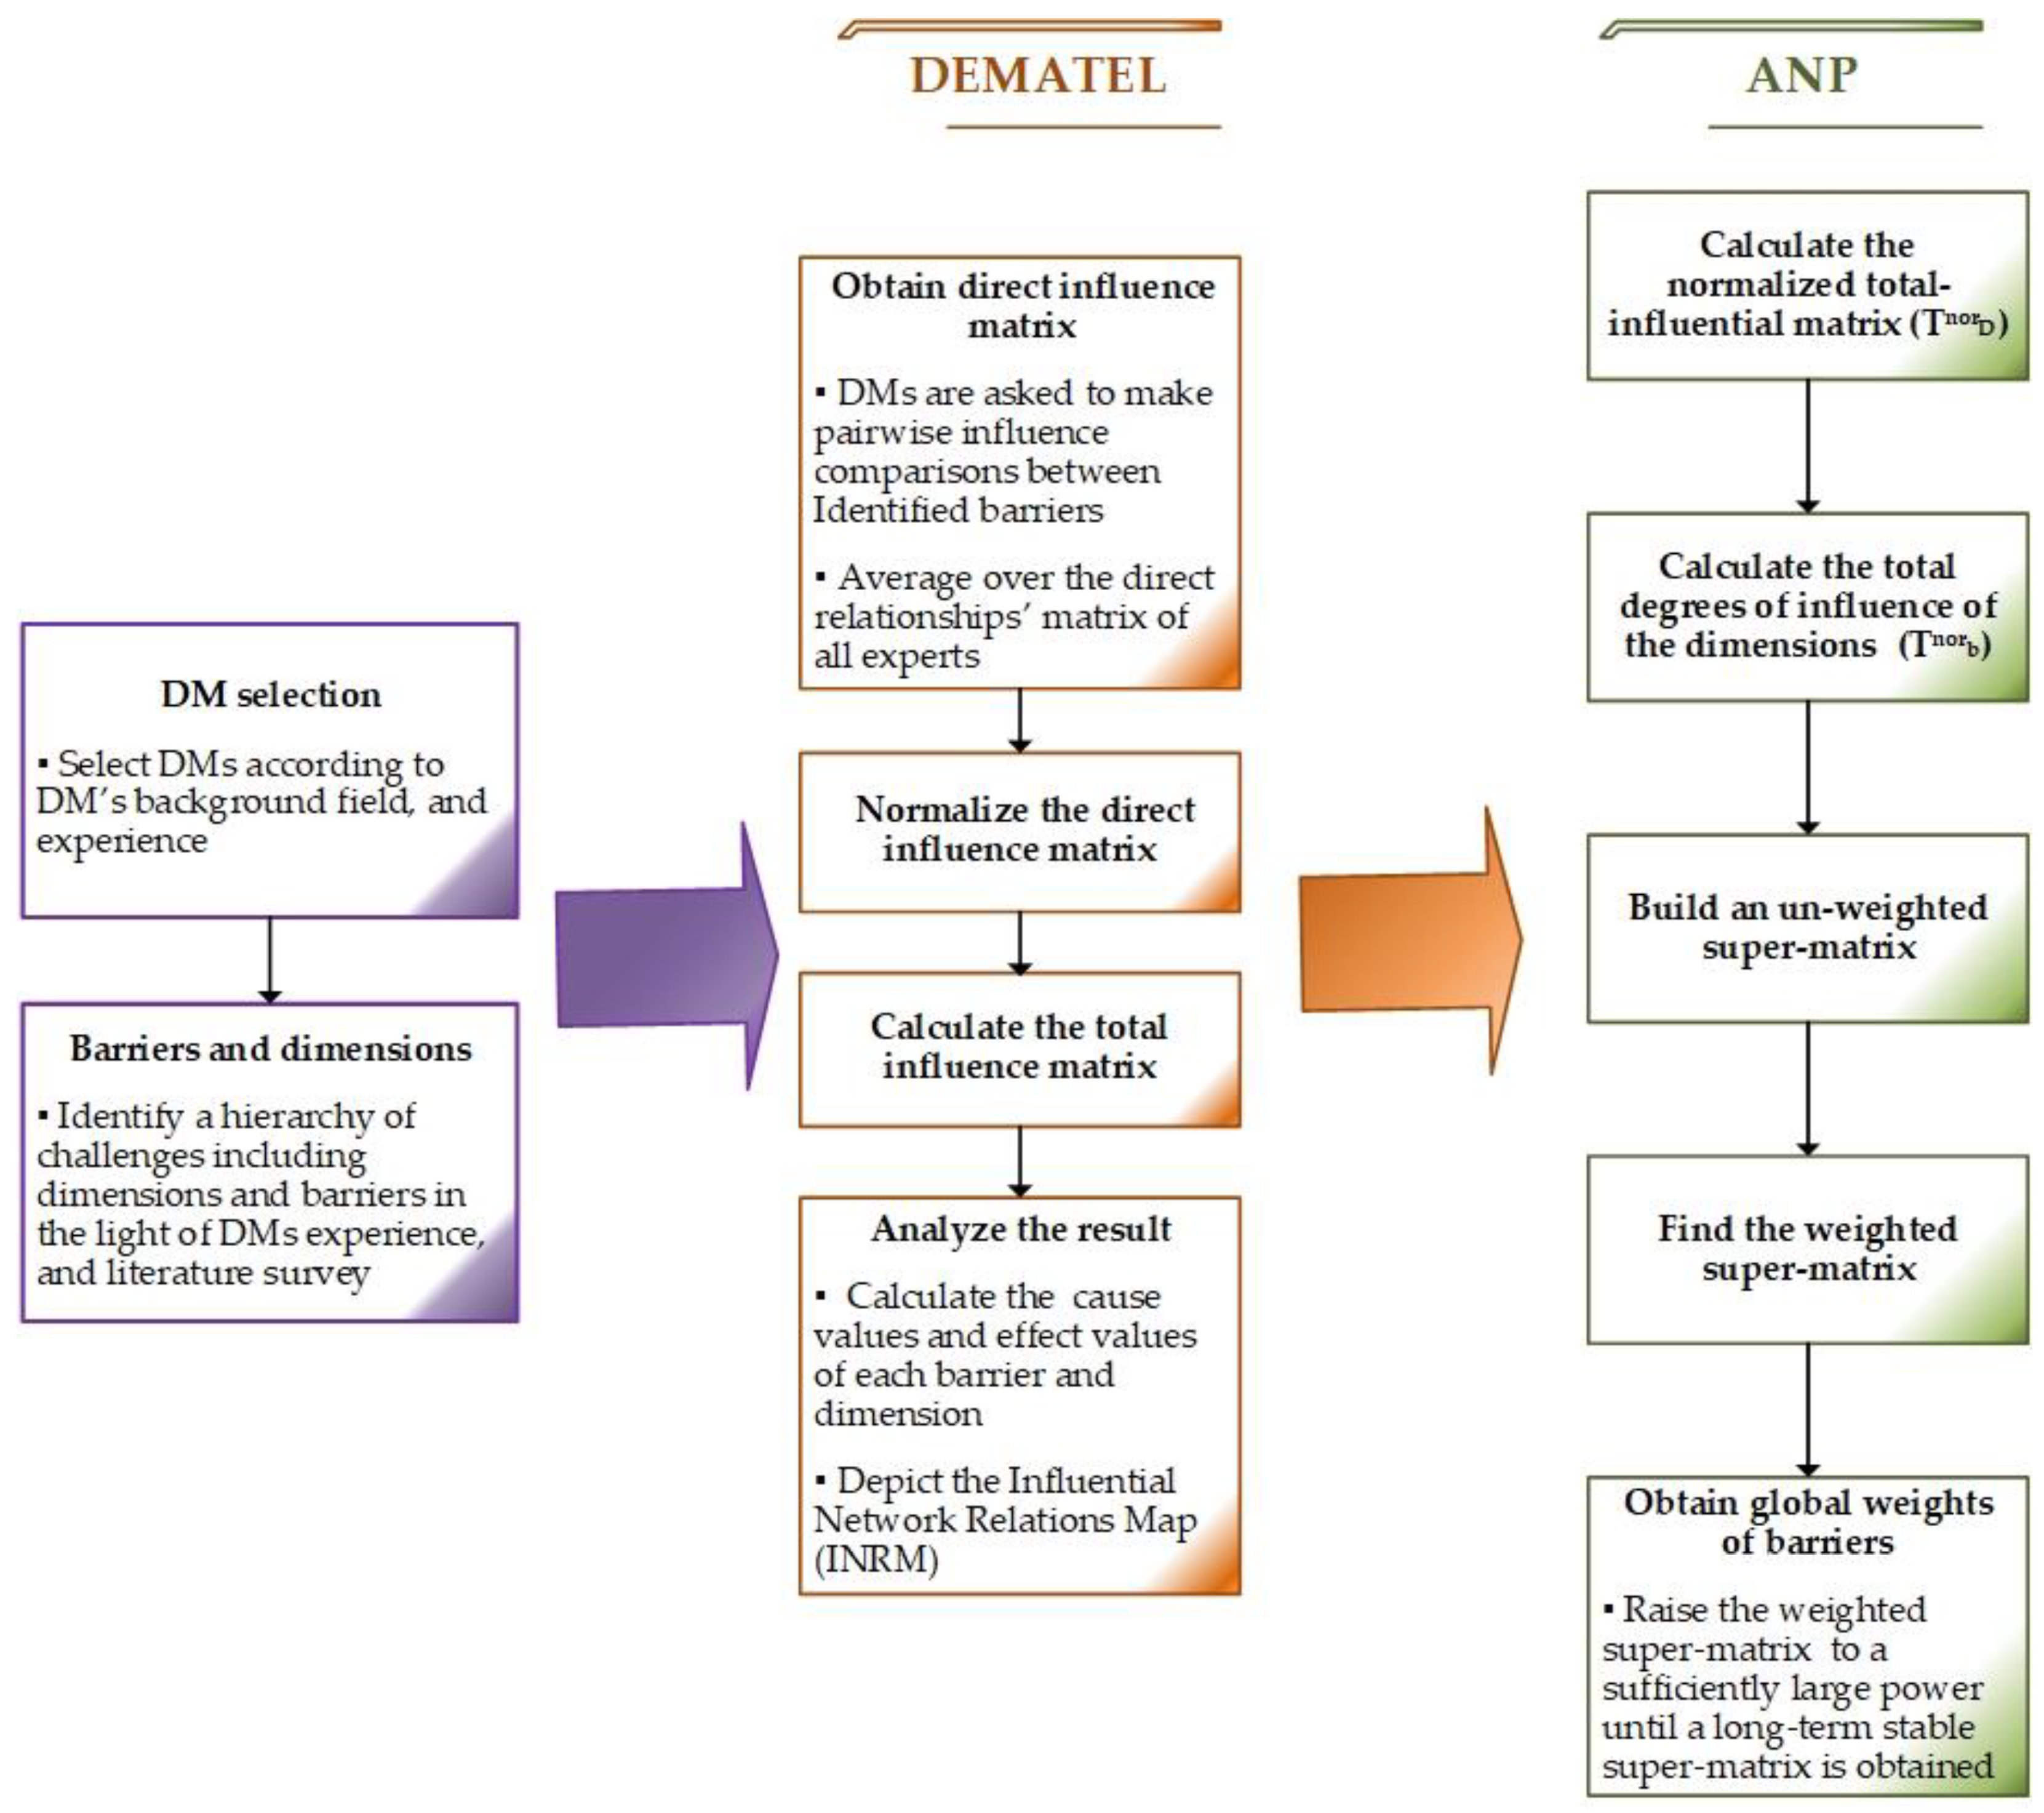
The increasing recognition of the importance of sustainability has encouraged researchers to highlight the CE potential in contributing to the achievement of sustainable development goals [30]. Sharma et al. [31] noted that waste management influences all pillars of sustainability; they concluded that CE brings long-term stability and provides economic, environmental, and social benefits. Over the last decade, the CE has attracted remarkable attention in the literature as a solution to tackle concerns about climate change, limited resources, unstable economic conditions, and exponential growth in generating waste [32].
The main body of research in the food waste domain has focused on energy production and food waste valorization through conversion processes in biorefineries [33,34,35,36] rather than food waste prevention at the consumption level. Previous studies have shown that major elements responsible for food waste and loss mainly come from stakeholder attitudes, ineffective management of perishable food items, buyer–supplier agreements, consumer behavior, and supply chain interruptions [37]. Hence, effective food waste management towards a CE requires an accurate measurement of the origin and volume of the generated waste and consumer awareness [38].
The CE proposes a new paradigm for the sustainable food industry which considers waste minimization and value mining of wastes to gain economic benefits and mitigate environmental loss [22]. Goyal [39] summarized the role of the CE in the food sector as a key player in reducing waste and hunger and enhancing social equality. However, food systems encounter many challenges due to the interdependency with political, environmental, institutional, and technological factors. Moreover, food value chains face loss and waste during various stages of the supply chain, such as agriculture, harvest, storage, process, transportation, consumption, and post-consumption [22]. Nevertheless, transitioning towards a CE is complex and faces multiple challenges and barriers. Hence, the limitation of the linear economy and the benefit of implementing CE have encouraged research communities to investigate the drivers and barriers toward the CE transition.
The CE implementation barriers have been investigated from different perspectives in different contexts. Kirchherr et al. [40] presented a detailed study on the CE barriers and distinguished four categories of barriers, including cultural, regulatory, market, and technological. They also noted that there are interaction effects among different categories. Grafström and Aasma [41] outlined four main barriers to implementing a CE in general, including technological, institutional, cultural, and market. Kumar et al. [42] highlighted the role of economic, socio-political, environmental, and legal challenges and barriers in the CE transition. Jaeger and Upadhyay [43] addressed high cost, complexity in supply chains and collaboration networks, and lack of technical skills and information as the main barriers to the CE implementation. However, due to the wide coverage of the CE within different sectors, each sector and industry might face different challenges. For instance, by conducting a systematic review, De Bernardi et al. [44] identified seven critical issues for the CE transition in food systems, namely, multistakeholder coordination, business models, consumer behavior, performance and measurement systems, transition processes, barriers, and digital technologies.
Since the CE implementation barriers are context/country-specific, the literature investigated the barriers for various industries in different countries [22]. Some studies are country-level, while others may be related to a specific region. Additionally, some of them are general while others concentrate on a specific industry and/or a specific product. In this regard, MCDA methods, as a powerful tool in decision-making processes based on multiple criteria, have been widely used in identifying and prioritizing solutions among a finite set of parameters [23]. Table 1 summarizes the research conducted on the CE drivers and barriers using various MCDA methods, highlighting the applied approach/method, the context and country, and the aims and results of the studies.
Moktadir et al. [45] referred to a lack of knowledge about the CE as the main barrier to the CE transition in leather industries. In research on construction and demolition waste management, Mahpour [46] found that the main barriers to the CE implementation are (i) recyclable construction materials, and (ii) ineffective waste dismantling, sorting, and transporting. Lack of financial resources was outlined as the main challenge of creating circular food supply chains in China [4]. Haleem et al. [47] identified that a lack of environmental law, insufficient financial resources, and lack of incentives play a key role in hindering the CE transition. The lack of tax relaxation policies and poor enforcement regulations to protect the environment were identified by Khandelwal and Barua [1] as the main barriers to the CE transition in the plastic industry. The complexity of the CE, poor information about shelf-life wastes, and economic viability were outlined by Ali et al. [27] as the main challenges to implementing the CE in the food industry in Pakistan. Challenges regarding government support, incentives, and policies were highlighted by Kumar et al. [48] as the main barriers in the circular agriculture supply chain in India.
Khan and Paul [32] identified reducing cost, resource efficiency, lack of expertise, and the feasibility of CE implementation in practice as the main factors hindering CE implementation in the automotive sector in Pakistan. Food quality, revenue growth, and resource utilization were determined by Kumar et al. [49] as the main barriers to the CE transition in the dairy industry in India. Weak legal enforcement, lack of investment in technologies, and behavioral barriers were proposed by Liu et al. [22] as the main challenges to CE implementation in the agri-food sector in China. In two similar studies conducted on the CE transition barriers in the food supply chain in India, while lack of technology, adequate food waste estimation, effective supply chain design, and sufficient benefits were identified by Gedam et al. [26], government policy and incentives, and enforcing environmental regulations were highlighted by Kumar et al. [50] as the main challenges in adopting the CE.

3. Methodology

The literature suggests various MCDM methods to deal with such complex problems. Selecting the appropriate MCDM method is a complicated problem [51]. However, the majority of the MCDM methods, such as AHP, assume that the criteria (barriers) are independent, which is not a realistic assumption in many real-world problems. Thus, more intelligent techniques are required to overcome the modeling of criteria (barriers) dependencies. ANP is one of the most preferable MCDM methods to model barrier dependencies. Despite its popularity, ANP encounters several difficulties in practice. Traditionally, the ANP method assumed that the network structure of barriers is known a priori. However, distinguishing the network structure of barriers is not so easy, and it is substantial for the next steps of ANP. Additionally, ANP implicitly assumes that each category has the same weight [52]. However, the effect of one dimension on the other dimensions might be different in degree. Therefore, researchers employed DEMATEL-based ANP to escalate ANP capabilities and make it more practical. DANP benefits from specific features of DEMATEL such as visualization of cause-and-effect barriers and determining the most influential barriers and dimensions. DANP is a well-suited choice for the structuring network of barriers, modeling cause-and-effect relationships, and determining the importance of barriers [53]. As the impacts of distinguished barriers on implementing CE are not independent, the selected MCDM method must be practical and capable of overcoming the barriers’ dependencies. Thus, DANP is preferred over existing MCDM methods.
Since DEMATEL is a well-suited choice for obtaining network relations map (NRMs) [54], the influential network relations map (INRM) generated by the DEMATEL method is used as an un-weighted super-matrix of ANP in this study. The DANP is an appropriate technique for handling causal-effect relationships among the dimensions and criteria. This method has been successfully applied to many real case studies, such as risk assessment [54], knowledge management [55], marketing strategies [52], oil supply chain [56], railway corporate sustainability [57], and waste management [58].
To address the interdependence and feedback among barriers to implementing the CE in the food industry, a hybrid MCDA framework integrating a DEMATEL and the ANP is used, which is called DANP. Unlike traditional statistic methods, only a few experts are required to respond to the DANP questionnaire [59]; for instance, Shen et al. [60] and Chiu et al. [54] gathered responses from eight experts, and Supeekit et al. [61] collected responses from nine experts.
In this research, first, a literature review on the barriers to implementing CE in the food industry in various countries and regions was conducted. Second, the list of identified barriers was presented to a group of eight experts to check for validity and inclusiveness considering the Iranian food industry, and the required amendments based on the experts’ opinion was made to the list of barriers. Third, a DANP questionnaire was designed based on the pairwise comparison of the barriers, which was used to gather responses from the same experts consulted in the second stage. After gathering responses from the experts in the fourth stage, in stage 5, the DEMATEL method was used to construct an influential network relations map (INRM). Finally, key barriers were identified by employing DANP to determine the relative weights of the barriers. Figure 1 illustrates the steps taken in this research to employ DEMATEL and ANP methods.
Steps to construct an INRM using the DEMATEL method (steps 1–4) and the relative weights determined by DANP to determine key barriers (steps 5–9) are introduced in the following.

3.1. DEMATEL Technique to Acquire an INRM

Step 1: Calculating the direct influence matrix using a linguistic scale. Knowledge-based experts use a five-point scale to make pairwise influence comparisons between barriers ranging from 0 “absolutely no influence” to 4 “very high influence”. Each expert indicates the extent to which barrier i affects barrier j , showing this by g k i j . Thus, the matrix G k = [ g k i j ] , as shown in Equation (1), represents the direct relationships among barriers from the perspective of the k -th expert. All elements of the diagonal are zero.
G k = [ g k 11   g k 1 j   g k 1 n g k i 1   g k i j   g k i n g k n 1   g k n j   g k n n ]
Then, by averaging over the direct relationships’ matrix of all experts, the elements of the direct influence matrix Z are calculated as in Equation (2):
z i j = k = 1 K ω k g k i j k = 1 K ω k
where K is the total number of experts, and ω k is the weight of the k -th expert. This research considers equal weights for all experts.
Step 2: Normalizing the direct influence matrix Z. The normalized direct influence matrix X is produced by using Equation (3). The maximum sum of rows or columns is one.
X = μ . Z where μ = min i . j { 1 max   i j = 1 n z i j , 1 max   j i = 1 n z i j } , i , j { 1 , 2 , . . , n }
Step 3: Calculating the total influence matrix T b . Following Equation (4), the total influential matrix T b (Equation (5)) is obtained, in which I and O denote the identity and zero matrix, respectively.
T b = X + X 2 + X 3 + + X ξ = X ( 1 + X + X 2 + + X ξ 1 ) ( I X ) ( I X ) 1 = X ( 1 X ξ ) ( I X ) 1 = X ( I X ) 1 , when   lim ξ X ξ = O
D 1 D j D m b 11 b 1 n 1   b j 1 b j n j     b m 1 b m n m T b = D 1 b 11 b 12 b 1 n 1 D i b i 1 b i 2 b i n i   D m b m 1 b m 2 b m n m [ t b 11 t b 1 j t b 1 m t b i 1 t b i j t b i m t b m 1 t b m j t b m m ]
Step 4: Analyzing the results. At this stage, using Equations (6) and (7), each row of matrix T b is summed to obtain the value of r , and each column is summed to obtain the value of s . By adding r i to s i for each barrier, the vector ( r i + s i ) is generated to indicate the importance of each barrier. Similarly, by subtracting s i from r i for each barrier, the vector ( r i s i ) is generated, which indicates the overall influence of the barrier (net effect). Generally, if the value of ( r i s i ) is positive, barrier i is of causal cluster (i.e., barrier i affects the other barriers), and if ( r i s i ) is negative, barrier i is of the affected cluster (i.e., barrier i is influenced by other barriers). Finally, an INRM is acquired. The horizontal and vertical axes of a causal graph map the set of ( r i + s i ) and ( r i s i ) values, respectively. INRM is depicted considering significant relationships above the threshold value. For instance, if the value of t b i j is higher than the threshold, this significant influence can be shown using an arrow from the i - th barrier to the j - th barrier in the INRM. In this study, the threshold value is calculated following the Fu et al. [62] threshold calculation formula, as one standard deviation plus the mean of the total influence matrix T b .
T b = [ t b i j ] n × n , i , j { 1 , 2 , , n } .
r = [ j = 1 n t b i j ] n × 1 = [ t b i ] n × 1 = ( r 1 , , r i , , r n )
s = [ i = 1 n t b i j ] 1 × n = [ t b j ] n × 1 = ( s 1 , , s j , , s n )

3.2. DANP Steps to Find the Influential Weights of Barriers

Step 5: Finding the normalized total influential matrix. The total influential matrix T D should be normalized by dividing each row i by t D i , following Equations (8) and (9).
t D i = j = 1 m t D i j
T D = [ t D 11 t D 1 j t D 1 m t D i 1 t D i j t D i m t D m 1 t D m j t D m m ] j = 1 m t D 1 j = t D 1 j = 1 m t D i j = t D i j = 1 m t D m j = t D m
T D n o r = [ t D 11 / t D 1 t D 1 j / t D 1 t D 1 m / t D 1 t D i 1 / t D i t D i j / t D i t D i m / t D i t D m 1 / t D m t D m j / t D m t D m m / t D m ] = [ t D n o r 11 t D n o r 1 j t D n o r 1 m t D n o r i 1 t D n o r i j t D n o r i m t D n o r m 1 t D n o r m j t D n o r m m ]
Step 6: Finding the T b n o r matrix. The total influence matrix T b should be normalized based on the total degrees of influence of the dimensions to obtain T b n o r , as shown in Equation (10).
D 1 D j D m b 11 b 1 n 1   b j 1 b j n j   b m 1 b m n m T b n o r = D 1 b 11 b 12 b 1 n 1 D i b i 1 b i 2 b i n i   D m b m 1 b m 2 b m n m [ t b n o r 11 t b n o r 1 j t b n o r 1 m t b n o r i 1 t b n o r i j t b n o r i m t b n o r m 1 t b n o r m j t b n o r m m ]
Step 7: Building an un-weighted super-matrix W b . The un-weighted super-matrix W b can be obtained by transposing the normalized total influential matrix T b n o r , that is, W b = ( T b n o r ) (Equation (11)). If an array of the matrix is zero, its corresponding barriers are independent.
D 1 D j D m b 11 b 1 n 1   b j 1 b j n j   b m 1 b m n m W b = ( T b n o r ) = D 1 b 11 b 12 b 1 n 1 D i b i 1 b i 2 b i n i   D m b m 1 b m 2 b m n m [ w b 11 w b i 1 w b m 1 w b 1 j w b i j w b m j w b 1 m w b i m w b m m ]
Step 8: Finding the weighted super-matrix W b * of the DANP. The weighted super-matrix W b * (which simplifies the traditional ANP by assuming equal weights to make the method applicable for real world problems) can be calculated by multiplying T D n o r and W b , as shown in Equation (12).
W b * = T D n o r W b = [ t D n o r 11 × w b 11 t D n o r i 1 × w b i 1 t D n o r m 1 × w b m 1 t D n o r 1 j × w b 1 j t D n o r i j × w b i j t D n o r m j × w b m j t D n o r 1 m × w b 1 m t D n o r i m × w b i m t D n o r m m × w b m m ]
Step 9: Obtaining global weights of barriers. Finally, the weighted super-matrix should be raised to a sufficiently large power M until a long-term stable super-matrix is obtained. The converged weighted super-matrix W b * should be limited ( lim M ( W b * ) M ) to reach the overall influential weights of barriers W = ( w 1 , , w i , , w n ) .

3.3. Data Collection

The designed web-based questionnaire was used to gather responses from our panel of eight experts from seven food-related areas, including food production, customer relationship, top management, environment, agriculture, food science, and logistics. Using the questionnaire, the experts were asked to determine the direct effects of each i-th barrier on each other j-th barrier. The influence of the identified barriers was estimated on a five-point scale ranging from zero “absolutely no influence” to four “very high influence”. For each expert k, the answers were aggregated in the k-th direct influence matrix.

4. Result

Here, the identified variables used to design the questionnaire, the built INRM, and the CE implementation barriers’ weights are presented in Section 4.1, Section 4.2, and Section 4.3, respectively.

4.1. Identified Barriers to the Implementation of CE in Food Supply Chains
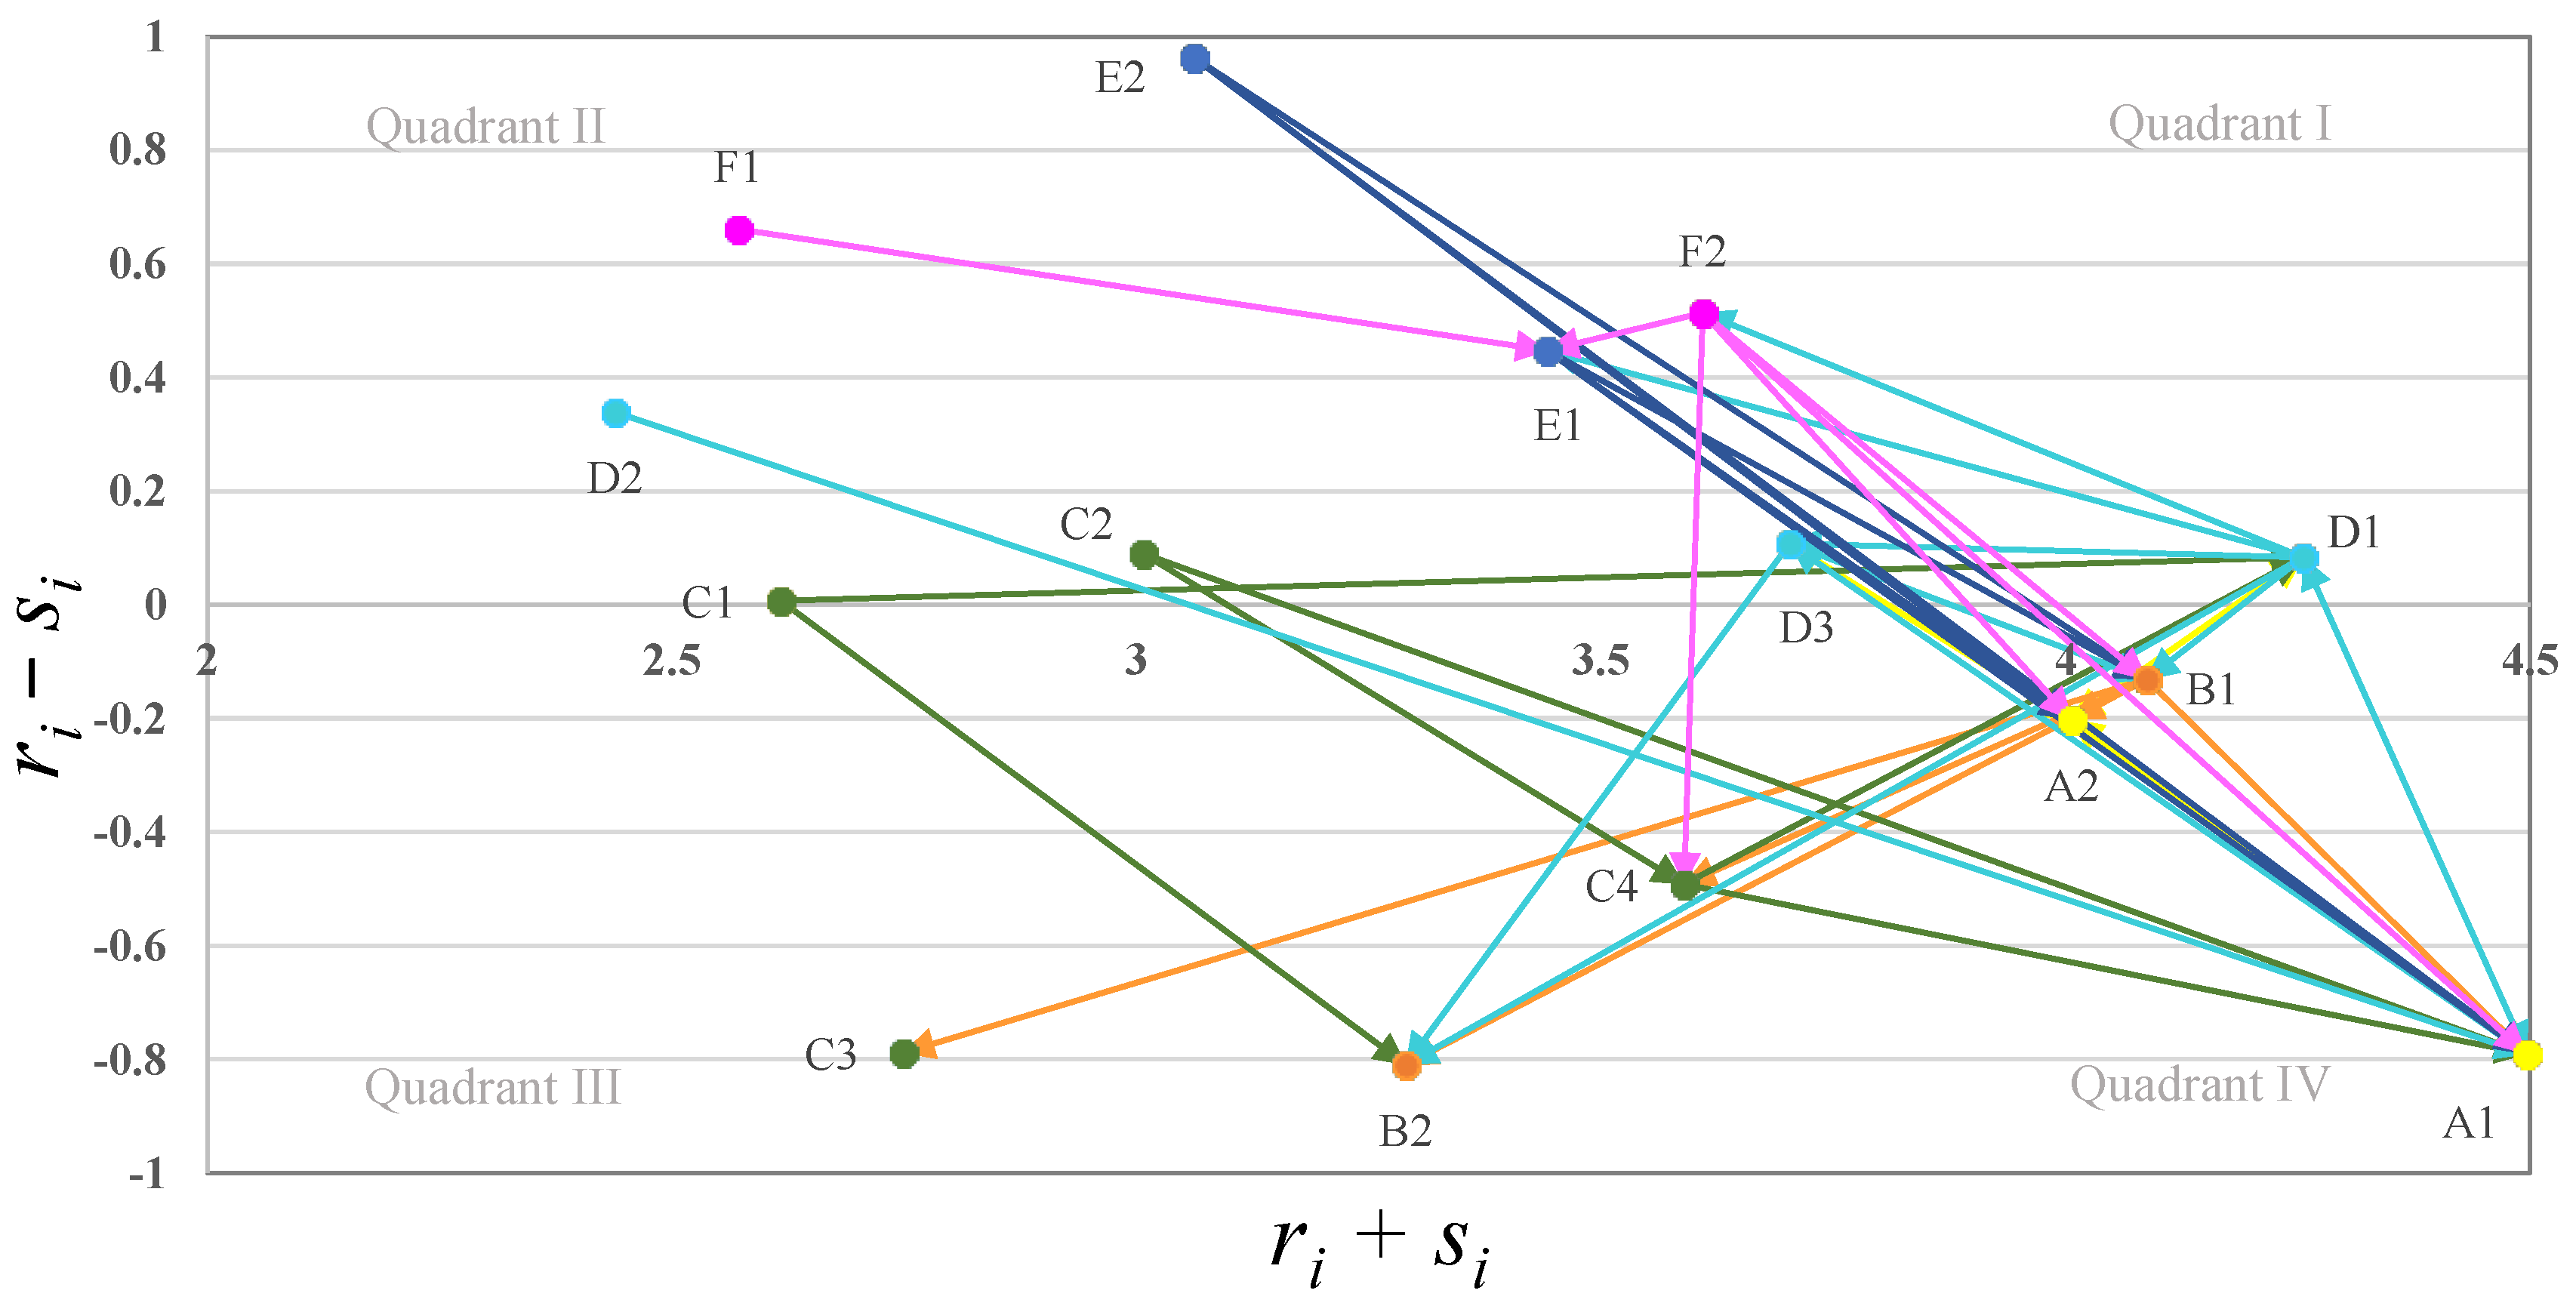
Based on the literature, a list of barriers to adopting CE in food supply chains was presented to the expert panel, who were asked to mark the validity of each barrier for the case of Iran’s food industry and check if any significant barrier is missing. Based on the feedback received, 15 barriers were identified as the ones affecting the implementation of CE in the Iranian food industry, which were then classified into six main dimensions, including (i) production issues, (ii) management and collaboration issues, (iii) technical and technological capabilities, (iv) financial issues, (v) government policies, and (vi) culture. A description of the classified barriers is presented in Table 2. In this table, the type of barriers, in terms of being hard or soft, is also specified. In practical terms, the obstacles to the transition towards a CE can be categorized into two types: hard barriers, such as technological and financial challenges, and soft barriers, which encompass regulatory and cultural issues. These barriers collectively impede the progress towards achieving a circular economy [63]. This classification is based on the work of Nye [64], which differentiated between soft power, implying the ability to bring changes through values and institutional practices, and hard power, implying the ability to make changes through technological or economic tools. This study follows the classification of barriers into soft and hard categories, as proposed by de Jesusa and Mendonça [63].
Barriers mentioned in Table 2 were used to design a web-based questionnaire asking the experts to make a pairwise comparison between them. The expert panel’s consensus of significant confidence in the questionnaires was 95.23%.

4.2. The Built INRM

Using a five-point scale, the experts were asked to determine the influential relationships among each pair of barriers in the designed questionnaire. The DEMATEL method was used to find the relationships among dimensions and barriers to CE implementation.
By averaging over the direct relationships’ matrix of all knowledge-based experts, the initial direct influence matrix Z , as shown in Table 3, was obtained. Following the equations presented in Section 3, the total influence matrix T b and the cause-effect of dimensions and barriers were calculated as reported in Table 4 and Table 5, respectively.
The significant causal relationship diagrams for barriers are plotted in Figure 2. To plot the INRM, the relationships above the calculated threshold value (one standard deviation plus the mean of the total influence matrix) were considered significant and are illustrated in the figure. The ( r + s ) values denote cause values, whereas ( r s ) values denote the effect values of each barrier. One-way and two-way arrows represent one-way and two-way relationships between corresponding barriers, respectively.

4.3. Influential Weights of CE Implementation Barriers

After determining the relationship structure of the barriers, the DANP method was applied to derive their influential weights. The un-weighted super-matrix W b is presented in Table 6, and the overall influential weights of the barriers are reported in the second column of Table 7. In addition, Table 7 provides the DANP ranking, DEMATEL ranking, the sum of rankings, and the overall ranking of the barriers. According to Hu et al. [68], the Borda count is applied to integrate DANP and DEMATEL results.

5. Discussion

This study has three main streams of findings. The first stream originates from the interpretation of DEMATEL results. Referring to Table 5, the cause group consists of three dimensions, namely, government policies, culture, and financial issues, and the effect group includes the dimensions of management and collaboration issues, production issues, and technical and technological capabilities. This is while Sharma et al. [69] introduced government policies, technology and techniques, and knowledge and awareness as the driving factors in the CE implementation in food supply chains in India. In this vein, government policies to promote the CE significantly rely on infrastructure, fundraising guidance, financial assistance, and logistics [70]. However, there is still room for further research and developments to evaluate the effect of such government policies on the success of the CE in different regions. Realizing these influential relationships enables decision makers and top managers to make effective policy decisions. Based on ( r + s ) values, the highest- to lowest-ranked dimensions are technical and technological capabilities (C), financial issues (D), production issues (A), management and collaboration issues (B), government policies (E), and culture (F), respectively. Improving more influential dimensions would result in higher levels of improvement in the system. In addition, the net effect ( r s ) values show that government policies (E), culture (F), and financial issues (D) are the most significant cause dimensions, which can leverage the elimination of effect dimensions in the long term.
Furthermore, as can be seen in Figure 2, the limited engagement of top managers in CE practices affects five specific barriers, including lack of circular design and innovative packaging to reduce food waste (A1); insufficient use of reusable, recyclable, and recoverable materials (A2); insufficient/ineffective collaboration among supply chain players (B2); limited technical expertise (C3); and insufficient food waste to energy recovery (C4), and is impacted by five other barriers, namely, the high cost of CE implementation (D1), low economic benefits in the short term (D3), lack of effective regulations and environmental enforcement (E1), lack of governmental support and incentives (E2), and lack of market enthusiasm/pressure for circular technologies and products (F2). This is in line with the research conducted by Singh et al. [71] highlighting the critical role of top management participation in facilitating the CE transition. As highlighted by Zhao et al. [72], the backing from top management within organizations, combined with governmental support and regulations, emerges as a crucial driver for advancing a low-carbon circular economy aimed at achieving net-zero emissions. This highlights the importance of senior managers’ commitment to sustainability issues and also sheds light on the business environment factors that can cause challenges for the activities and decision-making of the managers. Moreover, in a survey examining the link among top management commitment, external pressures, and supplier relationship management in fostering the CE, Dubey et al. [73] showed that the effect of external institutional pressures on supplier relationship management can be positively mediated by top management commitment. However, engagement of top management levels in effectively implementing the CE faces some challenges. For instance, Koistinen et al. [74], in a qualitative research study interviewing 34 top managers, outlined that (i) power is a key characteristic of how top managers, as agents of the sustainability transition to a CE, exercise their agency; (ii) the top managers’ agency is often limited by structural constraints on multiple levels in their organizations, while they are perceived as the most powerful members of their organizations; and (iii) top managers’ power in transitioning towards a CE is significantly dependent on their abilities to secure business profitability.
In addition, barriers with high net effect ( r s ) values have the greatest long-term impact on other barriers [4]; hence, effective policies should be made to address these issues. Considering the quadrants specified in Figure 2, it can be observed that poor logistics and reverse logistics networks (C1), limited technical expertise (C2), high cost of CE implementation (D1), insufficient financial resources for CE implementation (D2), low economic benefits in the short term (D3), lack of effective regulations and environmental enforcement (E1), lack of governmental support and incentives (E2), inadequate public awareness and knowledge about values and adopting CE (F1), and lack of market enthusiasm/pressure for circular technologies and products (F2), which are located in quadrant 1, are distinguished as cause barriers with positive net effect ( r s ) values, whose elimination leads to a decrease in the effect imposed on barriers affected by them. Quadrant 4 includes effect barriers with negative net effect ( r s ) values, namely, lack of circular design and innovative packaging to reduce food waste (A1); insufficient use of reusable, recyclable, and recoverable materials (A2); limited top managers’ engagement in CE practices (B1); insufficient/ineffective collaboration among supply chain players (B2); absence of an information exchange system among supply chain partners (C3); and insufficient food waste to energy recovery (C4). Some of these barriers—such as lack of circular design and innovative packaging to reduce food waste (A1), limited top managers’ engagement in CE practices (B1), and insufficient use of reusable, recyclable, and recoverable materials (A2) have high ( r + s ) values, implying that the elimination of these barriers is vital but must be done simultaneously with the elimination of their “cause” barriers. A key point is that policymakers must consider the entire system (based on the generated INRM) to reduce the gap between the linear economy and the CE and facilitate the transition to the CE. Elimination of the variables with the highest ( r i + s i ) values, which are known as the most effective barriers (A1, D1, and B1), might strongly influence the whole system directly and indirectly.
To gain insight into the causal relationships between hard and soft barriers, DEMATEL was employed, taking into account the type of barriers. As can be seen in Table 8, results confirm that hard barriers affect each other significantly, and soft barriers have a significant effect on hard barriers. In addition, the role hard barriers play in the long term is more crucial than soft barriers. However, soft barriers are the cause factors with key roles, acting as the main drivers to eliminate hard barriers.
The second stream of results focuses on the influential weights of barriers. According to the second column of Table 7, the highest relative weights are assigned to the lack of circular design and innovative packaging to reduce food waste (A1); the high cost of CE implementation (D1); insufficient use of reusable, recyclable, and recoverable materials (A2); insufficient/ ineffective collaboration among supply chain players (B2); and limited top managers’ engagement in CE practices (B1). In this regard, technology plays an important role in enabling food waste reduction platforms by providing opportunities for sharing food surpluses among suppliers and consumers and, also, monitoring frameworks for food waste data for different stakeholders within the food supply chain [75]. Design-driven innovations to generate a higher quality of products and processes have been acknowledged in the literature as an effective solution to contribute to the CE transition [76]. Moreover, the need to align product design with the CE principles to increase the circularity of the system has been highlighted by scholars [77,78,79]. On the other side, the high cost of implementing the CE, as a challenge hindering the CE transition, has been investigated in the literature. In this vein, proper life-cycle management practices in reducing sustainable CE costs can have profound effects on CE adoption [80]. In addition, providing platforms to create internal and external collaboration networks for advancing CE practices has been highlighted in previous studies through eco-centric dynamic capabilities and knowledge-sharing routines [81]. Hence, in line with extant studies, our results highlight that, to pave the way for the CE implementation, decision makers must focus their strategies on promoting circular design; reducing the cost of CE implementation; facilitating the use of reusable, recyclable, and recoverable materials; and providing a platform for more collaboration among supply chain players. Nevertheless, the link among different players of the food supply chain—such as product/packaging system design, manufacturing, materials supply, and the return flow of recyclable materials to the food waste management stream—needs a more holistic approach to enhance the CE transition in food systems [82].
Moreover, the low ranking of the barrier targeting lack of governmental support and incentives (E2) underscores that, even though the influence of government support and incentives is emphasized by experts, the priority assigned to enhancing such support for CE implementation remains relatively low. This is also confirmed in the case of Pakistan, as another developing country, where lack of government support to promote the CE has been identified as the lowest-ranked barrier to CE implementation in food waste management [27]. Moreover, despite a low ( r + s ) value for insufficient/ineffective collaboration among supply chain players (B2), the priority of collaboration among supply chain players for CE implementation is still relatively high.
Finally, the last column of Table 7 pertains to the third stream of results. Based on the overall ranking presented, lack of circular design and innovative packaging to reduce food waste (A1); high cost of CE implementation (D1); insufficient use of reusable, recyclable, and recoverable materials (A2); limited top managers’ engagement in CE practices (B1); and low economic benefits in the short term (D3), respectively, are the key barriers to transitioning towards CE in the food sector in Iran. This is in line with the findings of Gedam et al. [26], who highlighted technology and innovation limitations, supply chain challenges, and lack of economic benefits and high cost of investment among critical barriers to CE implementation in developing economies.
Considering the overall results, the findings align with previous studies conducted in the context of developing countries [27,83]. These results were expected, given that inadequate infrastructure, transportation, food industries, and packaging industries contribute to significant food losses in developing countries. Both the public and private sectors play a role in reducing food loss. Additionally, as emphasized in previous studies, food waste at the consumer level is minimal in developing countries [83]. The insights provided can be valuable in effectively supporting the government and associated authorities, policymakers, and all stakeholders within the food supply chain in their efforts toward a successful CE transition in the food sector.

6. Conclusions

This research aimed to comprehensively identify, categorize, and prioritize the factors and their causal relationships that have hindered the transition to a CE in the food sector of Iran, a developing country. Through the application of the DANP method, a total of 15 barriers were identified and ranked across six distinct categories. These categories encompass production issues, management and collaboration issues, technical and technological capabilities, financial challenges, government policies, and culture. On this basis, the following items were ranked as the main three influential barriers, respectively, based on their calculated weights: (i) the lack of circular design and innovative packaging to reduce food waste, (ii) the high cost of CE implementation, and (iii) insufficient use of reusable, recyclable, and recoverable materials. On the contrary, (i) poor logistics and reverse logistics networks, (ii) insufficient financial resources for CE implementation, and (iii) inadequate public awareness and knowledge about values and adopting CE were ranked as the three least influential barriers among the 15 identified barriers, respectively.
The findings of this study make significant contributions to both theoretical and practical aspects. The theoretical contribution includes, first, extending the extant studies on the identification of the CE barriers in food supply chains and, second, providing a comprehensive understanding of these barriers in the context of transitioning toward a CE in the food sector of Iran. From a practical perspective, the research outcomes serve as a valuable guideline for practitioners, stakeholders, government, and policymakers involved in the transition toward a CE in food supply chains. The identified barriers and their ranks can effectively support decision makers to monitor the most influential and critical points in order to better mobilize their efforts. In particular, the provided insights can influence policymakers and associated authorities of the food sector to prioritize their resources and actions with a focus on initiatives for circular design and innovative packaging, reducing the CE implementation costs, and more effectively using reusable, recyclable, and recoverable materials.
The present research has some limitations, which open up avenues for future research. Although the identified barriers meet the research objectives, they are not exhaustive due to the following reasons. First, the study was carried out based on the current situation of the food supply chain in Iran. The results may differ from other countries, in particular, developed countries. Hence, conducting research employing the same method for other countries and territories may provide additional insights into the topic. Second, the current study was informed by literature and panel experts’ opinions, which might limit the accuracy of the analysis. Therefore, using other qualitative or quantitative methods, with a particular focus on systems thinking to consider the food supply chain as a whole, is of high interest for future research. Third, this study presented a ranking of the barriers to CE implementation based on their effects. Further studies could prioritize the removal of barriers based on countries’ capabilities. Finally, policy makers can launch policies for transitioning from a linear economy to a CE in Iran by jointly improving barriers based on the digraph of INRM. However, it is not possible to eliminate all the barriers at once; both public and private sectors must work together to address the key influential barriers. Since the barriers are likely to differ across developing and developed regions, scholars could compare the results of this study with other previous research in terms of the geographical scope. In addition, the results of this study could help organizations recognize their roles in CE implementation.

Author Contributions

Conceptualization, F.L.D., M.R. and Z.S.E.; methodology, F.L.D. and Z.S.E.; validation, F.L.D., M.R. and Z.S.E.; formal analysis, F.L.D. and M.R.; investigation, F.L.D.; data curation, F.L.D.; writing—original draft preparation, F.L.D., M.R. and Z.S.E.; writing—review and editing, F.L.D., M.R. and Z.S.E.; supervision, Z.S.E.; project administration, Z.S.E. All authors have read and agreed to the published version of the manuscript.

Funding

This research received no external funding.

Institutional Review Board Statement

Not applicable.

Informed Consent Statement

Not applicable.

Data Availability Statement

The data presented in this study are available on request from the corresponding author.

Conflicts of Interest

The authors declare no conflict of interest.

References

  1. Khandelwal, C.; Barua, M.K. Prioritizing Circular Supply Chain Management Barriers Using Fuzzy AHP: Case of the Indian Plastic Industry. Glob. Bus. Rev. 2020. [Google Scholar] [CrossRef]
  2. Patwa, N.; Sivarajah, U.; Seetharaman, A.; Sarkar, S.; Maiti, K.; Hingorani, K. Towards a circular economy: An emerging economies context Nitin. J. Bus. Res. 2021, 122, 725–735. [Google Scholar] [CrossRef]
  3. Ritzén, S.; Sandström, G.Ö. Barriers to the Circular Economy–integration of perspectives and domains Sofia. In Proceedings of the 9th CIRP IPSS Conference: Circular Perspectives on Product/Service-Systems, Copenhagen, Denmark, 19–21 June 2017; pp. 7–12. [Google Scholar]
  4. Farooque, M.; Zhang, A.; Liu, Y. Barriers to circular food supply chains in China. Supply Chain. Manag. 2019, 24, 677–696. [Google Scholar] [CrossRef]
  5. Korhonen, J.; Honkasalo, A.; Seppälä, J. Circular Economy: The Concept and its Limitations. Ecol. Econ. 2018, 143, 37–46. [Google Scholar] [CrossRef]
  6. Ranjbari, M.; Saidani, M.; Esfandabadi, Z.S.; Peng, W.; Lam, S.S.; Aghbashlo, M.; Quatraro, F.; Tabatabaei, M. Two decades of research on waste management in the circular economy: Insights from bibliometric, text mining, and content analyses. J. Clean. Prod. 2021, 314, 128009. [Google Scholar] [CrossRef]
  7. Patel, A.; Singh, S. Implementing circular economy strategies in the automobile industry—A step toward creating sustainable automobiles. Benchmarking 2022. [Google Scholar] [CrossRef]
  8. Charef, R.; Morel, J.C.; Rakhshan, K. Barriers to implementing the circular economy in the construction industry: A critical review. Sustainability 2021, 13, 12989. [Google Scholar] [CrossRef]
  9. Saha, K.; Dey, P.K.; Papagiannaki, E. Implementing circular economy in the textile and clothing industry. Bus. Strat. Strateg. Environ. 2021, 30, 1497–1530. [Google Scholar] [CrossRef]
  10. Kazancoglu, Y.; Ozbiltekin Pala, M.; Sezer, M.D.; Luthra, S.; Kumar, A. Drivers of implementing Big Data Analytics in food supply chains for transition to a circular economy and sustainable operations management. J. Enterp. Inf. Manag. 2021. [Google Scholar] [CrossRef]
  11. Sarkar, B.; Debnath, A.; Chiu, A.S.F.; Ahmed, W. Circular economy-driven two-stage supply chain management for nullifying waste. J. Clean. Prod. 2022, 339, 130513. [Google Scholar] [CrossRef]
  12. Garai, A.; Sarkar, B. Economically independent reverse logistics of customer-centric closed-loop supply chain for herbal medicines and biofuel. J. Clean. Prod. 2022, 334, 129977. [Google Scholar] [CrossRef]
  13. Fan, Y.; Van Klemeš, J.J.; Walmsley, T.G.; Bertók, B. Implementing Circular Economy in municipal solid waste treatment system using P-graph. Sci. Total. Environ. 2020, 701, 134652. [Google Scholar] [CrossRef]
  14. Debnath, A.; Sarkar, B. Effect of circular economy for waste nullification under a sustainable supply chain management. J. Clean. Prod. 2023, 385, 135477. [Google Scholar] [CrossRef]
  15. Ardra, S.; Barua, M.K. Inclusion of circular economy practices in the food supply chain: Challenges and possibilities for reducing food wastage in emerging economies like India. Environ. Dev. Sustain. 2022. [Google Scholar] [CrossRef]
  16. CGRi. The Circularity Gap Report. Available online: https://www.circularity-gap.world/2022 (accessed on 20 January 2023).
  17. UNEP. Food Waste Index Report 2021. Available online: https://www.unep.org/resources/report/unep-food-waste-index-report-2021 (accessed on 20 January 2023).
  18. Fortunati, S.; Morea, D.; Mosconi, E.M. Circular economy and corporate social responsibility in the agricultural system: Cases study of the Italian agri-food industry. Agric. Econ. 2020, 66, 489–498. [Google Scholar] [CrossRef]
  19. Ellen Macarthur Foundation. Cities and Circular Economy for Food. Available online: https://ellenmacarthurfoundation.org/cities-and-circular-economy-for-food (accessed on 20 January 2023).
  20. UN. Resolution Adopted by the General Assembly on 25 September 2015. Available online: https://www.un.org/en/development/desa/population/migration/generalassembly/docs/globalcompact/A_RES_70_1_E.pdf (accessed on 1 June 2022).
  21. Mehmood, A.; Ahmed, S.; Viza, E.; Bogush, A.; Ayyub, R.M. Drivers and barriers towards circular economy in agri-food supply chain: A review. Bus. Strat. Strateg. Dev. 2021, 4, 465–481. [Google Scholar] [CrossRef]
  22. Liu, Y.; Wood, L.C.; Venkatesh, V.G.G.; Zhang, A.; Farooque, M. Barriers to sustainable food consumption and production in China: A fuzzy DEMATEL analysis from a circular economy perspective. Sustain. Prod. Consum. 2021, 28, 1114–1129. [Google Scholar] [CrossRef]
  23. Shams Esfandabadi, Z.; Ranjbari, M.; Scagnelli, S.D. Prioritizing Risk-level Factors in Comprehensive Automobile Insurance Management: A Hybrid Multi-criteria Decision-making Model. Glob. Bus. Rev. 2020. [Google Scholar] [CrossRef]
  24. Ranjbari, M.; Shams Esfandabadi, Z.; Scagnelli, S.D.; Siebers, P.-O.; Quatraro, F. Recovery agenda for sustainable development post COVID-19 at the country level: Developing a fuzzy action priority surface. Environ. Dev. Sustain. 2021, 23, 16646–16673. [Google Scholar] [CrossRef] [PubMed]
  25. Lotfian Delouyi, F.; Ghodsypour, S.H.; Ashrafi, M. Dynamic Portfolio Selection in Gas Transmission Projects Considering Sustainable Strategic Alignment and Project Interdependencies through Value Analysis. Sustainability 2021, 13, 5584. [Google Scholar] [CrossRef]
  26. Gedam, V.V.; Raut, R.D.; Lopes de Sousa Jabbour, A.B.; Tanksale, A.N.; Narkhede, B.E. Circular economy practices in a developing economy: Barriers to be defeated. J. Clean. Prod. 2021, 311, 127670. [Google Scholar] [CrossRef]
  27. Ali, Y.; Jokhio, D.H.; Dojki, A.A.; Rehman, O.; Khan, F.; Salman, A. Adoption of circular economy for food waste management in the context of a developing country. Waste Manag. Res. J. A Sustain. Circ. Econ. 2022, 40, 676–684. [Google Scholar] [CrossRef]
  28. Jokar, D.; Khakzand, M.; Faizi, M. The application of low impact development approaches toward achieving circularity in the water sector: A case study from Soltan Abad, shiraz, Iran. J. Clean. Prod. 2021, 320, 128712. [Google Scholar] [CrossRef]
  29. Govindan, K.; Salehian, F.; Kian, H.; Hosseini, S.T.; Mina, H. A location-inventory-routing problem to design a circular closed-loop supply chain network with carbon tax policy for achieving circular economy: An augmented epsilon-constraint approach. Int. J. Prod. Econ. 2023, 257, 108771. [Google Scholar] [CrossRef]
  30. Schroeder, P.; Anggraeni, K.; Weber, U. The Relevance of Circular Economy Practices to the Sustainable Development Goals. J. Ind. Ecol. 2019, 23, 77–95. [Google Scholar] [CrossRef] [Green Version]
  31. Sharma, H.B.; Vanapalli, K.R.; Samal, B.; Cheela, V.R.S.; Dubey, B.K.; Bhattacharya, J. Circular economy approach in solid waste management system to achieve UN-SDGs: Solutions for post-COVID recovery. Sci. Total. Environ. 2021, 800, 149605. [Google Scholar] [CrossRef]
  32. Khan, S.A.; Paul, M.S.M.S.K. Analyzing cause and effect relationships among drivers and barriers to circular economy implementation in the context of an emerging economy. J. Clean. Prod. 2022, 364, 132618. [Google Scholar] [CrossRef]
  33. Alonso-Muñoz, S.; García-Muiña, F.E.; Medina-Salgado, M.S.; González-Sánchez, R. Towards circular economy practices in food waste management: A retrospective overview and a research agenda. Br. Food J. 2022, 124, 478–500. [Google Scholar] [CrossRef]
  34. Ranjbari, M.; Esfandabadi, Z.S.; Quatraro, F.; Vatanparast, H.; Lam, S.S.; Aghbashlo, M.; Tabatabaei, M. Biomass and organic waste potentials towards implementing circular bioeconomy platforms: A systematic bibliometric analysis. Fuel 2022, 318, 123585. [Google Scholar] [CrossRef]
  35. Ranjbari, M.; Esfandabadi, Z.S.; Ferraris, A.; Quatraro, F.; Rehan, M.; Nizami, A.-S.; Gupta, V.K.; Lam, S.S.; Aghbashlo, M.; Tabatabaei, M. Biofuel supply chain management in the circular economy transition: An inclusive knowledge map of the field. Chemosphere 2022, 296, 133968. [Google Scholar] [CrossRef] [PubMed]
  36. Ranjbari, M.; Esfandabadi, Z.S.; Shevchenko, T.; Scagnelli, S.D.; Lam, S.S.; Varjani, S.; Aghbashlo, M.; Pan, J.; Tabatabaei, M. An inclusive trend study of techno-economic analysis of biofuel supply chains. Chemosphere 2022, 309, 136755. [Google Scholar] [CrossRef]
  37. Yela Aránega, A.; Ferraris, A.; Baima, G.; Bresciani, S. Guest editorial: Sustainable growth and development in the food and beverage sector. Br. Food J. 2022, 124, 2429–2433. [Google Scholar] [CrossRef]
  38. Rasool, S.; Cerchione, R.; Salo, J.; Ferraris, A.; Abbate, S. Measurement of consumer awareness of food waste: Construct development with a confirmatory factor analysis. Br. Food J. 2021, 123, 337–361. [Google Scholar] [CrossRef]
  39. Goyal, S. Reducing Waste in Circular Economy. Encycl. Renew. Sustain. Mater. 2020, 5, 467–473. [Google Scholar] [CrossRef]
  40. Kirchherr, J.; Piscicelli, L.; Bour, R.; Kostense-Smit, E.; Muller, J.; Huibrechtse-Truijens, A.; Hekkert, M. Barriers to the Circular Economy: Evidence From the European Union (EU). Ecol. Econ. 2018, 150, 264–272. [Google Scholar] [CrossRef] [Green Version]
  41. Grafström, J.; Aasma, S. Breaking circular economy barriers. J. Clean. Prod. 2021, 292, 126002. [Google Scholar] [CrossRef]
  42. Kumar, V.; Sezersan, I.; Garza-Reyes, J.A.; Gonzalez, E.D.R.S.; AL-Shboul, M.A. Circular economy in the manufacturing sector: Benefits, opportunities and barriers. Manag. Decis. 2019, 57, 1067–1086. [Google Scholar] [CrossRef] [Green Version]
  43. Jaeger, B.; Upadhyay, A. Understanding barriers to circular economy: Cases from the manufacturing industry. J. Enterp. Inf. Manag. 2020, 33, 729–745. [Google Scholar] [CrossRef]
  44. De Bernardi, P.; Bertello, A.; Forliano, C. Circularity of food systems: A review and research agenda. Br. Food J. 2022, 125, 1094–1129. [Google Scholar] [CrossRef]
  45. Moktadir, M.A.; Rahman, T.; Rahman, M.; Ali, S.M.; Paul, S.K. Drivers to sustainable manufacturing practices and circular economy: A perspective of leather industries in Bangladesh. J. Clean. Prod. 2018, 174, 1366–1380. [Google Scholar] [CrossRef]
  46. Mahpour, A. Prioritizing barriers to adopt circular economy in construction and demolition waste management. Resour. Conserv. Recycl. 2018, 134, 216–227. [Google Scholar] [CrossRef]
  47. Haleem, A.; Khan, S.; Pundir, H.; Jain, A.; Hyay, P.U.; Khan, M.I. Investigating barriers towards the implementation of circular economy: A fuzzy CRITIC approach. J. Ind. Integr. Manag. 2020, 6, 107–139. [Google Scholar] [CrossRef]
  48. Kumar, S.; Raut, R.D.; Nayal, K.; Kraus, S.; Yadav, V.S.; Narkhede, B.E. To identify industry 4.0 and circular economy adoption barriers in the agriculture supply chain by using ISM-ANP. J. Clean. Prod. 2021, 293, 126023. [Google Scholar] [CrossRef]
  49. Kumar, M.; Sharma, M.; Raut, R.D.; Mangla, S.K.; Choubey, V.K. Performance assessment of circular driven sustainable agri-food supply chain towards achieving sustainable consumption and production. J. Clean. Prod. 2022, 372, 133698. [Google Scholar] [CrossRef]
  50. Kumar, M.; Raut, R.D.; Jagtap, S.; Choubey, V.K. Circular economy adoption challenges in the food supply chain for sustainable development. Bus. Strateg. Environ. 2022, 32, 1334–1356. [Google Scholar] [CrossRef]
  51. Lotfian Delouyi, F.; Ghodsypour, S.H.; Ashrafi, M.; Saifoddin, A. Environmental analysis for the selection of long-distance natural gas pipeline routes using MACBETH. Manag. Environ. Qual. An. Int. J. 2022, 33, 241–256. [Google Scholar] [CrossRef]
  52. Chiu, W.Y.; Tzeng, G.H.; Li, H.L. A new hybrid MCDM model combining DANP with VIKOR to improve e-store business. Knowl. Based Syst. 2013, 37, 48–61. [Google Scholar] [CrossRef]
  53. Gölcük, I.; Baykasoʇlu, A. An analysis of DEMATEL approaches for criteria interaction handling within ANP. Expert. Syst. Appl. 2016, 46, 346–366. [Google Scholar] [CrossRef]
  54. Chiu, Y.J.; Hu, Y.C.; Yao, C.Y.; Yeh, C.H. Identifying Key Risk Factors in Product Development Projects. Mathematics 2022, 10, 1295. [Google Scholar] [CrossRef]
  55. Wu, W.-W. Choosing knowledge management strategies by using a combined ANP and DEMATEL approach. Expert Syst. Appl. 2008, 35, 828–835. [Google Scholar] [CrossRef]
  56. Fazli, S.; Mavi, R.K.M.V. Crude oil supply chain risk management with DEMATEL–ANP. Oper. Res. 2015, 15, 453–480. [Google Scholar] [CrossRef]
  57. Rao, S.H. A hybrid MCDM model based on DEMATEL and ANP for improving the measurement of corporate sustainability indicators: A study of Taiwan High Speed Rail. Res. Transp. Bus. Manag. 2021, 41, 100657. [Google Scholar] [CrossRef]
  58. Tseng, M.-L. Application of ANP and DEMATEL to evaluate the decision-making of municipal solid waste management in Metro Manila. Environ. Monit. Assess. 2009, 156, 181–197. [Google Scholar] [CrossRef]
  59. Chen, S.-H.S.H.; Lin, W.T.W.-T. Analyzing determinants for promoting emerging technology through intermediaries by using a DANP-based MCDA framework. Technol. Forecast. Soc. Chang. 2018, 131, 94–110. [Google Scholar] [CrossRef]
  60. Shen, K.-Y.; Hu, S.-K.; Tzeng, G.-H. Financial modeling and improvement planning for the life insurance industry by using a rough knowledge based hybrid MCDM model. Inf. Sci. 2017, 375, 296–313. [Google Scholar] [CrossRef]
  61. Supeekit, T.; Somboonwiwat, T.; Kritchanchai, D. DEMATEL-modified ANP to evaluate internal hospital supply chain performance. Comput. Ind. Eng. 2016, 102, 318–330. [Google Scholar] [CrossRef]
  62. Fu, X.; Zhu, Q.; Sarkis, J. Evaluating green supplier development programs at a telecommunications systems provider. Int. J. Prod. Econ. 2012, 140, 357–367. [Google Scholar] [CrossRef]
  63. de Jesus, A.; Mendonça, S. Lost in Transition? Drivers and Barriers in the Eco-innovation Road to the Circular Economy. Ecol. Econ. 2018, 145, 75–89. [Google Scholar] [CrossRef] [Green Version]
  64. Nye, J.S. Think again: Soft power. Foreign Policy 2006, 23, 3–5. [Google Scholar]
  65. Afif, K.; Rebolledo, C.; Roy, J. Drivers, barriers and performance outcomes of sustainable packaging: A systematic literature review. Br. Food J. 2022, 124, 915–935. [Google Scholar] [CrossRef]
  66. Ada, N.; Kazancoglu, Y.; Sezer, M.D.; Ede-Senturk, C.; Ozer, I.; Ram, M. Analyzing barriers of circular food supply chains and proposing industry 4.0 solutions. Sustainability 2021, 13, 6812. [Google Scholar] [CrossRef]
  67. Echefaj, K.; Charkaoui, A.; Cherrafi, A. Prioritization Of Circular Economy Barriers Using Best Worst Method. In Proceedings of the International Conference on Industrial Engineering and Operations Management, Istanbul, Turkey, 7–10 March 2022. [Google Scholar]
  68. Hu, Y.C.; Chiu, Y.J.; Yen, G.F.; Ken, Y.W. Incorporation of the DEMATEL into evaluations of CSR performance in BOT projects. Syst. Res. Behav. Sci. 2022, 40, 266–281. [Google Scholar] [CrossRef]
  69. Sharma, Y.K.; Mangla, S.K.; Patil, P.P.; Liu, S. When challenges impede the process for circular economy-driven sustainability practices in food supply chain. Manag. Decis. 2019, 57, 995–1017. [Google Scholar] [CrossRef]
  70. Taghipour, A.; Akkalatham, W.; Eaknarajindawat, N.; Stefanakis, A.I. The impact of government policies and steel recycling companies’ performance on sustainable management in a circular economy. Resour. Policy 2022, 77, 102663. [Google Scholar] [CrossRef]
  71. Singh, R.; Khan, S.; Centobelli, P. Investigating the Interplay between Social Performance and Organisational Factors Supporting Circular Economy Practices. Sustainability 2022, 14, 16781. [Google Scholar] [CrossRef]
  72. Zhao, C.; Sun, J.; Zhang, Y. A Study of the Drivers of Decarbonization in the Plastics Supply Chain in the Post-COVID-19 Era. Sustainability 2022, 14, 15858. [Google Scholar] [CrossRef]
  73. Dubey, R.; Gunasekaran, A.; Childe, S.J.; Papadopoulos, T.; Helo, P. Supplier relationship management for circular economy. Manag. Decis. 2019, 57, 767–790. [Google Scholar] [CrossRef]
  74. Koistinen, K.; Onkila, T.; Teerikangas, S.; Mäkelä, M.; Sarja, M.; Valkjärvi, M. Bold ambition, blunted agency? Examining top management perspectives on a circular economy transition in Finland. Energy Res. Soc. Sci. 2022, 86, 102451. [Google Scholar] [CrossRef]
  75. de Almeida Oroski, F.; da Silva, J.M. Understanding food waste-reducing platforms: A mini-review. Waste Manag. Res. J. Sustain. Circ. Econ. 2023, 41, 816–827. [Google Scholar] [CrossRef] [PubMed]
  76. D’Urzo, M.; Campagnaro, C. Design-led repair & reuse: An approach for an equitable, bottom-up, innovation-driven circular economy. J. Clean. Prod. 2023, 387, 135724. [Google Scholar] [CrossRef]
  77. Shevchenko, T.; Yannou, B.; Saidani, M.; Cluzel, F.; Ranjbari, M.; Esfandabadi, Z.S.; Danko, Y.; Leroy, Y. Product-level circularity metrics based on the “Closing–Slowing Future–Past” quadrant model. Sustain. Prod. Consum. 2022, 34, 395–411. [Google Scholar] [CrossRef]
  78. Aguiar, M.F.; Jugend, D. Circular product design maturity matrix: A guideline to evaluate new product development in light of the circular economy transition. J. Clean. Prod. 2022, 365, 132732. [Google Scholar] [CrossRef]
  79. Shevchenko, T.; Saidani, M.; Ranjbari, M.; Kronenberg, J.; Danko, Y.; Laitala, K. Consumer behavior in the circular economy: Developing a product-centric framework. J. Clean. Prod. 2023, 384, 135568. [Google Scholar] [CrossRef]
  80. Azimian, M.; Karbasian, M.; Atashgar, K. Developing a novel mathematical approach toward minimizing sustainable circular economy costs of one-shot systems. Prod. Eng. 2022, 16, 627–634. [Google Scholar] [CrossRef]
  81. Köhler, J.; Sönnichsen, S.D.; Beske-Jansen, P. Towards a collaboration framework for circular economy: The role of dynamic capabilities and open innovation. Bus. Strat. Strateg. Environ. 2022, 31, 2700–2713. [Google Scholar] [CrossRef]
  82. Versino, F.; Ortega, F.; Monroy, Y.; Rivero, S.; López, O.V.; García, M.A. Sustainable and Bio-Based Food Packaging: A Review on Past and Current Design Innovations. Foods 2023, 12, 1057. [Google Scholar] [CrossRef] [PubMed]
  83. FAO. Global food losses and waste. Available online: https://www.fao.org/3/i2697e/i2697e.pdf (accessed on 20 January 2023).
Figure 1. Steps taken in DEMATEL and ANP implementation.
Sustainability 15 09506 g001
Figure 2. Influential network relations map (INRM).
Sustainability 15 09506 g002
Table 1. Previous studies on prioritizing CE barriers.
ReferenceApproach/MethodContextCountrySummary of the ResearchMost Significant Barrier(s)/Driver(s)
[45]Graph
theory–Matrix approach
Leather industriesBangladeshThis study aims to assess, prioritize, and rank the drivers of sustainable manufacturing in the leather industry.
  • Knowledge about the CE
[46]Fuzzy
TOPSIS
Construction and demolition (C&D) waste managementIranThis paper introduces and prioritizes barriers to transition toward CE in C&D waste management and proposes a framework to accelerate moving toward CE.
  • Using finitely recyclable construction materials
  • Ineffective C&D waste dismantling, sorting, and transporting
[4]Fuzzy
DEMATEL
Food industryChinaThe purpose of this paper is to find the key barriers to the circular food supply chain in China.
  • Lack of financial resources
[47]Fuzzy CRITICAuto industry–paint industry–textile industry–generic-The purpose of this study is to identify and prioritize barriers to generic and industry-specific implementation of CE.
  • Lack of environmental law
  • Insufficient financial resources
  • Lack of financial incentives
[1]Fuzzy AHPPlastic industryIndiaThis study integrates the philosophy of CE into supply chain management and investigates barriers to implementing circular supply chain management.
  • Lack of tax relaxation policies
  • Poor enforcement regulations to protect the environment
[27]Fuzzy
TOPSIS
Food industryPakistanThis paper aims to distinguish and prioritize the barriers to implementing the CE in the food industry in Pakistan.
  • Complicated nature of CE
  • Poor information about shelf-life wastes
  • Economic viability
[48]ISM–ANPAgriculture supply chainIndiaThis study identifies Industry 4.0 (I4.0) and CE adoption barriers as well as the relationship among them in the agriculture supply chain in India.
  • Lack of government support and incentives
  • Lack of policies and protocols
[32]Grey–
DEMATEL
Automotive sectorPakistanThe objective of this study is to recognize the key drivers and barriers to CE and their causal effect relationships and to provide guidelines for policymakers.
  • Reducing cost
  • Resource efficiency
  • Lack of expertise
  • The feasibility of CE implementation
[49]Fuzzy AHP and
Fuzzy
TOPSIS
Dairy industryIndiaThis study integrates CE and triple bottom line to develop a sustainable performance assessment framework.
  • Food quality
  • Revenue growth
  • Resource utilization
[22]Fuzzy
DEMATEL
Agri-food sectorChinaThe study addresses CE barriers from the perspectives of different stakeholders and highlights their causal relationships.
  • Weak legal enforcement
  • Lack of investment in technologies
  • Behavioral barriers
[26]Fuzzy
DEMATEL
Food supply chainIndiaThe paper seeks to identify, categorize, and prioritize barriers to CE implementation, and provide suggestions for decision makers.
  • Lack of technology
  • Lack of food waste estimate
  • Lack of supply chain design
  • Lack of profit
[50]ISM–
DEMATEL
Food supply chainIndiaThis study investigates the interrelationship and hierarchical structure of the CE adoption challenges.
  • Creating government policy
  • Providing incentives
  • Enforcing environmental regulations
Table 2. Identified CE implementation barriers.
DimensionsBarriersType of BarriersDescriptionsSupporting Literature
Production
issues
Lack of circular design and innovative packaging to reduce food wasteHardThis barrier considers a lack of circular design regarding redesigning, remanufacturing, reducing, reusing, recycling, and recovering materials, as well as energy inefficiency due to the inability to rethink the design phase, challenges of green materials, complexity in product architecture and functionality, and inadequate environmentally friendly technology. In developing economies, a major part of food waste results from improper packaging, and unsuitable handling and transportation facilities and methods.[32,40,45,46,47,48,50,65]
Insufficient use of reusable, recyclable, and
recoverable materials
HardSince recycling is an important element of CE, using recyclable and eco-friendly materials is recommended. The unavailability of high-quality circular materials and their high price are among CE challenges.
Management and
collaboration
issues
Limited top managers’
engagement in CE
practices
SoftTop managers design policies and strategies for new initiatives in businesses; hence, weak support and commitment of top managers to reduce, reuse, recycle, and recover policies are barriers to achieving CE.[1,4,26,32,47,50,66,67]
Insufficient/ineffective
collaboration among
supply chain players
SoftThe involvement and support of both the supply and demand sides of the market are crucial to the successful implementation of CE strategies. Willingness to supply, design, purchase, and use circular products allows a shift from a linear economy to a CE, while cost or quality issues reduce the attractiveness of the shift toward CE.
Technical and technological
capabilities
Poor logistics and reverse logistics networksHardOptimization of logistics and reverse logistics networks can lead to a reduction in negative environmental impacts and economic costs and allow transitioning from a linear economy to CE.[1,4,21,26,27,32,47,48,50,66,67]
Limited technical expertiseSoftImplementation of the CE, as an emerging concept, requires a skilled workforce equipped with a wide range of knowledge and technical know-how expertise, such as strategy development, material sciences, product and packaging design, system analysis, and logistics. Inadequate expertise negatively affects the implementation of CE.
Absence of an information exchange system among supply chain partnersHardThe lack of appropriate information technology infrastructure hinders tracking information on material flow among supply chain partners.
Insufficient food waste to energy recovery
technologies/ practices
HardA high percentage of food waste is generated during the production stage, leading to economic and environmental costs. These costs can be reduced by using innovative technologies such as bio-refinery, industrial symbiosis, etc. Innovative technological solutions to avoid waste or reuse it for other value-added applications (food waste valorization) are prerequisites for CE transition
Financial issuesHigh cost of CE
implementation
HardBesides the low profit margin of food recycling, the high cost of green design, eco-friendly materials, green technology, sustainable packaging, waste collection, segregation, and transportation acts as a deterrent to switching to CE.
Additionally, due to the absence of successful circular business models, organizations may encounter extra costs for CE implementation.
[1,4,21,22,26,27,32,47,66,67]
Insufficient financial
resources for the CE
implementation
HardTo adopt CE for the food industry, further processing/ transformation is required, which is cost-intensive (e.g., R&D and extra infrastructure investment). Thus, extra financial resources are required to adopt CE.
Low economic benefits in the short termHardCE is an emerging business strategy, and there are few successfully established CE models. Therefore, it is challenging to correctly adopt it to gain economic benefits.
Government
policies
Lack of effective
regulations and
environmental
enforcement
SoftThis theme refers to ineffective punitive policies such as tax policy, legislative enforcement regarding recycling products, environmental standards, and regulations supporting CE. The lack of these policies hinders responsible production and consumption.[22,32,45,46,66,67]
Lack of government
support and incentives
SoftInadequate supportive policies such as government incentives, financial subsidies, and public training programs are some other barriers to adopting CE.
CultureInadequate public
awareness and knowledge about values and adopting CE
SoftIn emerging economies, customers produce a large portion of food waste. Lack of knowledge about environmental impacts and long-term economic values, maintaining products during the consumption period, recycling materials, and returning used products are barriers to transition from linear economy to CE.[1,26,27,32,47,50,66,67]
Lack of market
enthusiasm/pressure for circular technologies and products
SoftIn addition to poor demand for environmentally superior products, limited consumer willingness for accepting circular products plays a key role in transitioning towards CE.
Circular product characteristics and limitations—such as price, material, beauty, design, and packaging that fail to fulfill consumers’ cultural, social, and psychological needs—appear as a barrier to adopting CE. Additionally, in developing countries, customers have few/no responsibilities for using recycled and refurbished products.
Table 3. Direct influence matrix Z .
A1A2B1B2C1C2C3C4D1D2D3E1E2F1F2
A10.0004.0001.0002.0001.5001.0001.7501.5004.0001.0004.0002.0001.5001.0001.875
A24.0000.0001.0002.0000.0001.8752.0002.2504.0002.2504.0001.8750.0002.0002.000
B13.7502.5000.0003.8753.0003.7503.2503.2501.0001.5001.5002.5002.2500.0000.000
B21.5001.5001.0000.0003.0002.0004.0002.0002.2501.0001.0000.0001.0000.0000.000
C11.2501.5002.0004.0000.0001.0003.0002.0004.0001.0001.2500.0000.0000.0000.000
C24.0002.6251.0003.0002.0000.0002.0004.0002.2500.0001.6250.0000.0001.0001.000
C30.0000.0001.6254.0000.6254.0000.0001.3753.0000.3750.5000.0000.0000.0000.125
C44.0002.6252.0000.6251.0000.1251.0000.0004.0001.0003.0001.3750.1250.6251.375
D13.0002.8754.0002.5001.0001.7501.8752.0000.0001.0003.5003.6251.0001.0004.000
D24.0001.0003.8752.0002.0001.0002.0003.0001.0000.0000.0000.1250.0001.0001.000
D33.5002.7504.0002.7501.5001.8752.0002.5001.0001.0000.0001.2500.0001.5004.000
E14.0004.0003.6251.5001.3751.0001.3752.6250.0001.0000.0000.0003.6252.6253.000
E23.0002.6253.0001.6251.3751.0001.3751.6252.3754.0003.0002.3750.0001.6252.000
F12.0001.0003.0000.1251.0000.2500.1251.0001.6250.1252.0004.0003.0000.0004.000
F24.0003.0003.3751.6250.6251.0001.0003.0001.0001.0001.0004.0004.0002.6250.000
Table 4. Total influence matrix T b .
A1A2B1B2C1C2C3C4D1D2D3E1E2F1F2
A10.12560.18990.12480.14200.09300.09310.12330.12980.18710.07360.17800.11840.08200.07070.1218
A20.21770.10480.12750.14240.06310.11270.12900.14890.18820.09830.17920.11800.05190.09330.1274
B10.21170.16130.09750.19300.13500.15940.16630.17490.13580.08630.12590.12050.09510.04460.0715
B20.11110.09620.08550.07100.10850.09590.14860.10860.12350.05430.08060.04070.04680.02530.0441
C10.11130.10090.11200.16280.04550.07790.13250.11250.16280.05570.08980.04580.02850.02640.0482
C20.18950.14250.10020.14800.09560.05730.11660.16710.14190.03970.11500.05810.03660.05760.0830
C30.06500.05190.08480.14470.05170.13030.04970.08500.12080.03140.05610.03200.02110.01910.0371
C40.19460.14670.12970.09640.07280.06230.09290.07930.17240.06430.14470.09530.04500.05380.0986
D10.21590.18510.20450.16950.09560.12270.14080.15970.11130.08100.17690.16640.08630.07860.1751
D20.17910.09710.15490.12050.09400.07740.11110.13860.10260.03490.06690.05420.03550.05140.0706
D30.20620.16510.18630.16180.09820.11560.13260.15620.12600.07210.08800.10280.05450.08000.1602
E10.22100.19540.18090.13190.09460.09400.11680.15800.10810.07980.09580.07930.13820.10880.1423
E20.20490.16770.17720.14160.09900.09820.12240.14220.15750.14470.15910.13110.05390.08700.1259
F10.15920.11740.15900.08520.07590.06450.07320.10780.11610.05090.11940.16120.12300.04550.1586
F20.23050.18290.18490.13900.08270.09720.11300.17220.13240.08300.12220.17360.15140.11300.0839
Table 5. Sum of the influences given and received on dimensions and barriers.
DimensionsBarriers r i s i ( r i s i ) ( r i + s i )
A. Production issues 3.7564.748−0.9938.504
A1 Lack of circular design and innovative
packaging to reduce food waste
1.8532.643−0.7904.497
A2 Insufficient use of reusable, recyclable, and
recoverable materials
1.9022.105−0.2024.007
B. Management and
collaboration issues
3.2194.159−0.9407.378
B1 Limited top managers’ engagement in CE
practices
1.9792.109−0.1314.088
B2 Insufficient/ ineffective collaboration among supply chain players1.2412.050−0.8093.290
C. Technical and
technological capabilities
5.3916.573−1.18311.964
C1 Poor logistics and reverse logistics networks1.3131.3050.0072.618
C2 Limited technical expertise1.5491.4590.0903.007
C3 Absence of an information exchange system among supply chain partners0.9811.769−0.7882.749
C4 Insufficient food waste to energy recovery1.5492.041−0.4923.590
D. Financial issues 5.4644.9340.53010.398
D1 High cost of CE implementation2.1692.0860.0834.256
D2 Insufficient financial resources for the CE
implementation
1.3891.0500.3392.439
D3 Low economic benefits in the short term1.9061.7980.1083.703
E. Government policies 3.9572.5471.4106.504
E1 Lack of effective regulations and environmental enforcement1.9451.4970.4483.442
E2 Lack of government support and incentives2.0121.0500.9633.062
F. Culture 3.6782.5031.1756.182
F1 Inadequate public awareness and knowledge about values and adopting CE1.6170.9550.6612.572
F2 Lack of market enthusiasm/pressure for circular technologies and products2.0621.5480.5143.610
Table 6. Un-weighted super-matrix W b .
A1A2B1B2C1C2C3C4D1D2D3E1E2F1F2
A10.39810.67510.56760.53600.52460.57080.55620.57030.53850.64840.55530.53070.54980.57560.5576
A20.60190.32490.43240.46400.47540.42920.44380.42970.46150.35160.44470.46930.45020.42440.4424
B10.46780.47250.33550.54630.40760.40360.36960.57360.54680.56230.53520.57820.55590.65120.5707
B20.53220.52750.66450.45370.59240.59640.63040.42640.45320.43770.46480.42180.44410.34880.4293
C10.21170.13910.21240.23500.12340.21900.16320.23690.18420.22330.19530.20410.21440.23610.1779
C20.21200.24840.25080.20790.21160.13130.41150.20280.23650.18380.23010.20280.21270.20080.2090
C30.28070.28430.26160.32200.35970.26710.15680.30230.27140.26370.26380.25210.26500.22770.2429
C40.29560.32820.27520.23520.30520.38260.26850.25800.30790.32920.31070.34100.30790.33550.3702
D10.42650.40420.39020.47790.52790.47850.58000.45200.30150.50180.44030.38090.34140.40540.3922
D20.16790.21110.24810.21000.18070.13380.15050.16860.21940.17090.25200.28130.31370.17760.2459
D30.40560.38470.36180.31210.29140.38770.26950.37940.47910.32740.30770.33780.34490.41700.3619
E10.59090.69450.55890.46500.61630.61360.60250.67940.65850.60420.65350.36460.70870.56710.5342
E20.40910.30550.44110.53500.38370.38640.39750.32060.34150.39580.34650.63540.29130.43290.4658
F10.36750.42270.38400.36500.35350.40970.34050.35320.30990.42160.33300.43320.40870.22300.5740
F20.63250.57730.61600.63500.64650.59030.65950.64680.69010.57840.66700.56680.59130.77700.4260
Table 7. Ranking of the barriers.
BarriersDANP
Influential Weights
DANP RankingDEMATEL RankingSum of RankingsOverall Ranking
A1 Lack of circular design and innovative
packaging to reduce food waste
0.101801121
A2 Insufficient use of reusable, recyclable, and
recoverable materials
0.082863473
B1 Limited top managers’ engagement in CE
practices
0.080995384
B2 Insufficient/ineffective collaboration among supply chain players0.0820149136
C1 Poor logistics and reverse logistics networks0.0525812132513
C2 Limited technical expertise0.060399112010
C3 Absence of an information exchange system among supply chain partners0.071798122010
C4 Insufficient food waste to energy recovery0.0796267136
D1 High cost of CE implementation0.086752242
D2 Insufficient financial resources for CE
implementation
0.0403213152814
D3 Low economic benefits in the short term0.0718275125
E1 Lack of effective regulations and
environmental enforcement
0.05583118199
E2 Lack of governmental support and incentives0.0389414102412
F1 Inadequate public awareness and knowledge about values and adopting CE0.0359015142915
F2 Lack of market enthusiasm/pressure for
circular technologies and products
0.05841106168
Table 8. Sum of the influences given and received by different types of barriers.
Type of BarriersHard BarriersSoft Barriers r i s i ( r i s i ) ( r i + s i )
Hard barriers7.555185.5065413.0617214.79700−1.7352827.85872
Soft barriers7.241825.1618612.4036810.668401.7352823.07208
Disclaimer/Publisher’s Note: The statements, opinions and data contained in all publications are solely those of the individual author(s) and contributor(s) and not of MDPI and/or the editor(s). MDPI and/or the editor(s) disclaim responsibility for any injury to people or property resulting from any ideas, methods, instructions or products referred to in the content.

