Article

A Perspective on Management Myopia: The Impact of Digital Transformation on Carbon Emission Intensity

Department of International Trade and Economics, Shandong University of Finance and Economics, Jinan 250014, China
*
Author to whom correspondence should be addressed.
Sustainability 2023, 15(12), 9417; https://doi.org/10.3390/su15129417
Submission received: 19 May 2023 / Revised: 6 June 2023 / Accepted: 8 June 2023 / Published: 12 June 2023

Abstract

:
Digitalization has emerged as an indispensable pathway for enterprises aiming to achieve low-carbon development, demanding strategic implementation by managers who play a crucial role in shaping organizational outcomes. This study utilizes text mining and IPCC methods (based on The Intergovernmental Panel on Climate Change standards) to assess the level of digital transformation and enterprise carbon emission intensity among Shanghai and Shenzhen A-share listed companies from 2008 to 2015. This study also investigates the impact of digital transformation on enterprise carbon emission intensity and examines the influence of myopic characteristics among managers along with their underlying mechanisms. The results indicate that: (1) Digital transformation decreases enterprise carbon emission intensity, with robust results supported by instrumental variable test, the Oster test, confounding variable threshold impact test, etc. (2) Heterogeneity analysis demonstrates that digital transformation is particularly effective in reducing enterprise carbon emission intensity for companies located in cities without national carbon trading pilot policies, heavy industrial sectors, and those influenced by peer effects. (3) The study on mechanisms reveals that management myopia poses a barrier to the decarbonization process driven by digitalization. It further explores the moderating effects of green innovation, sustainable investment, and environmental awareness, revealing that management constrained by innovation myopia, investment myopia, and environmental responsibility myopia faces challenges in promoting decarbonization. By examining the internal aspects of management myopia, we provide valuable insights and recommendations for enterprises seeking to achieve decarbonization through digital transformation.

1. Introduction

In the 14th Five-Year Plan for National Economic and Social Development and Outline of Vision 2035, the Chinese Government continues to emphasize the Carbon Neutral Route of the Digital Economy, with Digital Infrastructure, New Energy, Innovation, and Industrial Digitization as key pillars to achieve the goal of carbon neutrality. Industrial structure optimization and low-carbon technology research and development are crucial for facilitating the low-carbon development of enterprises and the nation as a whole. Moreover, improving energy utilization efficiency and promoting the combined development of low-carbon economy and digitization are encouraged. In line with these goals, the Chinese Government actively promotes the digital transformation and upgrading of enterprises though policy support, aiming to facilitate industrial decarbonization through digitalization. For corporate entities, digital transformation is not only a strategic choice aligned with national development but also a necessary path for their long-term growth and sustainability. Not only does it lead to corporate carbon neutrality [1] but also enhances productivity [2]. Thus, from both a social responsibility perspective and a business economic efficiency standpoint, digital transformation is an essential development trend for all enterprises.
Enterprise digital transformation encompasses a systematic improvement and innovation process involving the implementation of digital intelligence technologies to enhance a company’s production system, R&D innovation, business processes, and commercial relationships. It can boost productivity, improving both internal processes and the external environment, thereby yielding economic and non-economic effects for the enterprise [3,4]. The digital transformation strategy encompasses various substrategies such as digital technology intervention and technology innovation, which heavily rely on the decision logic, risk appetite, and management style of the executive team. The Upper echelons theory suggests that the traits of the executive team can have a profound influence on an enterprise’s strategic decisions [5].
Managerial myopia, a concept rooted in the Upper Echelons Theory, encompasses the personal traits, perceptions, and characteristics of managers, which subsequently shape managerial behavior and strategic choices, thereby influencing organizational outcomes [5]. It is widely acknowledged that managerial myopia significantly impacts firm behavior. Specifically, myopic managers tend to have a limited time horizon for decision-making and prioritize current performance and stock performance considerations. Previous research on managerial myopia has primarily focused on corporate investment behavior, revealing that myopic managers are more inclined to select projects with short-term maturity and high returns when making investment decisions [6,7,8]. Consequently, this preference leads to reduced corporate capital expenditures and research and development (R&D) expenditures. While the existing literature has explored the implications of managerial myopia on corporate investment decisions, limited attention has been given to the sustainability of enterprise decarbonization. It remains unclear whether myopic managers, driven by their resource allocation authority, would exert influence on the role of enterprise digitalization in the decarbonization process. Further investigation is warranted to understand how the traits and tendencies associated with managerial myopia may shape the utilization of resources and decision-making in the context of enterprise decarbonization.
Our study not only investigates the impact of digital transformation on enterprise carbon intensity but also explores the specific impact paths from a management perspective by constructing management myopic features. Previous studies have explored factors that reduce carbon emissions, mostly at the macro level, such as examining low-carbon pilot policies, carbon trading markets [9,10], the impact of innovation [11], industrial restructuring [12], and the effect of green finance on carbon emissions [13,14,15,16]. Research conducted at the enterprise level from a management perspective has primarily focused on the effect of management structure on enterprise carbon emissions [17], with limited relevant research concerning the internal factors associated with management traits. Some studies have introduced management ambivalence in the process of digitally promoting decarbonization [18] yet lack an analysis of the specific mechanisms of the effect.
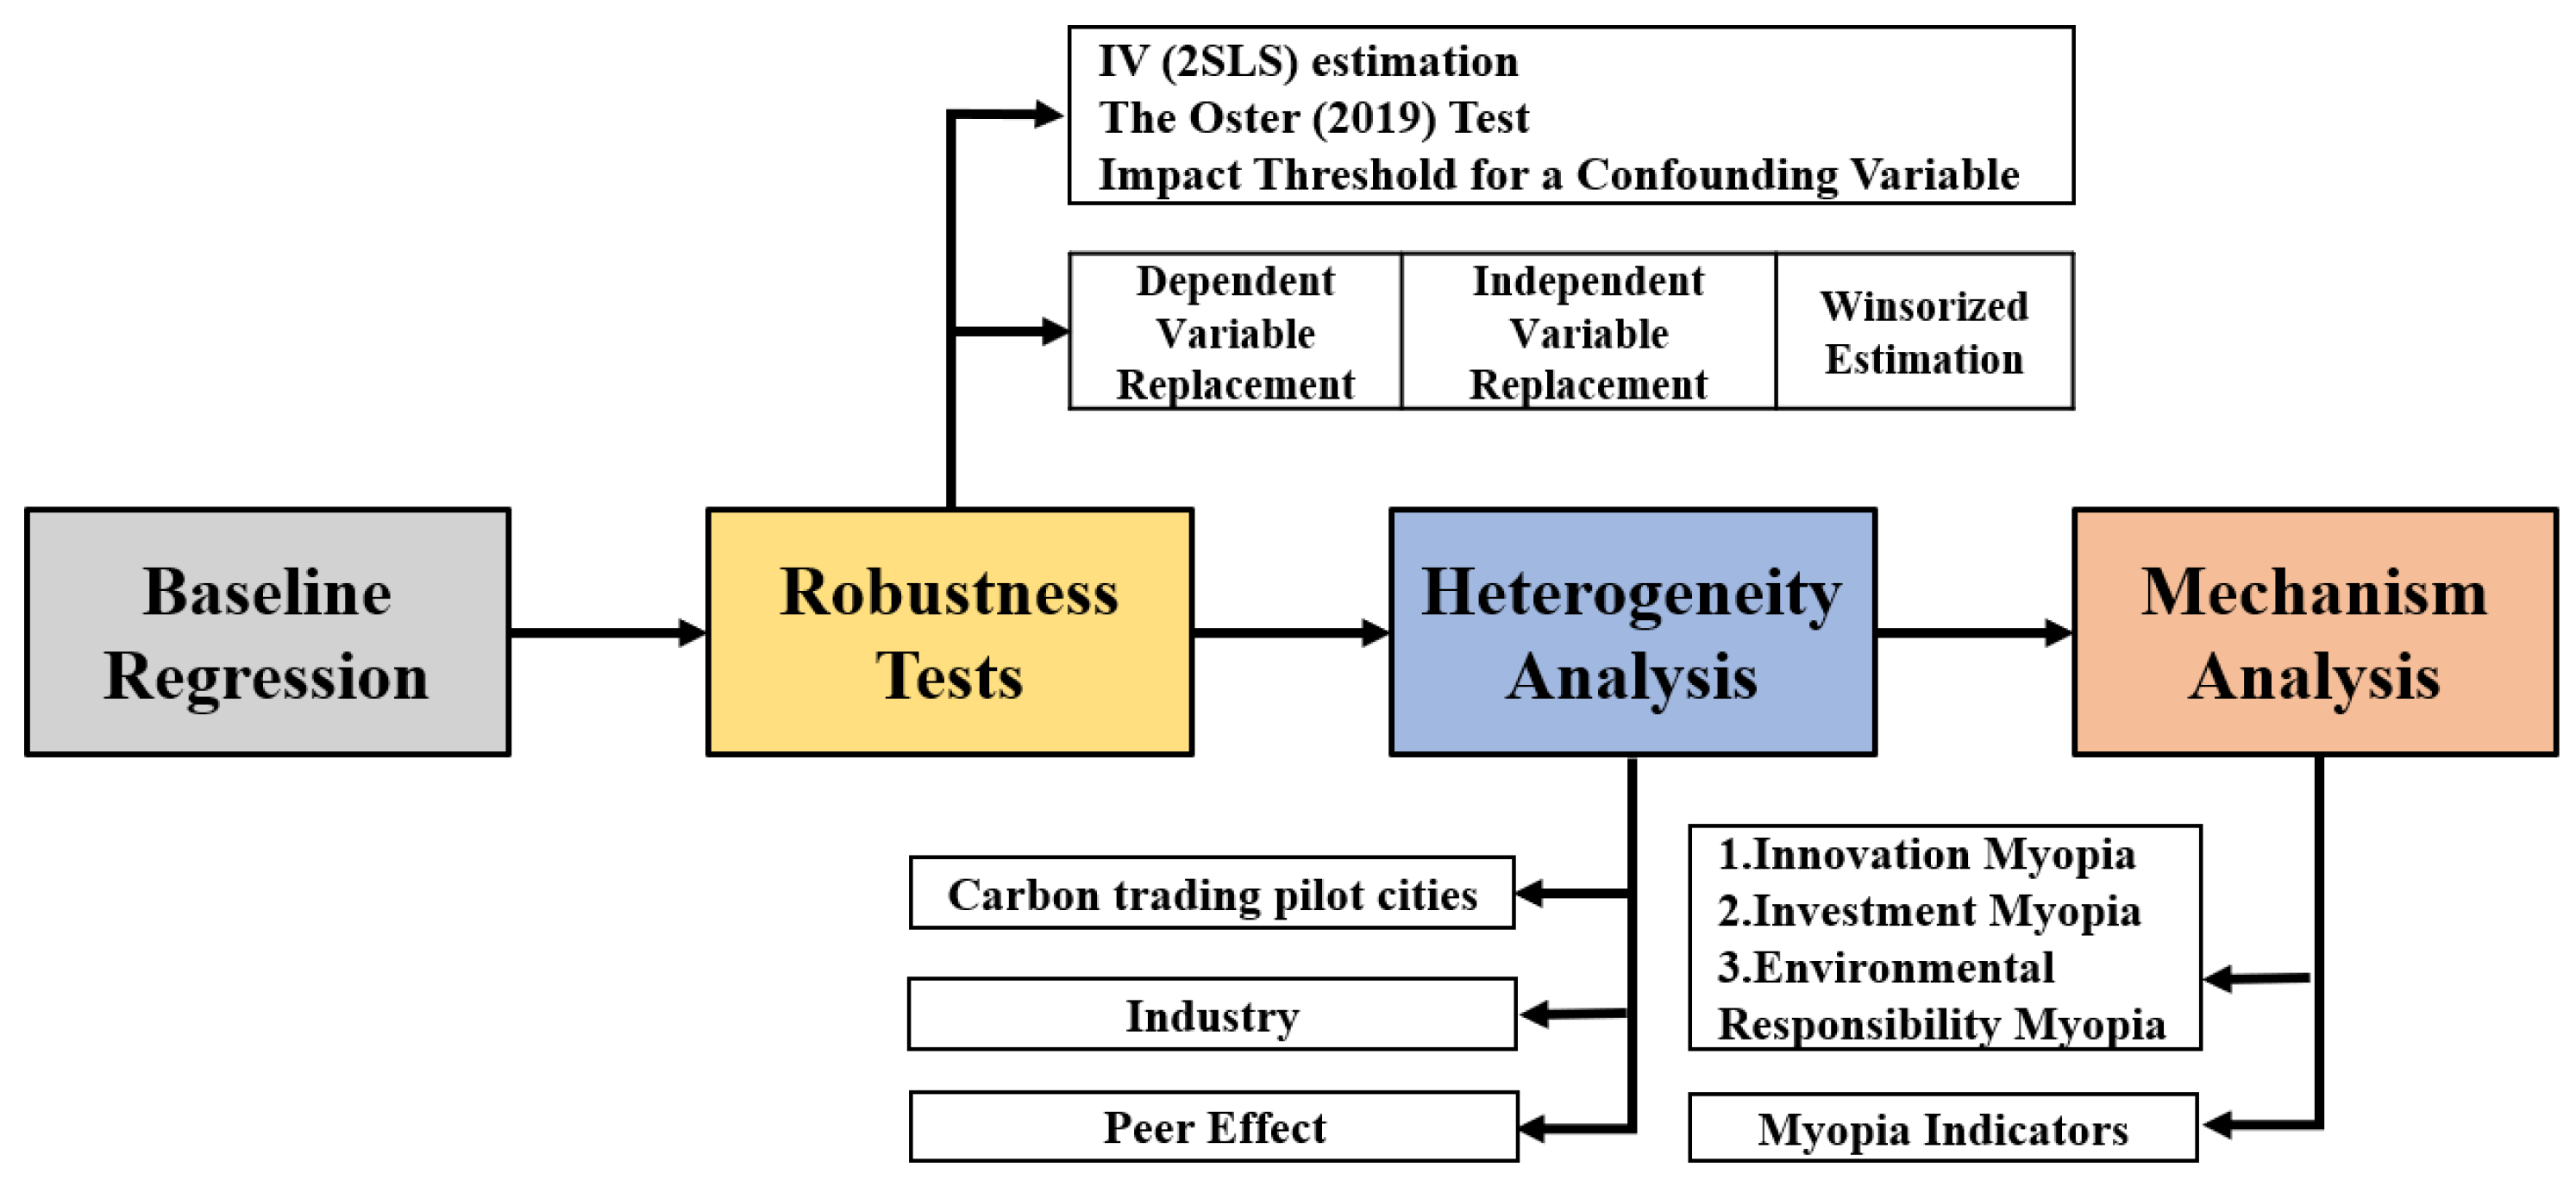
In this study, we utilize Text Mining and IPCC methods to measure the level of digital transformation and enterprise carbon emission intensity of A-share listed enterprises from 2008 to 2015. We first explore the impact of digitization on carbon intensity, followed by robustness tests and heterogeneity analysis. Furthermore, we construct Management Myopia as a framework to test and analyze the underlying mechanisms. This study makes four significant contributions. Firstly, it enhances the rationality and scientific rigor of indicators measurement. Previous studies have explored the effect of digital economy on regional carbon emission intensity at the provincial and city levels. However, some of these studies measured the carbon emission using absolute values, leading to a lack of comparability in carbon emissions among enterprises [18,19]. To address this limitation, our research adopts the IPCC method to calculate carbon emissions. We further divide these emissions by the enterprises’ production value added, constructing carbon emission intensity indicators that capture both environmental benefits and production efficiency. Secondly, our study is innovative, as evidenced by the fact that we adopt a unique research entry point, using text analysis to measure the degree of digital transformation and examining the influence of management myopic factors in this process. Thirdly, we construct a mechanism innovation by analyzing management myopia based on the Upper Echelons Theory and categorize myopia into three dimensions: innovation myopia, investment myopia, and environmental responsibility myopia. This framework sheds light on how different aspects of management myopia shape the relationship between digital transformation and decarbonization, thereby enriching our understanding of this complex phenomenon. Lastly, our study features perspective innovation by examining the effects of internal management characteristics on enterprise digital transformation-driven decarbonization. By considering the role of management traits and tendencies, we extend the scope and depth of research on this process, providing valuable insights for both academia and practice. The research framework is shown in Figure 1.

2. Literature Review and Theoretical Background

2.1. Digital Transformation and Carbon Emission Intensity of Enterprises

Studies examining the impact of digitalization on carbon emissions have yielded several key findings. Firstly, the digital economy helps to reduce regional carbon emissions [21] and drives decreases in the carbon emissions of surrounding regions with spatial spillover effects [2], indicating the positive externalities of the digital economy. In addition to the direct effect of carbon emission reduction, the application of digital instruments also promotes the development of digital finance, reduces financing constraints, and increases sustainable investment, resulting in a reduction in overall regional carbon emissions [14,15]. At the industry level, digital transformation has proven effective in promoting sustainable development in the manufacturing sector. The development of digital technologies has reduced energy consumption intensity in China’s industrial system [22], leading to a reduction in carbon emissions. Digitization has also been associated with increased productivity, driving total factor productivity [23,24], and contributing to energy intensity reduction and lower renewable energy costs [25]. These gains in manufacturing efficiency and industrial upgrading further contribute to reductions in total carbon emissions [12].
However, studies examining whether data factor inputs or digital technology applications contribute to a reduction in industrial carbon emissions have produced conflicting results. A second group of studies argues that digitization may actually exacerbate carbon emissions. The process of digitization itself, including the widespread usage of digital products and the operation of data centers, generates a substantial carbon footprint [26]. A third group of studies suggests an uncertain relationship between digitization and carbon emissions, possibly exhibiting an inverted U-shape pattern [27]. Chen et al. (2020) conclude that the environmental impacts of manufacturing digitization are both positive and negative, with the positive effect arising from resource efficiency gains through digital technology applications, while the negative effect stems from emissions during the manufacturing, use, and disposal of digital hardware [28].
Despite the existing literature on the impact of digitalization on carbon emissions, most studies have focused on analyzing overall carbon emissions at city- and industry-level, with fewer studies conducted at the enterprise level to explore the factors and mechanisms influencing carbon emissions. In the era of coordinated digitalization and greenization, digital transformation has become imperative for micro, small, and medium-sized enterprises (MSMEs) in helping them to achieve high-quality and sustainable development. On one hand, digitalization assists enterprises in improving their production systems, R&D innovations, business processes, and relationships, thus reducing the carbon footprint associated with these processes. Through the utilization of big data technologies, enterprises can forecast and intervene in their energy demand more scientifically, thereby preventing and reducing pollutant generation and resource waste at the source [29]. Xu et al. (2022) further confirm that digitization reduces energy intensity and optimizes the energy structure by promoting technological innovation, accelerating human capital accumulation, and mitigating structural distortions as mediating paths [30]. On the other hand, digitalization and decarbonization have become focal prints in central and local government reports and related documents. Enterprises actively explore digitalization and decarbonization practices to enhance their business legitimacy and stability [31,32]. Moreover, competitors within the same industry may make strategic adjustments according to the behaviors of each other or follow the strategic alternatives of the leading companies, i.e., digital transformation has a cohort effect of mutual incentives [33]. These influences of peer pressure create higher expectations for digital transformation, which is more conducive to its implementation, thus providing a basis for promoting decarbonization through digitalization. Therefore, we propose Hypothesis H1.
H1. 
Digital transformation leads to a decrease in enterprise carbon emission intensity, thereby promoting enterprise decarbonization.

2.2. The Impact of Management Myopia on an Enterprise’s Development

In practice scenarios, enterprises often encounter challenges in achieving substantial progress in digital transformation. The Accenture China Digital Transformation Index Study 2021 revealed that nearly 84% of enterprises have struggled to successfully undergo transformation, resulting in a predicament where they are torn between “waiting to die if they do not transform, but looking to die if they do.” This reality underscores the gap between strategic goals and strategy implementation, and scholars have analyzed the reasons in terms of resource base and the dynamic capabilities of enterprises [34,35]. However, it is essential to recognize that strategic decision-making in digital transformation relies on management for overall planning and driving implementation during practical execution. According to the Upper Echelon Theory, executive team traits influence strategy implementation [5]. Just as management traits impact the concrete implementation of digital strategy, we examine the influence of management myopia, which involves prioritizing immediate satisfaction of current interests over making decisions aligned with the long-term interests of the company [7,36]. Given the significant impact of managerial behavior on company decisions, the prevalence of managerial myopia in practice is quite high. It has been observed that myopic managers tend to favor projects with short maturities and high returns when making investment decisions [6,7,8].
Although digitalization is an industry megatrend, the decision to implement digital transformation can be risky, with uncertain prospects for different companies at various stages of development. Digitalization may lead to successful decarbonization, transformation failures, or fail to achieve decarbonization altogether. Regardless of the outcome, enterprises are required to make substantial investments in the current period, with potentially long-term returns. Due to myopic management, there may be a reluctance to sacrifice significant investments in the present for the uncertainties of the future. Alternatively, managers with limited cognitive abilities may be hindered when tasked with taking appropriate measures during digital transformation and ultimately fail to promote decarbonization through digitization. However, managers with strategic foresight will pay attention to national policies and observe the behavior of their peers, enabling them to adjust the direction of corporate development in a timely manner. Such enterprises are more likely to successfully implement digital transformation and promote decarbonization. Therefore, we hypothesize that:
H2. 
Management myopia plays a negative moderating role in the process of digitalization driving decarbonization.

2.3. Specific Impact Paths of Management Myopia

We have categorized management myopia into innovation myopia, investment myopia, and environmental awareness myopia, aiming to further investigate their moderating roles in driving decarbonization through digitalization.
Innovation myopia poses a significant challenge for enterprises. For businesses, adopting a low-carbon technology pathway is crucial for promoting low-carbonization. Digital transformation provides the appropriate conditions for enterprises to innovate in a green manner. This primarily manifests itself in two ways: Firstly, digital transformation utilizes emerging technologies, such as big data and artificial intelligence, to optimize the original operation mode [25]. Secondly, it facilitates information sharing and collaboration among enterprises, strengthens interconnections within the industrial and supply chains, enhances overall efficiency, and creates an environment conducive to enterprise innovation.
Given the above context, promoting low-carbon technology innovation within enterprises, enhancing resource utilization efficiency, and reducing carbon dioxide emissions are not only beneficial to the long-term development of enterprises but also aligned with the aforementioned national policy objectives. However, compared to conventional technology innovation, green technology innovation necessitates substantial initial capital investment, features a prolonged profit cycle, and entails unpredictable risks. From the perspective of myopic management, implementing green innovation usually does not align with the immediate interests of enterprises, potentially leading to a neglect of low-carbon technology innovation during the process of digital transformation. Consequently, this obstacle hinders the process of digitization-driven decarbonization. Hence, we propose the following hypothesis:
H3. 
Innovation myopia hinders the process of digitization-driven decarbonization.
Decarbonizing enterprises requires sustainable investments, which, unfortunately, do not bring significant short-term benefits. Additionally, digital transformation itself represents a substantial investment for enterprises. In this context, myopic managers who prioritize stable short-term performance and are averse to taking risks are less inclined to allocate their limited resources towards long-term decarbonization initiatives [37]. Instead, they are more motivated to invest in “short, flat, and fast” projects to avoid a decline in short-term performance, thereby impeding the progress of decarbonization. Based on this observation, we propose the following hypothesis:
H4. 
Investment myopia impedes the digitalization-driven decarbonization process.
Digitalization-driven decarbonization could yield long-term benefits for enterprise development; however, it may not yield immediate results and may lack motivational incentives for management. The willingness and attitude of performers towards implementing actual behavior have been found to have a strong positive relationship, as identified by psychologists and sociologists [38]. Behavioral attitude serves as a crucial motivating factor that inspires individuals or organizations to overcome challenges associated with a specific behavior [39]. Within the context of driving decarbonization, a key motivating factor for management is a sense of environmental responsibility, which significantly influences their strategic choices. The theory of strategic choice emphasizes the influence of values and cognitive abilities on an enterprise’s strategic decisions, with human resources being the core resource of an organization [40]. Consequently, executives, who bear the responsibility for an enterprise’s future development, are more likely to prioritize decarbonization during the implementation of their strategies. Conversely, myopic managers lacking environmental responsibility find it harder to implement digitalization to promote decarbonization. We hypothesize as follows:
H5. 
Myopic environmental awareness is detrimental to the digitalization-driven decarbonization process.

3. Research Objective, Methodology, and Data

3.1. Data Resources

The data utilized in this study span a period from 2008 to 2015. The fossil fuel consumption data, employed to calculate Enterprise Carbon Emission Intensity, were derived from the China National Tax Survey Database (CNTSD), with 2015 being the most recent year available. The China City Statistical Yearbook was used to gather information on the economic growth levels of cities. The annual reports of listed companies were obtained from the Juchao Information Website (CNINF), while the remaining data of listed companies were sourced from the China Stock Market & Accounting Research (CSMAR) database.
In addition, the following exclusions were applied in this study: (1) exclusion of financial listed companies; (2) exclusion of ST companies; (3) exclusion of companies with missing main variables; (4) exclusion of high-tech, computer, internet companies primarily engaged in software-related business and GEM (Growth Enterprise Market). Companies in or related to these fields were excluded due to the different drivers behind their digital strategic transformation [40]. Their enterprise development does not necessarily require digital transformation, and the degree of their digital transformation would be quite small and not within the focus of this study as their own business models are inherently linked to digitalization. The study utilized 8 years of unbalanced panel data from 2158 listed companies, leading to the consideration of a total of 6246 samples.

3.2. Variable Measurement and Description

3.2.1. Enterprise Carbon Emission Intensity

Enterprise Carbon Emission Intensity is the dependent variable, representing the carbon emissions per unit of production value of a company and reflecting carbon efficiency in production. A lower Carbon Emission Intensity indicates the adoption of a low-carbon and efficient production model. According to Cui et al. [41], the logarithm of carbon emissions per unit of production value is used to measure an enterprise’s carbon emission intensity. This calculation requires two variables: carbon emissions and the gross output value (GOV) of the enterprise.
To calculate carbon emissions, the study employs the IPCC method based on the Guidelines for National Greenhouse Gas Inventories released by the Intergovernmental Panel on Climate Change in 2006. The calculation is represented by Equation (1).
C O 2 = i = 1 n E i × N C i × C E F i × C O F i × 44 12
In the formula, E i represents the final energy consumption; N C i is the net calorific value of energy (known as the average low calorific value in Chinese national standard GB/T2589-2008); C E F i is the carbon emission factor per unit of calorific value; C O F i is carbon oxidation factor (specified as 1 by IPCC since the proportion of carbon oxidized of the carbon in fossil fuels reaches 98–100%); and the ratio used to convert carbon emissions to CO2 emissions is 44/12. The subscript i represents the i-th category of energy. By determining the precise type and quantity of energy used by an enterprise, Equation (1) allows for the calculation of CO2 emissions. However, considering the varying sizes of enterprises, it would be inappropriate to directly use carbon emissions as the dependent variable. Therefore, in the second step, carbon emissions are divided by the total output value of the enterprise and logarithmically transformed. This yields the carbon intensity of the enterprises, as demonstrated in Equation (2).
l n C E I = l n C O 2 G O V
The fossil fuel consumption data required for calculating Enterprise Carbon Emission Intensity were obtained from the China National Tax Survey Database (CNTSD), with the most recent available data being from 2015. The total output value data of listed companies were sourced from the China Stock Market & Accounting Research (CSMAR) database.

3.2.2. Digital Transformation

This study employs a python crawler to statistically analyze the frequency of words related to “digital transformation” in the annual reports of listed companies, based on the method outlined by Yang (2023) [40]. The use of certain words in the annual reports can reflect the management philosophy and strategic arrangement of the enterprises, providing insights into the management’s vision of the enterprise’s development and their characteristics. The specific processing technique was as follows: We first perused the annual reports of A-share listed firms on the Shanghai and the Shenzhen Stock Exchange Markets, split the words using the Python Chinese Word Splitting Database (jieba), and subsequently matched the words with the “digital transformation” thesaurus to determine the frequency of word usage in the annual reports. The thesaurus results for “digital transformation” contained four popular subfields: artificial intelligence, Big Data and image processing, cloud and Internet of Things, and blockchain. Finally, the word frequency of “digital transformation” was logarithmically transformed to indicate the degree of digital transformation of enterprises, serving as our independent variable.
The details of the “Digital Transformation” thesaurus are shown in Figure 2.

3.2.3. Control Variables

This paper incorporates control variables at both city- and enterprise-level to isolate the net impact of digital transformation while accounting for the effects of other factors on enterprise carbon emission intensity.
  • City-level control variables: (1) Level of area economic development: Measured by city GDP, this variable reflects the overall economic growth and prosperity of the region where the enterprise is located. (2) Level of tertiary industry development (GDPC3): Expressed as the ratio of tertiary industry to GDP in the area, this indicator signifies the degree of socialization of production and market economy development in the region. The data for these variables were obtained from the China Municipal Statistical Yearbook (2008–2015) and logarithmically transformed.
  • Enterprise-level control variables: (1) Total asset turnover ratio (AssetTurnover): Calculated as net sales income divided by average total assets, this ratio measures the efficiency of an enterprise’s operations. A higher turnover rate indicates strong operating capability, while a lower rate suggests insufficient revenue or the underutilization of assets. (2) Managerial shareholding (ManagerShares): This variable serves as an incentive mechanism that aligns the interests of management and shareholders, reducing agency costs. It has a positive relationship with enterprise performance and is an important influencing factor considered as a control variable [42]. (3) Enterprise size (Size): Measured by the logarithm of the asset, this variable provides an indication of the scale of the enterprise. (4) Number of employees (lnEmployee): This variable captures the size of the workforce within the enterprise and also involves logarithmic transformation. (5) State-owned enterprise (dum_state): State-owned enterprises often have policy preferences but may exhibit a lower operating efficiency [43,44]. We account for such differences by creating dummy variables, where state-owned enterprises are assigned a value of 1 and non-state-owned enterprises are assigned a value of 0. (6) Profitability indicators: We consider two variables to control for profitability: return on assets (ROA) and book value per share (BPS). Enterprises with higher profitability are typically better equipped to afford the expenses associated with reducing carbon emissions and optimizing carbon emission intensity [45].

3.2.4. Robustness Test Variables

In the robustness test section, we introduce several variables to further examine the robustness of our findings. Firstly, we applied winsorization to the dependent variable (lnCO2Efficiency_w) and replaced it with the absolute value of enterprise carbon emissions divided by the logarithm of the GDP of the enterprise’s location (LnCO2). This adjustment allowed us to assess the carbon efficiency relative to the economic scale of the location. Furthermore, as a robustness test, we replaced the independent variable with the level of robot utilization in the industry (Robot). To address potential endogeneity concerns, we adopted an instrumental variable approach by multiplying the number of urban telephones in 1984 with the number of national Internet broadband access subscribers for each year in each city (IV).
For further details and the reasons behind the inclusion of these variables, please refer to Section 4.2.

3.2.5. Mechanism Variables

We utilized various mechanism variables that shed light on the underlying processes driving the relationship between digitalization and decarbonization.
  • Direct indicators of management myopia (myopia): We constructed a seed set of words related to “Management Myopia” based on the managerial discussion and analysis (MD&A) section of Chinese A-share listed companies’ annual reports, referring to existing research written in English [46]. For a comprehensive description of the methodology and specific details, please refer to Section 4.4.1.
  • Level of green innovation (lgreen): We utilized the number of green patent applications as a measure of the level of green innovation. Management teams with innovation myopia tend to prioritize projects with shorter payback periods and higher returns, potentially neglecting green technology innovation. Thus, the number of green patent applications reflects management’s green innovation myopia.
  • Sustainable investment (invest): To capture management’s investment myopia, we examined the amount of green investments. Management teams with investment myopia are less inclined to invest in green projects, as they tend to prefer short-term, low-risk, and quick-return investments [37].
  • Environmental awareness (aware): We construct an environmental awareness thesaurus and measured environmental awareness based on the number of relevant words involved [47]. Managers who possess environmental awareness are intrinsically motivated to drive decarbonization, whereas management teams with myopia lack such motivation. For specific related words, please refer to Figure 3.
All the variables utilized in our study are presented in Table 1, encompassing the dependent variable, independent variable, control variables, robustness test variables, and mechanism variables. The table provides a comprehensive overview of the variables employed in our analysis.

3.3. Descriptive Statistical Analysis

Table 2 presents the descriptive statistics for the study’s key variables. The dependent variable, enterprise carbon emission intensity, has a right-skewed distribution with a mean value of 0.103, a median value of 0.0100, a variance of 0.424, and a range from 0 to 8.688. Similarly, digital transformation also displays right-skewness. The remaining variables are provided in the table below. Through the descriptive statistics, we can gain a preliminary understanding of the numerical characteristics of each variable. Next, we will construct a model to further analyze whether digital transformation can reduce Enterprise carbon emission intensity.

3.4. Model Setting

3.4.1. Regression Model

To examine the impact of digital transformation on enterprise carbon emission intensity, we employ a multiple linear regression model as our analytical approach. The model, presented in Equation (3) incorporates fixed effects and clustering at the city-, year-, and enterprise-levels:
l n C a r b o n E f f j , t = β 0 + β 1 l n d i g i t a l j , t + β j X j , t + γ t + μ j + θ c + ε t , j , c
Subscript i,t,j and c denote cities, years, enterprises, and industries, respectively. l n C a r b o n E f f j , t is the dependent variable (enterprise carbon emission intensity), and l n d i g i t a l j , t is the independent variable (digital transformation). X j , t is a set of control variables, including city- and enterprise-level control variables. Additionally, γ t captures fixed time (year) effect, μ j captures fixed individual (enterprise) effect, θ c represents fixed city effect, and ε t , j , c is random error term. β 1 is the core estimation parameter of particular interest, which represents the net effect of digital transformation on enterprise carbon emission intensity. A positive β 1 indicates that digital transformation leads to an increase in enterprise carbon emission intensity, while a negative value indicates the opposite.

3.4.2. The Mechanism Test model

The mechanism test model is constructed as shown in Equations (4) and (5)—with Equation (5) being an extension of Equation (4)—to examine the moderating effect focusing on the coefficient of the interaction term. The moderating variable, denoted as D, is incorporated into the model.
l n C a r b o n E f f j , t = δ 0 + δ 1 l n d i g i t a l j , t + δ 2 D + δ 3 l n d i g i t a l j , t × D j , t + δ j X j , t + γ t + μ j + θ c + ε t , j , c
E ( Y | · ) l n d i g i t a l j , t = δ 2 + δ 3 ( D j , t )
The moderating variable D encompasses the direct indicators of management myopia, as well as other mechanism variables reflecting different aspects of management myopia, e.g., the level of green innovation (myopia in innovation), sustainable investment (myopia in investment), and environmental awareness (myopia in sustainable awareness).
The choice of the moderating effects model is driven by the objective of exploring how the relationship between digitalization and decarbonization is influenced by the level of the mechanism variable. This allows for a deeper understanding of how the different mechanisms interact and influence the relationship of interest [48]. This model provides unique insights into the dynamics at play compared to other models, such as the mediating effects test.

3.5. Endogeneity Concerns

When examining the relationship between endogenous variables, there are significant limitations that need to be addressed. In this particular case, the issue of endogeneity is particularly relevant due to the quasi-monotonic trends observed in both digital transformation and carbon emission intensity during the study period of 2008–2015. Several reasons contribute to why these variables, along with managerial myopia, may have changed during this period.
Firstly, carbon emission intensity likely decreased consistently during this period due to the growing importance of environmental, social, and governance (ESG) factors and increased asset management by international investment companies [49,50]. Additionally, technological advancements enabled more efficient carbon emission reduction. Secondly, digital transformation likely experienced continuous growth during the same period, driven by expansionary monetary policies in developed nations that led to capital flows into emerging markets, such as China [51]. To remain competitive, firms gradually adopted digital technologies in their business models. Lastly, managerial myopia may have steadily increased between 2008 and 2015, influenced by excess capital flows to China caused by monetary expansion [51,52]. This flight-to-yield effect could have affected managerial decision-making, prioritizing short-term gains over long-term sustainability. Considering these reasons, it becomes evident that the endogeneity concerns surrounding the study’s variables are of utmost importance and should be carefully addressed.

4. Results and Discussion

4.1. Baseline Regression

To test hypothesis H1, we conducted a baseline regression using model (3), and the regression results are presented in Table 3. Columns (1)–(5) progressively include the control variables, and column (5) demonstrates that the effect of digital transformation on enterprise carbon emission intensity is significantly negative at the 1% level after incorporating the control variables, fixed effects, and enterprise clustering. The estimated coefficient β 1 is −0.018. Therefore, H1 is supported, indicating digital transformation does bring about a reduction in enterprise carbon emission intensity.

4.2. Robustness Test

4.2.1. Replacing the Dependent Variable

To demonstrate the stability of the baseline regression results, in this study, we replaced the dependent variable with the absolute value of enterprise carbon emissions divided by the logarithm of the GDP of the enterprise’s location. The purpose of this replacement was to test the impact of digital transformation on the absolute amount of corporate carbon emissions while addressing regional disparities and heteroskedasticity. The estimation results are presented in column (1) of Table 4. The findings indicate that digital transformation significantly reduces the absolute carbon emissions of enterprises at the 1% statistical level. This provides further evidence to support our hypotheses.

4.2.2. Replacement of Independent Variable

In this test, we replace the independent variable with the level of robot utilization in the industry. As digitizing the production process is a crucial aspect of digital transformation, the utilization of robots plays a significant role. Thus, robot utilization becomes an important measure of digital transformation in manufacturing enterprises [53]. We used enterprise robot penetration as a proxy variable to test the level of digitization in the production process and access the degree of digital transformation in enterprises. The estimation results are presented in column (2) of Table 4. The findings reveal that the impact of robot utilization on corporate carbon intensity is significantly negative at the 10% statistical level, indicating that digital transformation helps reduce enterprise carbon intensity. This further supports the stability of the regression results to some extent.

4.2.3. Dependent Variable Winsorized

To address the potential influence of extreme values on the estimation results of the baseline regression, we applied winsorization to the enterprise carbon emission intensity, as is shown in column (3) of Table 4. The findings demonstrate that the effect of digital transformation on enterprise carbon emission intensity is significantly negative at the 5% statistical level, indicating that the digital transformation of enterprises contributes to a reduction in enterprise carbon emission intensity. This finding reinforces the stability of our results.

4.2.4. Instrumental Variables Method

To address the issue of endogeneity, we employed the instrumental variables method. The digital transformation of enterprises relies heavily on the support of related digital industries, which, in turn, is influenced by the digital infrastructure development and economic level of the cities where the enterprises are located. Therefore, we utilized the number of urban telephones in 1984 as an instrumental variable and factored it in to our logarithmic work [54]. The rationale behind selecting this instrumental variable is that digitalization is highly related to Internet technology, and in China, internet access was initially facilitated through telephone dial-up connections. Cities with high telephone penetration in 1984 after the reform and opening up, were more likely to have advanced internet technology and greater digitalization, aligning with the correlation assumption of the instrumental variable. Moreover, the number of urban telephones in 1984 is unlikely to directly affect present-day conditions, ensuring the exogeneity of the instrumental variables. Considering that the number of urban telephones in 1984 is a cross-sectional datum from a single year, we constructed an instrumental variable in practice by multiplying it with the number of national Internet broadband access subscribers for each year in each city. This instrumental variable captures the digital transformation process. The regression results of the instrumental variables are shown in Table 5.
The first column demonstrates a significant positive correlation between the core explanatory variable and the instrumental variable, indicating the strong explanatory power of the selected variable. The Cragg–Donald Wald F statistic and the Kleibergen–Paap Wald rk F statistic are 227.33/93.10, respectively, far exceeding the critical values for the Stock–Yogo weak ID test critical values at 10% maximal IV size (16.38). This suggests the absence of weak instrumental variable problems. In the overidentification test of instrumental variables, the second column reveals that the core explanatory variable “lndigital” is significantly negative at the 1% level. This implies that, after effectively addressing endogeneity concerns, digital transformation reduces enterprise carbon emissions intensity, thereby confirming the robustness of the regression results.

4.2.5. The Oster (2019) Test

This section follows the methodology proposed by Oster (2019) and Dantas et al. (2023) [20,55]. It is assumed that selection on unobservables is proportional to selection on observables. The bounding value of the estimate ( β * ) is defined as β * = β ~ ( β ˙ β ~ ) ( R m a x 2 R ~ 2 ) R ~ 2 R ˙ 2 , where β ˙ and R ˙ 2 are the point estimate and R-squared for the simplified regression without time fixed effect, respectively, while β ~ and R ~ 2 are the corresponding values from the regression with all controls (Table 3, column 5). Table 6 presents the parameter bounds when using controls. The method assumes a proportionality factor of one ( δ = 1 ) between selection on un-observables and selection on observables, requiring an assumption about the maximum possible R2 of the regression. Following the calibration proposed by Oster (2019) [20], we set R m a x 2 = m i n ( 1 , π × R ~ 2 ) and π = 1.3 as suggested. The results are shown in Table 6.
β * = −0.0192, which is not significantly different from β ~ . The inclusion of controls accounted for the unobserved factors, and their effect on the estimate was not found to be significant. No instances were generated where β = 0 or β reversed to a positive number. Thus, this approach demonstrates that the unobservables do not have a substantial impact on our main results, effectively addressing concerns regarding endogeneity (3.5) and confirming the robustness of our regression results.

4.2.6. Impact Threshold for a Confounding Variable

To evaluate the bias introduced by an omitted variable, we adopted the Impact Threshold for a Confounding Variable (ITCV) test, as proposed by He et al. (2020) [56]. The ITCV test assesses the extent to which the results and inferences would be invalidated if an unobservable factor had been included in the regression model by considering its correlations with both the key independent variable and the dependent variable [57]. A higher ITCV value indicates that our regression results are less susceptible to potential omitted-variable bias.
The results of the ITCV test are presented in Table 7. The estimated ITCV is 0.0072, exceeding the absolute value of the impact factor (Impact) for all the control variables included in Model (1). This finding provides assurance that our main hypothesis H1 remains robust against potential issues related to correlated omitted variables.

4.3. Heterogeneity Analysis

4.3.1. Carbon Trading Pilot Cities

To promote green and low-carbon development, China has implemented market mechanisms to address carbon emissions. In October 2011, the National Development and Reform Commission gave its approval to seven provinces and cities, including Beijing, Tianjin, Shanghai, Chongqing, Hubei, Guangdong, and Shenzhen, to pilot carbon emission trading. All seven pilots commenced online trading in 2014. We conducted a heterogeneity test to investigate whether the location of enterprises in a carbon trading pilot city influences their carbon emissions intensity. The results in Table 8 demonstrate that digital transformation reduces carbon emissions intensity. However, the coefficient of −0.014 is smaller in pilot cities compared to non-pilot cities (−0.026). This suggests that carbon trading mechanisms promote low-carbon development but weaken the emission reduction effect of digital transformation.

4.3.2. Industrial Types: Light and Heavy Industries

Due to variations in production processes, carbon emissions differ between light and heavy industries. Therefore, we classify them into two categories based on industry codes. Heavy industry generates relatively more carbon emissions during its production process. Digital transformation improves production efficiency and reduces carbon emissions, particularly in heavy industry. We analyzed the heterogeneity of these two industry types within the manufacturing sector separately (refer to Table 8). The coefficient of digital transformation for heavy industry is significant at the 1% level (−0.023), while light industry is insignificant (−0.008). This indicates that digitalization is more effective in reducing carbon emissions within heavy industry.

4.3.3. Peer Effect

This study examines the different effects of digital transformation based on industry and regional perspectives, taking into account firms with and without a peer effect. Peer effect refers to the influence of corporations on each other’s digital transformation decisions within the same industry and region [33]. Results in Table 8 reveal that the coefficient of digital transformation is significant at the 1% level (−0.019) for firms with a peer effect, while it is insignificant for firms without a peer effect. This suggests that visionary management teams adjust their strategy based on the digital transformation decisions of other firms within the same industry and region.

4.4. Mechanism Test

4.4.1. Direct Metrics of Management Myopia

To develop indicators for management myopia, we analyzed annual financial reports of A-share companies in Shanghai and Shenzhen. Through a thorough examination of the language used in these reports, we constructed a Chinese word set that captures the concept of “Management Myopia” among managers. By employing a combination of lexicon methodology, Chinese corpus characteristics, and Word2Vec machine learning, we identified a seed set of words related to “Management Myopia” found in the discussion and analysis (MD&A) sections of the annual reports of Chinese listed companies [46]. This seed set contains 10 direct categories, including phrases such as “within days” and “as soon as possible,” as well as 33 indirect categories, including terms such as “opportunity” and “pressure.” Subsequently, we calculated the ratio of the frequency of these words to the total frequency of MD&A in the annual report, multiplying it by 100 to derive an indicator of managerial myopia. A higher value of this indicator signifies a greater degree of myopia among managers. Notably, we discovered that the frequency of “Management Myopia" words in the Chinese MD&A corpus better reflects managers’ intrinsic characteristics rather than myopia driven by environmental factors.

4.4.2. Impact Paths of Management Myopia

Testing the Innovation Myopia Mechanism: Green Innovation of Enterprises

To gauge the level of green innovation within enterprises, we measured the number of green patent applications. Our findings reveal that management teams characterized by innovation myopia are less inclined to prioritize green technology innovation, which often entails a longer payback period and lower returns. Consequently, the number of green patent applications is likely to be relatively low. The number of green patent applications serves as an indicator that reflects the level of innovation myopia among management. The greater the degree of innovation myopia among management, the lower the number of green patent applications.

Testing the Investment Myopia Mechanism: Sustainable Investment

Managers exhibiting investment myopia are less inclined to invest in sustainable investments. Such managers tend to prefer projects with shorter timeframes, lower risk, and quicker returns [37]. To assess the extent of investment myopia among managers, we analyzed the amount of green or sustainable investment undertaken by the company. Corporate environmental investment is classified into seven categories, encompassing research and development (R&D), renovation expenditure on environmental technology, investment and renovation expenditure on environmental facilities and systems, as well as cleaner production expenditure [58]. Managers characterized by investment myopia tend to invest less in sustainable initiatives.

Testing the Environmental Responsibility Myopia Mechanism: Awareness of Environmental Responsibility

The strategic choices made by an enterprise are influenced by the interplay between human values and cognitive ability. Top managers steer the future direction of the enterprise. Managers who possess an awareness of environmental responsibility are more likely to prioritize decarbonization during the strategy implementation process. Environmental awareness serves as an indicator that reflects the degree of myopia regarding environmental responsibility among managers. Managers characterized by a myopic sense of environmental responsibility exhibit relatively low levels of environmental awareness.
Table 9 presents the results of our moderating effect models. The baseline regression is shown in column (1), while columns (2) to (5) display the regression models with the inclusion of each myopia type added as a moderating effect. In column (2), the coefficient of the interaction term between management myopia and digitization is 0.788—significant at the 1% level. This indicates that higher levels of management myopia hinder the effectiveness of digitization in driving decarbonization. Therefore, hypothesis H2 is supported.
Regarding column (3), the coefficient of the interaction term between innovation myopia and digitization is −0.004—significant at the 10% level. This suggests that a focus on green patents enhances the decarbonization impact of digitalization, and higher levels of innovation myopia are less conducive to digitalization promoting decarbonization. Thus, hypothesis H3 is confirmed.
In column (4), the coefficient of the interaction term between investment myopia and digitization is −0.002—significant at the 1% level. This indicates that prioritizing sustainable investment strengthens the decarbonization effect of digitalization, and higher levels of investment myopia are less conducive to digitalization driving decarbonization. Therefore, hypothesis H4 is supported.
Finally, column (5) reveals that the coefficient of the interaction term between environmental responsibility myopia and digitization is −0.030—significant at the 5% level. This indicates that the awareness of environmental responsibility among managers promotes the use of digital transformation in advancing decarbonization efforts, and higher levels of environmental responsibility myopia hinder digitalization in promoting decarbonization. Hence, hypothesis H5 is supported.

4.5. Marginal Contributions

Given the intertwined nature of digital transformation, low carbon development, and corporate strategies, management traits can play a significant role in decision-making processes and subsequently impact data-driven outcomes. Previous research has explored the effects of digital transformation on carbon emissions reduction and proposed specific impact pathways [40], while others have employed management research methods to examine the economic and environmental effects of carbon-related products, services, and transportation through tailored questionnaires and the inclusion of management characteristics [18]. What distinguishes this study is its granular approach, analyzing the internal factors influencing this process at the enterprise level rather than adopting a macroeconomic perspective [59]. Furthermore, the precise estimation findings derived from enterprise-level data can provide strategic insights and guidance for corporate decision-making.

5. Conclusions

This study investigates the impact of digital transformation on carbon emission intensity from a myopic management perspective. Our regression analysis reveals that digital transformation has a positive effect on reducing enterprise carbon emission intensity, and the results hold up under robustness tests. We performed the following rigorous endogeneity tests to ensure the credibility of the results: the Oster (2019) [20] test and impact threshold for a confounding variable test—also applying the instrumental variables method. In our analysis of heterogeneity, we found that the carbon-emission-reduction effect of digitalization is weakened in carbon trading pilot cities, where enterprises prioritize low-carbon development due to policy influence. Conversely, in heavy industries, digitalization has a more significant impact on reducing carbon emissions. We also conducted a heterogeneity test to examine peer effects within the same industry, and our findings demonstrate that the carbon reduction effect of digitalization is more pronounced in enterprises with a peer effect.
In the mechanism research section, we analyzed the impact of management myopia, an internal factor that affects the promotion of decarbonization through digitalization. We explored the role played by managerial characteristics in the digital transformation process, enriching the study of the antecedent variables of enterprise digital transformation. We employed direct indicators, measuring management myopia and select mechanism variables (such as green innovation, sustainable investment, and environmental responsibility) to analyze the mechanisms involved in the digitalization-driven decarbonization process from a management perspective. Our results reveal that management myopia hinders the effectiveness of digital transformation in driving decarbonization, and we identify specific myopic tendencies in the following areas:
  • Innovation myopia: Insufficient emphasis on green innovation, failure to fully leverage the green innovation environment created by digitalization, and a lack of further mobilization of green innovation to support enterprise decarbonization efforts.
  • Investment myopia: The ability of digitalization to promote decarbonization relies on support from sustainable investment, but due to myopia among managers with respect to investment, they neglect sustainable investment with long return cycles, hampering decarbonization progress.
  • Myopic environmental responsibility: While digitalization promotes long-term enterprise development, its short-term effects may appear insignificant, and the decarbonization process may encounter challenges and transformations. Behavioral incentives are needed for management to sustain progress. Management teams that consider their environmental responsibility are more likely to persevere, while myopic management teams are not.
Table 10 provides a summary of the research hypotheses and their corresponding validation status.
Practice implications: As more traditional manufacturing enterprises opt for digital transformation to promote low-carbon development, based on our findings, we offer the following suggestions to managers: Actively embrace digital transformation as an inevitable long-term development trend to drive low-carbonization. Adjust strategies to align with the changing times and adopt a longer-term perspective on corporate transformation and development. Avoid innovation myopia by adapting to the evolving environment, cultivating core competencies, and emphasizing innovation in digitalization practices. Overcome investment myopia by making corresponding green and sustainable investments. Avoid environmental responsibility myopia and embrace the concept of environmental protection to help achieve low-carbonization.
Study limitations and future prospects: This study utilized linear regression to examine the relationship between digitalization and carbon emissions. Future research could consider incorporating non-linear relationships or gate-effects models to enhance their analysis. Additionally, the data used in this study were derived from The Chinese National Tax Survey Database, with the latest available data being from 2015. It would be worthwhile for future studies to explore other databases to extend the study period and examine potential changes in recent years.

Author Contributions

Conceptualization, Y.M. and P.T.; methodology, Y.M.; software, Y.M.; validation, Y.M. and P.T.; formal analysis, Y.M. and P.T.; data curation, Y.M. and P.T.; writing—original draft preparation, Y.M.; writing—review and editing, P.T. All authors have read and agreed to the published version of the manuscript.

Funding

This research received no external funding.

Institutional Review Board Statement

Not applicable.

Informed Consent Statement

Informed consent was obtained from all subjects involved in the study.

Data Availability Statement

The Chinese National Tax Survey Database (CNTSD) can be found on the official website of the State Taxation Administration of China, specific website: http://www.chinatax.gov.cn/eng/ (accessed on 10 January 2023). Annual reports of Chinese A-share listed companies can be found on Juchao Information Website: http://www.cninfo.com.cn/new/index (accessed on 10 January 2023). The website of the China Stock Market & Accounting Research Database (CSMAR) is as follows: https://www.gtarsc.com/ (accessed on 10 January 2023). More information about IPCC Guidelines for National Greenhouse Gas Inventories can be found at https://www.ipcc.ch/ (accessed on 10 January 2023).

Conflicts of Interest

The authors declare no conflict of interest.

References

  1. Ghobakhloo, M.; Iranmanesh, M.; Grybauskas, A.; Vilkas, M.; Petraitė, M. Industry 4.0, Innovation, and Sustainable Development: A Systematic Review and a Roadmap to Sustainable Innovation. Bus. Strat. Environ. 2021, 30, 4237–4257. [Google Scholar] [CrossRef]
  2. Yi, M.; Liu, Y.; Sheng, M.S.; Wen, L. Effects of Digital Economy on Carbon Emission Reduction: New Evidence from China. Energy Policy 2022, 171, 113271. [Google Scholar] [CrossRef]
  3. van Tonder, C.; Schachtebeck, C.; Nieuwenhuizen, C.; Bossink, B. A Framework for Digital Transformation and Business Model Innovation. Management 2020, 25, 111–132. [Google Scholar] [CrossRef]
  4. Verhoef, P.C.; Broekhuizen, T.; Bart, Y.; Bhattacharya, A.; Qi Dong, J.; Fabian, N.; Haenlein, M. Digital Transformation: A Multidisciplinary Reflection and Research Agenda. J. Bus. Res. 2021, 122, 889–901. [Google Scholar] [CrossRef]
  5. Hambrick, D.C.; Mason, P.A. Upper Echelons: The Organization as a Reflection of Its Top Managers. Acad. Manag. Rev. 1984, 9, 193. [Google Scholar] [CrossRef]
  6. Holmström, B. Managerial Incentive Problems: A Dynamic Perspective. Rev. Econ. Stud. 1999, 66, 169–182. [Google Scholar] [CrossRef]
  7. Narayanan, M.P. Managerial Incentives for Short-Term Results. J. Financ. 1985, 40, 1469–1484. [Google Scholar] [CrossRef]
  8. Stein, J.C. Takeover Threats and Managerial Myopia. J. Political Econ. 1988, 96, 61–80. [Google Scholar] [CrossRef]
  9. Jiang, N.; Jiang, W.; Chen, H. Innovative Urban Design for Low-carbon Sustainable Development: Evidence from C Hina’s Innovative City Pilots. Sustain. Dev. 2022, 31, 698–715. [Google Scholar] [CrossRef]
  10. Jiang, Q.; Ma, X. Risk Transmission between Old and New Energy Markets from a Multi-Scale Perspective: The Role of the EU Emissions Trading System. Appl. Econ. 2022, 54, 2949–2968. [Google Scholar] [CrossRef]
  11. Sovacool, B.K.; Newell, P.; Carley, S.; Fanzo, J. Equity, Technological Innovation and Sustainable Behaviour in a Low-Carbon Future. Nat. Hum. Behav. 2022, 6, 326–337. [Google Scholar] [CrossRef]
  12. Li, Z.; Shao, S.; Shi, X.; Sun, Y.; Zhang, X. Structural Transformation of Manufacturing, Natural Resource Dependence, and Carbon Emissions Reduction: Evidence of a Threshold Effect from China. J. Clean. Prod. 2019, 206, 920–927. [Google Scholar] [CrossRef]
  13. Dogan, E.; Seker, F. The Influence of Real Output, Renewable and Non-Renewable Energy, Trade and Financial Development on Carbon Emissions in the Top Renewable Energy Countries. Renew. Sustain. Energy Rev. 2016, 60, 1074–1085. [Google Scholar] [CrossRef]
  14. Huang, Y.; Xue, L.; Khan, Z. What Abates Carbon Emissions in China: Examining the Impact of Renewable Energy and Green Investment. Sustain. Dev. 2021, 29, 823–834. [Google Scholar] [CrossRef]
  15. Ren, X.; Shao, Q.; Zhong, R. Nexus between Green Finance, Non-Fossil Energy Use, and Carbon Intensity: Empirical Evidence from China Based on a Vector Error Correction Model. J. Clean. Prod. 2020, 277, 122844. [Google Scholar] [CrossRef]
  16. Shao, Y.; Li, J.; Zhang, X. The Impact of Financial Development on CO2 Emissions of Global Iron and Steel Industry. Environ. Sci. Pollut. Res. 2022, 29, 44954–44969. [Google Scholar] [CrossRef]
  17. Kouloukoui, D.; Marinho, M.M.D.O.; Gomes, S.M.D.S.; de Jong, P.; Kiperstok, A.; Torres, E.A. The Impact of the Board of Directors on Business Climate Change Management: Case of Brazilian Companies. Mitig. Adapt. Strateg. Glob. Chang. 2020, 25, 127–147. [Google Scholar] [CrossRef]
  18. Sheng, H.; Feng, T.; Liu, L. The Influence of Digital Transformation on Low-Carbon Operations Management Practices and Performance: Does CEO Ambivalence Matter? Int. J. Prod. Res. 2022, 1–15. [Google Scholar] [CrossRef]
  19. Li, G.; Yu, H.; Lu, M. Low-Carbon Collaboration in the Supply Chain under Digital Transformation: An Evolutionary Game-Theoretic Analysis. Processes 2022, 10, 1958. [Google Scholar] [CrossRef]
  20. Oster, E. Unobservable Selection and Coefficient Stability: Theory and Evidence. J. Bus. Econ. Stat. 2019, 37, 187–204. [Google Scholar] [CrossRef]
  21. Li, Y.; Yang, X.; Ran, Q.; Wu, H.; Irfan, M.; Ahmad, M. Energy Structure, Digital Economy, and Carbon Emissions: Evidence from China. Environ. Sci. Pollut. Res. 2021, 28, 64606–64629. [Google Scholar] [CrossRef] [PubMed]
  22. Zhang, W.; You, J.; Lin, W. Internet plus and China Industrial System’s Low-Carbon Development. Renew. Sustain. Energy Rev. 2021, 151, 111499. [Google Scholar] [CrossRef]
  23. Han, D.; Ding, Y.; Shi, Z.; He, Y. The Impact of Digital Economy on Total Factor Carbon Productivity: The Threshold Effect of Technology Accumulation. Environ. Sci. Pollut. Res. 2022, 29, 55691–55706. [Google Scholar] [CrossRef]
  24. Hao, Y.; Guo, Y.; Wu, H. The Role of Information and Communication Technology on Green Total Factor Energy Efficiency: Does Environmental Regulation Work? Bus. Strateg. Environ. 2022, 31, 403–424. [Google Scholar] [CrossRef]
  25. Moyer, J.D.; Hughes, B.B. ICTs: Do They Contribute to Increased Carbon Emissions? Technol. Forecast. Soc. Chang. 2012, 79, 919–931. [Google Scholar] [CrossRef]
  26. Belkhir, L.; Elmeligi, A. Assessing ICT Global Emissions Footprint: Trends to 2040 & Recommendations. J. Clean. Prod. 2018, 177, 448–463. [Google Scholar] [CrossRef]
  27. Anon Higon, D.; Gholami, R.; Shirazi, F. ICT and Environmental Sustainability: A Global Perspective. Telemat. Inform. 2017, 34, 85–95. [Google Scholar] [CrossRef]
  28. Chen, X.; Despeisse, M.; Johansson, B. Environmental Sustainability of Digitalization in Manufacturing: A Review. Sustainability 2020, 12, 10298. [Google Scholar] [CrossRef]
  29. Goralski, M.A.; Tan, T.K. Artificial Intelligence and Sustainable Development. Int. J. Manag. Educ. 2020, 18, 100330. [Google Scholar] [CrossRef]
  30. Xu, Q.; Zhong, M.; Li, X. How Does Digitalization Affect Energy? International Evidence. Energy Econ. 2022, 107, 105879. [Google Scholar] [CrossRef]
  31. Chen, C.-L.; Lin, Y.-C.; Chen, W.-H.; Chao, C.-F.; Pandia, H. Role of Government to Enhance Digital Transformation in Small Service Business. Sustainability 2021, 13, 1028. [Google Scholar] [CrossRef]
  32. Wu, B.; Liu, P.; Xu, X. An Evolutionary Analysis of Low-Carbon Strategies Based on the Government-Enterprise Game in the Complex Network Context. J. Clean. Prod. 2017, 141, 168–179. [Google Scholar] [CrossRef]
  33. Pan, X.; Xu, G.; Zhu, N. Spatial Peer Effect of Enterprises’ Digital Transformation: Empirical Evidence from Spatial Autoregressive Models. Sustainability 2022, 14, 12576. [Google Scholar] [CrossRef]
  34. Kretschmer, T.; Khashabi, P. Digital Transformation and Organization Design: An Integrated Approach. Calif. Manage. Rev. 2020, 62, 86–104. [Google Scholar] [CrossRef]
  35. Sirmon, D.G.; Hitt, M.A.; Ireland, R.D.; Gilbert, B.A. Resource Orchestration to Create Competitive Advantage: Breadth, Depth, and Life Cycle Effects. J. Manag. 2011, 37, 1390–1412. [Google Scholar] [CrossRef]
  36. Stein, J. Efficient Capital Markets, Inefficient Firms: A Model of Myopic Corporate Behavior. Q. J. Econ. 1989, 104, 655–669. [Google Scholar] [CrossRef]
  37. Faccio, M.; Marchica, M.-T.; Mura, R. CEO Gender, Corporate Risk-Taking, and the Efficiency of Capital Allocation. J. Corp. Financ. 2016, 39, 193–209. [Google Scholar] [CrossRef] [Green Version]
  38. Karampournioti, E.; Wiedmann, K.-P. Storytelling in Online Shops: The Impacts on Explicit and Implicit User Experience, Brand Perceptions and Behavioral Intention. Internet Res. 2022, 32, 228–259. [Google Scholar] [CrossRef]
  39. Jafari-Sadeghi, V.; Amoozad Mahdiraji, H.; Busso, D.; Yahiaoui, D. Towards Agility in International High-Tech SMEs: Exploring Key Drivers and Main Outcomes of Dynamic Capabilities. Technol. Forecast. Soc. Chang. 2022, 174, 121272. [Google Scholar] [CrossRef]
  40. Yang, G.; Wang, F.; Deng, F.; Xiang, X. Impact of Digital Transformation on Enterprise Carbon Intensity: The Moderating Role of Digital Information Resources. Int. J. Environ. Res. Public Health 2023, 20, 2178. [Google Scholar] [CrossRef]
  41. Cui, J.; Wang, C.; Zhang, J.; Zheng, Y. The Effectiveness of China’s Regional Carbon Market Pilots in Reducing Firm Emissions. Proc. Natl. Acad. Sci. USA 2021, 118, e2109912118. [Google Scholar] [CrossRef] [PubMed]
  42. Palia, D.; Lichtenberg, F. Managerial Ownership and Firm Performance: A Re-Examination Using Productivity Measurement. J. Corp. Financ. 1999, 5, 323–339. [Google Scholar] [CrossRef]
  43. Dong, X.-Y.; Putterman, L. Soft Budget Constraints, Social Burdens, and Labor Redundancy in China’s State Industry. J. Comp. Econ. 2003, 31, 110–133. [Google Scholar] [CrossRef]
  44. Megginson, W.L.; Netter, J.M. From State to Market: A Survey of Empirical Studies on Privatization. J. Econ. Lit. 2001, 39, 321–389. [Google Scholar] [CrossRef] [Green Version]
  45. Ben-Amar, W.; Chang, M.; McIlkenny, P. Board Gender Diversity and Corporate Response to Sustainability Initiatives: Evidence from the Carbon Disclosure Project. J. Bus. Ethics 2017, 142, 369–383. [Google Scholar] [CrossRef] [Green Version]
  46. Brochet, F.; Loumioti, M.; Serafeim, G. Speaking of the Short-Term: Disclosure Horizon and Managerial Myopia. Rev. Acc. Stud. 2015, 20, 1122–1163. [Google Scholar] [CrossRef]
  47. Singh, S.K.; Giudice, M.D.; Chierici, R.; Graziano, D. Green Innovation and Environmental Performance: The Role of Green Transformational Leadership and Green Human Resource Management. Technol. Forecast. Soc. Chang. 2020, 150, 119762. [Google Scholar] [CrossRef]
  48. Balli, H.O.; Sørensen, B.E. Interaction Effects in Econometrics. Empir. Econ. 2013, 45, 583–603. [Google Scholar] [CrossRef] [Green Version]
  49. Cohen, L.; Gurun, U.G.; Nguyen, Q.H. The ESG-Innovation Disconnect: Evidence from Green Patenting; NBER: Cambridge, MA, USA, 2022. [Google Scholar]
  50. Dantas, M. Are ESG Funds More Transparent? Available online: https://papers.ssrn.com/sol3/papers.cfm?abstract_id=3269939 (accessed on 30 January 2021).
  51. Cortes, G.S.; Gao, G.P.; Silva, F.B.G.; Song, Z. Unconventional Monetary Policy and Disaster Risk: Evidence from the Subprime and COVID–19 Crises. J. Int. Money Financ. 2022, 122, 102543. [Google Scholar] [CrossRef]
  52. Dedola, L.; Georgiadis, G.; Gräb, J.; Mehl, A. Does a Big Bazooka Matter? Quantitative Easing Policies and Exchange Rates. J. Monet. Econ. 2021, 117, 489–506. [Google Scholar] [CrossRef]
  53. Lee, C.-C.; Qin, S.; Li, Y. Does Industrial Robot Application Promote Green Technology Innovation in the Manufacturing Industry? Technol. Forecast. Soc. Chang. 2022, 183, 121893. [Google Scholar] [CrossRef]
  54. Xiang, X.; Yang, G.; Sun, H. The Impact of the Digital Economy on Low-Carbon, Inclusive Growth: Promoting or Restraining. Sustainability 2022, 14, 7187. [Google Scholar] [CrossRef]
  55. Dantas, M.M.; Merkley, K.J.; Silva, F.B.G. Government Guarantees and Banks’ Income Smoothing. J. Financ. Serv. Res. 2023, 63, 123–173. [Google Scholar] [CrossRef]
  56. He, G.; Ren, H.M.; Taffler, R. Do Corporate Insiders Trade on Future Stock Price Crash Risk? Rev. Quant. Financ. Acc. 2021, 56, 1561–1591. [Google Scholar] [CrossRef]
  57. Frank, K.A. Impact of a Confounding Variable on a Regression Coefficient. Sociol. Methods Res. 2000, 29, 147–194. [Google Scholar] [CrossRef]
  58. Xue, Y.; Jiang, C.; Guo, Y.; Liu, J.; Wu, H.; Hao, Y. Corporate Social Responsibility and High-Quality Development: Do Green Innovation, Environmental Investment and Corporate Governance Matter? Emerg. Mark. Financ. Trade 2022, 58, 3191–3214. [Google Scholar] [CrossRef]
  59. Xu, Q.; Zhong, M.; Cao, M. Does Digital Investment Affect Carbon Efficiency? Spatial Effect and Mechanism Discussion. Sci. Total Environ. 2022, 827, 154321. [Google Scholar] [CrossRef]
Figure 1. Research framework and processes. Oster (2019)—[20].
Sustainability 15 09417 g001
Figure 2. “Digital Transformation” Thesaurus.
Sustainability 15 09417 g002
Figure 3. “Environmental Awareness” Thesaurus.
Sustainability 15 09417 g003
Table 1. Variables description.
Variable TypeSymbolVariable NameExplanations
Dependent variablelnCarbonEffEnterprise carbon emission intensitySee Section 3.2.1
Independent variablelndigitalDigital transformationSee Section 3.2.2
Enterprise-level control variablesAssetTurnoverTotal asset turnover ratioSee Section 3.2.3
ManagerSharesManagerial shareholdingSee Section 3.2.3
lnEmpolyeeThe number of employeesLogarithmic value
SizeTotal assetLogarithmic value
dum_stateWhether a state-owned enterprisestate-owned/non-state-owned are 0
ROAReturn on assetsLogarithmic value
BPSBook value Per ShareLogarithmic value
City-level control variableslnGDPCity GDP as a logarithmSee Section 3.2.3
GDPC3Proportion of GPD of tertiary industry
Robustness Test VariableslnCO2Efficiency_wWinsorization of lnCarbonEffSee Section 4.4 for details
LnCO2Absolute value of carbon emission divided by the logarithm of the GDP
RobotRobot utilization in the industry
IVInstrumental Variable
Mechanism VariablesmyopiaIndicators derived from text analysisSee Section 4.4 for details
lgreenNumber of green patents
investThe amounts of green investments
awareEnvironmental awareness
Table 2. Descriptive statistical of variables.
VariableNMeanSDMinp50Max
lnCarbonEff62460.1030.4240.0000.0108.688
lndigital62460.4840.9300.0000.0005.481
AssetTurnover62460.6860.4740.0160.5897.602
ManagerShares62465.43712.1800.0000.00092.260
lnEmpolyee62467.5771.1831.9467.52413.200
Size624621.6801.17416.16021.52028.000
lnGDP624610.7400.4669.08510.84011.580
dum_state62460.3970.4890.0000.0001.000
GDPC3624644.09010.12029.70042.40079.650
ROA62460.0541.190−3.9940.039108.336
BPS62464.9132.931−2.8544.26248.434
myopia62460.0960.0780.0000.0810.618
lgreen62460.7841.9510.0000.51410.069
invest62463.5075.2430.0002.23723.119
aware62460.2450.3930.0000.1005.800
lnCO2Efficiency_w62460.0870.2570.0000.0101.853
LnCO262460.7670.2670.0000.8061.760
Robot62460.0020.0070.0000.0010.171
IV62465.7773.3620.0794.91414.061
Table 3. Baseline Estimation Tests.
VariableslnCarbonEff
(1)(2)(3)(4)(5)
lndigital−0.013 **−0.017 **−0.018 ***−0.018 ***−0.018 ***
(−1.98)(−2.45)(−2.69)(−2.72)(−2.78)
AssetTurnover−0.083 ***−0.082 **−0.087 **−0.086 **−0.078 **
(−2.67)(−2.22)(−2.16)(−2.13)(−1.83)
ManagerShares −0.001−0.001−0.001−0.001
(−0.49)(−0.45)(−0.48)(−0.42)
lnEmpolyee 0.0250.0260.025
(1.50)(1.52)(1.45)
Size −0.009−0.008−0.005
(−0.36)(−0.34)(−0.21)
lnGDP −0.065−0.065−0.109
(−0.63)(−0.63)(−0.93)
dum_state −0.104−0.108
(−1.24)(−1.28)
GDPC3 −0.004
(−0.68)
ROA −0.123
(−0.68)
BPS −0.001
(−0.06)
Constant0.160 ***0.160 ***0.8560.8861.465
(6.92)(5.71)(0.73)(0.76)(1.07)
Year FEYesYesYesYesYes
Enterprise FEYesYesYesYesYes
City FEYesYesYesYesYes
Obs62466246624662466246
R-squared0.3430.3500.3510.3510.351
Note: robust standard errors are clustered at the enterprise level. FE: fixed effects. *** Significant at the 1 percent level. ** Significant at the 5 percent level.
Table 4. Three Approaches for Robustness Testing.
Dependent Variable ReplacementIndependent Variable ReplacementWinsorized Estimation
(1)(2)(3)
LnCO2lnCarbonEfflnCO2Efficiency_w
lndigital−0.043 *** −0.010 **
(−11.16) (−2.04)
Robot −1.929 *
(−1.86)
ControlsYesYesYes
Constant1.404 ***−0.017−0.127
(3.25)(−0.12)(−0.18)
Year FENoYesYes
Enterprise FEYesYesYes
City FEYesYesYes
Obs659553286246
R-squared0.2990.3380.392
Note: t statistics in parentheses * p < 0.1, ** p < 0.05, *** p < 0.01 Controls: control variables, including AssetTurnover. ManagerShares, lnEmpolyee, Size, dum_state.
Table 5. IV (2SLS) Estimation.
First-StageSecond-Stage
lndigitallnCarbonEff
IV0.010 ***
(9.65)
lndigital −0.149 ***
(−3.6)
ControlsYesYes
Constant1.404 ***−0.017
(3.25)(−0.12)
Year FEYesYes
Enterprise FEYesYes
Obs57875787
Cragg–Donald Wald F statistic227.33
Kleibergen–Paap Wald rk F statistic93.10
Stock–Yogo weak ID test critical values10% maximal IV size16.38
15% maximal IV size8.96
20% maximal IV size6.66
Note: t statistics in parentheses (first-stage), z statistics in parentheses (second-stage) *** p < 0.01 Controls: control variables, including AssetTurnover. ManagerShares, lnEmpolyee, Size, dum_state.
Table 6. The Oster (2019) [20] Test.
SimplifiedWith Controls R m a x 2 Bounding Value
outcome β ˙ R ˙ 2 β ~ R ~ 2 π = 1.3 β *
coefficient−0.01310.1473−0.01820.35130.4567−0.0192
Table 7. Impact Threshold for a Confounding Variable.
(1)(2)(3)(4)(5)(6)(7)(8)
ITCVITCV Implied Correlations ρ (x, AssetTurnover) ρ (x,lnCarbonEff) I m p a c t r a w ρ (x, AssetTurnover|z) ρ (x,lnCarbonEff|z) I m p a c t
AssetTurnover0.00720.0955
ManagerShares −0.1105−0.05950.0066−0.04270.0110.0005
lnEmpolyee 0.26810.05890.01580.2508−0.0152−0.0038
Size −0.124−0.0785−0.0097−0.11460.0508−0.0058
lnGDP −0.0433−0.0852−0.00370.0366−0.0286−0.001
dum_state 0.1192−0.0879−0.01050.06430.03140.002
GDPC3 −0.0448−0.07370.0033−0.0298−0.03060.0009
ROA 0.0957−0.042−0.0040.1334−0.018−0.0024
BPS −0.0838−0.02840.0024−0.0878−0.02360.0021
Notes: This table reports the impact of possible correlated omitted variables for the test of the association between digital transformation on enterprises carbon emission intensity.
Table 8. Heterogeneity Analysis.
Variables(1)(2)(3)(4)(5)(6)
Carbon Trading Pilot CitiesIndustryPeer Effect
YesNoHeavyLightYesNo
lndigital−0.014 *−0.026 **−0.023 **−0.008−0.019 **−0.035
(−1.75)(−2.30)(−2.17)(−0.99)(−2.56)(−1.04)
ControlsYesYesYesYesYesYes
Constant1.561−0.0201.4301.4341.53925.916 *
(0.81)(−0.01)(1.10)(1.10)(1.14)(1.76)
Year FEYesYesYesYesYesYes
Enterprise FEYesYesYesYesYesYes
Obs31383104369624075733262
R-squared0.3390.3200.3280.0920.3150.133
Note: t statistics in parentheses, * p < 0.1, ** p < 0.05, Controls: control variables, including AssetTurnover. ManagerShares, lnEmpolyee, Size, lnGDP, dum_state and GDPC3.
Table 9. Mechanism Test Results.
(1)(2)(3)(4)(5)
lnCarbonEfflnCarbonEfflnCarbonEfflnCarbonEfflnCarbonEff
lndigital−0.018 ***
(−2.81)
Lndigital#myopia 0.123 *
(1.70)
Lndigital#lgreen −0.004 *
(−1.73)
lndigital#invest −0.002 **
(−2.27)
Lndigital#Aware −0.030 *
(−1.94)
ControlsYesYesYesYesYes
Constant1.4762.902 **1.3711.0640.178 ***
(1.09)(2.03)(1.48)(1.14)(3.93)
Year FEYesYesYesYesYes
Enterprise FEYesYesYesYesYes
City FEYesYesYesYesYes
Obs62466226618962375560
R-squared0.1300.1460.1380.1360.140
Note: t statistics in parentheses, * p < 0.1, ** p < 0.05, *** p < 0.01. The symbol # represents the interaction between variables.
Table 10. Research Hypotheses and Validation Status.
HypothesesValidation Status
H1Supported
H2Supported
H3Supported
H4Supported
H5Supported
Disclaimer/Publisher’s Note: The statements, opinions and data contained in all publications are solely those of the individual author(s) and contributor(s) and not of MDPI and/or the editor(s). MDPI and/or the editor(s) disclaim responsibility for any injury to people or property resulting from any ideas, methods, instructions or products referred to in the content.

