Article

Impacts of Green Energy Expansion and Gas Import Reduction on South Korea’s Economic Growth: A System Dynamics Approach

1
Institute of Cleaner Production Technology, Pukyong National University, Busan 48547, Republic of Korea
2
Department of Economic and Administrative Sciences, Ferdowsi University of Mashhad, Mashhad 9177948978, Iran
3
Department of Chemical Engineering, Pukyong National University, Busan 48547, Republic of Korea
*
Author to whom correspondence should be addressed.
Sustainability 2023, 15(12), 9281; https://doi.org/10.3390/su15129281
Submission received: 10 May 2023 / Revised: 26 May 2023 / Accepted: 5 June 2023 / Published: 8 June 2023
(This article belongs to the Special Issue Energy Transitions and Green Finance towards Sustainability)

Abstract

:
South Korea, ranking ninth among the largest energy consumers and seventh in carbon dioxide emissions from 2016 to 2021, faces challenges in energy security and climate change mitigation. The primary challenge lies in transitioning from fossil fuel dependency to a more sustainable and diversified energy portfolio while meeting the growing energy demand for continued economic growth. This necessitates fostering innovation and investment in the green energy sector. This study examines the potential impact of green energy expansion (through integrating renewable energy and hydrogen production) and gas import reduction on South Korea’s economic growth using a system dynamics approach. The findings indicate that increasing investment in green energy can result in significant growth rates ranging from 7% to 35% between 2025 and 2040. Under the expansion, renewable energy scenario (A) suggests steady but sustainable economic growth in the long term, while the gas import reduction scenario (B) displays a potential for rapid economic growth in the short term with possible instability in the long term. The total production in Scenario B is USD 2.7 trillion in 2025 and will increase to USD 4.8 trillion by 2040. Scenario C, which combines the effects of both Scenarios A and B, results in consistently high economic growth rates over time and a substantial increase in total production by 2035–2040, from 20% to 46%. These findings are critical for policymakers in South Korea as they strive for sustainable economic growth and transition to renewable energy.

1. Introduction

Energy plays a crucial role in driving economic and social development, contributing to the improvement of a nation’s economy [1]. However, the reliance on traditional fossil fuels such as coal, natural gas, and oil for economic growth has resulted in substantial CO2 emissions and environmental challenges, posing pressing issues for many countries [2]. South Korea serves as a relevant case study, ranking ninth among the largest energy consumers and seventh in carbon dioxide emissions between 2016 and 2021 [3]. Importing 90% of its energy has affected the country’s energy security and economic development, magnifying the challenges of growing energy demand, energy security, and environmental concerns [4]. Consequently, South Korea faces the task of transitioning to a sustainable and diversified energy portfolio while satisfying the growing energy demand for sustained economic growth. To address these challenges, investing in the green energy sector to foster innovation and reduce dependence on fossil fuels is crucial [5,6]. Therefore, understanding the impacts of green energy expansion and the reduction of fossil fuel imports on economic growth holds immense significance.
By shifting towards renewable sources, including solar, wind, and geothermal power, South Korea can stimulate economic growth through investments in the green energy sector [7] while also enhancing energy security and reducing dependence on costly fossil fuel imports [8]. Additionally, South Korea has set ambitious targets for hydrogen production and aims to increase its clean power generation capacity [9,10]. This transition to a sustainable energy portfolio not only aligns with global efforts to combat climate change but also offers long-term environmental benefits, such as lower environmental impact, reduced emissions, and increased energy efficiency [11,12]. The main focus of this paper is to understand how the expansion of the green energy portfolio and the reduction of fossil fuel imports can impact economic growth in South Korea. By comprehending the mechanisms behind this relationship, policymakers and researchers can make informed decisions and shape a more sustainable and secure energy future.
Some scholars have studied the causal relationship between green energy and economic development. Researchers have studied the causal relationship between clean energy and economic development, with several studies confirming the bidirectional causality between the two. Some studies have also focused on whether clean energy can promote economic development, with findings indicating that renewable energy consumption significantly promotes economic growth. Yang (2000) [13] investigated the interdependent relationship between economic development and clean energy expansion in Taiwan from 1954 to 1997. The empirical results of Yang’s study confirm the existence of a bidirectional causality between clean energy and economic development, indicating that the two factors are mutually reinforcing. Another study [14] examines the impact of clean energy on Gross Domestic Production (GDP) by analyzing data from countries around the world. The authors’ findings reveal a significant positive correlation between the expansion of clean energy and an increase in GDP. Ma and Chen (2010) [15] demonstrates that China’s rapid economic growth leads to a substantial increase in energy demand, including hydrogen energy. They found that the total hydrogen demand in various scenarios ranged from 70.5376 million tons of coal equivalent (Mtce) to 25.110 Mtce, with a relatively small change in economic growth rate (15.3–30.3%) resulting in a significant change in total hydrogen demand scale (up to 180%) from 2015 to 2050. Mahmoodi and Mahmoodi (2011) [16] analyzes the link between the use of clean energy and economic growth by examining the panel data of seven Asian countries. Their findings suggest that renewable energy consumption plays a significant role in promoting economic growth in most Asian countries. According to [17], the integration of renewable energy into electricity generation requires coordination with other sectors, such as energy conservation and efficiency improvements, which can help economic growth. Nyambuu & Semmler (2020) [18] have developed a dynamic growth model that aligns with [19] findings. Their proposed model integrates both clean energy and traditional energy sources, and the results indicate that clean energy can effectively address climate change while promoting economic growth. According to [20], the application of renewable energy (RE) and hydrogen systems is an essential component of a sustainable energy system and economic development, which is conducted using a multi-energy microgrid that is mentioned in another study [21]. Zhu et al., (2020) [22] proposed that incorporating renewable energy sources into the energy mix can help maintain energy supply security by mitigating the risk of market disruptions and economic losses. This idea is comparable to the findings of [23], who studied the impact of renewable energy sources on gas and electricity networks and suggested that using RE as an alternative source to diversify the energy mix plays a crucial role in ensuring energy supply security by reducing the risk of market disruptions and economic depreciation. There is a large number of existing studies have also reviewed and assessed the effectiveness of green energy expansion for economic growth [24,25,26].
Existing research has explored the relationship between green energy and economic growth, mainly focusing on the consumption aspect of renewable energy. However, there is a lack of studies examining the impact of renewable energy production on economic growth. Furthermore, no specific research has investigated the integration of hydrogen and renewable energy production and its effects on economic growth. This topic is particularly important for South Korea, as the country has set ambitious goals to become a leading hydrogen producer by 2040 [27]. Additionally, there is limited research available on the application of system dynamics, a method that analyzes the feedback between variables over time, to examine the relationship between hydrogen integration, renewable energy expansion, and economic growth. Therefore, this paper aims to fill these gaps by studying how the expansion of green energy influences economic growth in South Korea from 2022 to 2040.
According to the significance of investigating the impacts of green energy expansion and fossil fuel import reduction on economic growth, this article focuses on three distinct scenarios, which are posed as questions as follows:
  • How would the 20% growth rate in renewable energy production affect economic growth?
  • What are the potential economic consequences of a 20% reduction in gas imports due to gas price shocks?
  • If gas imports are reduced by 20% per year, and the growth rate of renewable energy production is increased by 20%, what effects can be expected in terms of economic growth?
In order to investigate the questions above, a behavior model based on the system dynamics approach (SD) is proposed to assess the effectiveness of various policy scenarios. The most remarkable advantage provided by the SD technique is the ability to efficiently capture the complex structure of real systems under a holistic overview. Moreover, the SD approach is user-friendly, enabling modelers who are not familiar with mathematical models to represent their problems easily. One of the main challenges in energy policy is the complexity of the environment in which policies are implemented. This complexity can lead to feedback that undermines policy measures, which can be modeled using system dynamics. Another key feature is the importance of system dynamics associated with implementing policies that prove to be incorrect [28]. By comprehending the mechanisms behind the relationship between green energy expansion, fossil fuel import reduction, and economic growth, policymakers and researchers can make informed decisions and shape a more sustainable and secure energy future.
For the reminder, Section 2 describes the methodology we used to build the simulation in Section 3. Section 3 shows the results and discussion of the simulation for different established scenarios. Finally, Section 4 draws the conclusions of this study.

2. Methods

2.1. Methodology Description

This study presents an approach to analyze how the expansion of green energy influences economic growth using the SD method. SD is a system modeling and dynamics simulator developed by Professor Jay W. Forrester [29] in the 1950s at the Massachusetts Institute of Technology. It is useful for exploring complex systems and analyzing dynamic feedback mechanisms, where changes in one component of the system affect the overall behavior. Figure 1 illustrates the typical steps involved in modeling system dynamics, which include structural analysis, model development, model validation, and scenario development [30]. The process of system structure analysis forms the foundation for constructing the model, while the model development phase entails creating dynamic equations by integrating variables into the entire system based on the system architecture. The aim of model validation is to verify the accuracy of historical and simulation data and to test the sensitivity of variables to changes, thus establishing the validity of the model. In the scenario development section, different policy scenarios are assessed by modifying critical variables to evaluate whether the changes in the relevant variables have produced the desired outcomes. Through continuous modifications, decision-makers can obtain valuable information to facilitate decision-making [31].

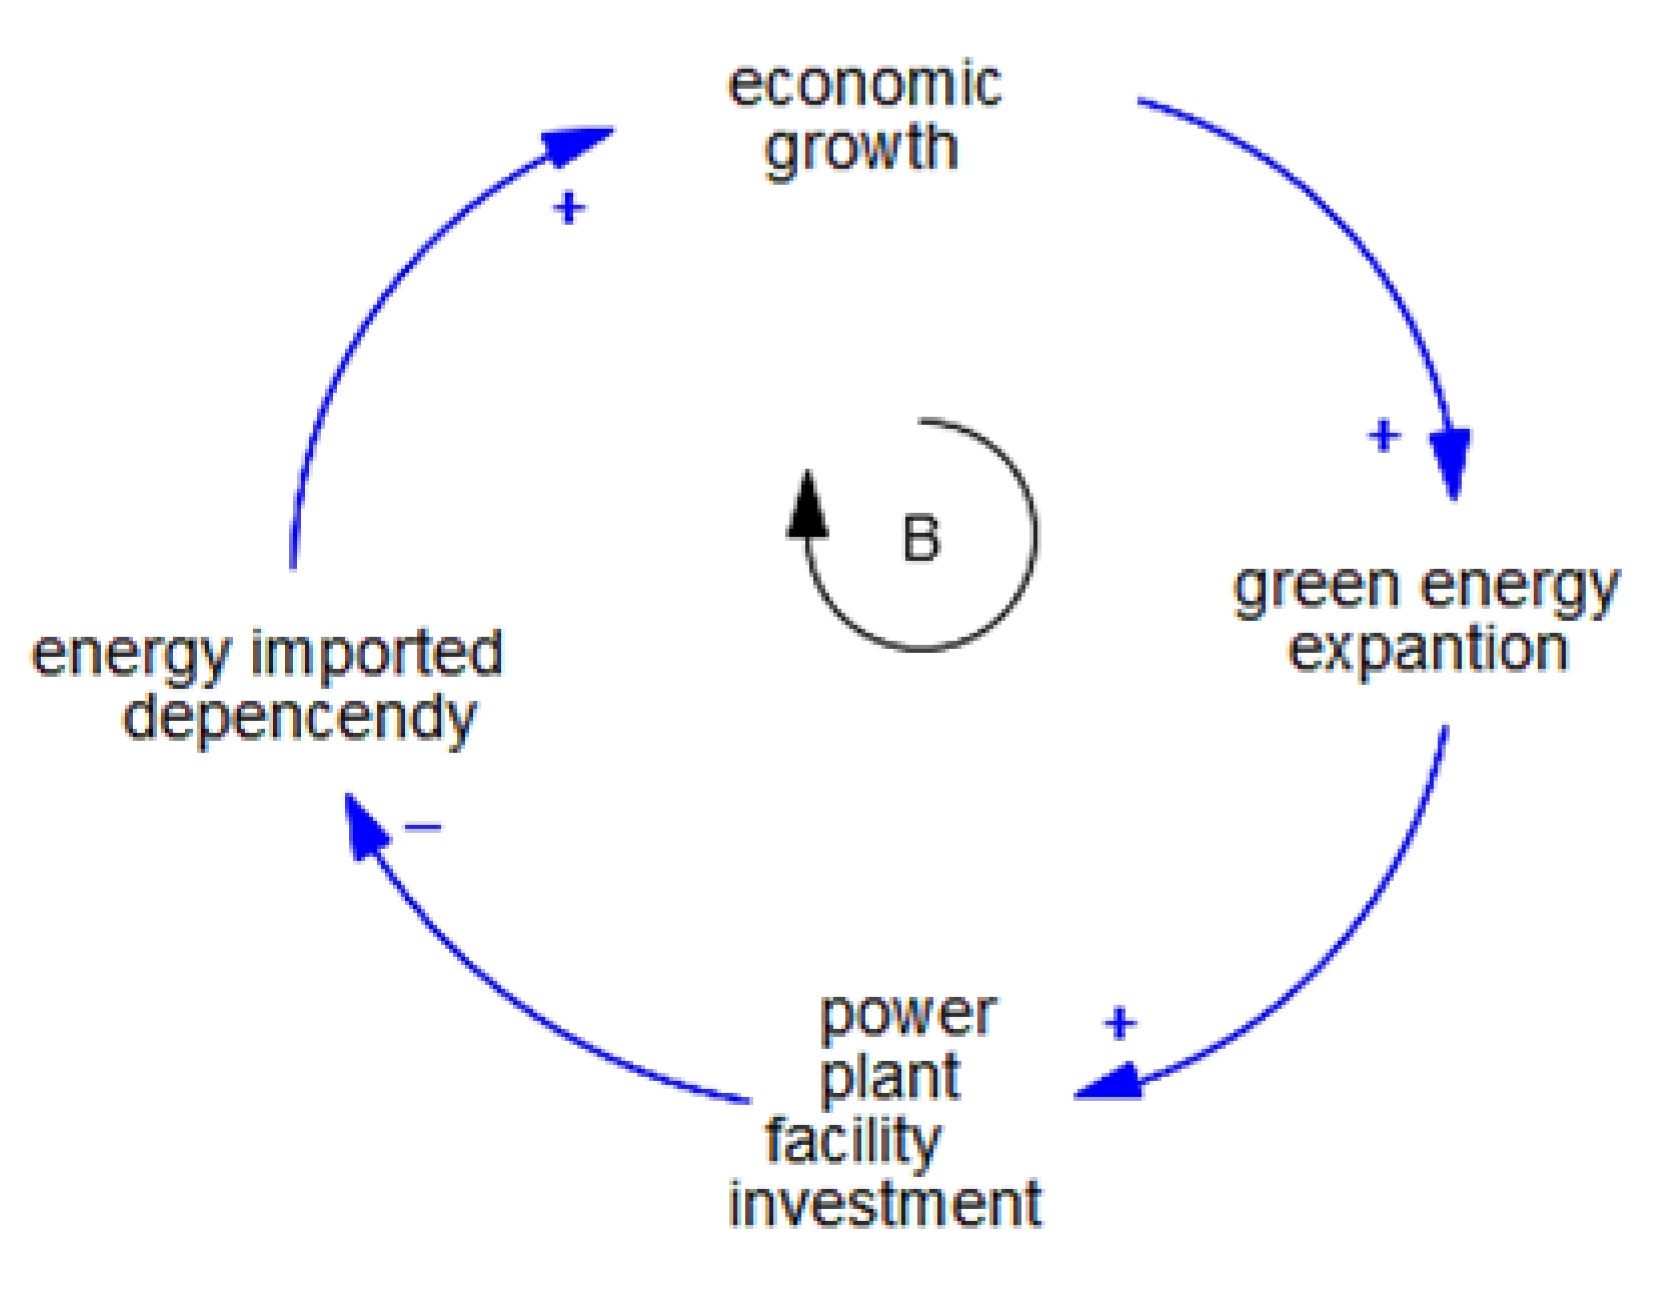
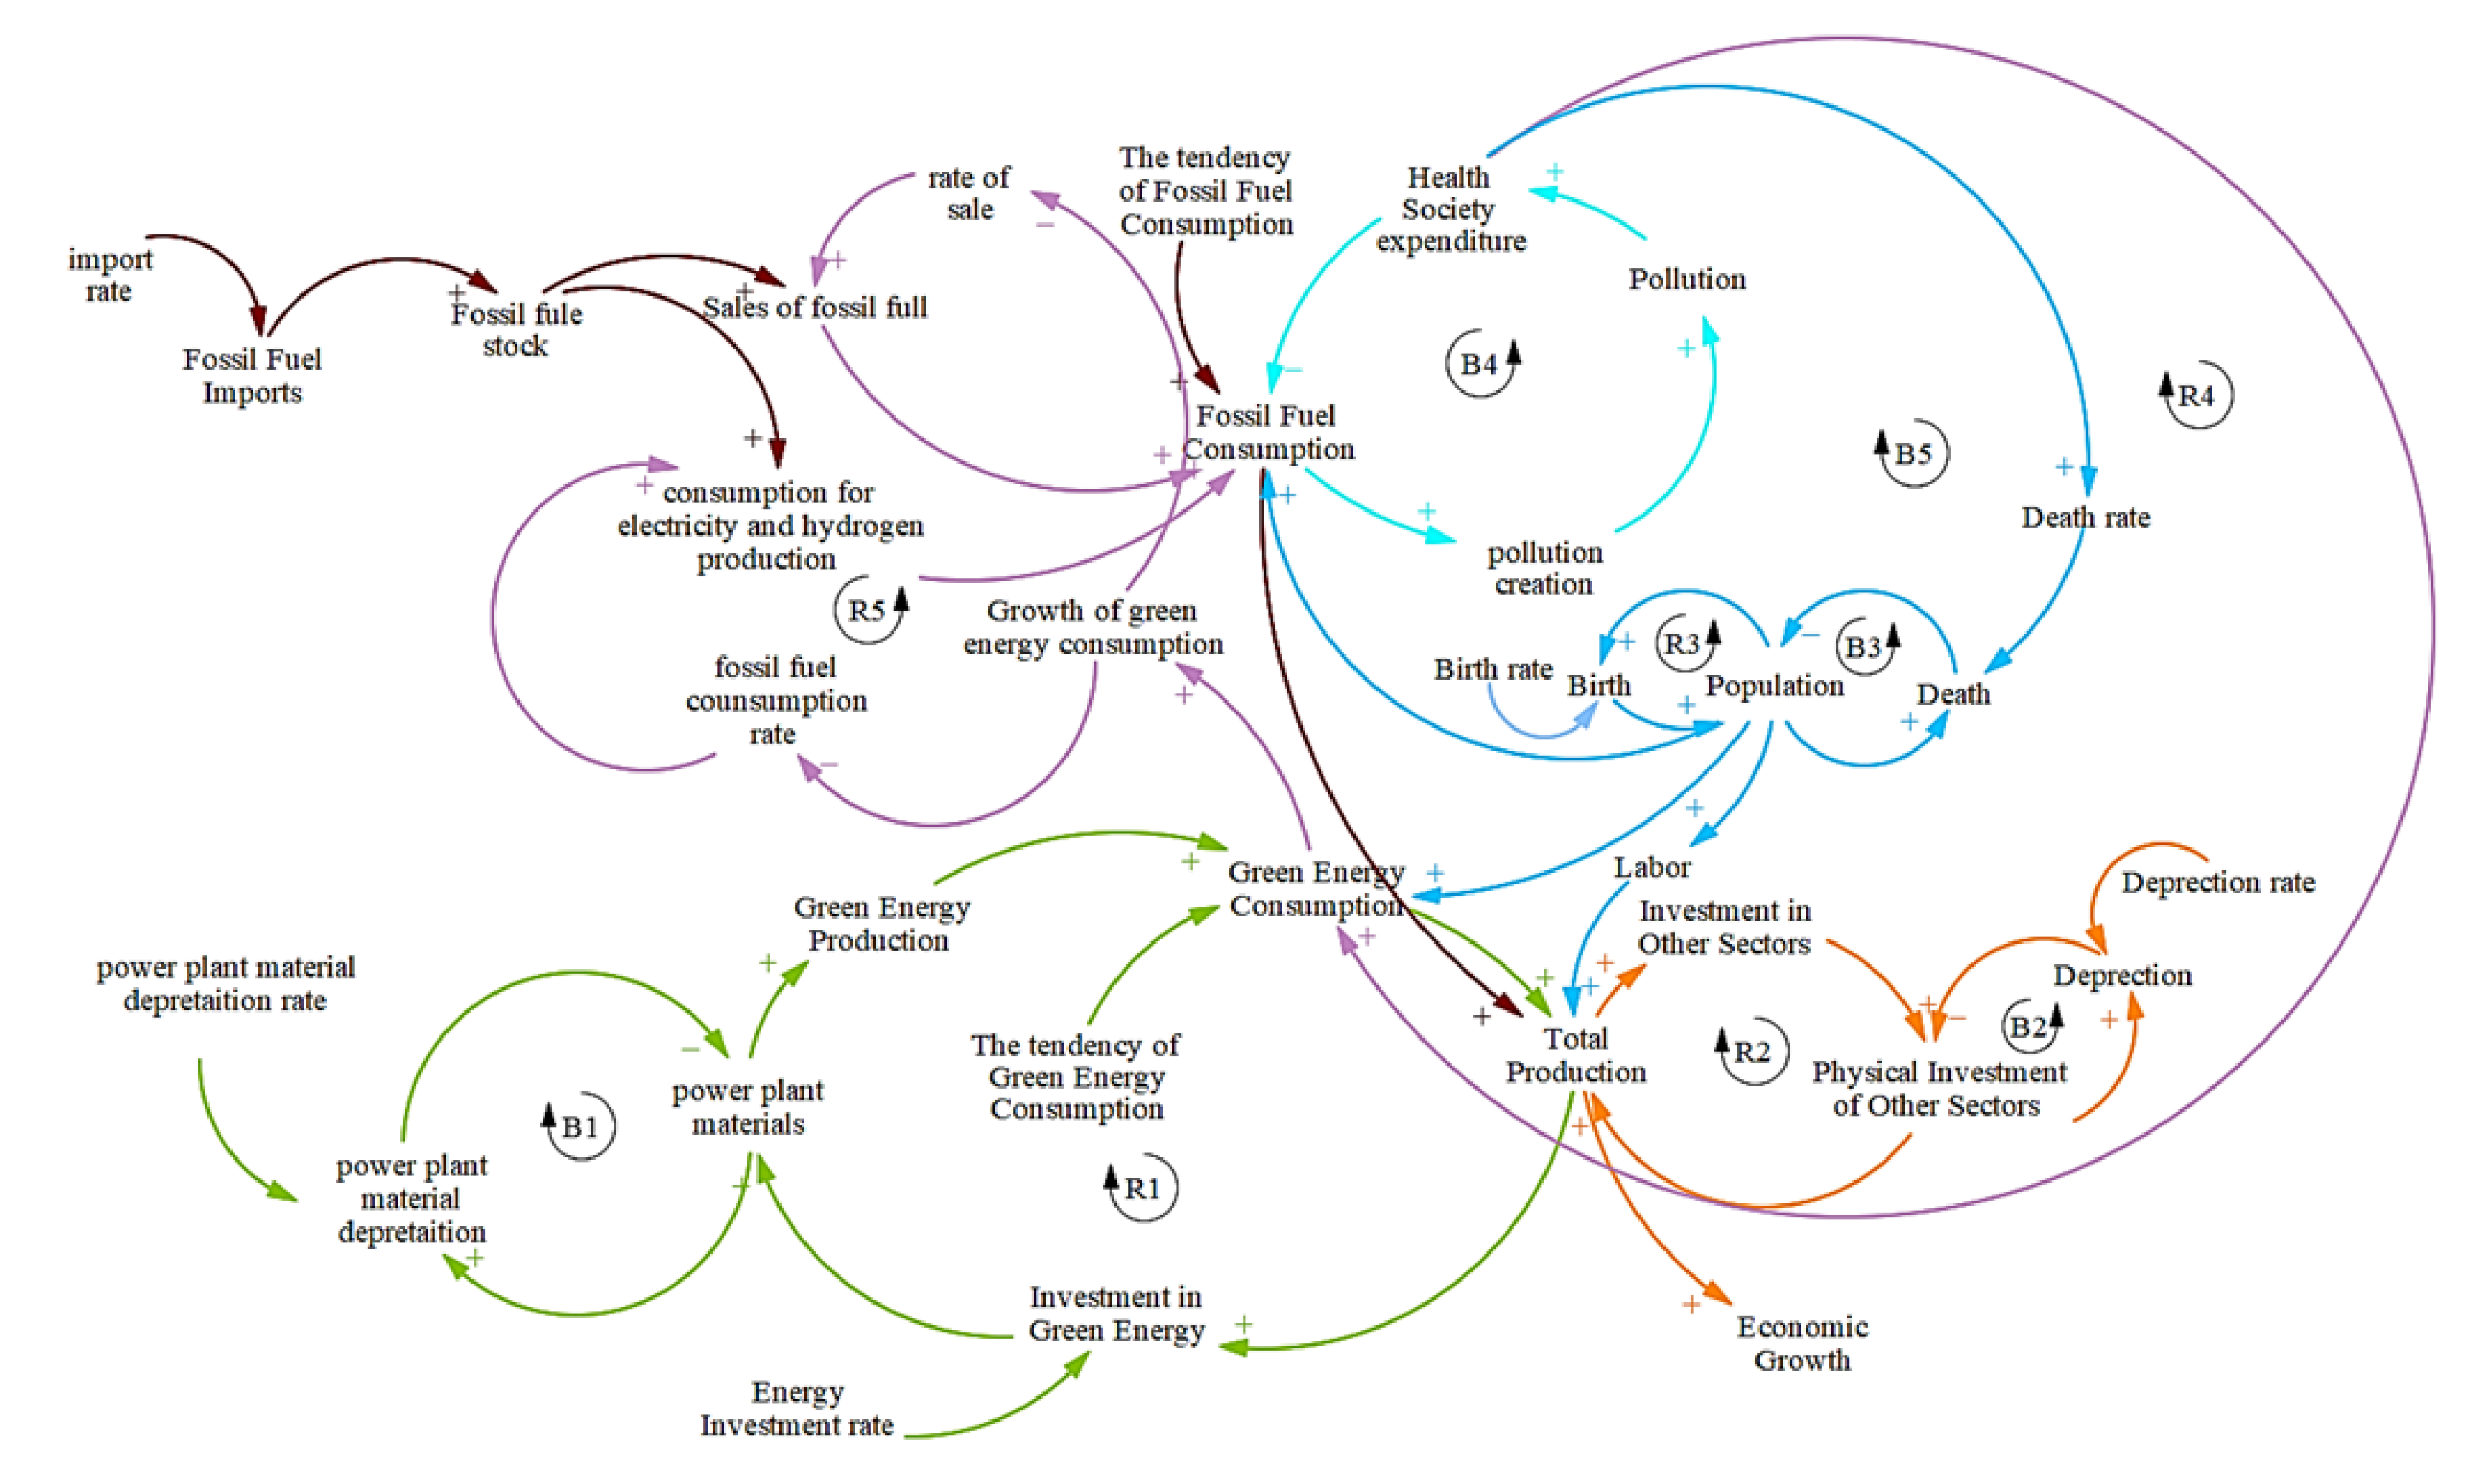
2.2. Causal Loop Diagrams Analysis

Figure 2 displays a causal loop diagram (CLD), the fundamental structure of the feedback relationship between the expansion of green energy and economic growth. In practice, some studies have shown that increasing investment in renewable energy can lead to the development of new power plants and infrastructure, which in turn can increase the overall capacity and reliability of a country’s energy system [12]. This can reduce the need for energy imports and improve energy security [32]. Additionally, the growth of the renewable energy sector can create new job opportunities and stimulate economic growth [33]. As a result, previous studies have demonstrated that renewable energy has a positive impact on economic growth. This feedback relationship generates both positive and negative feedback effects. In this study, the SD approach is utilized to model how investing in green energy affects economic growth. To validate the findings, a simulation system is created using Vensim simulation software. The data from 2010 to 2021 is analyzed, and the sustainable development process is simulated from 2022 to 2040.
Since the SD method is well-suited for analyzing complex feedback systems, it is important to consider the specific context and factors at play when evaluating the impact of renewable energy production on power plant facilities, energy imports, and economic growth. Figure 2 shows the CLD to describe the SD model of green energy and economic growth. Positive signs indicate that increasing the independent variable leads to an increase in the dependent variable and vice versa [34]. Fifth balancing (B) feedback loops are seen in Figure 3. A balancing loop would indicate that changes in one variable led to changes in another variable that tend to counteract the initial change. Loop one (B1) is described in [35] and shows the relationship between green power plant materials and material depreciation, which is important for the efficiency and cost-effectiveness of green energy production. According to the above study, power plant materials, such as solar panels, wind turbines, and batteries for hydrogen storage, can depreciate over time due to factors such as wear and tear, environmental exposure, and changes in technology. This can result in increased costs and decreased profitability for green energy producers. To mitigate the effects of material depreciation, power plant operators should monitor the condition of their materials, schedule regular maintenance and repairs, and invest in high-quality materials. By managing material depreciation effectively, green energy production, including hydrogen and renewables, can remain sustainable over the long term. The second loop (B2) is discussed based on [36]. Similarly, in the case of fossil fuel energy, physical investment involves the purchase and installation of equipment used to extract and process fossil fuels, such as oil rigs or refineries. As this equipment ages and becomes less efficient, it experiences depreciation, leading to a decrease in the productive capacity of the fossil fuel energy system. To maintain the productive capacity, new equipment needs to be installed to replace the depreciated equipment. However, unlike green energy, the use of fossil fuels leads to environmental degradation, including air pollution and the emission of greenhouse gases. This has led to an increasing interest in shifting towards renewable energy sources and hydrogen energy, which are cleaner and more sustainable. According to the World Health Organization [37], air pollution from fossil fuels is responsible for an estimated 90% of premature deaths each year in South Korea, which shows the effects in loops B3 and B4. The impacts of fossil fuel consumption on the health of society are shown in loop B5. This loop describes a vicious cycle where increased fossil fuel consumption can lead to negative health outcomes, which in turn can lead to increased healthcare expenditures and ultimately result in a need for less economic growth.
A reinforcing loop (R) also can create exponential growth or decline in a system, depending on the direction of the initial change. Loop R1 described the relationship between green energy consumption and production. Increased green energy consumption leads to greater demand for green energy production, which in turn requires investment in green energy infrastructure and power plant materials to support the expansion of capacity. This investment can help to drive down the costs of green energy production, which can further increase consumption as more customers are able to afford it [38]. The relationship between physical investment in other sectors and total production can be modeled in loop R2, as changes in physical investment can have both direct and indirect effects on total production. Physical investment in other sectors can lead to increased productivity and efficiency, which can drive down costs and increase output. This increased output can, in turn, generate higher revenues, which can be reinvested in physical capital, further boosting production. Additionally, higher levels of physical investment in other sectors can stimulate demand for goods and services from other sectors, leading to further increases in total production. R3 and R4 loops show the impacts of fossil fuel consumption on population and health society expenditure. The R5 loop, according to [39], discusses the use of renewable energy sources for hydrogen production as a potential way to reduce reliance on fossil fuels and promote sustainable energy practices. In this paper, we assumed green hydrogen production, as specified in the last part of the model structure. Taking the country of Korea as a case study, using system dynamics (SD) to conduct the policy simulation analysis is effective as SD can well reflect the dynamic evolution of green energy and economic growth under different policy scenarios. In addition, the accuracy of system dynamics description and simulation can be guaranteed as long as the variables in the model are estimated within a reasonable range.

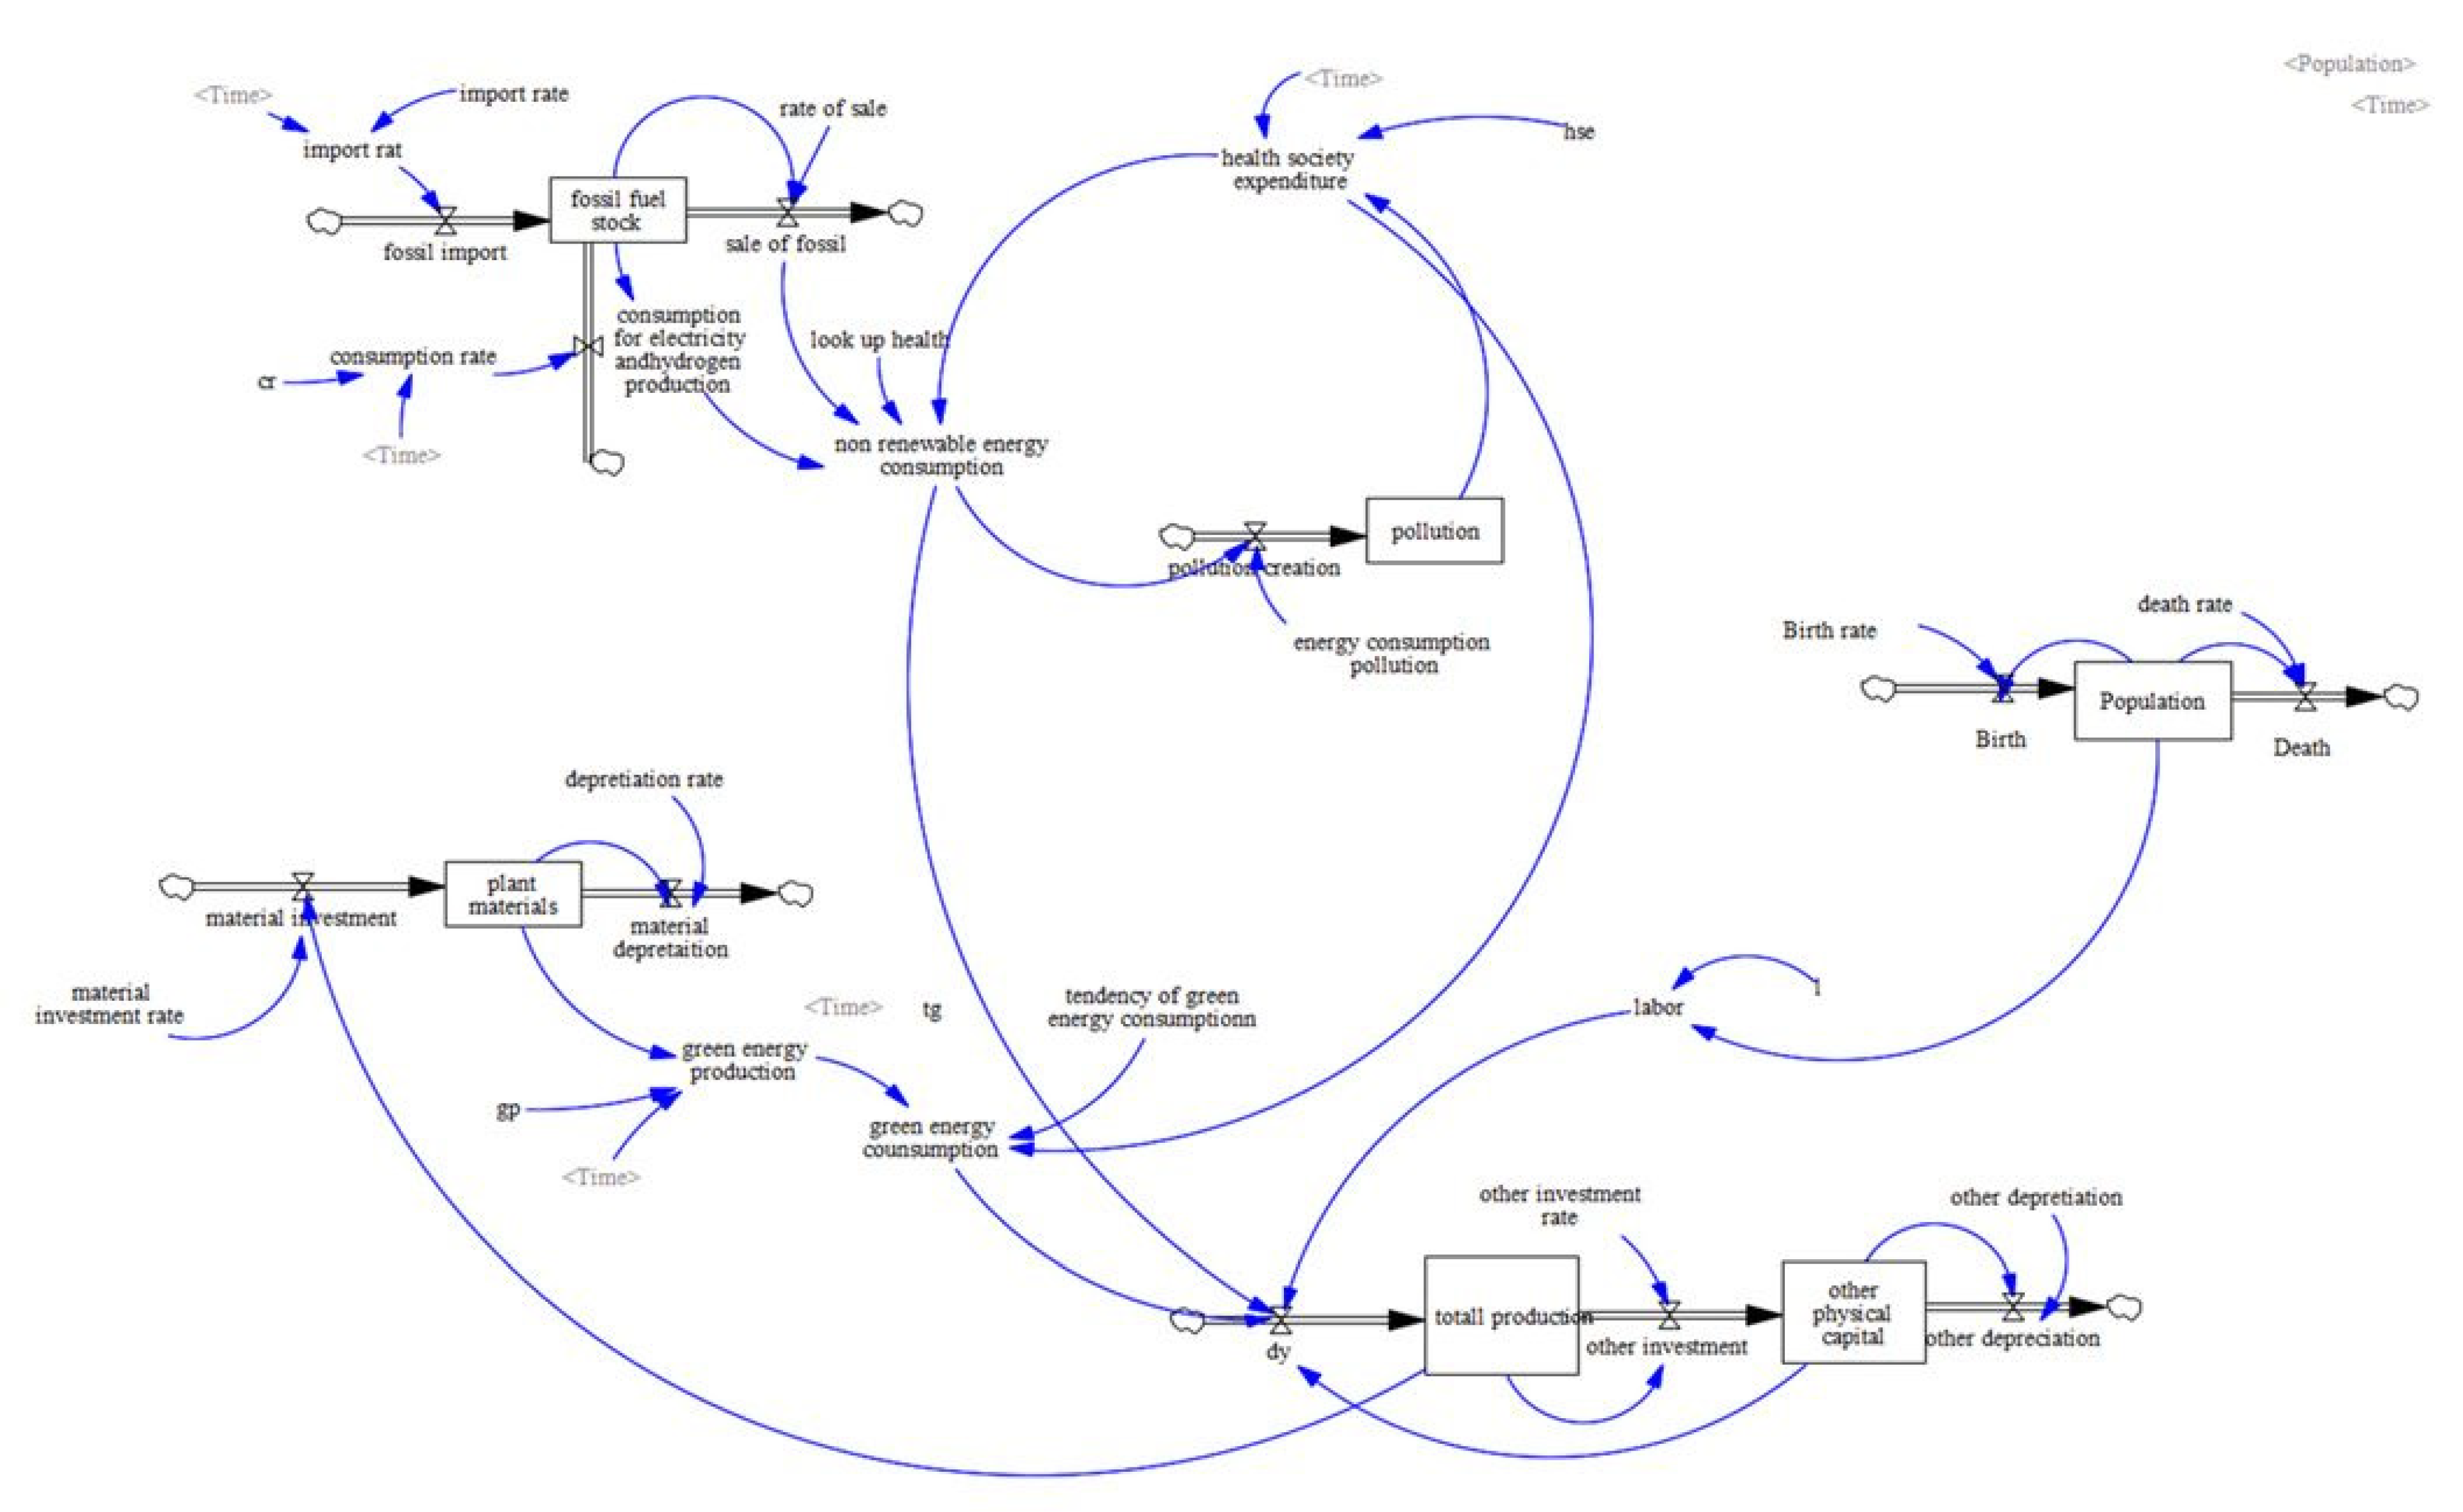
2.2.1. The Stock-Flow Model

The causal relationship depicted in Figure 3 was used to quantify the relationship between variables, and a stock-flow model of green energy and hydrogen production was established under different policies, as illustrated in Figure 4. The stock-flow diagram presented here provides a visual representation of the complex relationship between renewable energy production, economic growth, and environmental impact. It highlights the key variables involved in this relationship and how they interact with each other over time.
The renewable energy stock, which represents the amount of renewable energy available for use and produces hydrogen, is an important driver of economic growth. As the stock of renewable energy increases, businesses and industries can become more efficient and cost-effective, leading to economic growth. Additionally, the use of renewable energy can reduce the cost of energy and make it more affordable, further stimulating economic growth.
At the same time, the use of renewable energy can help reduce CO2 emissions, which are a byproduct of energy production and use. As the use of renewable energy increases, there can be a reduction in CO2 emissions, which can have a positive impact on the environment and human health. This reduction in CO2 emissions can also lead to more sustainable economic growth.

2.2.2. Model Structure and Assumptions

Economic growth and renewable energy production function
In this paper, the correlation between renewable energy production and economic growth is investigated using a conventional neo-classical one-sector production technology framework proposed by [25]. The production function, represented by Equation (1), is defined as a function of labor, capital, and renewable energy, where Y represents economic output, L represents the labor force, K represents capital stock, and R represents renewable energy.
Y = f L , K , R
We employed a Cobb–Douglas production function based on [40] approach to determine the impact factor on the correlation between GDP, capital, labor, and renewable energy. Data from 2010 to 2021 was used, and an econometric model was created using data from the Korean Statistical Information Systems and estimated in EViews software. The Cobb–Douglas production function used in our study is represented by Equation (2). In this equation, Y represents economic output (GDP), while K , L , R , and F denote the factors of capital, labor, renewable energy, and other unaccounted factors, respectively. The coefficients α, β, σ and γ are constants that reflect the sensitivity of output to each input factor. Regarding the incorporation of renewable energy, we treated it as an additional input factor in the production function. In our analysis, renewable energy ( R ) is considered an exogenous factor, representing an external input to the production process. By including renewable energy as a separate factor, we aimed to investigate its distinct impact on economic output ( Y ) alongside the traditional factors of capital ( K ) and labor ( L ).
Y = K L β R σ F γ
The resulting impact factor is represented by Equation (2), where α, β, σ, and γ are constants with values of 0.0000646, 0.000947, 0.001318, and 0.0000651, respectively, which indicate the sensitivity of output to each input. For example, α indicates that a 1% increase in the physical capital ( K ) leads to a 0.00646% increase in economic output ( Y ), assuming other inputs remain constant.
Renewable energy production and fossil fuel consumption
In this paper, we used a function that incorporates renewable energy production scenarios and fossil energy consumption in 2021, represented by Equation (3), according to [41]. Equation (3) includes scenarios for renewable energy production ( R ) based on different levels of average production ( Y ¯ ), as well as total energy consumption in 2020 ( E ).
R = δ × Y ¯ + E
According to this study, we supposed that a 10% increase in renewable energy production in 2020, assuming constant energy demand, would result in a 2.6% reduction in fossil fuel consumption in 2021. Thus, to achieve zero fossil fuel consumption by 2040, renewable energy production should increase 6 to 8 times, assuming energy demand remains constant. Alternatively, renewable energy production should increase by 50% compared to the demand level in 2020.
The relationship between gas price and renewable energy consumption
The study [42] examined the relationship between gas prices and renewable energy consumption. The findings suggest that a 10% increase in the price of fossil fuels, specifically gas, does not have an immediate effect on renewable energy consumption. However, in the long run, there is an anticipated 0.085% increase in renewable energy consumption. Equation (4) represents the statistical model employed in the study, which incorporates various factors such as previous levels of renewable energy consumption (ren), GDP, carbon emissions (carbon), foreign direct investment (fdi), and economic policy uncertainty (ECT).
( r e n ) t = α 0 + β 0 r e n t 1 + γ 1 f o s s t + β 1 f o s s t 1 + γ 2 p a t e n t t + β 2 p a t e n t t 1 + γ 3 g d p t 1 + γ 4 c a r b o n t + β 4 c a r b o n t 1 + γ 5 f d i t 1 + δ E C T t 1 + ε t
In order to examine the effects of increasing gas prices on both renewable energy consumption and total production in South Korea’s economy, we hypothesize that a rise in gas prices will lead to an increase in renewable energy consumption. Hence, gas price is selected as a scenario to assess the impact of changing gas prices on total production.
Economic growth and pollution
In this paper, the relationship between pollution and economic growth is considered based on Environmental Kuznets Curve (EKC). The EKC hypothesis suggests that pollution levels initially increase with economic growth but eventually start to decrease as income levels rise and societies begin to place more value on environmental quality [43]. The basic EKC equation can be expressed as follows:
Y = + β X + δ X 2 + ε
where Y is the level of pollution, X is a measure of income or economic activity, and ε is the error term. The coefficient β is expected to be positive at low levels of income (indicating that pollution increases with economic growth) but eventually turn negative at higher income levels (indicating that pollution decreases with economic growth). Considering the distinction between GDP and GDP per capita, which is associated with dynamic changes in population, we employ Equation (5) to demonstrate the relationship between pollution and economic growth. Specifically, in Equation (5), we utilize GDP per capita as the measure of income or economic activity [43]. However, it is important to note that since the main emphasis of this paper is on economic growth, we also consider GDP and dynamic population in other equations to incorporate these factors into our analysis.
Green hydrogen production trend prediction
In this study, to estimate the expected quantity of green hydrogen production between 2022 and 2040, we used the hydrogen roadmap developed by the Korea Energy Agency in 2018 [27] (as shown in Table 1). According to a hydrogen roadmap developed by the Korea Energy Agency in 2018, South Korea is expected to significantly increase its production of green hydrogen between 2022 and 2040. The roadmap predicts that the initial green hydrogen production in 2022 will be 1% of the total hydrogen production, which is estimated to reach 2.2 million tons in 2040. By that year, the percentage of green hydrogen production is expected to reach 30%. Based on the hydrogen roadmap, the expected quantity of green hydrogen production in South Korea is as follows: 60 tons in 2022, 3100 tons in 2025, 21,000 tons in 2030, 120,000 tons in 2035, and 660,000 tons in 2040. In this paper, we supposed that the hydrogen production trend is considered as follows:
H t = H 0 × e k t
Equation (6) is a function of time (t) and has three parameters: initial hydrogen production (H0), growth rate (k), and hydrogen production at time t (H(t)). This equation assumes that hydrogen production in South Korea will continue to grow at an increasing percentage rate over time [44].
Data descriptions and sources
This study utilized data on renewable and fossil fuel generation from the Korean Energy Information Administration to gather annual data spanning from 2010 to 2021 and projected future trends from 2022 to 2040. Table 2 outlines the data sources and definitions utilized in this research, with variables such as GDP and C O 2 selected from the World Bank, while others were selected based on data availability and literature review. The connection between economic growth and green energy was based on relevant literature, which is detailed in the model structure section, along with the impact factors of these variables.

3. Results

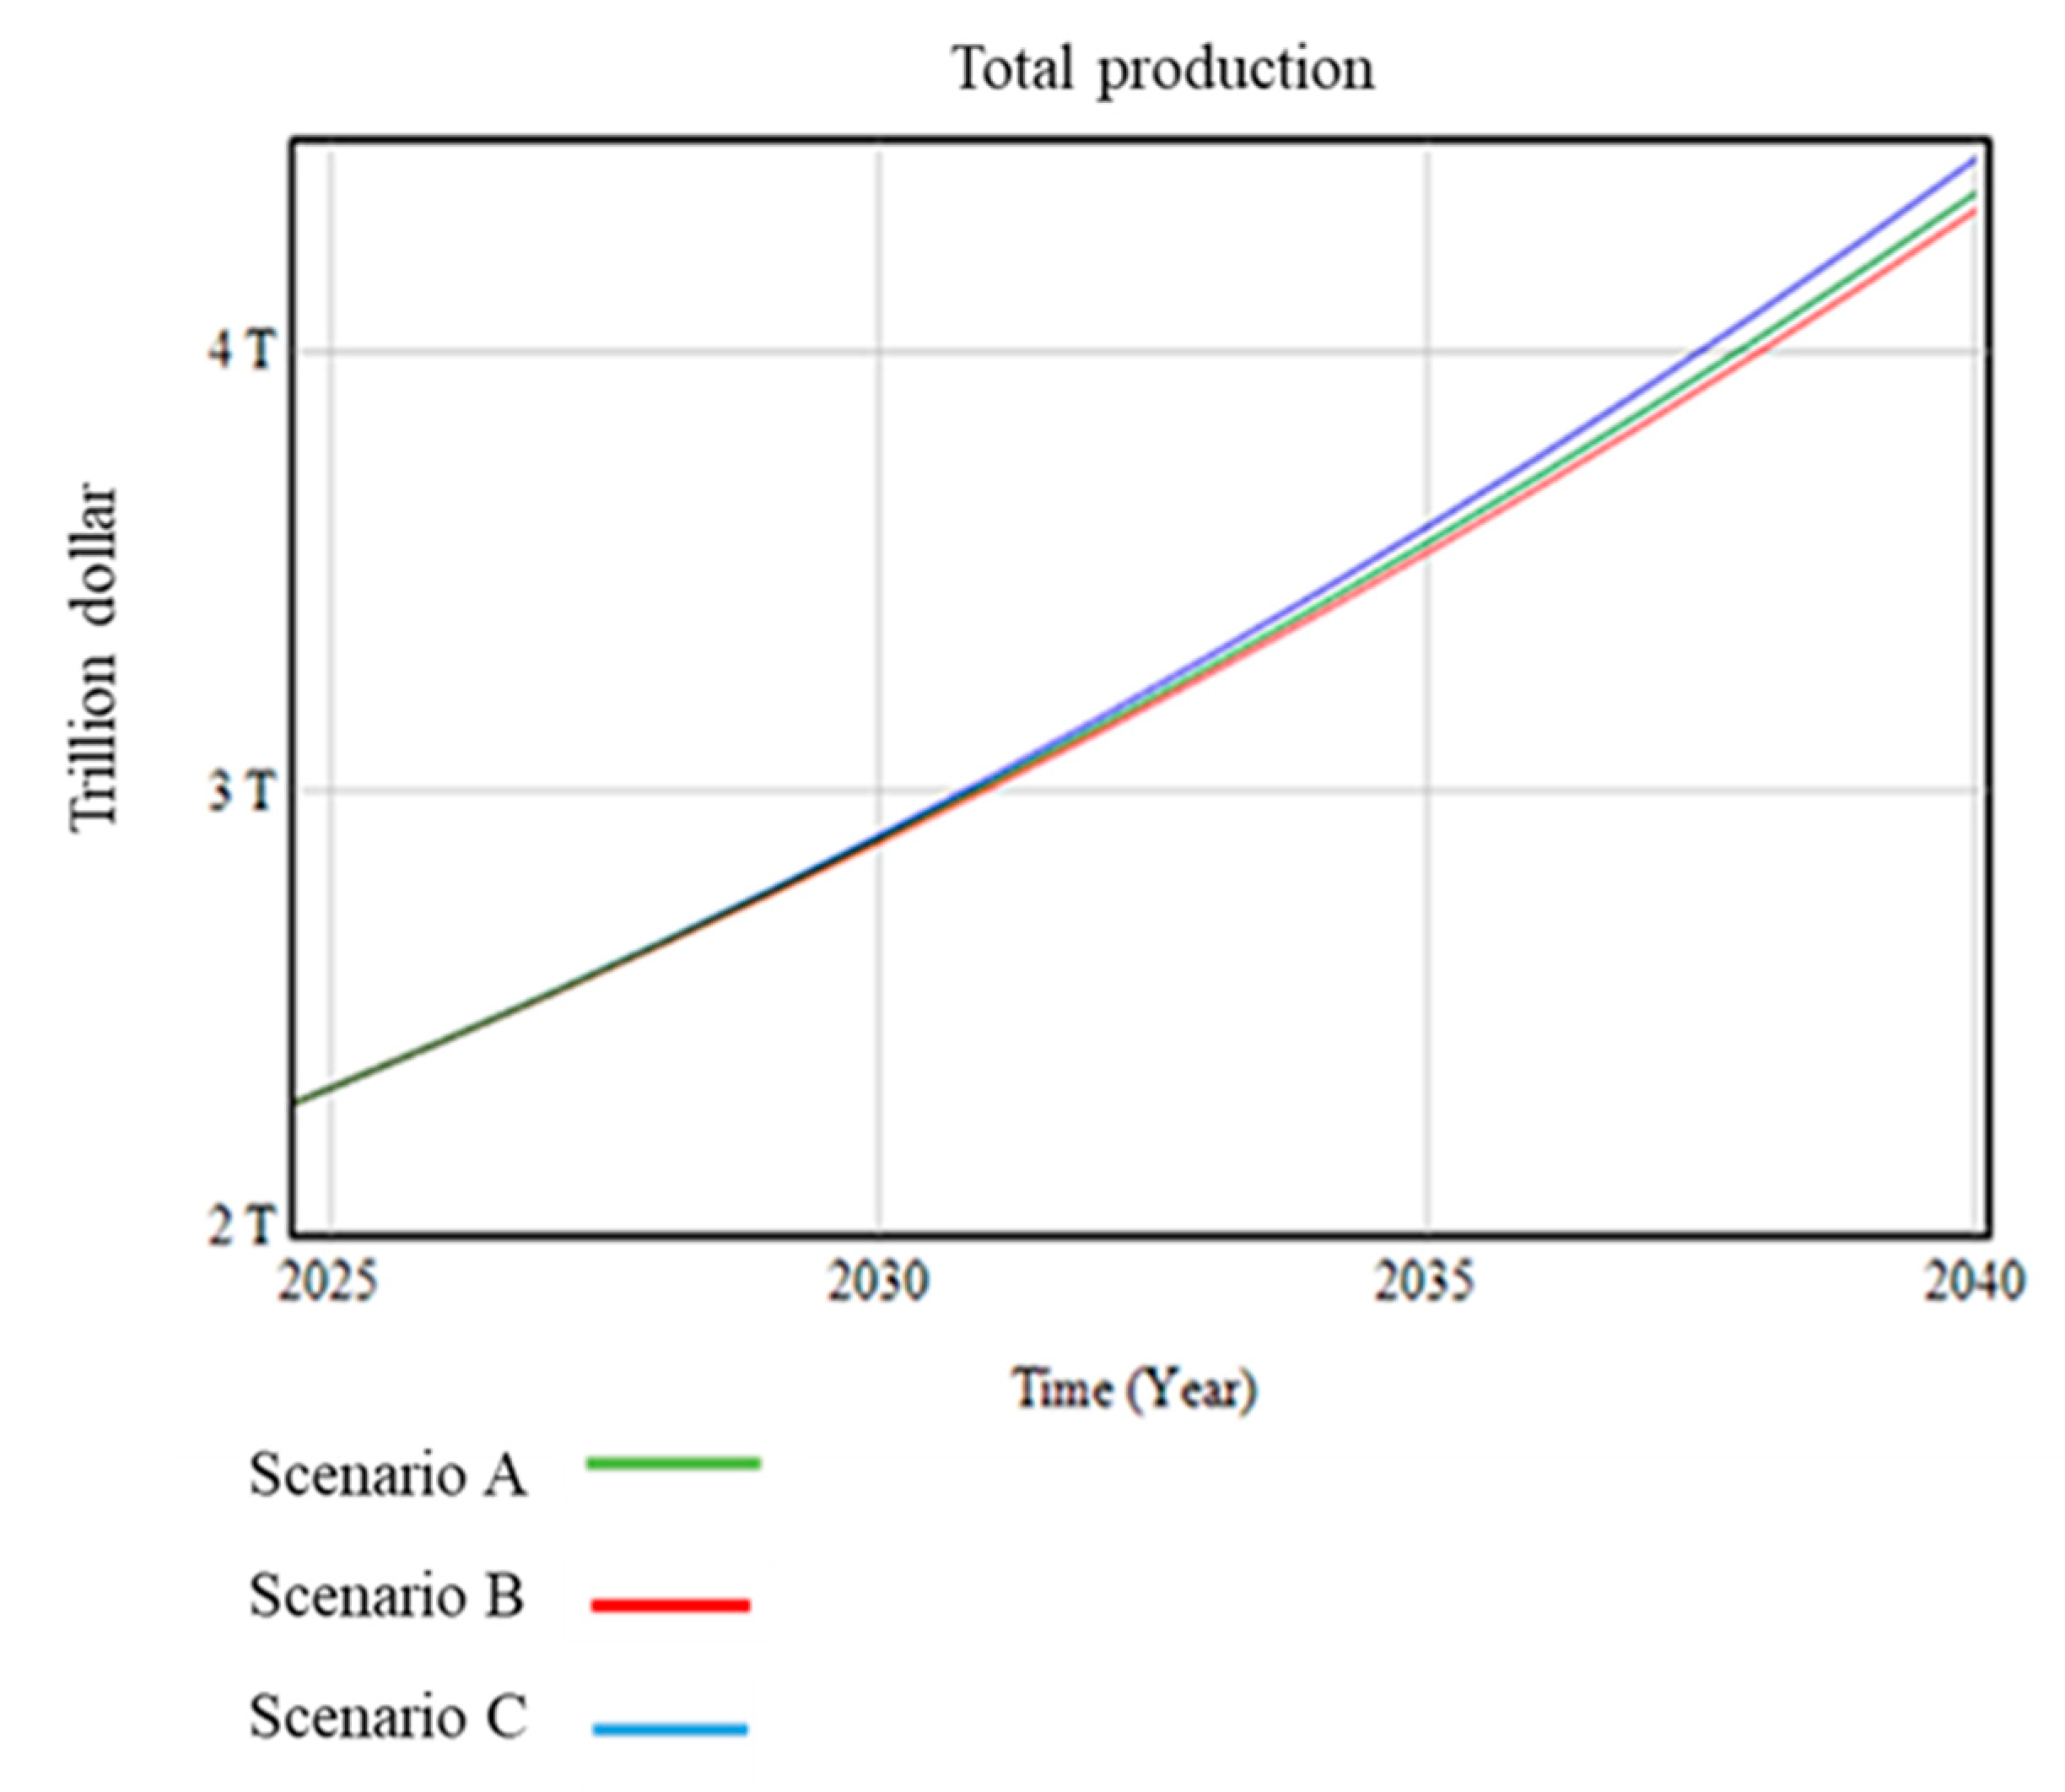
3.1. Policy Scenario Settings

The policy scenario aims to facilitate the transition towards a low-carbon economy by promoting the expansion of renewable energy production and decreasing reliance on fossil fuels, specifically natural gas. In this study, three policy scenarios are proposed to address the research questions regarding the effects of green energy expansion and reduction in fossil fuel imports on economic growth. These scenarios encompass the following:
A.
Changing renewable energy production with a 20% growth rate.
B.
Simulating the impact of gas import due to gas price shocks by 20% reduction.
C.
Reducing gas import by 20% per year (as in Scenario B) and increasing the growth rate of renewable energy production by 20% (as in Scenario A) simultaneously.
The Base policy of this paper assumes a constant annual growth rate of renewable energy production at 16% and a decrease of approximately 24% between 2010 and 2021, in line with the observed trend in South Korea during the same period, as reported by the Korean Energy Institute in 2021. In the second period (2022–2040), the scenario proposes three alternative options: A, B, and C, to accelerate the growth of renewable energy production and reduce dependency on natural gas. Under Scenario A, the growth rate of renewable energy production will increase to 20% per year, an increase in acceleration compared to the previous period. At the same time, Scenario B proposes a yearly reduction in gas imports by 20%. Under this option, the growth rate of renewable energy production will remain at 16% per year, the same as in the Base trend. Under Scenario C, both renewable production and gas import will change, the same as in Scenarios A and B (as shown in Table 3).

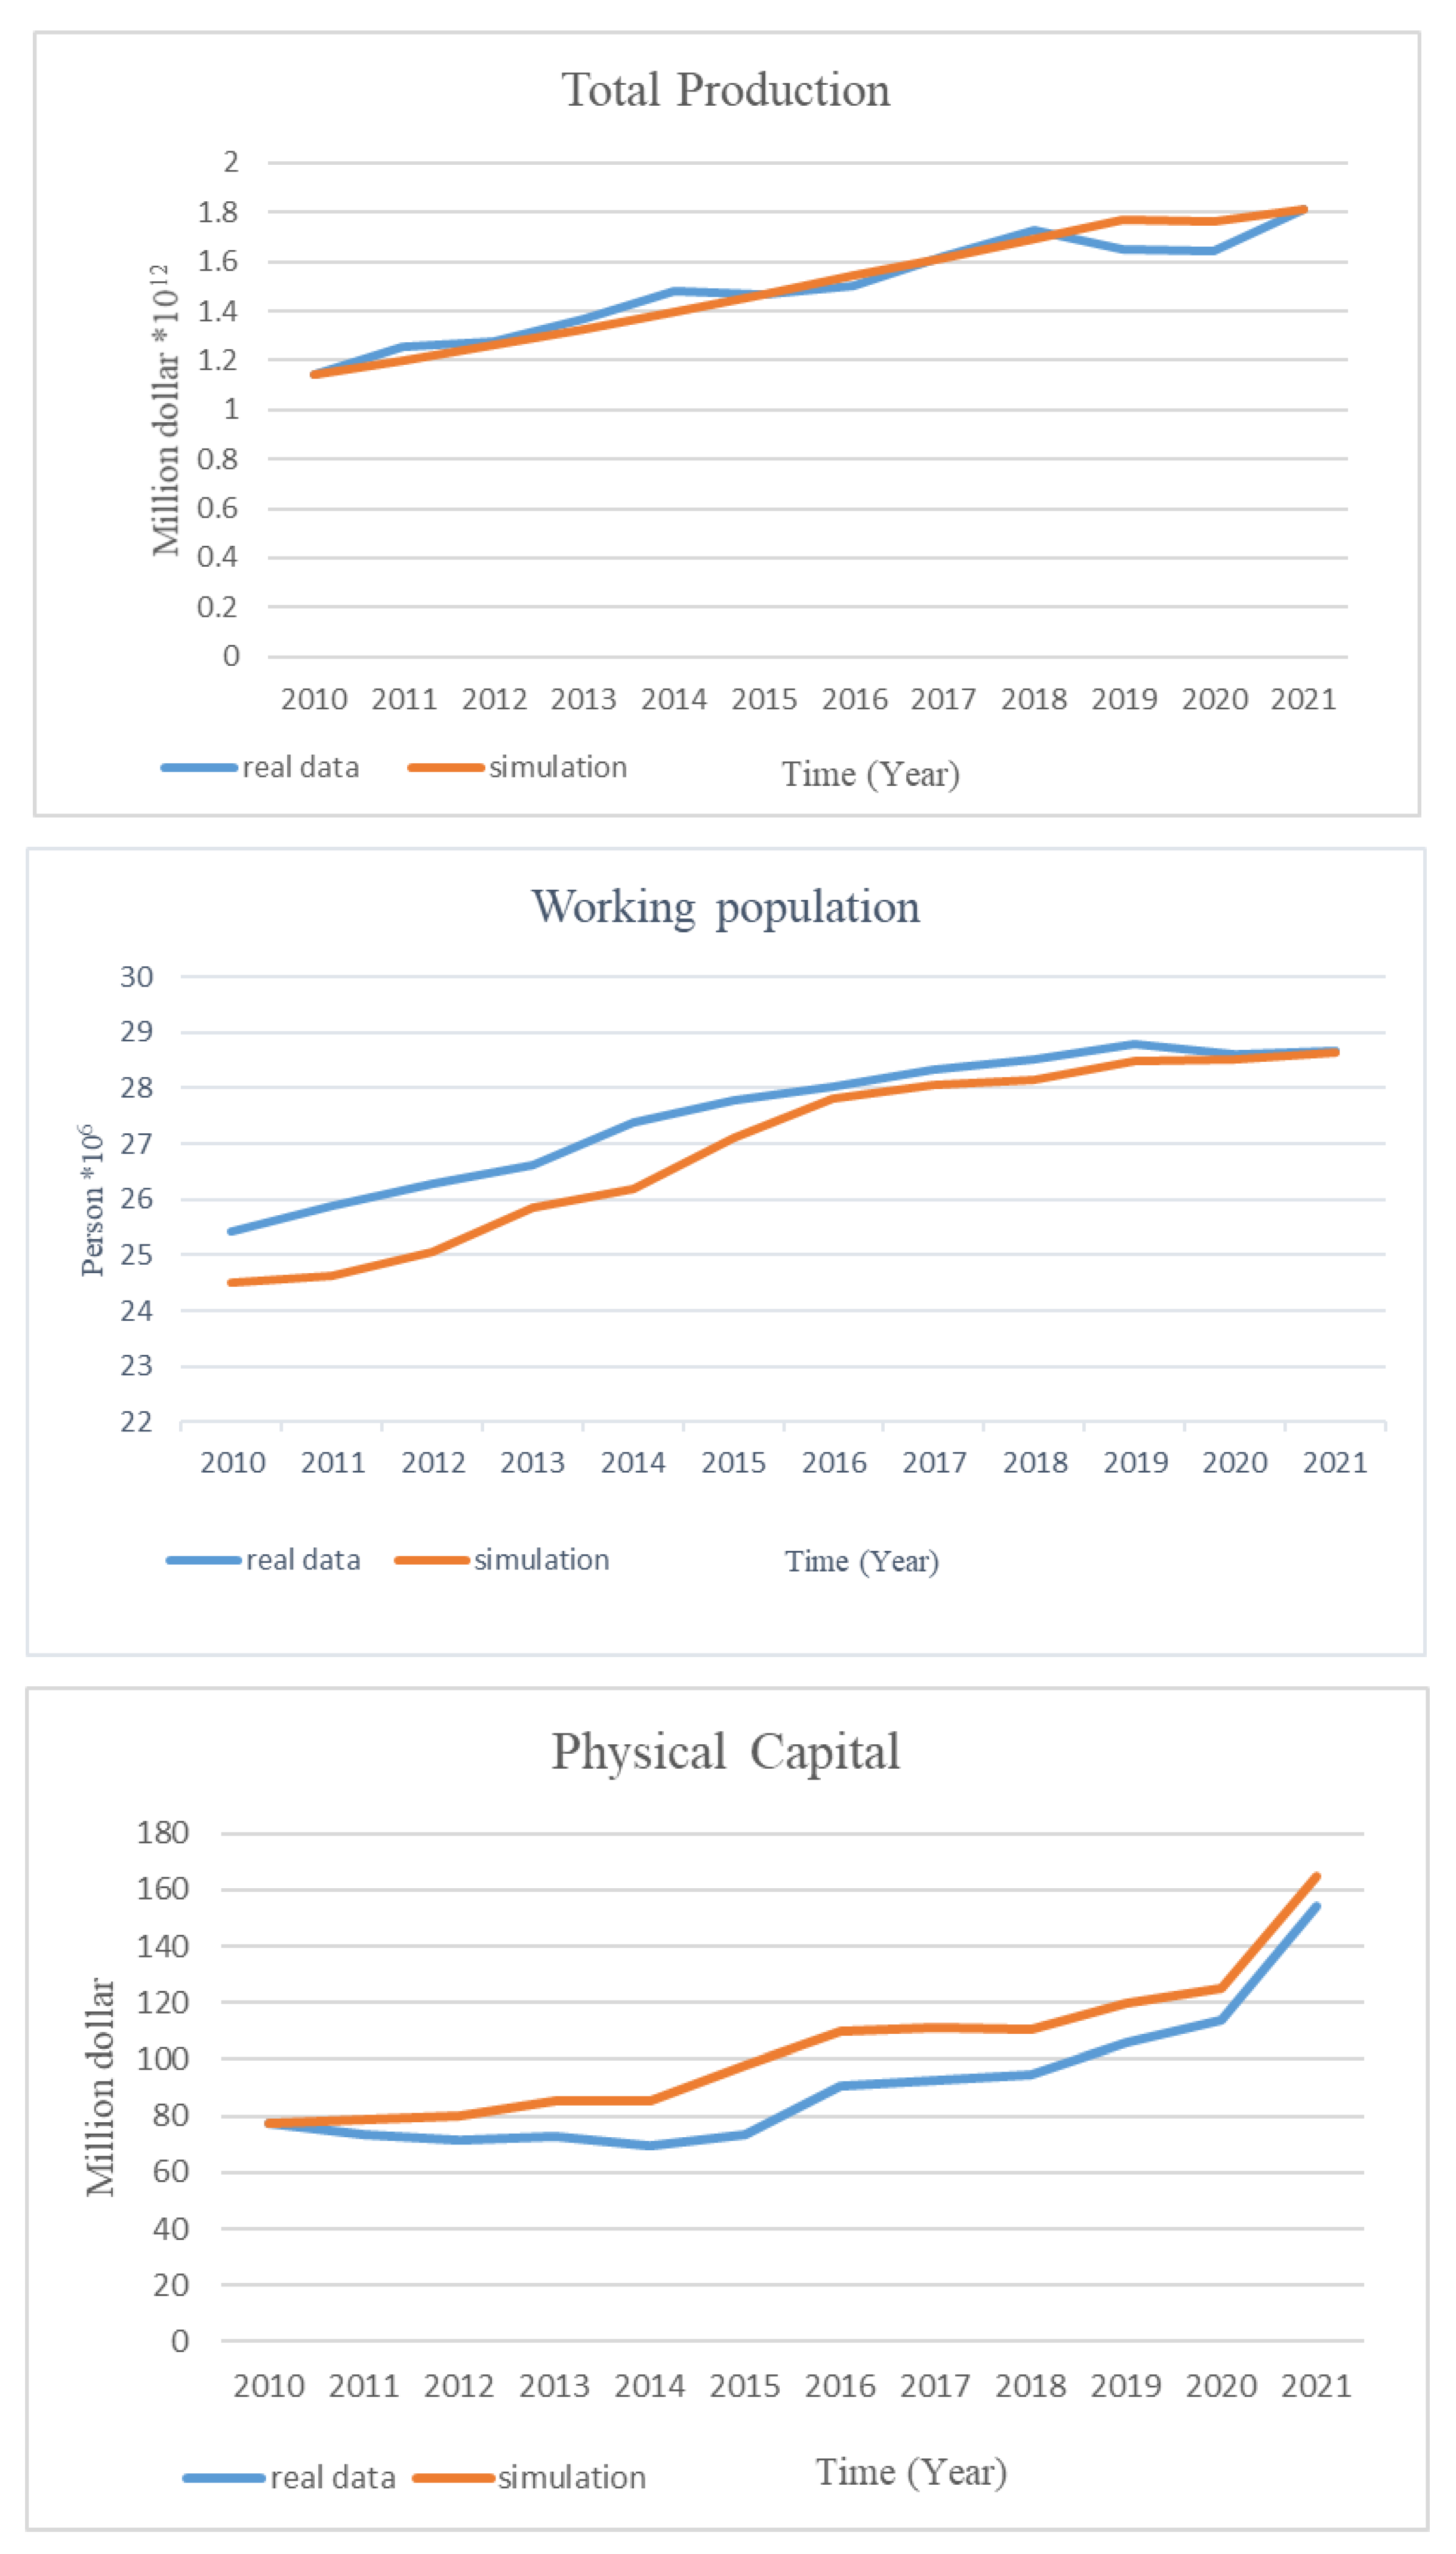
3.2. Model Validation

In order to assess the validity and reliability of the system dynamics model proposed in this paper, we carried out a behavior-reproduction test. The model describes the expansion of green energy in Korea in the presence of hydrogen production and is able to accurately reflect the development of green energy capacity, considering realistic policy boundaries and limitations. We collected historical data from the real world and compared the model’s input–output transformations with those of the actual system, using Vensim PLE7.3.5 to ensure dimensional consistency. Our behavior reproduction test involved comparing the model’s performance against real-world data from 2010 to 2021. The results showed that the model’s output closely approximates actual observations, indicating that it is reliable.
Behavior reproduction test: To evaluate the reliability of the model, we performed a behavior reproduction test using data from 2010 to 2021. Specifically, we compared the model’s output from its initial starting point in 2010 to actual data from the same time period. Our findings indicate that the model’s results closely align with observed reality with a good degree of accuracy. Figure 5 compares the real data for Total Production (Economic Growth), Physical capital, and Working population (Labor) between 2010 and 2021 with the results of the simulation. The simulation closely approximates the real data with a good approximation.
The behavior reproduction, adequacy, and limit state tests were performed to assess the reliability, thoroughness, and effectiveness of the system dynamics model proposed in this paper. The results indicate that the model is capable of accurately reflecting the development of green energy capacity in Korea, considering realistic policy boundaries and limitations, and handling extreme conditions.

3.3. Results

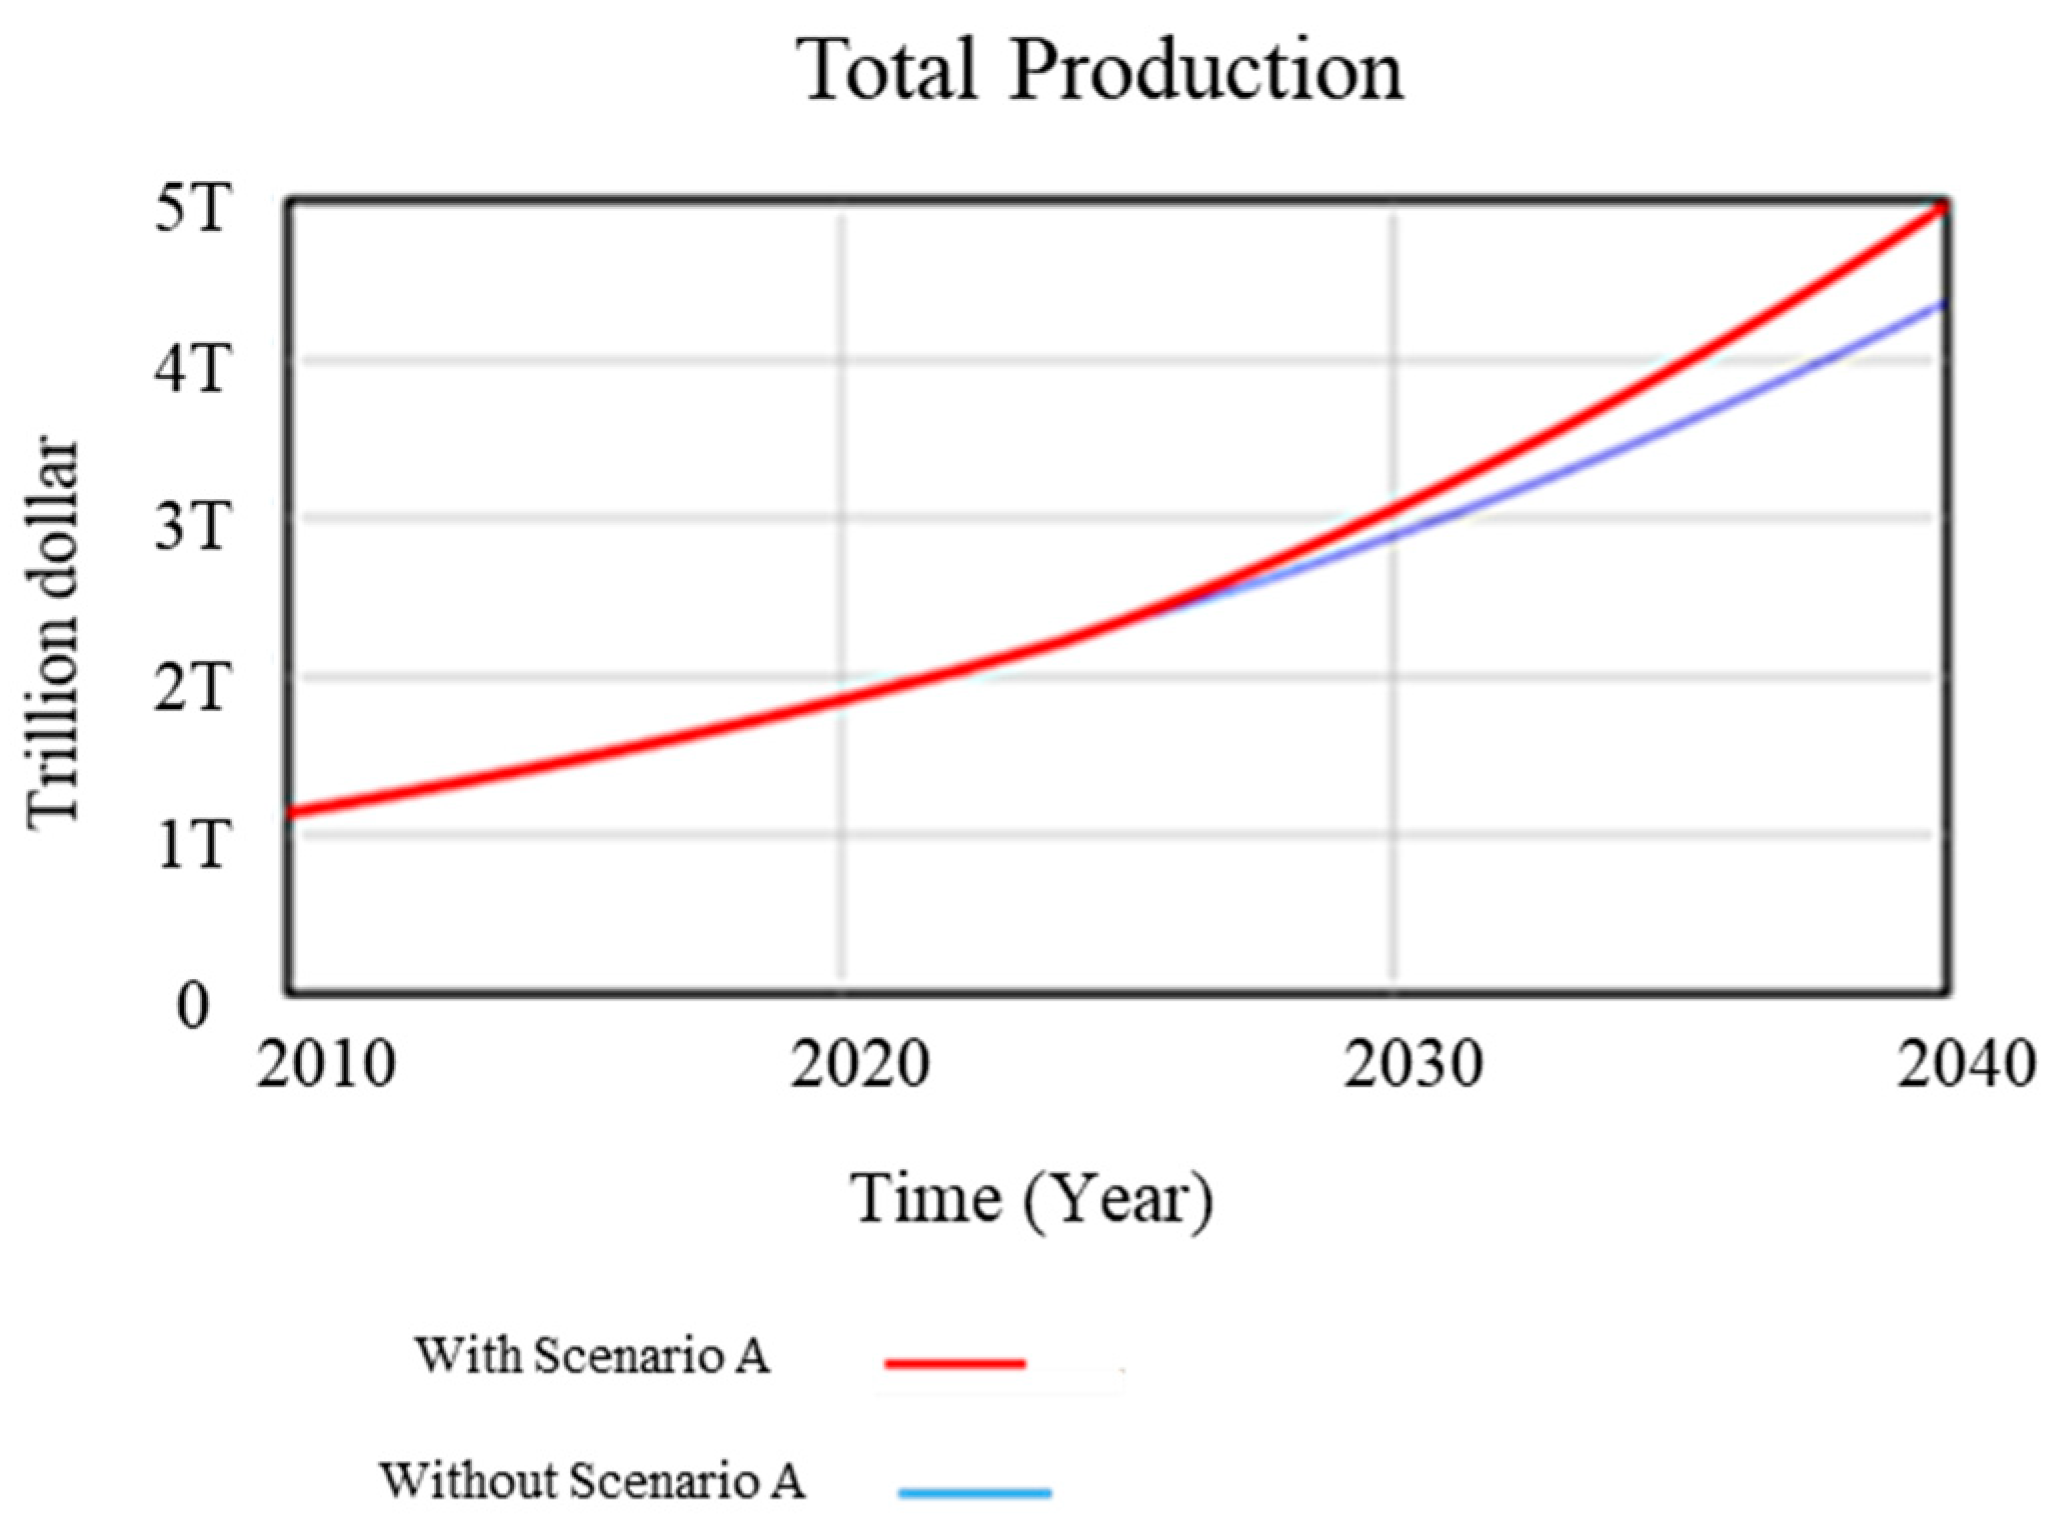
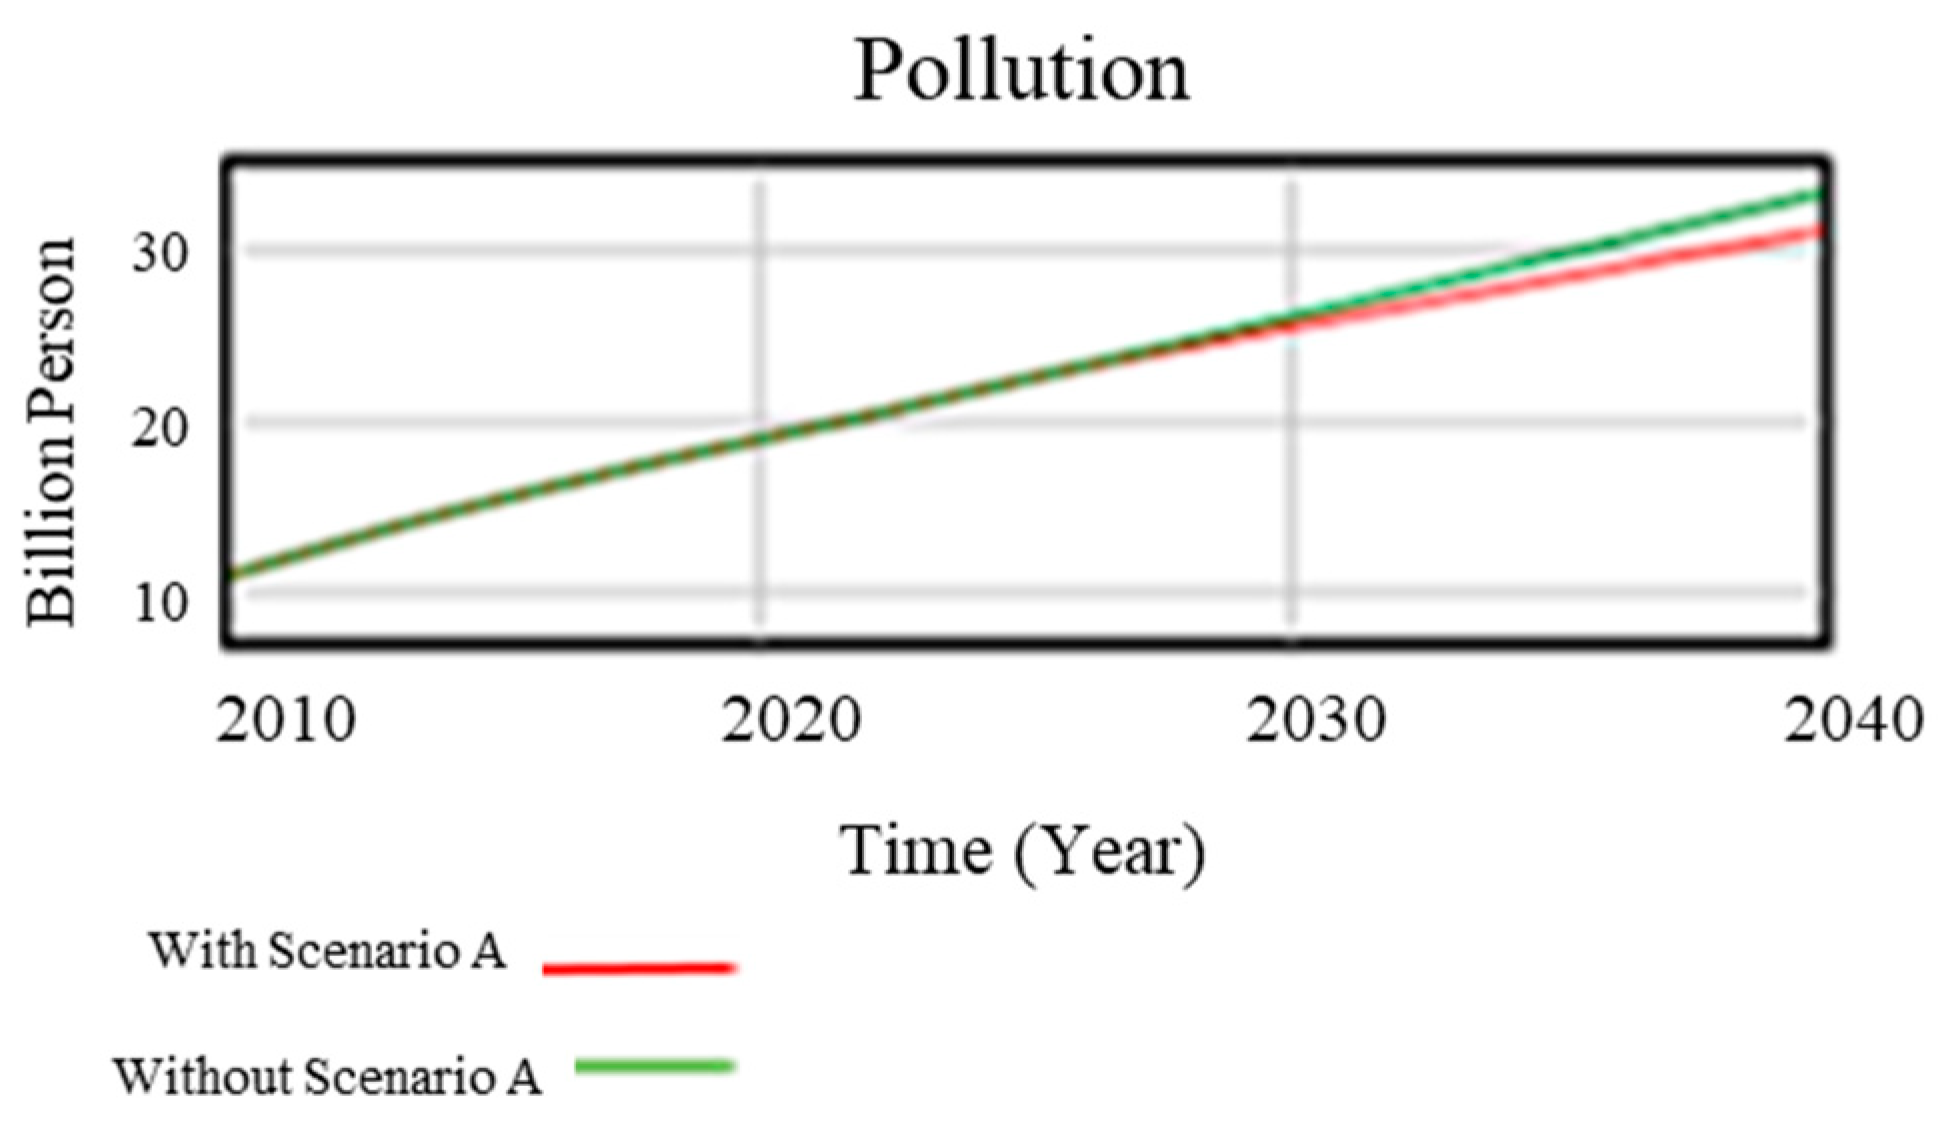
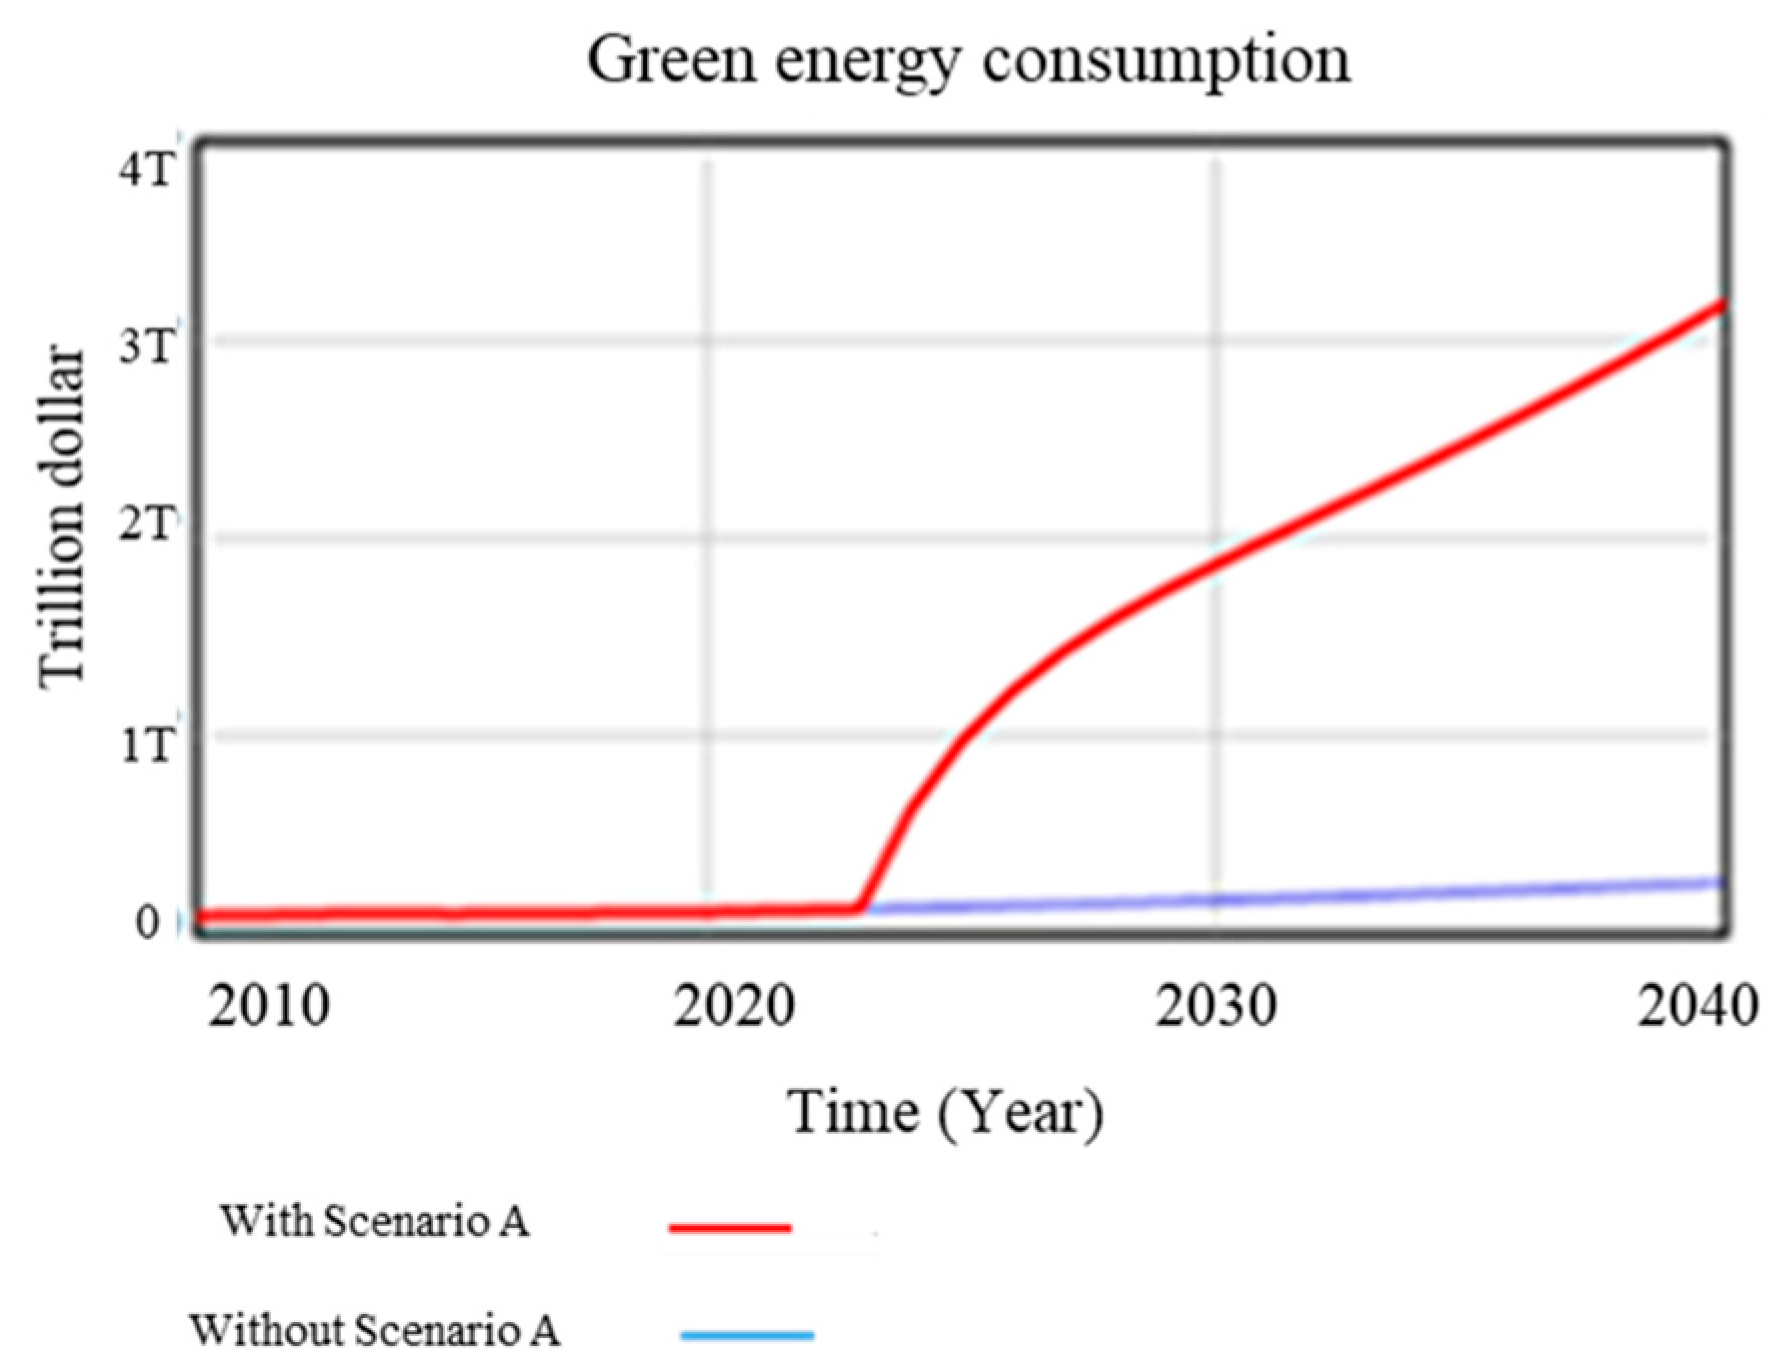
  • The Effects of Changing Renewable Energy Investment: Scenario A Simulation
In this study, we explore the potential impact of increasing green energy production by implementing a 20% growth rate in renewable energy investment (Scenario A). The findings reveal that the implementation of Scenario A leads to a significant increase in physical capital within the green energy sector, which has positive implications for economic growth. Figure 6 illustrates that without additional investment in green energy, the projected economic growth rates in all years are lower compared to Scenario A.
Furthermore, the simulation demonstrates that increasing investment in renewable energy translates into a boost in both renewable energy production and consumption. As a result, there is a noticeable increase in total production and economic growth from the year 2025 onwards. Additionally, the rise in renewable energy investment stimulates the production of equipment required for green energy generation, further contributing to economic growth. Through sensitivity analysis, we also observe a decline in fossil fuel reserves and a reduction in fossil fuel consumption within the first year of implementing Scenario A. This, in turn, leads to a decrease in pollution levels and associated health expenses, which take effect within three years (starting from 2026).
Overall, the results of Scenario A strongly indicate that increasing investment in renewable energy can have positive economic and environmental impacts. Figure 6 visually represents the favorable outcomes in terms of economic growth and environmental sustainability. These findings highlight the potential benefits of directing resources towards the expansion of green energy sources, promoting a transition to a more sustainable and low-carbon economy.
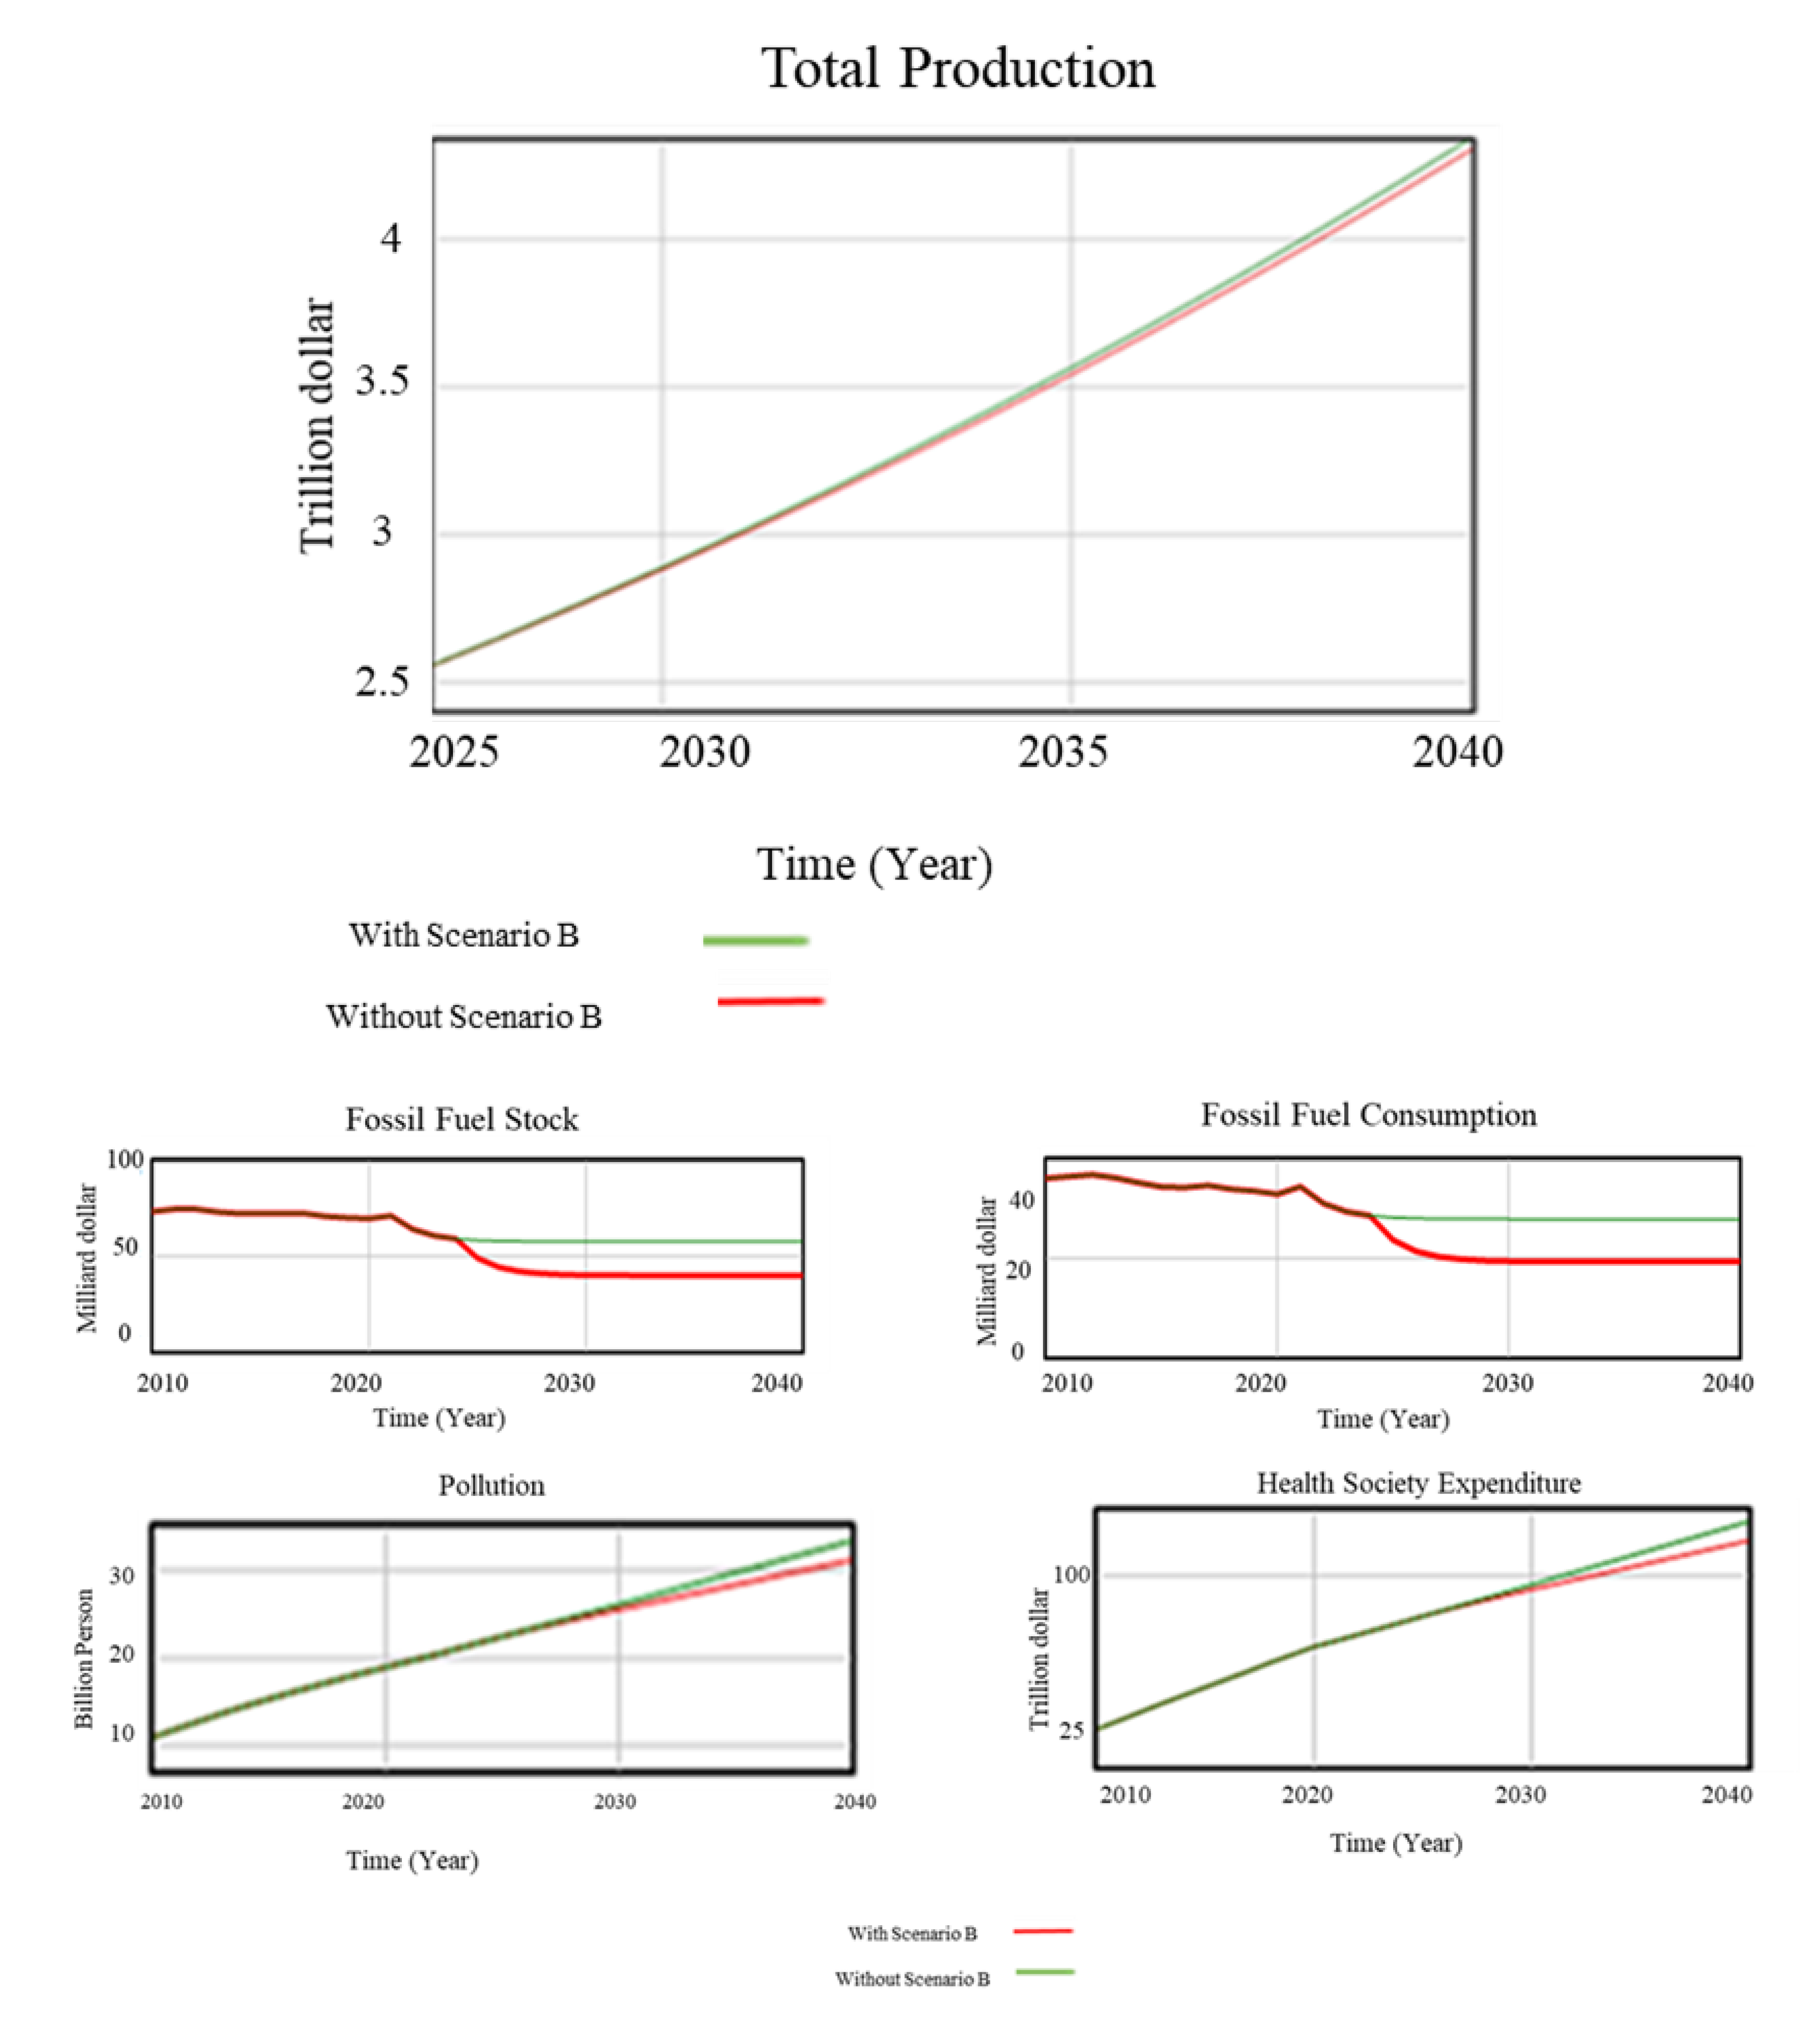
  • The Effects of Gas Imports Change in Scenario B: Simulation Results
In Scenario B, we examine the consequences of gradually reducing gas imports by 20% annually from 2022 to 2040 while maintaining a consistent growth rate of 16% per year for renewable energy production. The simulation results, illustrated in Figure 7, demonstrate that a 20% yearly decrease in gas imports resulting from a price shock would lead to a slight increase in total production and economic growth in South Korea. Although the impact may be relatively modest, these findings suggest that reducing reliance on gas imports and increasing the utilization of renewable energy sources could have positive long-term effects on the economy.
Additionally, the reduction in gas imports would contribute to a decline in air pollution levels, resulting in improved health outcomes and reduced healthcare expenditure. This transition would also lead to a gradual depletion of fossil fuel reserves over time. In 2025, the consumption of fossil fuels was approximately USD 27.5 billion. However, with the continued decrease in consumption, by 2040, the estimated value of the remaining fossil fuel stock is projected to be around USD 43.5 billion.
Overall, the simulation results from Scenario B underscore the potential economic benefits and environmental advantages of reducing gas imports and increasing the adoption of renewable energy sources. While the impact on economic growth may be modest, the long-term positive effects on air pollution reduction and public health make this scenario a significant consideration for policymakers striving to achieve sustainable and cleaner energy systems.
  • Simulation Results of Scenario C: Changes in Renewable Energy Investment and Gas Import Reduction
In Scenario C, we examine the combined effects of changes in renewable energy investment and a reduction in gas imports on the economy. This scenario involves a 2% reduction in gas imports due to a gas price shock and a 20% growth rate in renewable energy production. The simulation results, as shown in Figure 8, illustrate the changes in total production.
By increasing investment in renewable energy and simultaneously reducing gas imports, the production and consumption of renewable energy experience significant growth. This will lead to an overall increase in total production and economic growth from 2025 onwards. Furthermore, the increase in investment in renewable energy also drives the production of equipment for green energy, further contributing to economic growth. This positive trend in total production reflects the potential for long-term economic growth in Korea.
Additionally, the results indicate a decrease in fossil fuel reserves and consumption of fossil fuels. This reduction in fossil fuel usage has a positive impact on pollution levels and health expenses. As a result, there is a decline in environmental pollution, leading to improved public health outcomes and decreased healthcare costs.
In conclusion, the simulation results of Scenario C highlight the positive economic implications of increasing investment in renewable energy and reducing gas imports. This combined approach not only promotes sustainable economic growth but also contributes to environmental preservation and improved public health.

3.4. Discussion

Table 4 presents the percentage changes in economic growth rate for three different time periods under three different scenarios: Scenario A, Scenario B, and Scenario C. These scenarios offer different levels and patterns of economic growth, which can have significant implications for overall production levels in the economy. Since there are no significant changes in variables from 2022 to 2025, it is not included in Table 4. In Scenario A, the economic growth rate changes from 7% to 35% between 2025 and 2040. The total production is USD 2.8 trillion in 2025 and increases to USD 5.4 trillion by 2040. This scenario shows relatively low economic growth in the short term (2025–2030) of 7%, followed by higher growth rates in the later periods.
According to the literature, sustained economic growth can lead to higher levels of production and employment, as well as increased standards of living for individuals [52]. This is consistent with Scenario A, which shows a gradual increase in economic growth rates over time, leading to higher levels of total production by 2035–2040. Sustainable economic growth requires a balance between capital accumulation, technological progress, and labor productivity [53]. Some researchers argue that steady and moderate economic growth, rather than rapid growth, is more sustainable over the long term [54]. Thus, scenario A may suggest an environment of steady but relatively slow economic growth, which may be more sustainable and stable over the long term.
However, high rates of economic growth do not always translate into increased production levels, as other factors, such as inefficiencies in the production process, can limit the ability of firms to produce goods and services [55]. This is exemplified in Scenario B, which shows a sharp increase in economic growth rates but relatively small increases in total production. The total production in Scenario B is USD 2.7 trillion in 2025 and increases to USD 4.8 trillion by 2040. This scenario suggests an environment of rapid economic growth in the short term but with diminishing returns and potential instability in the long term. Rapid economic growth in the short term can have positive effects on poverty reduction, employment creation, and income distribution [56]. However, some researchers argue that rapid growth can also lead to a range of negative consequences, including income inequality, social exclusion, and environmental degradation [57]. In addition, rapid growth can lead to overheating and inflation, which can ultimately undermine economic stability [58].
Scenario C represents the combined effects of Scenario A and Scenario B. The growth rate in Scenario C is the highest among the three scenarios. The total production in Scenario C is USD 2.4 trillion in 2025 and increases to USD 5.7 trillion by 2040, reflecting the combined impact of the changes in green energy production and gas imports reduction. Sustained rapid economic growth over the medium to long term can result in high levels of total production and significant positive effects on employment and income [59]. This is consistent with Scenario C, which shows consistently high economic growth rates over time and a substantial increase in total production by 2035–2040.
In summary, each scenario represents a different approach to economic growth, with distinct risks and opportunities. The choice of scenario will depend on a range of factors, including the economic and social context, the goals and priorities of policymakers, and the potential risks and benefits associated with each scenario. Ultimately, policymakers should aim for a balanced and sustainable approach to economic growth, which considers the needs and aspirations of all stakeholders, both present and future.

4. Conclusions

In conclusion, this study utilizes a system dynamics approach to construct a behavioral model and establish different policy scenarios to predict the impact of green energy expansion and gas import reduction on economic growth in South Korea. Three policy scenarios (A, B, and C) were proposed, aiming to promote a transition to a low-carbon economy. Scenario A focuses on increasing renewable energy production with a 20% growth rate, Scenario B simulates the impact of gas price shocks through a 20% reduction in gas imports, and Scenario C combines the strategies of both A and B. The results of the study demonstrate that increasing investment in renewable energy can have positive economic impacts. Scenario A shows a gradual and sustainable increase in the economy’s growth rate from 7% to 35% between 2025 and 2040, accompanied by a rise in total production from USD 2.8 trillion to USD 5.4 trillion. This scenario suggests a stable environment for long-term economic growth. Scenario B, on the other hand, displays a sharp increase in economic growth rates but relatively small increases in total production. Total production reaches USD 2.7 trillion in 2025, rising to USD 4.8 trillion by 2040. This scenario indicates the potential for rapid economic growth in the short term, with possible instability in the long term. Scenario C, combining the effects of A and B, shows the highest growth rate among the three scenarios. Total production in 2025 is USD 2.4 trillion, increasing to USD 5.7 trillion by 2040. The combined impact of changes in green energy production and gas import reduction in Scenario C results in consistently high economic growth rates and a substantial increase in total production by 2035–2040. Future studies could also integrate econometric methods with the system dynamics model to provide a more comprehensive analysis of the relationship between green energy expansion and economic growth. This approach would allow for the inclusion of additional control variables, such as technological advances, which play a crucial role in understanding the dynamics between these factors.

Author Contributions

Conceptualization, A.G., V.K. and J.L.; Methodology, A.G., V.K. and M.S.; Software, A.G. and M.S.; Validation, A.G., M.S. and J.L.; Formal analysis, A.G. and V.K.; Investigation, A.G. and V.K.; Resources, A.G.; Data curation, A.G., V.K. and M.S.; Writing—original draft, A.G.; Writing—review and editing, A.G. and V.K.; Visualization, A.G. and V.K.; Supervision, J.L.; Project administration, A.G. and J.L.; Funding acquisition, J.L. All authors have read and agreed to the published version of the manuscript.

Funding

This work was supported by the Basic Science Research Program through the National Research Foundation of Korea (NRF), funded by the Ministry of Science and ICT (2019R1A2C2084709 and 2021R1A4A3025742).

Data Availability Statement

Data will be made available on request.

Conflicts of Interest

The authors declare no conflict of interest.

References

  1. Baz, K.; Cheng, J.; Xu, D.; Abbas, K.; Ali, I.; Ali, H.; Fang, C. Asymmetric impact of fossil fuel and renewable energy consumption on economic growth: A nonlinear technique. Energy 2021, 226, 120357. [Google Scholar] [CrossRef]
  2. Li, J.; Irfan, M.; Samad, S.; Ali, B.; Zhang, Y.; Badulescu, D.; Badulescu, A. The Relationship between Energy Consumption, CO2 Emissions, Economic Growth, and Health Indicators. Int. J. Environ. Res. Public Health 2023, 20, 32325. [Google Scholar] [CrossRef] [PubMed]
  3. Korea Energy Economics Institute (EIK). Available online: http://www.keei.re.kr/keei/download/EnergyInfo2011.pdf (accessed on 23 February 2023).
  4. Ghezelbash, A.; Khaligh, V.; Fahimifard, S.H.; Liu, J.J. A Comparative Perspective of the Effects of CO2 and Non-CO2 Greenhouse Gas Emissions on Global Solar, Wind, and Geothermal Energy Investment. Energies 2023, 16, 3025. [Google Scholar] [CrossRef]
  5. Dincer, I.; Acar, C. A review on clean energy solutions for better sustainability. Int. J. Energy Res. 2015, 39, 585–606. [Google Scholar] [CrossRef]
  6. Alsharif, M.H.; Kim, J.; Hong Kim, J. Sustainability Opportunities and Challenges of Solar and Wind Energy in South Korea: A Review. Sustainability 2018, 10, 1822. [Google Scholar] [CrossRef] [Green Version]
  7. Dogan, E.; Altinoz, B.; Madaleno, M.; Taskin, D. The impact of renewable energy consumption to economic growth: A replication and extension of Inglesi-Lotz. Energy Econ. 2016, 2020, 90. [Google Scholar] [CrossRef]
  8. Shahbaz, M.; Raghutla, C.; Chittedi, K.R.; Jiao, Z.; Vo, X.V. The effect of renewable energy consumption on economic growth: Evidence from the renewable energy country attractive index. Energy 2020, 207, 118162. [Google Scholar] [CrossRef]
  9. KOSIS Korean Statistical Information Systems of South Korea. 2021. Available online: https://kosis.kr/statHtml/statHtml.do?orgId=101&tblId=DT_1B8000F&language=en (accessed on 23 February 2023).
  10. Stangarone, T. South Korean efforts to transition to a hydrogen economy. Clean Technol. Environ. Policy 2021, 23, 509–516. [Google Scholar] [CrossRef]
  11. Hieu, V.M.; Mai, N.H. Impact of renewable energy on economic growth? Novel evidence from developing countries through MMQR estimations. Environ. Sci. Pollut. Res. Int. 2023, 30, 578–593. [Google Scholar] [CrossRef]
  12. AlDarraji, H.H.M.; Bakir, A. The Impact of Renewable Energy Investment on Economic Growth. J. Soc. Sci. 2020, 9, 234. [Google Scholar] [CrossRef]
  13. Yang, H. A note on the causal relationship between energy and GDP in Taiwan. Energy Econ. 2000, 22, 309–317. [Google Scholar] [CrossRef]
  14. Chien, T.; Hu, J.L. Renewable energy: An efficient mechanism to improve GDP. Energy Policy 2008, 36, 3045–3052. [Google Scholar] [CrossRef]
  15. Ma, T.; Ji, J.; Chen, M. Study on the hydrogen demand in China based on system dynamics model. Int. J. Hydrogen Energy 2010, 35, 3114–3119. [Google Scholar] [CrossRef]
  16. Mahmoodi, M.; Mahmoodi, E. Renewable Energy Consumption and Economic Growth: The Case of 7 Asian Developing Countries. Am. J. Sci. Res. 2011, 35, 146–152. [Google Scholar]
  17. Lund, H.; Andersen, A.N.; Alberg, P.; Vad, B.; Connolly, D. From electricity smart grids to smart energy systems e A market operation based approach and understanding. Energy 2012, 42, 96–102. [Google Scholar] [CrossRef]
  18. Nyambuu, U.; Semmler, W. Climate change and the transition to a low carbon economy—Carbon targets and the carbon budget. Econ. Model. 2020, 84, 367–376. [Google Scholar] [CrossRef]
  19. Ackermann, T.; Söder, L. An overview of wind energy-status 2002. Renew. Sustain. Energy Rev. 2002, 6, 67–127. [Google Scholar] [CrossRef]
  20. Khaligh, V.; Ghezelbash, A.; Mazidi, M.; Liu, J.; Ryu, J. P-robust energy management of a multi-energy microgrid enabled with energy conversions under various uncertainties. Energy 2023, 271, 127084. [Google Scholar] [CrossRef]
  21. Khaligh, V.; Ghezelbash, A.; Mazidi, M.; Liu, J.; Ryu, J.-H.; Na, J. A stochastic agent-based cooperative scheduling model of a multi-vector microgrid including electricity, hydrogen, and gas sectors. J. Power Sources 2022, 546, 231989. [Google Scholar] [CrossRef]
  22. Zhu, D.; Mostafa, S.; Maleki, A.; Aslani, A. Analysis of the robustness of energy supply in Japan: Role of renewable energy. Energy Rep. 2020, 6, 378–391. [Google Scholar] [CrossRef]
  23. Ghezelbash, A. A cyber-secure model to decentralized co-expansion planning of gas and electricity networks. Energies 2021, 14, 13414–13428. [Google Scholar] [CrossRef]
  24. Lee, C.C.; Chang, C.P. Energy consumption and economic growth in Asian economies: A more comprehensive analysis using panel data. Resour. Energy Econ. 2008, 30, 50–65. [Google Scholar] [CrossRef]
  25. Apergis, N.; Payne, J.E. The renewable energy consumption-growth nexus in Central America. Appl. Energy 2011, 88, 343–347. [Google Scholar] [CrossRef]
  26. Wang, B.; Mi, Z.; Nistor, I.; Yuan, X.C. How does hydrogen-based renewable energy change with economic development? Empirical evidence from 32 countries. Int. J. Hydrogen Energy 2018, 43, 11629–11638. [Google Scholar] [CrossRef] [Green Version]
  27. KEA—Korean Energy Agency. Available online: https://www.kea.org/main.do (accessed on 9 May 2023).
  28. Park, J.; Hong, T. Analysis of South Korea’s economic growth, carbon dioxide emission, and energy consumption using the Markov switching model. Renew. Sustain. Energy Rev. 2013, 18, 543–551. [Google Scholar] [CrossRef]
  29. Forrester, J.W. Industrial Dynamics. J. Oper. Res. Soc. 1997, 48, 1037–1041. [Google Scholar] [CrossRef]
  30. Kuai, P.; Li, W.; Cheng, R.; Cheng, G. An application of system dynamics for evaluating planning alternatives to guide a green industrial transformation in a resource-based city. J. Clean. Prod. 2015, 104, 403–412. [Google Scholar] [CrossRef]
  31. Chen, J.; Yu, T.H.K.; Chou, S.Y.; Nguyen, T.A.T. Simulating the effects of offshore wind energy policy on decarbonization and industrial growth in Taiwan: A system dynamics approach. Energy Sustain. Dev. 2022, 71, 490–504. [Google Scholar] [CrossRef]
  32. Latif, K.; Raza, M.Y.; Adil, S.; Kouser, R. Nexus between Economy, Agriculture, Population, Renewable Energy and CO2 Emissions: Evidence from Asia-Pacific Countries. J. Bus. Soc. Rev. Emerg. Econ. 2020, 6, 261–276. [Google Scholar] [CrossRef]
  33. Llera, E.; Scarpellini, S.; Aranda, A.; Zabalza, I. Forecasting job creation from renewable energy deployment through a value-chain approach. Renew. Sustain. Energy Rev. 2013, 21, 262–271. [Google Scholar] [CrossRef]
  34. Hasani-marzooni, M.; Hosseini, S.H. Dynamic model for market-based capacity investment decision considering stochastic characteristic of wind power. Renew. Energy 2011, 36, 2205–2219. [Google Scholar] [CrossRef]
  35. Dobrowolski, Z.; Drozdowski, G. Does the Net Present Value as a Financial Metric Fit Investment in Green Energy Security? Energies 2022, 15, 353. [Google Scholar] [CrossRef]
  36. Jacobson, M.Z.; Delucchi, M.A. Providing all global energy with wind, water, and solar power, Part I: Technologies, energy resources, quantities and areas of infrastructure, and materials. Energy Policy 2011, 39, 1154–1169. [Google Scholar] [CrossRef]
  37. World Health Organization (WHO). The 2018 Report of the Lancet Countdown on Health and Climate Change: Shaping the Health of Nations for Centuries to Come. 2018. Available online: https://www.who.int/publications/i/item/9789241514620 (accessed on 23 February 2023).
  38. Bilgili, F.; Kuskaya, S.; Toguc, N.; Mugalohlu, E.; Kocak, E.; Bulut, U.; Baglitas Hilal, H. A revisited renewable consumption-growth nexus: A continuous wavelet approach through disaggregated data. Renew. Sustain. Energy Rev. 2019, 107, 1–19. [Google Scholar] [CrossRef]
  39. Maekawa, J.; Hai, B.H.; Shinkuma, S.; Shimada, K. The Effect of Renewable Energy Generation on the Electric Power Spot Price of the Japan Electric. Energies 2018, 11, 2215. [Google Scholar] [CrossRef] [Green Version]
  40. Stern, N. The Economics of Climate Change. Am. Econ. Rev. 2008, 98, 1–37. [Google Scholar] [CrossRef] [Green Version]
  41. Holechek, J.L.; Geli, H.M.E.; Sawalhah, M.N. A Global Assessment: Can Renewable Energy Replace Fossil Fuels by 2050? Sustainability 2022, 14, 4792. [Google Scholar] [CrossRef]
  42. Ben-salha, O.; Hakimi, A.; Zaghdoudi, T.; Soltani, H.; Nsaibi, M. Assessing the Impact of Fossil Fuel Prices on Renewable Energy in China Using the Novel Dynamic ARDL Simulations Approach. Sustainability 2022, 14, 10439. [Google Scholar] [CrossRef]
  43. Grossman, G.M.; Krueger, A.B. Economic growth and the environment. Quaterly J. Econ. 1995, 110, 353–377. [Google Scholar] [CrossRef] [Green Version]
  44. Lansing, J.S. Complex adaptive systems. Annu. Rev. 2003, 32, 183–204. [Google Scholar] [CrossRef]
  45. Korea, S.; Lolla, A.; Graham, E.; Kim, J.; Han, G. Global Electricity Review 2021 South Korea. 2021. Available online: https://www.ember-climate.org/global-electricity-review-2021 (accessed on 23 February 2023).
  46. BP. Statistical Review of World Energy, Energy Consumption of South Korea. Available online: https://www.bp.com/en/global/corporate/energy-economics/statistical-review-of-world-energy.html (accessed on 23 February 2023).
  47. International Trade Administration. Energy-Carbon Neutrality Initiatives. Available online: https://www.trade.gov/country-commercial-guides/south-korea-energy-carbon-neutrality-initiatives (accessed on 23 February 2023).
  48. World Bank. CO2 Emission between Countries, Environment Department Paper Industrialized Countries: An Analysis of Trends No. 47; The World Bank: Washington, DC, USA, 2021; Available online: https://data.worldbank.org/indicator/EN.ATM.CO2E.PC (accessed on 23 February 2023).
  49. World Bank. Gross Domestic Product (GDP). 2022. Available online: https://data.worldbank.org/indicator/NY.GDP.MKTP.CD (accessed on 10 June 2022).
  50. Campus Education Improvement Committee (CEIC). Korea GDP: GCF: GFCF: Facilities Investment, 1953–2017. 2021. Available online: https://www.ceicdata.com/en/korea/reference-year2010-gdp-by-expenditure-current-price-annual/gdp-gcf-gfcf-facilities-investment (accessed on 17 February 2023).
  51. Federal Reserve Economic Data (FRED). M1 Money Stock. 2021. Available online: https://fred.stlouisfed.org/series/M1TTOTL1ES000 (accessed on 23 February 2023).
  52. Mankiw Gregory, N.; Romer, D.; Weil, D. A Contribution to the Empirics of Economic Growth. Q. J. Econ. 1992, 107, 407–437. [Google Scholar] [CrossRef]
  53. Solow, R. A Contribution to the Theory of Economic Growth. Q. J. Econ. 1956, 70, 65–94. [Google Scholar] [CrossRef]
  54. Arrow, K.J.; Dasgupta, P.; Goulder, L.H.; Kevin, J.; Oleson, K. Sustainability and the measurement of wealth Linked references are available on JSTOR for this article: You may need to log in to JSTOR to access the linked references. J. Environ. Econ. Manag. 2012, 17, 317–353. [Google Scholar] [CrossRef] [Green Version]
  55. Long, J.B.D.E.; Summers, L.H. Equipment investment and economic growth. Q. J. Econ. 1991, 106, 445. [Google Scholar] [CrossRef]
  56. World Bank. Poverty and Shared Prosperity 2020; The World Bank: Washington, DC, USA, 2020. [Google Scholar]
  57. Sen, A. Development as Freedom; Oxford University Press: Oxford, UK, 1999. [Google Scholar]
  58. Blanchard, O.; Summers, L.H. Evolution or Revolution—Rethinking Macroeconomic Policy after the Great Recession; The MIT Press: Cambridge, MA, USA, 2019. [Google Scholar]
  59. Grossman, G.M.; Helpman, E. Innovation and Growth in the Global Economy; The MIT Press: Cambridge, MA, USA, 1993; Available online: https://mitpress.mit.edu/9780262570978/innovation-and-growth-in-the-global-economy/ (accessed on 26 April 2023).
Figure 1. Common steps for modeling SD.
Sustainability 15 09281 g001
Figure 2. The CLD of green energy investment and economic growth.
Sustainability 15 09281 g002
Figure 3. CLD of the interdependency economic growth and green energy.
Sustainability 15 09281 g003
Figure 4. The stock-flow diagram of green energy and total production.
Sustainability 15 09281 g004
Figure 5. Comparing simulation trends and real data between 2010 and 2021.
Sustainability 15 09281 g005
Figure 6. Simulation results of increasing renewable energy investment (Scenario A).
Sustainability 15 09281 g006aSustainability 15 09281 g006bSustainability 15 09281 g006c
Figure 7. Simulation results of decreasing gas imports (Scenario B).
Sustainability 15 09281 g007
Figure 8. Comparing simulation results between three scenarios.
Sustainability 15 09281 g008
Table 1. Green hydrogen trend.
Korean Hydrogen Roadmap/Year20222025203020352040
Predicted total hydrogen (ton)600031,000140,000600,0002,200,000
The percentage of green hydrogen production from total (%)1%10%15%20%30%
Predicted green hydrogen (ton)60310021,000120,000660,000
Table 2. Selected model parameters and sources.
SectorsVariableDefinitionSource
Fossil FuelFossil Fuel importThe importation of non-renewable resources[3]
Fossil fuel stockEnergy supply
Import rateThe percentage of energy import
Sale of Fossil Fuel Fossil fuel export
Rate of saleThe percentage of energy export
The Consumption of Fossil Fuel for electricityThe amount of non-renewable resources to generate electricity[45]
The Consumption rate of Fossil Fuel for energy productionThe percentage of energy consumption[3]
Non-Renewable energy consumption The amount of oil, gas, and coal consumption[46]
The tendency of non-renewable energy consumptionThe likelihood of the country to rely on non-renewable energy sources[47]
PollutionPollutionCO2 emission[48]
Pollution CoefficientThe degree or amount of pollution[9]
Health of SocietyExpenditure health society
Green EnergyGreen energy consumptionThe amount of solar, wind, hydro, tidal, geothermal, and biomass consumption[47]
The tendency of green energy consumptionThe likelihood of the country to green energy transition
PopulationFertilityThe number of live births[3]
Fertility RateThe average number of live births
MortalityThe number of deaths per 1000 individuals
Mortality RateInfant mortality rate
PopulationThe percentage of the total population
Working populationThe portion of population that is employed or actively seeking employment
Percentage of economically active population to total populationThe proportion of individuals who are employed or seeking employment
Economic growthTotal production (GDP)Gross Domestic Product (GDP)[49]
Plant FacilitiesFacility InvestmentThe average annual facility investment in renewable energy[50]
Rate of Investment in FacilityThe percentage of the plant facilities’ investment in renewable energy
Depreciation of facilitiesThe average decline of the asset’s physical value
Plant facilitiesThe average of the asset’s physical value to produce electricity
CapitalDepreciation rateThe percentage of the asset’s physical value
Other physical investmentThe investment in physical assets
The rate of other physical investmentThe average annual physical investment in other sectors
Other’s depreciation rateThe percentage of the asset’s physical value in other facilities[51]
Table 3. Scenario settings under different renewable energy production and gas import policies.
Scenario2010–20212022–2040
BaseABC
Changing the growth rate of renewable energy production (%)16%20%Base trend20%
Reducing yearly gas import (%)24%Base trend20%20%
Table 4. The changing of economic growth in third scenario.
Total Production (Trillion Dollars)Economic Growth Rate Changes (%)
Scenarios20252030203520402025–20302030–20352035–2040
Scenario A2.8345.473335
Scenario B2.72.83.54.832545
Scenario C2.42.93.95.7203446
Disclaimer/Publisher’s Note: The statements, opinions and data contained in all publications are solely those of the individual author(s) and contributor(s) and not of MDPI and/or the editor(s). MDPI and/or the editor(s) disclaim responsibility for any injury to people or property resulting from any ideas, methods, instructions or products referred to in the content.

