

Power of eWOM and Its Antecedents in Driving Customers’ Intention to Revisit: An Empirical Investigation on Five-Star Eco-Friendly Hotels in Saudi Arabia

 ,
,  ,
,
Abstract
:1. Introduction
2. Literature Review
2.1. eWOM and Sustainable Marketing Development
2.2. The Link between PQ and eWOM
2.3. The Link between PEE and eWOM
2.4. The Link between CS and eWOM
2.5. The Intermediating Role of CS in PQ–eWOM and PEE–eWOM Relationships
2.6. eWOM and Intention to Revisit (ITR)
2.7. The Intermediating Role of eWOM in the Link between PQ, PEE, CS, and ITR
3. Materials and Methods
3.1. Measures and Instrument Development
3.2. Data Collection and Sample
3.3. Data Analysis
4. Results
4.1. Common Method Variance (CMV)
4.2. Test of Normality
4.3. Analyses of the Measurement Model
4.4. Multicollinearity Statistics
4.5. Assessing the Structural Model Quality
4.6. Testing the Study Hypotheses
5. Discussion and Implications
5.1. Discussion
5.2. Theoretical Implications
5.3. Practical Implications
6. Limitations of the Study and Further Research
Author Contributions
Funding
Institutional Review Board Statement
Informed Consent Statement
Data Availability Statement
Conflicts of Interest
Appendix A

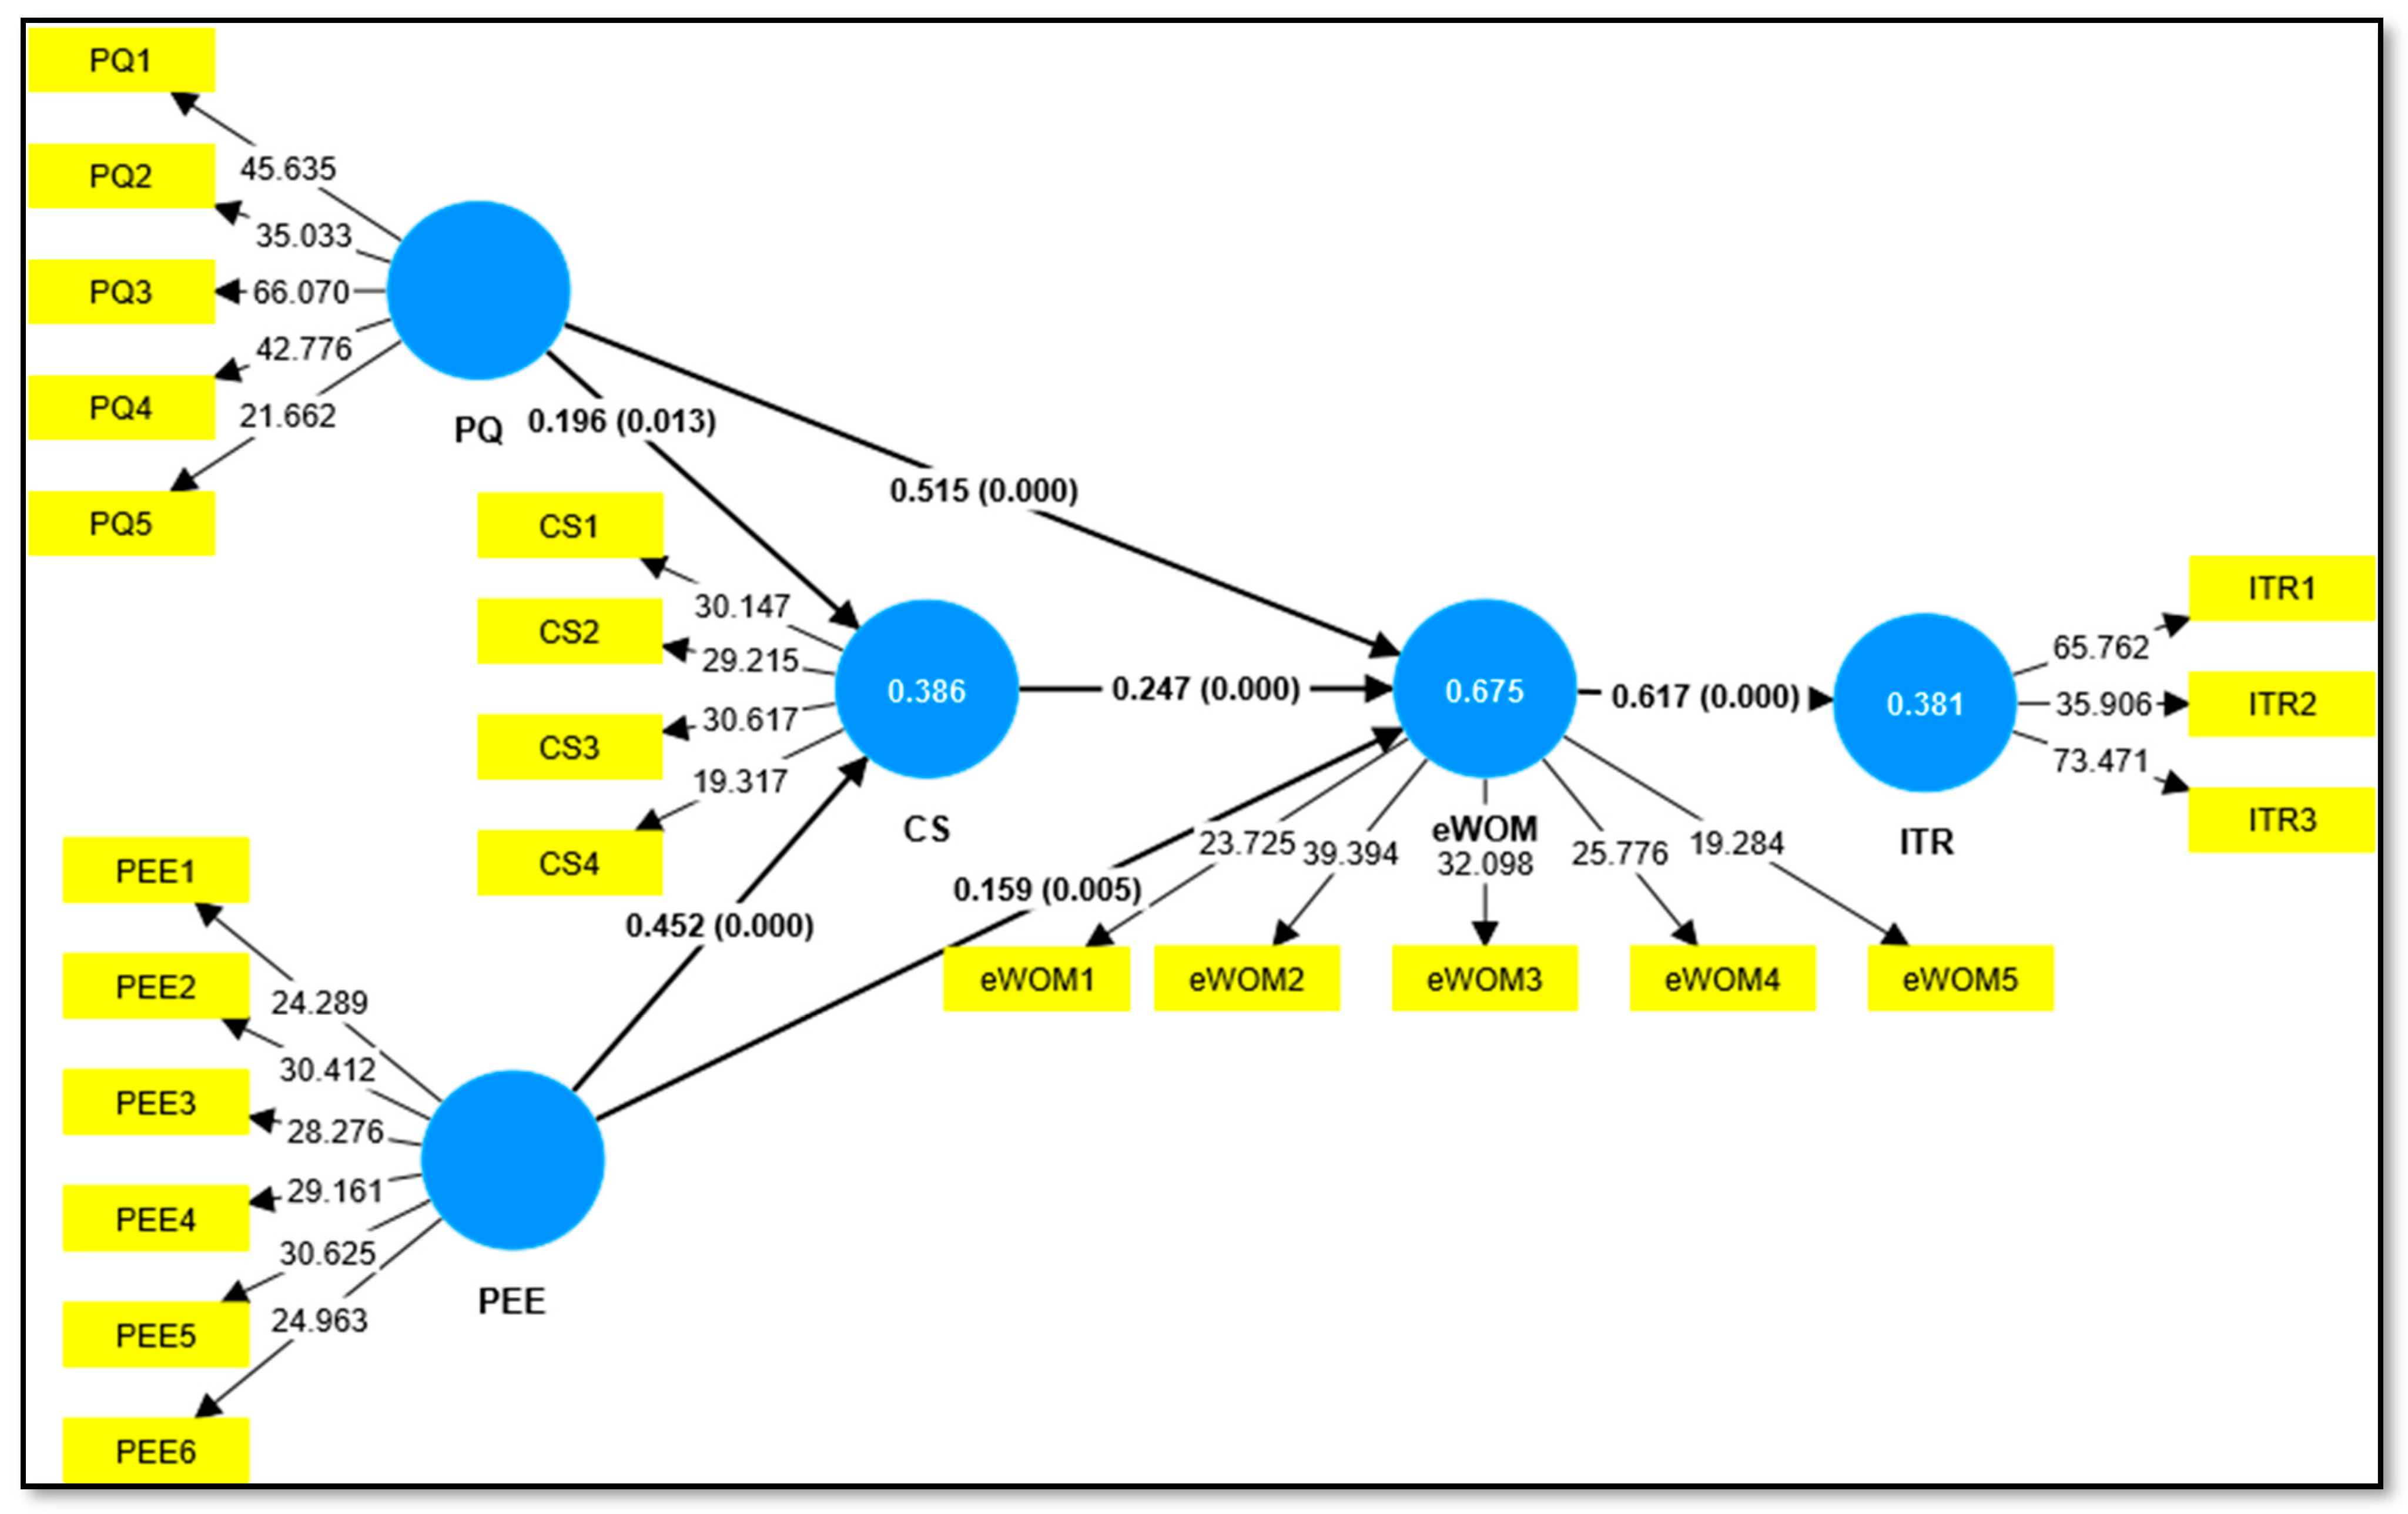
| Construct | Items | Statement |
|---|---|---|
| Perceived quality (PQ) | PQ1 | The hotel’s products and services are perceived to be dependable in meeting environmental standards. |
| PQ2 | The hotel’s product and service quality is regarded as the best benchmark. | |
| PQ3 | The products/services of the hotel are durable and eco-friendly. | |
| PQ4 | The hotel’s products/services are environmentally reputable and of professional quality. | |
| PQ5 | The hotel’s environmental image is boosted by the quality of its products/services. | |
| Positive emotional experience (PEE) | PEE1 | The hotel was exceptional. |
| PEE2 | The hotel made me feel like a VIP guest. | |
| PEE3 | The stay has helped me break away from the daily routine. | |
| PEE4 | The stay aroused my emotions. | |
| PEE5 | The stay has been memorable for me. | |
| PEE6 | I encountered positive and unique situations distinct from other hotels. | |
| Customer satisfaction (CS) | CS1 | This hotel satisfied your needs. |
| CS2 | I made a wise choice by choosing this hotel. | |
| CS3 | I enjoyed my stay at this hotel. | |
| CS4 | Generally, I am satisfied with this hotel. | |
| eWOM | eWOM1 | I have shared positive comments on my social pages about this hotel. |
| eWOM2 | I was eager to post on social media that I was staying at this hotel. | |
| eWOM3 | I wrote favorable reviews about this hotel on websites and/or travel review websites. | |
| eWOM4 | I uploaded photos and/or videos on social media about my hotel experience. | |
| eWOM5 | I became a follower of the hotel’s profile on social media. | |
| Intention to revisit (ITR) | ITR1 | I intend to revisit this hotel in the near future. |
| ITR2 | I have a strong intention to bring my family and friends to visit this hotel again. | |
| ITR3 | This hotel is the ideal destination for me if I want to enjoy an eco-friendly vacation. |
References
- Abdou, A.H.; Hassan, T.H.; Salem, A.E.; Albakhit, A.I.; Almakhayitah, M.Y.; Salama, W. The Nexus between Environmentally Sustainable Practices, Green Satisfaction, and Customer Citizenship Behavior in Eco-Friendly Hotels: Social Exchange Theory Perspective. Sustainability 2022, 14, 12791. [Google Scholar] [CrossRef]
- Manaktola, K.; Jauhari, V. Exploring consumer attitude and behaviour towards green practices in the lodging industry in India. Int. J. Contemp. Hosp. Manag. 2007, 19, 364–377. [Google Scholar] [CrossRef]
- Gerdt, S.; Wagner, E.; Schewe, G. The relationship between sustainability and customer satisfaction in hospitality: An explorative investigation using eWOM as a data source. Tour. Manag. 2019, 74, 155–172. [Google Scholar] [CrossRef]
- Hennig-Thurau, T.; Gwinner, K.P.; Walsh, G.; Gremler, D.D. Electronic word-of-mouth via consumer-opinion platforms: What motivates consumers to articulate themselves on the Internet? J. Interact. Mark. 2004, 18, 38–52. [Google Scholar] [CrossRef]
- Khwaja, M.G.; Mahmood, S.; Zaman, U. Examining the Effects of eWOM, Trust Inclination, and Information Adoption on Purchase Intentions in an Accelerated Digital Marketing Context. Information 2020, 11, 478. [Google Scholar] [CrossRef]
- Bore, I.; Rutherford, C.; Glasgow, S.; Taheri, B.; Antony, J. A systematic literature review on eWOM in the hotel industry: Current trends and suggestions for future research. Hosp. Soc. 2017, 7, 63–85. [Google Scholar] [CrossRef] [Green Version]
- Serra Cantallops, A.; Salvi, F. New consumer behavior: A review of research on eWOM and hotels. Int. J. Hosp. Manag. 2014, 36, 41–51. [Google Scholar] [CrossRef]
- Xie, K.L.; Zhang, Z.; Zhang, Z.; Singh, A.; Lee, S.K. Effects of managerial response on consumer eWOM and hotel performance: Evidence from TripAdvisor. Int. J. Contemp. Hosp. Manag. 2016, 28, 2013–2034. [Google Scholar] [CrossRef]
- Uslu, A. The relationship of service quality dimensions of restaurant enterprises with satisfaction, behavioural intention, eWOM, and the moderating effect of atmosphere. Tour. Manag. Stud. 2020, 16, 23–35. [Google Scholar] [CrossRef]
- Pandey, A.; Sahu, R. Modeling the relationship between service quality, destination attachment and eWOM intention in heritage tourism. Int. J. Tour. Cities 2020, 6, 769–784. [Google Scholar] [CrossRef]
- Redditt, J.; Orlowski, M.; Fyall, A.; Gregory, A.M.; Ro, H. Determinants of Customer Satisfaction and eWOM in the Sharing Economy: Timeshare versus Peer-to-Peer Accommodations. Tour. Hosp. 2022, 3, 225–242. [Google Scholar] [CrossRef]
- Ruiz-Alba, J.L.; Abou-Foul, M.; Nazarian, A.; Foroudi, P. Digital platforms: Customer satisfaction, eWOM and the moderating role of perceived technological innovativeness. Inf. Technol. People 2022, 35, 2470–2499. [Google Scholar] [CrossRef]
- Serra-Cantallops, A.; Ramon-Cardona, J.; Salvi, F. The impact of positive emotional experiences on eWOM generation and loyalty. Span. J. Mark.—ESIC 2018, 22, 142–162. [Google Scholar] [CrossRef]
- Pang, H. Identifying associations between mobile social media users’ perceived values, attitude, satisfaction, and eWOM engagement: The moderating role of affective factors. Telemat. Inform. 2021, 59, 101561. [Google Scholar] [CrossRef]
- Zhou, L.; Ye, S.; Pearce, P.L.; Wu, M. Refreshing hotel satisfaction studies by reconfiguring customer review data. Int. J. Hosp. Manag. 2014, 38, 1–10. [Google Scholar] [CrossRef]
- Soeid, M.; Kadir, N.; Massepe, A.N. The Influence of Electronic Word of Mouth and Attractiveness Towards Revisit Intention With Visiting Decision as an Intervening Variable (Case Study on Tourists in Makassar City). Hasanuddin J. Appl. Bus. Entrep. 2020, 3, 66–78. [Google Scholar] [CrossRef]
- Abubakar, A.M.; Ilkan, M.; Meshall Al-Tal, R.; Eluwole, K.K. eWOM, revisit intention, destination trust and gender. J. Hosp. Tour. Manag. 2017, 31, 220–227. [Google Scholar] [CrossRef]
- Sharipudin, M.S.; Cheung, M.L.; De Oliveira, M.J.; Solyom, A. The Role of Post-Stay Evaluation on eWOM and Hotel Revisit Intention among Gen Y. J. Hosp. Tour. Res. 2023, 47, 57–83. [Google Scholar] [CrossRef]
- Filieri, R.; Javornik, A.; Hang, H.; Niceta, A. Environmentally framed eWOM messages of different valence: The role of environmental concerns, moral norms, and product environmental impact. Psychol. Mark. 2021, 38, 431–454. [Google Scholar] [CrossRef]
- Seretny, M.; Seretny, A. Sustainable marketing-a new era in the responsible marketing development. Found. Manag. 2012, 4, 63–76. [Google Scholar] [CrossRef]
- Reyes-Menendez, A.; Correia, M.B.; Matos, N.; Adap, C. Understanding online consumer behavior and eWOM strategies for sustainable business management in the tourism industry. Sustainability 2020, 12, 8972. [Google Scholar] [CrossRef]
- Fahmy, M.M.; Ragab, N.E. Enhancing Enterprise Competitiveness and Sustainability Using Ewom: The Case of Egypt. Bus. Strategy Rev. 2022, 3, 29–38. [Google Scholar] [CrossRef]
- Lai, I.; Hitchcock, M.; Lu, D.; Liu, Y. The Influence of Word of Mouth on Tourism Destination Choice: Tourist–Resident Relationship and Safety Perception among Mainland Chinese Tourists Visiting Macau. Sustainability 2018, 10, 2114. [Google Scholar] [CrossRef] [Green Version]
- Jalilvand, M.; Samiei, N. The impact of electronic word of mouth on a tourism destination choice. Internet Res. 2012, 22, 591–612. [Google Scholar] [CrossRef]
- Bushara, M.A.; Abdou, A.H.; Hassan, T.H.; Sobaih, A.E.E.; Albohnayh, A.S.M.; Alshammari, W.G.; Aldoreeb, M.; Elsaed, A.A.; Elsaied, M.A. Power of Social Media Marketing: How Perceived Value Mediates the Impact on Restaurant Followers’ Purchase Intention, Willingness to Pay a Premium Price, and E-WoM? Sustainability 2023, 15, 5331. [Google Scholar] [CrossRef]
- D’Acunto, D.; Filieri, R.; Amato, S. Hotels’ environmentally-framed eWOM. The moderating role of environmental culture. Tour. Manag. 2023, 98, 104776. [Google Scholar] [CrossRef]
- Jain, V.K.; Gupta, A.; Tyagi, V.; Verma, H. Social media and green consumption behavior of millennials. J. Content Community Commun. 2020, 10, 221–230. [Google Scholar]
- Le Tan, T. The Impact of eWOM on The Intention to Choose Green Tourist Destinations for Vietnamese Tourists. J. Bus. Manag. 2023, 1, 104–120. [Google Scholar] [CrossRef]
- Martínez, P.; Herrero, Á.; García-de los Salmones, M.d.M. Determinants of eWOM on hospitality CSR issues. In Facebook we trust? J. Sustain. Tour. 2020, 28, 1479–1497. [Google Scholar] [CrossRef] [Green Version]
- Mohammed, A.; Al-Swidi, A. The mediating role of affective commitment between corporate social responsibility and eWOM in the hospitality industry. J. Sustain. Tour. 2020, 29, 570–594. [Google Scholar] [CrossRef]
- Chen, Y.; Law, R. A Review of Research on Electronic Word-of-Mouth in Hospitality and Tourism Management. Int. J. Hosp. Tour. Adm. 2016, 17, 347–372. [Google Scholar] [CrossRef]
- Zeithaml, V.A. Consumer perceptions of price, quality, and value: A means-end model and synthesis of evidence. J. Mark. 1988, 52, 2–22. [Google Scholar] [CrossRef]
- Samad, A. Examining the Impact of Perceived Service Quality Dimensions on Repurchase Intentions and Word of Mouth: A Case from Software Industry of Pakistan. IOSR J. Bus. Manag. 2014, 16, 37–41. [Google Scholar] [CrossRef]
- Serra-Cantallops, A.; Ramón Cardona, J.; Salvi, F. Antecedents of positive eWOM in hotels. Exploring the relative role of satisfaction, quality and positive emotional experiences. Int. J. Contemp. Hosp. Manag. 2020, 32, 3457–3477. [Google Scholar] [CrossRef]
- Barlas, A.; Mantis, K.; Koustelios, A. Achieving positive word-of-mouth communication: The role of perceived service quality in the context of Greek ski centres. World Leis. J. 2010, 52, 290–297. [Google Scholar] [CrossRef]
- Sánchez-González, G.; González-Fernández, A.M. The Influence of Quality on eWOM: A Digital Transformation in Hotel Management. Front. Psychol. 2021, 11, 612324. [Google Scholar] [CrossRef] [PubMed]
- Septiari, E.D. The Effect of eWOM as Mediation of Website Quality and Trust. Kinerja 2018, 22, 142–155. [Google Scholar] [CrossRef]
- Dunn, G.; Baloglu, S.; Brewer, P.; Qu, H. Consumer E-Loyalty to Online Travel Intermediaries. J. Qual. Assur. Hosp. Tour. 2009, 10, 1–22. [Google Scholar] [CrossRef]
- Bilro, R.G.; Loureiro, S.M.C.; Guerreiro, J. Exploring online customer engagement with hospitality products and its relationship with involvement, emotional states, experience and brand advocacy. J. Hosp. Mark. Manag. 2019, 28, 147–171. [Google Scholar] [CrossRef]
- Han, H.; Jeong, C. Multi-dimensions of patrons’ emotional experiences in upscale restaurants and their role in loyalty formation: Emotion scale improvement. Int. J. Hosp. Manag. 2013, 32, 59–70. [Google Scholar] [CrossRef]
- Faullant, R.; Matzler, K.; Mooradian, T.A. Personality, basic emotions, and satisfaction: Primary emotions in the mountaineering experience. Tour. Manag. 2011, 32, 1423–1430. [Google Scholar] [CrossRef]
- Grappi, S.; Montanari, F. The role of social identification and hedonism in affecting tourist re-patronizing behaviours: The case of an Italian festival. Tour. Manag. 2011, 32, 1128–1140. [Google Scholar] [CrossRef] [Green Version]
- Bigné, J.E.; Andreu, L.; Gnoth, J. The theme park experience: An analysis of pleasure, arousal and satisfaction. Tour. Manag. 2005, 26, 833–844. [Google Scholar] [CrossRef]
- Yuksel, A.; Yuksel, F. Shopping risk perceptions: Effects on tourists’ emotions, satisfaction and expressed loyalty intentions. Tour. Manag. 2007, 28, 703–713. [Google Scholar] [CrossRef]
- Han, H.; Ryu, K. The theory of repurchase decision-making (TRD): Identifying the critical factors in the post-purchase decision-making process. Int. J. Hosp. Manag. 2012, 31, 786–797. [Google Scholar] [CrossRef]
- Lii, Y.; Lee, M. The joint effects of compensation frames and price levels on service recovery of online pricing error. Manag. Serv. Qual. 2012, 22, 4–20. [Google Scholar] [CrossRef]
- Tsao, W.; Hsieh, M. Exploring how relationship quality influences positive eWOM: The importance of customer commitment. Total Qual. Manag. Bus. Excell. 2012, 23, 821–835. [Google Scholar] [CrossRef]
- Wen, J.; Hu, Y.; Kim, H.J. Impact of individual cultural values on hotel guests’ positive emotions and positive eWOM intention. Int. J. Contemp. Hosp. Manag. 2018, 30, 1769–1787. [Google Scholar] [CrossRef]
- Oliver, R.L. A Cognitive Model of the Antecedents and Consequences of Satisfaction Decisions. J. Mark. Res. 1980, 17, 460. [Google Scholar] [CrossRef]
- Anas, A.M.; Abdou, A.H.; Hassan, T.H.; Alrefae, W.M.M.; Daradkeh, F.M.; El-Amin, M.A.M.; Kegour, A.B.A.; Alboray, H.M.M. Satisfaction on the Driving Seat: Exploring the Influence of Social Media Marketing Activities on Followers’ Purchase Intention in the Restaurant Industry Context. Sustainability 2023, 15, 7207. [Google Scholar] [CrossRef]
- Bou-Llusar, J.; Camison-Zornoza, C.; Escrig-Tena, A. Measuring the relationship between firm perceived quality and customer satisfaction and its influence on purchase intentions. Total Qual. Manag. Bus. Excell. 2001, 12, 719. [Google Scholar] [CrossRef]
- Samudro, A.; Sumarwan, U.; Simanjuntak, M.; Yusuf, E. Assessing the effects of perceived quality and perceived value on customer satisfaction. Manag. Sci. Lett. 2020, 10, 1077–1084. [Google Scholar] [CrossRef]
- Xie, C.; Sun, Z. Influence of perceived quality on customer satisfaction in different stages of services. Nankai Bus. Rev. Int. 2021, 12, 258–280. [Google Scholar] [CrossRef]
- Pedraja Iglesias, M.; Jesus Yagüe Guillén, M. Perceived quality and price: Their impact on the satisfaction of restaurant customers. Int. J. Contemp. Hosp. Manag. 2004, 16, 373–379. [Google Scholar] [CrossRef]
- Joung, H.; Choi, E.; Wang, E. Effects of Perceived Quality and Perceived Value of Campus Foodservice on Customer Satisfaction: Moderating Role of Gender. J. Qual. Assur. Hosp. Tour. 2016, 17, 101–113. [Google Scholar] [CrossRef]
- Al Hawari, M.A.A. Does customer sociability matter? Differences in e-quality, e-satisfaction, and e-loyalty between introvert and extravert online banking users. J. Serv. Mark. 2014, 28, 538–546. [Google Scholar] [CrossRef]
- Hashish, M.E.; Abdou, A.H.; Mohamed, S.A.K.; Elenain, A.S.A.; Salama, W. The Nexus between Green Perceived Quality, Green Satisfaction, Green Trust, and Customers’ Green Behavioral Intentions in Eco-Friendly Hotels: A Structural Equation Modeling Approach. Int. J. Environ. Res. Public Health 2022, 19, 16195. [Google Scholar] [CrossRef] [PubMed]
- Saleem, U.; Yi, S.; Bilal, M.; Topor, D.I.; Căpuṣneanu, S. The impact of website quality on customer satisfaction and eWOM in online purchase intention: The moderating role of gender in risk-taking. Front. Psychol. 2022, 13, 945707. [Google Scholar] [CrossRef]
- Kaura, V.; Durga Prasad, C.S.; Sharma, S. Service quality, service convenience, price and fairness, customer loyalty, and the mediating role of customer satisfaction. Int. J. Bank Mark. 2015, 33, 404–422. [Google Scholar] [CrossRef]
- Mehrabian, A.; Russell, J.A. An Approach to Environmental Psychology; MIT Press: Cambridge, MA, USA, 1974. [Google Scholar]
- Bagozzi, R.P. Principles of Marketing Management; MacMillan: New York, NY, USA, 1986. [Google Scholar]
- Chang, H.; Eckman, M.; Yan, R. Application of the Stimulus-Organism-Response model to the retail environment: The role of hedonic motivation in impulse buying behavior. Int. Rev. Retail Distrib. Consum. Res. 2011, 21, 233–249. [Google Scholar] [CrossRef]
- Abdou, A.H.; Mohamed, S.A.K.; Khalil, A.A.F.; Albakhit, A.I.; Alarjani, A.J.N. Modeling the relationship between perceived service quality, tourist satisfaction, and tourists’ behavioral intentions amid COVID-19 pandemic: Evidence of yoga tourists’ perspectives. Front. Psychol. 2022, 13, 1003650. [Google Scholar] [CrossRef]
- Khan, I.; Garg, R.J.; Rahman, Z. Customer Service Experience in Hotel Operations: An Empirical Analysis. Procedia—Soc. Behav. Sci. 2015, 189, 266–274. [Google Scholar] [CrossRef] [Green Version]
- Chandra, S. The impact of customer experience toward customer satisfaction and loyalty of ciputra world surabaya. IBuss Manag. 2014, 2, 1–11. [Google Scholar]
- Ali, F.; Amin, M.; Cobanoglu, C. An Integrated Model of Service Experience, Emotions, Satisfaction, and Price Acceptance: An Empirical Analysis in the Chinese Hospitality Industry. J. Hosp. Mark. Manag. 2016, 25, 449–475. [Google Scholar] [CrossRef]
- Harahap, M.S.; Dwita, V. Effect of EWOM on Revisit Intention: Attitude and Destination Image as Mediation Variables (Study in Pasaman Regency Tourism Destinations). In Proceedings of the Fifth Padang International Conference On Economics Education, Economics, Business and Management, Accounting and Entrepreneurship (PICEEBA-5 2020), Padang, Indonesia, 18–19 July 2020; Atlantis Press: Amsterdam, The Netherlands, 2020; pp. 599–609. [Google Scholar]
- Paisri, W.; Ruanguttamanun, C.; Sujchaphong, N. Customer experience and commitment on eWOM and revisit intention: A case of Taladtongchom Thailand. Cogent Bus. Manag. 2022, 9, 2108584. [Google Scholar] [CrossRef]
- Um, S.; Chon, K.; Ro, Y. Antecedents of revisit intention. Ann. Tour. Res. 2006, 33, 1141–1158. [Google Scholar] [CrossRef]
- Mat Som, A.P.; Marzuki, A.; Yousefi, M.; AbuKhalifeh, A.N. Factors Influencing Visitors’ Revisit Behavioral Intentions: A Case Study of Sabah, Malaysia. Int. J. Mark. Stud. 2012, 4, 39. [Google Scholar] [CrossRef] [Green Version]
- Matute, J.; Polo-Redondo, Y.; Utrillas, A. The influence of EWOM characteristics on online repurchase intention. Online Inf. Rev. 2016, 40, 1090–1110. [Google Scholar] [CrossRef]
- Setiawan, P.Y.; Purbadharmaja, I.B.P.; Widanta, A.A.B.P.; Hayashi, T. How electronic word of mouth (e-WOM) triggers intention to visit through destination image, trust and satisfaction: The perception of a potential tourist in Japan and Indonesia. Online Inf. Rev. 2021, 45, 861–878. [Google Scholar] [CrossRef]
- Azhar, M.; Ali, R.; Hamid, S.; Akhtar, M.J.; Rahman, M.N. Demystifying the effect of social media eWOM on revisit intention post-COVID-19: An extension of theory of planned behavior. Future Bus. J. 2022, 8, 49. [Google Scholar] [CrossRef]
- Uslu, A.; Karabulut, A.N. Touristic Destinations’ perceived Risk and Perceived Value as Indicators of E-Wom and Revisit Intentions. Int. J. Contemp. Econ. Adm. Sci. 2018, 8, 37–63. [Google Scholar]
- Çakmakoğlu Arici, N.; Güçer, E. The Antecedents of Revisit Intention in Medical Businesses. J. Bus. Res. 2018, 10, 740–757. [Google Scholar] [CrossRef]
- Rajendran, R.P.; Arun, C.J. The effect of sport nostalgia on discrete positive emotions, positive eWOM, and revisit intention of sport tourists: A conceptual framework. Int. J. Bus. Econ. (IJBE) 2021, 6, 232–248. [Google Scholar]
- Filieri, R.; Acikgoz, F.; Ndou, V.; Dwivedi, Y. Is TripAdvisor still relevant? The influence of review credibility, review usefulness, and ease of use on consumers’ continuance intention. Int. J. Contemp. Hosp. Manag. 2021, 33, 199–223. [Google Scholar] [CrossRef]
- O’connor, P. User-Generated Content and Travel: A Case Study on Tripadvisor.com. In Information and Communication Technologies in Tourism 2008; Springer: Berlin/Heidelberg, Germany, 2008; pp. 47–58. [Google Scholar]
- Nunnally, J.C. Psychometric Theory 3E; Tata McGraw-Hill Education: New York, NY, USA, 1994. [Google Scholar]
- Hair, J.F.; Black, W.C.; Babin, B.J.; Anderson, R.E. Multivariate Data Analysis, 7th ed.; Pearson: London, UK, 2016. [Google Scholar]
- Boomsma, A. Systems under Indirect Observation: Causality, Structure, Prediction; North Holland Publishing Co.: Amsterdam, The Netherlands, 1982; pp. 149–173. [Google Scholar]
- Nancarrow, C.; Brace, I.; Wright, L.T. “Tell me Lies, Tell me Sweet Little Lies”: Dealing with Socially Desirable Responses in Market Research. Mark. Rev. 2001, 2, 55–69. [Google Scholar] [CrossRef]
- Podsakoff, P.M.; MacKenzie, S.B.; Lee, J.; Podsakoff, N.P. Common method biases in behavioral research: A critical review of the literature and recommended remedies. J. Appl. Psychol. 2003, 88, 879. [Google Scholar] [CrossRef]
- Ghasemi, A.; Zahediasl, S. Normality Tests for Statistical Analysis: A Guide for Non-Statisticians. Int. J. Endocrinol. Metab. 2012, 10, 486–489. [Google Scholar] [CrossRef] [PubMed] [Green Version]
- Mishra, P.; Pandey, C.; Singh, U.; Gupta, A.; Sahu, C.; Keshri, A. Descriptive statistics and normality tests for statistical data. Ann. Card. Anaesth. 2019, 22, 67–72. [Google Scholar] [CrossRef] [PubMed]
- Henseler, J.; Ringle, C.M.; Sinkovics, R.R. The Use of Partial Least Squares Path Modeling in International Marketing. In New Challenges to International Marketing; Emerald Group Publishing Limited: Bingley, UK, 2009; Volume 20, pp. 277–319. [Google Scholar]
- Hair, J.F.; Risher, J.J.; Sarstedt, M.; Ringle, C.M. When to use and how to report the results of PLS-SEM. Eur. Bus. Rev. 2019, 31, 2–24. [Google Scholar] [CrossRef]
- Fornell, C.; Larcker, D.F. Structural Equation Models with Unobservable Variables and Measurement Error: Algebra and Statistics. J. Mark. Res. 1981, 18, 382. [Google Scholar] [CrossRef]
- Henseler, J.; Ringle, C.M.; Sarstedt, M. A new criterion for assessing discriminant validity in variance-based structural equation modeling. J. Acad. Mark. Sci. 2015, 43, 115–135. [Google Scholar] [CrossRef] [Green Version]
- Shrestha, N. Detecting Multicollinearity in Regression Analysis. Am. J. Appl. Math. Stat. 2020, 8, 39–42. [Google Scholar] [CrossRef]
- Nagelkerke, N.J.D. A note on a general definition of the coefficient of determination. Biometrika 1991, 78, 691–692. [Google Scholar] [CrossRef]
- Cohen, J. Statistical Power Analysis for the Behavioral Sciences, 2nd ed.; Psychology Press: New York, NY, USA, 1988. [Google Scholar]
- Abolnasser, M.S.A.; Abdou, A.H.; Hassan, T.H.; Salem, A.E. Transformational Leadership, Employee Engagement, Job Satisfaction, and Psychological Well-Being among Hotel Employees after the Height of the COVID-19 Pandemic: A Serial Mediation Model. Int. J. Environ. Res. Public Health 2023, 20, 3609. [Google Scholar] [CrossRef] [PubMed]
- Alma Çallı, B.; Çallı, L.; Sarı Çallı, D.; Çallı, F. The impact of different types of service robots usage in hotels on guests’ intention to stay. J. Hosp. Tour. Technol. 2023, 14, 53–68. [Google Scholar] [CrossRef]
- Bae, S.Y.; Chang, P. The effect of coronavirus disease-19 (COVID-19) risk perception on behavioural intention towards ‘untact’ tourism in South Korea during the first wave of the pandemic. Curr. Issues Tour. 2021, 24, 1017–1035. [Google Scholar] [CrossRef]
- Choi, Y.; Choi, M.; Oh, M.; Kim, S. Service robots in hotels: Understanding the service quality perceptions of human-robot interaction. J. Hosp. Mark. Manag. 2020, 29, 613–635. [Google Scholar] [CrossRef]


| Construct | Item | Outer Loading | α | CR | AVE | Kolmogorov–Smirnov | Shapiro–Wilk | ||
|---|---|---|---|---|---|---|---|---|---|
| Statistic | Sig. | Statistic | Sig. | ||||||
| Perceived quality (PQ) Hashish et al. [57] | PQ1 | 0.824 *** | 0.879 | 0.911 | 0.674 | 0.274 | 0.000 | 0.864 | 0.000 |
| PQ2 | 0.793 *** | 0.289 | 0.000 | 0.847 | 0.000 | ||||
| PQ3 | 0.879 *** | 0.279 | 0.000 | 0.851 | 0.000 | ||||
| PQ4 | 0.852 *** | 0.267 | 0.000 | 0.853 | 0.000 | ||||
| PQ5 | 0.752 *** | 0.288 | 0.000 | 0.831 | 0.000 | ||||
| Positive emotional experiences (PEE) Serra-Cantallops et al. [13] | PEE1 | 0.741 *** | 0.855 | 0.892 | 0.580 | 0.258 | 0.000 | 0.864 | 0.000 |
| PEE2 | 0.770 *** | 0.267 | 0.000 | 0.853 | 0.000 | ||||
| PEE3 | 0.786 *** | 0.288 | 0.000 | 0.826 | 0.000 | ||||
| PEE4 | 0.774 *** | 0.277 | 0.000 | 0.841 | 0.000 | ||||
| PEE5 | 0.761 *** | 0.275 | 0.000 | 0.849 | 0.000 | ||||
| PEE6 | 0.736 *** | 0.269 | 0.000 | 0.877 | 0.000 | ||||
| Customer satisfaction (CS) Serra-Cantallops et al. [13] | CS1 | 0.809 *** | 0.784 | 0.861 | 0.609 | 0.272 | 0.000 | 0.793 | 0.000 |
| CS2 | 0.806 *** | 0.287 | 0.000 | 0.788 | 0.000 | ||||
| CS3 | 0.794 *** | 0.261 | 0.000 | 0.753 | 0.000 | ||||
| CS4 | 0.706 *** | 0.300 | 0.000 | 0.834 | 0.000 | ||||
| eWOM Serra-Cantallops et al. [13] | eWOM1 | 0.735 *** | 0.800 | 0.867 | 0.567 | 0.258 | 0.000 | 0.869 | 0.000 |
| eWOM2 | 0.786 *** | 0.310 | 0.000 | 0.816 | 0.000 | ||||
| eWOM3 | 0.789 *** | 0.288 | 0.000 | 0.848 | 0.000 | ||||
| eWOM4 | 0.747 *** | 0.257 | 0.000 | 0.839 | 0.000 | ||||
| eWOM5 | 0.705 *** | 0.258 | 0.000 | 0.853 | 0.000 | ||||
| Intention to revisit (ITR) Abubakar et al. [17] and Paisri et al. [68] | ITR1 | 0.867 *** | 0.830 | 0.898 | 0.745 | 0.274 | 0.000 | 0.864 | 0.000 |
| ITR2 | 0.832 *** | 0.256 | 0.000 | 0.878 | 0.000 | ||||
| ITR3 | 0.889 *** | 0.275 | 0.000 | 0.849 | 0.000 | ||||
| Construct | CS | ITR | PEE | PQ | eWOM |
|---|---|---|---|---|---|
| 1- Customer satisfaction | 0.780 | ||||
| 2- Intention to revisit | 0.497 | 0.863 | |||
| 3- Positive emotional experience | 0.611 | 0.729 | 0.762 | ||
| 4- Perceived quality | 0.562 | 0.661 | 0.759 | 0.821 | |
| 5- eWOM | 0.633 | 0.617 | 0.726 | 0.747 | 0.753 |
| Construct | CS | ITR | PEE | PQ | eWOM |
|---|---|---|---|---|---|
| 1- Customer satisfaction | |||||
| 2- Intention to revisit | 0.609 | ||||
| 3- Positive emotional experience | 0.744 | 0.862 | |||
| 4- Perceived quality | 0.667 | 0.763 | 0.864 | ||
| 5- eWOM | 0.789 | 0.736 | 0.857 | 0.879 |
| Construct | CS | ITR | PEE | PQ | eWOM |
|---|---|---|---|---|---|
| 1- Customer satisfaction | 1.630 | ||||
| 2- Intention to revisit | |||||
| 3- Positive emotional experience | 2.887 | 3.219 | |||
| 4- Perceived quality | 2.887 | 2.949 | |||
| 5- eWOM | 1.000 |
| Construct | R-Square | Q2predict | f2 | ||
|---|---|---|---|---|---|
| CS | eWOM | ITR | |||
| CS | 0.386 | 0.373 | 0.115 | ||
| eWOM | 0.675 | 0.619 | 0.616 | ||
| ITR | 0.381 | 0.472 | |||
| PEE | 0.115 | 0.024 | |||
| PQ | 0.022 | 0.276 | |||
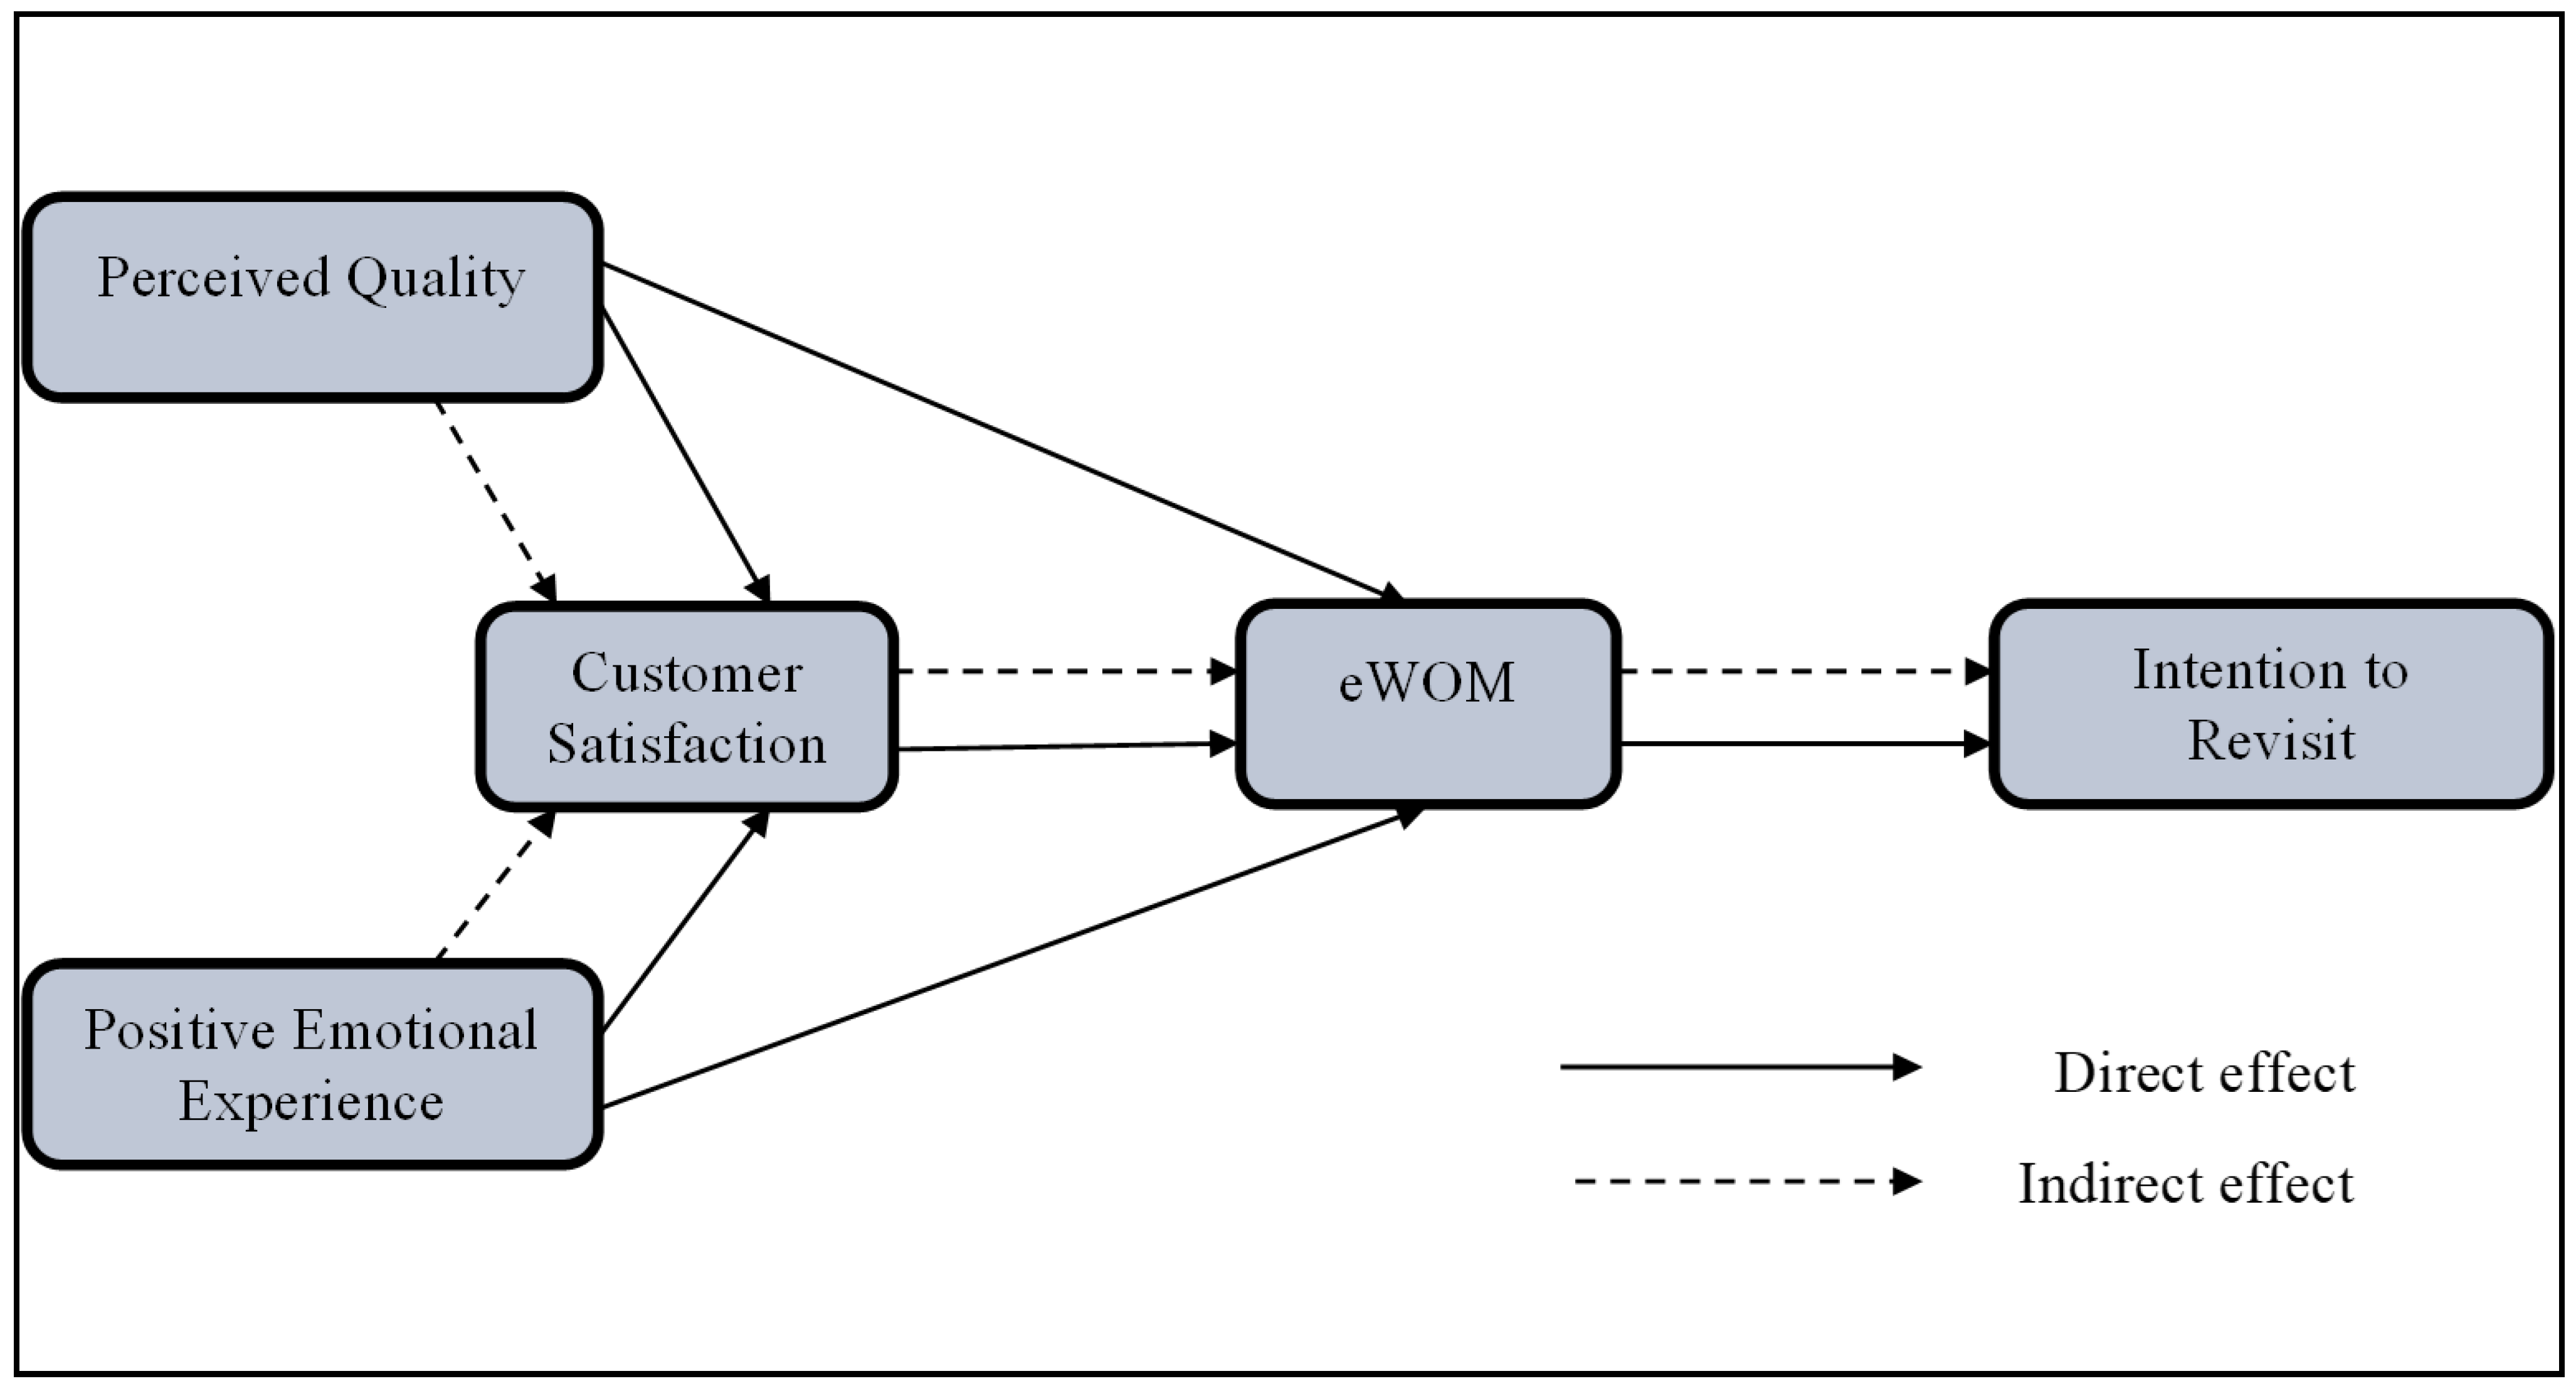
| Hypothesized Path | Path Coefficient | T Statistics | Confidence Intervals | Result | |
|---|---|---|---|---|---|
| 2.5% | 97.5% | ||||
| Direct Paths | |||||
| H1: PQ→eWOM | 0.515 *** | 9.397 | 0.408 | 0.623 | Accepted |
| H2: PEE→eWOM | 0.159 ** | 2.793 | 0.045 | 0.268 | Accepted |
| H3: CS→eWOM | 0.247 *** | 5.716 | 0.161 | 0.333 | Accepted |
| H4: PQ→CS | 0.196 * | 2.474 | 0.048 | 0.360 | Accepted |
| H6: PEE→CS | 0.452 *** | 5.371 | 0.280 | 0.607 | Accepted |
| H8: eWOM→ITR | 0.617 *** | 18.098 | 0.548 | 0.682 | Accepted |
| Indirect Paths | |||||
| H5: PQ→CS→eWOM | 0.049 * | 2.303 | 0.011 | 0.095 | Accepted |
| H7: PEE→CS→eWOM | 0.112 *** | 3.576 | 0.057 | 0.178 | Accepted |
| H9: PQ→eWOM→ITR | 0.318 *** | 8.819 | 0.252 | 0.391 | Accepted |
| H10: PEE→eWOM→ITR | 0.098 ** | 2.633 | 0.027 | 0.173 | Accepted |
| H11: CS→eWOM→ITR | 0.152 *** | 5.460 | 0.099 | 0.208 | Accepted |
Disclaimer/Publisher’s Note: The statements, opinions and data contained in all publications are solely those of the individual author(s) and contributor(s) and not of MDPI and/or the editor(s). MDPI and/or the editor(s) disclaim responsibility for any injury to people or property resulting from any ideas, methods, instructions or products referred to in the content. |
© 2023 by the authors. Licensee MDPI, Basel, Switzerland. This article is an open access article distributed under the terms and conditions of the Creative Commons Attribution (CC BY) license (https://creativecommons.org/licenses/by/4.0/).
Share and Cite
Salah, M.H.A.; Abdou, A.H.; Hassan, T.H.; El-Amin, M.A.-M.M.; Kegour, A.B.A.; Alboray, H.M.M.; Mohamed, A.S.D.; Ali, H.S.A.M.; Mohammed, E.F.A. Power of eWOM and Its Antecedents in Driving Customers’ Intention to Revisit: An Empirical Investigation on Five-Star Eco-Friendly Hotels in Saudi Arabia. Sustainability 2023, 15, 9270. https://doi.org/10.3390/su15129270
Salah MHA, Abdou AH, Hassan TH, El-Amin MA-MM, Kegour ABA, Alboray HMM, Mohamed ASD, Ali HSAM, Mohammed EFA. Power of eWOM and Its Antecedents in Driving Customers’ Intention to Revisit: An Empirical Investigation on Five-Star Eco-Friendly Hotels in Saudi Arabia. Sustainability. 2023; 15(12):9270. https://doi.org/10.3390/su15129270
Chicago/Turabian StyleSalah, Maha Hassan Ahmed, Ahmed Hassan Abdou, Thowayeb H. Hassan, Maha Abdul-Moniem Mohammed El-Amin, Adam Basheer Adam Kegour, Hanem Mostafa Mohamed Alboray, Amal Salah Darder Mohamed, Howayda Said Ahmed Mohamed Ali, and Elham Farouq Ali Mohammed. 2023. "Power of eWOM and Its Antecedents in Driving Customers’ Intention to Revisit: An Empirical Investigation on Five-Star Eco-Friendly Hotels in Saudi Arabia" Sustainability 15, no. 12: 9270. https://doi.org/10.3390/su15129270