1. Introduction
The concept of sustainable transportation systems is gaining momentum globally, with the G20 countries emphasizing the need for intelligent solutions to address public transportation issues. Intelligent Transportation Systems (ITS) offer a range of technological advancements such as vehicle networking, vehicle-road coordination, road monitoring, and modern trams [
1,
2]. However, the application of ITS in real-world settings is limited due to the specific scenarios used for simulation. In addition, the method section of several studies that propose ITS frameworks lacks clarity, with insufficient information provided on the choice of algorithms and simulation parameters. To overcome these limitations, this study proposes a novel approach to integrate the characteristics of Connected Vehicles (CV) and trams into a digital traffic control system, operating in a network environment of information exchange. By leveraging information exchange between CV, trams, and traffic signals, the proposed framework can optimize vehicle speed and signal phase duration to improve intersection fluidity. Although the proposed framework is suitable for intersections in under-saturated conditions and does not consider mixed traffic and traffic throughput, it has the potential to improve the performance of ITS in urban areas. Previous studies have explored the impact of Cooperative Driving Guidance (CDG) on traffic systems under both saturated and unsaturated traffic conditions. However, the results indicate that the effectiveness of CDG may be limited to specific driving situations, such as starting platoons at signalized intersections. Other studies have focused on optimizing traffic signals using platoon information, which can result in increased traffic throughput and reduced energy consumption. The proposed framework builds on these studies by providing a centralized computing station that facilitates the information exchange between different transportation modes, resulting in an optimized adjustment plan for vehicle speed and signal phase duration. Overall, the proposed framework has the potential to improve the performance of ITS in urban areas by leveraging the exchange of digital information between different transportation modes. While the framework has been developed and tested for specific scenarios, further research is required to evaluate its performance in a real-world setting with mixed traffic and varying levels of traffic throughput.
The remainder of this article is structured as follows:
Section 2 reviews related work,
Section 3 highlights literature review limitations,
Section 4 describes the proposed framework,
Section 5 describes the methods,
Section 6 assesses the proposed framework,
Section 7 discusses the work limitations, and
Section 8 concludes and suggests future research perspectives.
2. Related Work
2.1. Collaborative Optimization for Trams and CV
This literature review explores recent articles on Collaborative Trajectories Optimization (CTO) for trams and Connected Vehicles (CV) [
3,
4] at signalized intersections. One of the main themes in the literature is the use of communication and connectivity technologies to enable CTO. Many articles have proposed the use of Vehicle-to-Vehicle (V2V) or Vehicle-to-Infrastructure (V2I) communication to allow vehicles to share information and coordinate their movements, as highlighted in a comprehensive survey on Cooperative Intersection Management for CVs [
5]. Additionally, some authors propose the use of V2I communication to optimize the trajectories of trams and connected vehicles at signalized intersections [
6]. In Ref. [
7], the authors presented an efficient multilevel probabilistic model for detecting abnormal traffic in wireless sensor networks. Their model utilizes a combination of multiple probabilistic classifiers and achieves high accuracy in detecting abnormal traffic with low computational complexity. In Ref. [
8], the authors proposed an efficient monitoring system called EMS to detect non-cooperative nodes in IoT-based vehicular delay-tolerant networks (VDTNs). EMS utilizes a combination of machine learning [
9] and statistical analysis techniques and achieves high accuracy in detecting non-cooperative nodes in VDTNs.
Another theme in the literature is the use of optimization and control techniques, such as model predictive control, optimal control, and game theory, to enable CTO. For instance, the authors in Ref. [
10] proposed the use of model predictive control to optimize the trajectories of trams and connected vehicles at signalized intersections in real-time. Many papers also proposed the usage of simulation to evaluate different CTO algorithms, as shown in Ref. [
11], where the authors used a simulation model to evaluate the performance of different CTO algorithms in terms of safety and efficiency. Additionally, several articles have proposed the integration of CTO with other technologies such as advanced traffic management systems and Advanced Driver Assistance Systems (ADAS), as highlighted in Ref. [
11].
Some articles have adopted mathematical modeling to solve the problem of collaborative control of CVs such as in Ref. [
12] where the authors focused on the development of a mathematical model and numerical simulation to analyze the dynamic behavior of a train and pantograph-catenary system with consideration of nonlinear contact. They proposed a new method for calculating the contact stiffness and present the results of numerical simulations to demonstrate the effectiveness of the proposed method. In addition, the authors in Ref. [
13] have discussed the nonlinear dynamic analysis of a single-layer spherical lattice shell using the exact solution method. They proposed a new method for solving the governing equations of motion and present numerical simulations to demonstrate the effectiveness of the proposed method.
Lastly, CTO for tram and connected vehicles have also been studied and evaluated at various real-world intersections in Ref. [
14], in which the authors implemented a CTO algorithm at a real-world intersection and evaluated its performance in terms of safety and efficiency.
The literature on CTO for Tram and Connected Vehicles at Signalized Intersections highlights the potential of using communication and connectivity technologies, optimization and control techniques, simulation, and integration with other technologies to improve the performance of vehicles at signalized intersections.
Additionally, Transit Signal Priority (TSP) is a technology that adjusts traffic signals in favor of public transit vehicles, such as buses and streetcars, to reduce the delay and improve the speed and reliability of transit services. TSP systems use various techniques such as extending green lights, shortening red lights, or holding green lights for transit vehicles in order to reduce the delay and improve the performance of transit services. Recent studies have shown that TSP systems can significantly improve the speed, reliability, and capacity of public transit, as demonstrated in Refs. [
15,
16]. Furthermore, in Ref. [
17] the authors summarize the benefits and costs of bus rapid transit systems and TSP, and conclude that they can significantly improve the efficiency and effectiveness of public transit. However, it is important to note that the design, deployment, and control of TSP systems are context-dependent and depend on various factors such as traffic volume, public transit demand, and intersection geometry.
2.2. Genetic Algorithm for Trams and CV
There has been a growing interest in using genetic algorithms (GAs) for tram and CV trajectory optimization in recent years. A GA-based approach was proposed for optimizing the operation of trams in a mixed traffic environment [
18]. The approach optimizes the tram’s speed and headway to reduce the delay caused by trams at intersections and improve the overall traffic efficiency. The authors showed that their GA-based approach can effectively reduce the delay caused by trams at intersections and improve the overall traffic efficiency. In Ref. [
19], a GA-based approach was proposed for optimizing the trajectory of CVs in a mixed traffic environment. The authors used a GA to optimize the vehicle’s speed and headway to reduce the delay caused by CVs at intersections and improve the overall traffic efficiency. The results of the study showed that the GA-based approach can effectively reduce the delay caused by CVs at intersections and improve the overall traffic efficiency. In Ref. [
20], a GA-based approach was proposed for optimizing the trajectory of connected vehicles in a mixed traffic environment. The authors used a GA to optimize the vehicle’s speed and headway to reduce the delay caused by CVs at intersections and improve the overall traffic efficiency. The results of the study showed that the GA-based approach can effectively reduce the delay caused by CVs at intersections and improve the overall traffic efficiency. Overall, these studies demonstrate the potential of using GAs for optimizing the trajectory of trams and CVs in mixed traffic environments to reduce the delay and improve overall traffic efficiency.
2.3. General Workflow
Genetic algorithms (GAs) and collaborative optimization (CO) are optimization techniques used in tram and connected vehicle trajectory optimization. GAs create an initial population of solutions and apply genetic operators to optimize the vehicle’s speed and headway to reduce delay. CO involves multiple agents working together to optimize a shared objective and may involve communication technologies such as V2V or V2I and optimization techniques such as model predictive control and game theory. Simulation is used to evaluate different CO algorithms, and real-world evaluations have been conducted to evaluate their performance in terms of safety and efficiency.
2.4. Limitation in the Related Work
The limitations of the articles on (CTO) detailed in the literature review section for tram and connected vehicles at signalized intersections can vary depending on the specific study. However, some common limitations that may be found in these articles include:
Limited scope: Some studies may focus on a specific aspect of CTO, such as the use of a particular communication technology, and may not consider other factors that may impact the performance of CTO;
Simplified assumptions: Many articles rely on simplified assumptions such as deterministic models, which may not always reflect the complex and uncertain nature of real-world traffic;
Lack of real-world data: Many studies use simulated data, which may not always accurately represent real-world traffic conditions, and lack of real-world data might limit the generalization of the results;
Limited evaluation: Some articles may not have a thorough evaluation of the proposed CTO algorithms and techniques, and may not have been tested extensively;
Limited scalability: Some CTO algorithms may not be able to scale to handle large-scale and complex traffic scenarios;
Lack of communication coverage: some CTO algorithm and communication technologies only work under complete coverage of V2V or V2I infrastructure, which might limit its generalization;
Privacy concerns: privacy concerns may arise from the use of communication technologies to share information between vehicles, especially with personal data.
This work tried to build a compromise that covers these limitations.
3. Motivations and Contributions
Motivated by the limitations highlighted in
Section 2.4, we introduce our contributions in detail, as follows:
A Transit Signal Priority (TSP) system and guidance framework were introduced to minimize unintended delays for trams while also minimizing negative impacts on Connected Vehicles (CV), passenger comfort, energy consumption, and overall travel time;
A collaborative optimization system and an improved genetic algorithm were used to adjust both the signal phase duration and the operating path;
The impact of tram length on Transit Signal Priority (TSP) was considered in the analysis;
A digital integration of trams, CVs, and intersection signals was proposed;
A collaborative optimization algorithm running in an online mode was developed to deal with the cross-transportation mode optimization problem;
An enhanced elitist genetic algorithm based on adaptive thought was proposed to improve efficiency and avoid local optima;
The proposed system was validated using a simulated case, showing that the TSP strategy effectively reduced right-of-way wastage and minimized conflicts between trams and CVs;
The research contributed to the development of a more efficient and sustainable transportation system for the future;
The study addressed a pervasive problem in connected transportation networks;
The proposed method set the stage for future research focusing on incorporating the method into arterial intersection traffic signal control systems and addressing mixed traffic comprised of connected and unconnected vehicles.
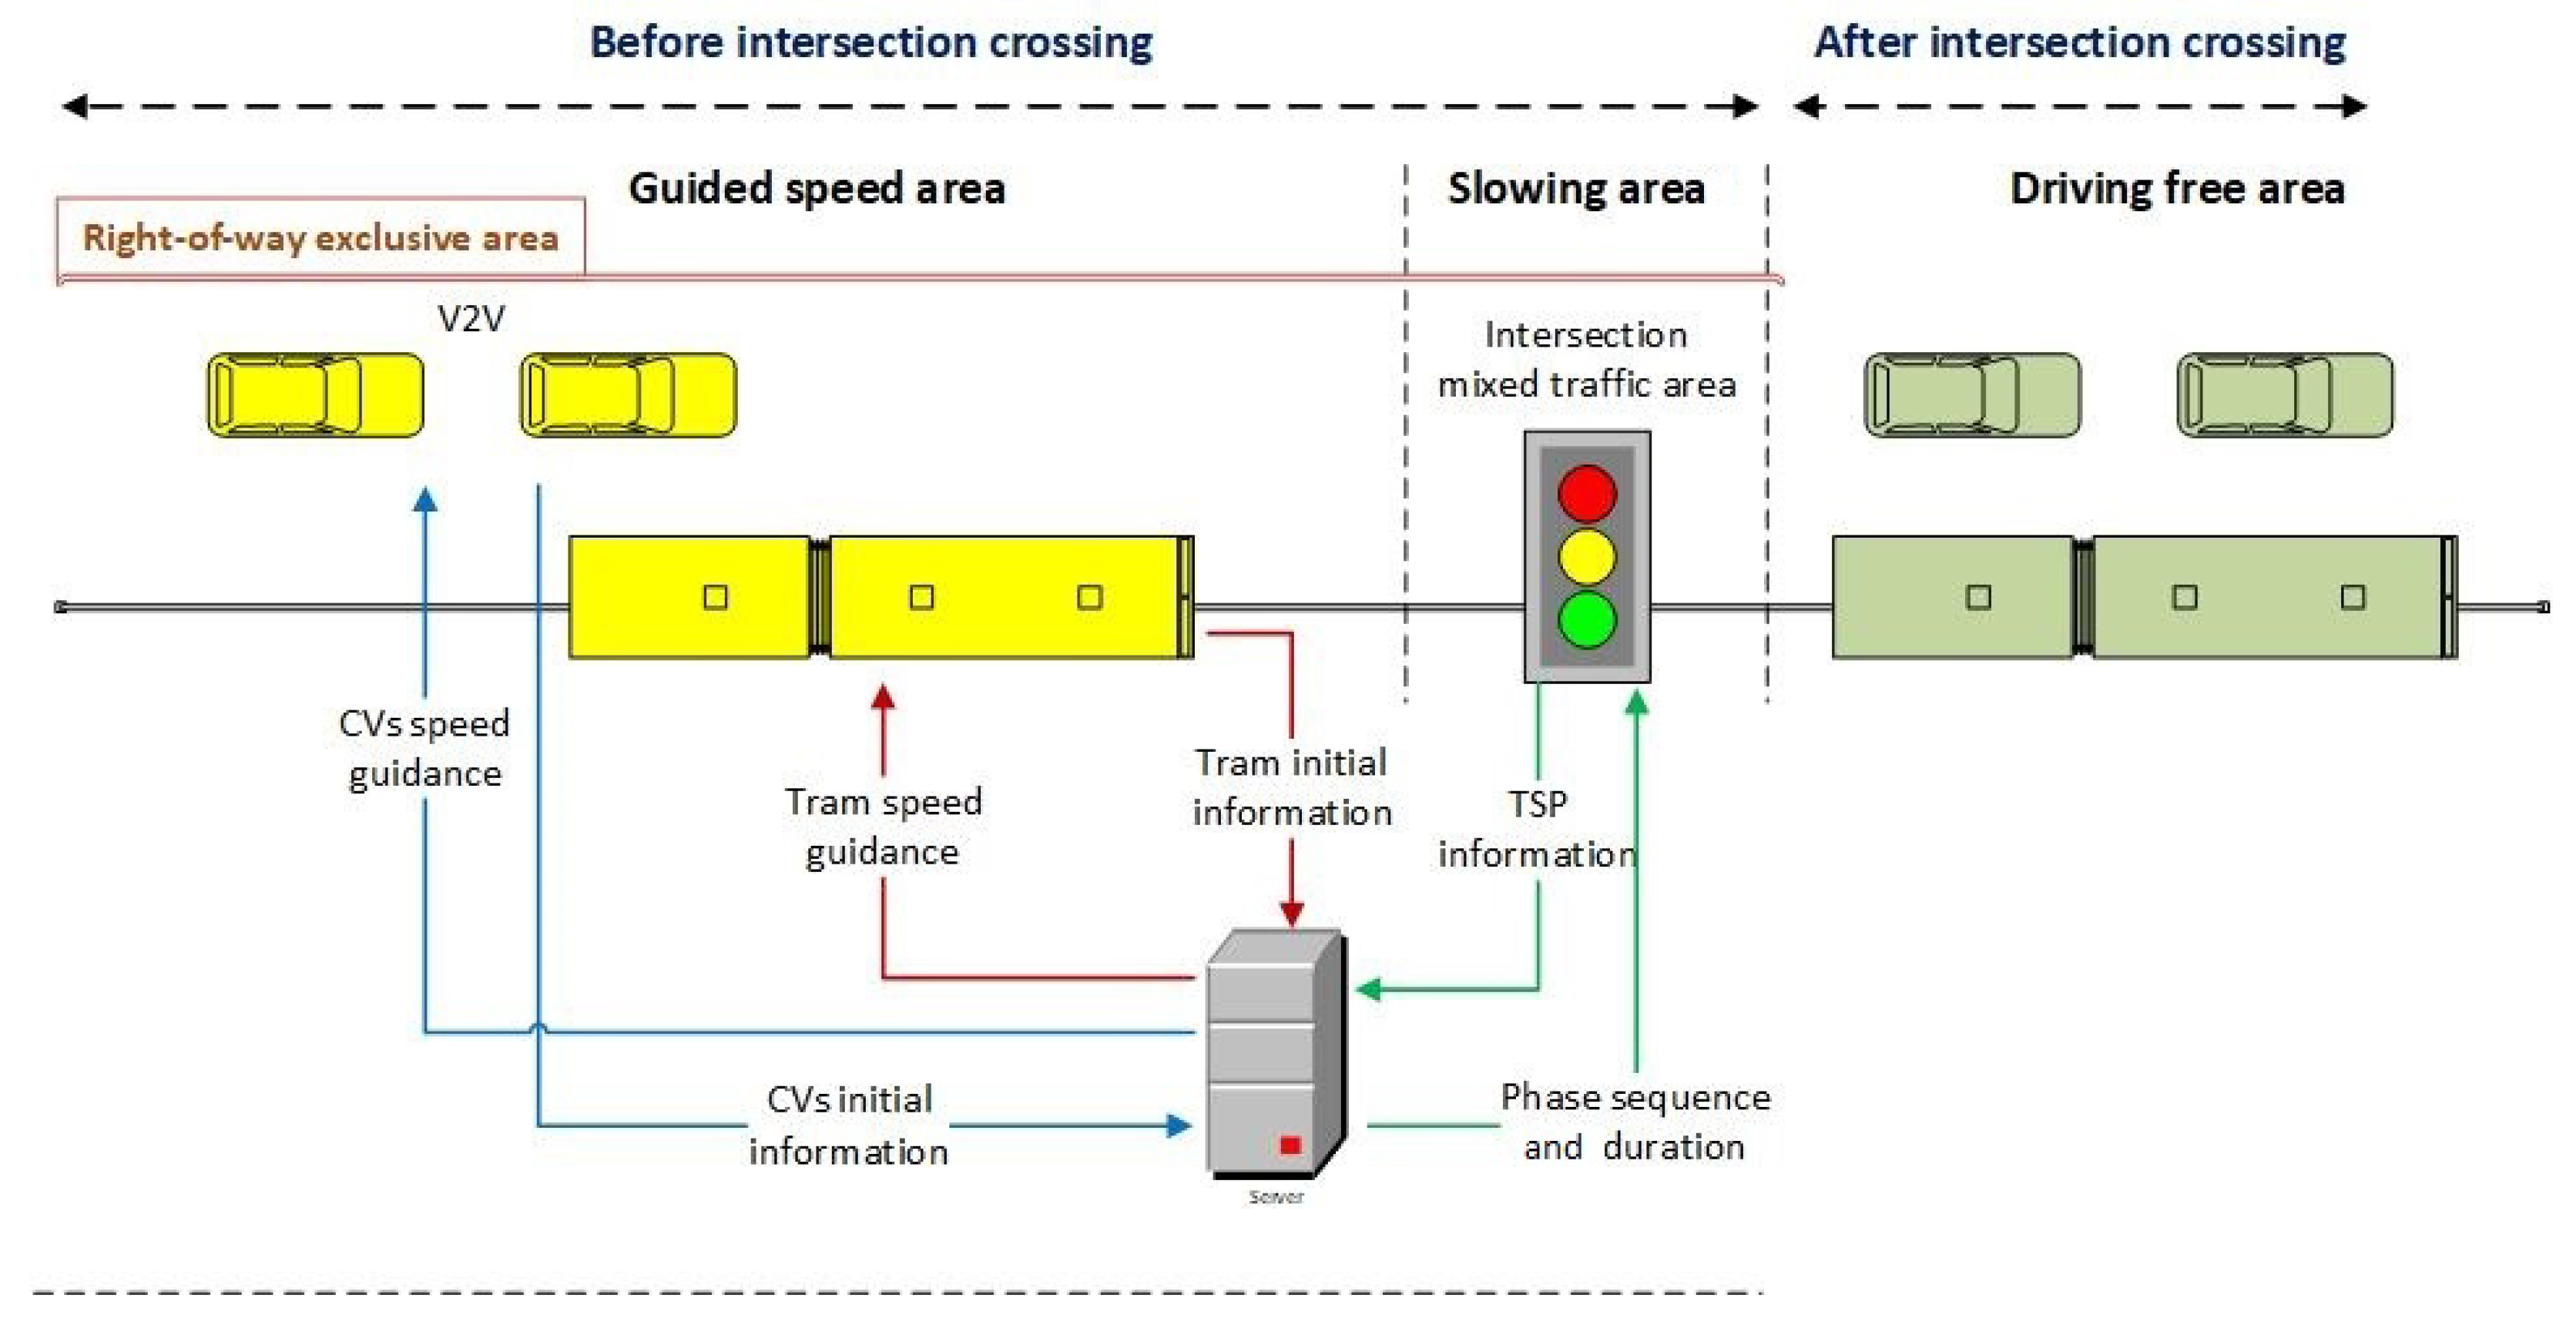
4. Framework
An overview of the proposed connected vehicle model is illustrated in
Figure 1. More details are provided in the following subsections.
4.1. Tram Dynamics Model
The speed and operation of trams are influenced by a range of factors, including traction and braking force, as well as speed limits in different segments and intersections [
21]. In the mode of semi-exclusive right-of-way, trams have exclusive right-of-way in the segment. They share this segment with road users at intersections. To optimize the tram’s operation, a “quickest curve” has been identified as the fastest possible operating curve that minimizes travel time [
22]. Previous studies have developed an ideal tram control curve by combining maximum traction, coast, cruise, and maximum braking, but the running social vehicles conditions within intersections must also be taken into account [
23]. As a result, the traction and braking forces do not have to be at maximum levels, and the trams’ running duration in the section can be flexibly adjusted by modifying these forces. In this research, the trams’ traction acceleration, braking acceleration, coast acceleration, and basic resistance are computed by examining their traction, coast, and braking states. The simulation employs a traditional discrete technique, dividing the entire running process into numerous segments of uniformly accelerated rectilinear motion having a step length set at 0.1 s. At each time step, the initial speed, distance, and acceleration are considered to calculate the tram’s discrete speed and distance, given the tram’s fully loaded mass and coefficients for maximum traction and braking forces, rolling resistance, and air resistance [
21,
23]. This approach enables a more accurate assessment of the trams’ performance in complex variable acceleration motions, allowing for the identification of optimal operating conditions for the transit system.
4.2. Connected Vehicle Guidance Model
To construct a dynamic vehicle fleet between different CVs, researchers have usually tended to use a V2V communication system [
24]. Using V2V as an intelligent road traffic technology, the suggested control system utilizes two layers, where the upper layer deals with the leading vehicle, while the lower layer deals with the coordination control. Both layers seek to adjust and control the vehicles’ speed. The timing data is collected by the leading vehicle via traffic signals through a V2I communication system, which computes its required speed based on a set of predefined rules. It is assumed in this work that both CVs and trams sharing the same phase are allowed to cross the intersection based on the priority defined by TSP. This assumption makes sure that the right-of-way is totally occupied and avoids any wasting of utilization. In addition, V2I prevents contributes to avoiding the waste coming from hesitancy caused by drivers.
A car-following model developed in Ref. [
25] has been adopted in this work. The model represents an Intelligent Driver Model combining vehicle speed parameters including instantaneous acceleration, maximum acceleration, desired speed, instantaneous speed, relative speed, gap, and desired gap. A safe gap is considered and set to 1.5 m, and the comfort deceleration and reaction time is set to 0.8 s. The upper control scheme is initiated when the lead vehicle enters the speed guidance area, and it begins by computing the minimum time required to arrive at the intersection. This time is defined as the time it takes to achieve the intersection when the target speed is equal to or greater than the maximum speed limit. The calculation takes into account various variables such as the initial speed of the lead vehicle, the speed limit of connected vehicles (CVs), the comfort acceleration, and the length of the speed guide area, to determine the time separating the arrival of the stop line at the intersection and the lead vehicle’s arrival time in the guidance area.
The proposed system can determine the maximum number of vehicles that can cross the intersection during the remaining green light period if the estimated arrival time falls within a green light period. In case the following vehicles cannot cross the intersection, the guide vehicles that are following will be directed to cross the intersection at the next green light. The number of vehicles allowed to cross is based on several variables such as the end of the green light phase, the actual distance between the vehicles, the targeted speed, the vehicle length, and the instance of entering the guidance zone.
The actual distance is calculated when the fleet state is in equilibrium. If the estimated arrival time falls within a red light period, which means that the upstream vehicle considers the green light phase through which the downstream vehicle passes to be on a red light phase, the entire transit time is updated. The update integrates the values of the start of the next green light and the time between the lead vehicle’s arrival in the guidance area. The distance compensation planning computation yields the speed guide curve after calculating the average goal speed from the length of the guidance region and the entire transit time.
The distance compensation planning is crucial to the speed guiding system. After entering the speed guidance zone, the distance and time required for a CV to reach the junction are calculated. If the CV speed is less or greater than the intended average speed associated with the lead vehicle when it reaches the guidance area, the driving distance is adjusted using accelerating and decelerating guidance. The goal speed is established by calculating the distance and duration of the acceleration or deceleration, ensuring that the target speed meets the speed limit requirement.
The proposed model assumes the presence of both CVs and trams, which are as follows:
The vehicles within the network are connected to the internet;
The connected vehicles chose the road before the speed guidance zone. They only changed their speed in that zone;
All connected vehicles traveling in different directions have similar distances from the intersection;
Only early green, phase insertion, and green extension are considered by TSP;
The delay in communication is ignored;
Both CVs and trams strictly follow the scheme of speed guidance;
The road surface slope affecting CVs and the tram is not considered;
Additional tram resistance is not considered.
4.3. System Objectives
The proposed system represents a holistic approach to address the optimality required by trams and CVs through a set of objectives. These objectives could be summarized as follows:
Minimize users’ transit times on the road; The overall transit time comprises the time spent by all CVs and tram passengers traveling in all directions from the start of the guiding area to the intersection’s stop line. A coefficient of weight is included in the model to focus on minimizing tram passenger transit time in order to support public transportation and ensure the priority of public transportation right-of-way. The objective for overall transit time is expressed using a set of variables. These variables include the number of fully loaded trams, the full load ratio, the braking duration, cruise, traction, the transit time of a given CV, and the number of passengers in this CV. The public transport right-of-way priority is ensured using weights to avoid the system’s bias and to let it focalize on minimizing the tram’s transit time;
Minimize energy consumption; The overall consumption of energy includes the consumption of CVs. The index of energy consumption of the tram is represented by a variable allowing the conversion from electrical energy into mechanical energy during the traction. It also has a variable allowing for the opposite conversion (from mechanical to energy) during the braking phase. In addition, the power of the auxiliary system is considered. A model dedicated to Vehicle Specific Power is chosen for CV energy consumption model. This choice can be justified through its resemblance to the tram energy consumption model. A vehicle on a flat road has an energy consumption depending on its actual acceleration and current speed [
26]. The energy consumption of CVs includes the energy consumption of both the guidance zone and recovery stage of velocity. Finally, the index of energy consumption is considered and represented using the mass of CV, which is set to 1.2t;
Maximize road comfort;
The average absolute value of the acceleration rate is calculated in this phase. The result of this rate is associated with the gauge of the passenger’s level of discomfort. Minimizing the determined objective value will result in:
Minimizing the vehicle’s impact rate on the passengers;
Minimizing the determined objective value;
A smoother the vehicle;
More passengers’ satisfaction.
Since tram passengers and CVs passengers have the same comfort criteria, their passenger comfort is measured jointly while considering the statistical overall acceleration.
4.4. TSP Constraints
A set of constraints are considered to represent the TSP information and the operation status of the tram. These constraints are described as follows:
Constraint-1: The cruise (tram cruising speed) and coast (tram end speed in coast mode) speeds do not exceed the maximum tram speed at sections; In addition, they must be greater than the maximum tram speed at the intersection; Constraint-1 provides the train running status information;
Constraint-2: The coast traveled distance must be less than or equal to the braking and traction traveled distance summed together;
Constraint-3: The duration of the green extension is less than or equal to the maximum duration of TSP, which is multiplied by a binary variable that determines whether a cycle uses TSP. Here, 1 means TSP is in use while 0 means no TSP is in use. Constraint-2 and Constraint-3 provide the duration of 3 TSPs for trams;
Constraint-4: The difference between the starting of a phase and the end of the tram green light phase in the current cycle must be greater than or equal to the minimum interval of phase insertion;
Constraint-5: The difference between the starting of a green phase provided to the tram in the next cycle and the end of the phase insertion in the current cycle must be greater than or equal to the minimum interval dedicated to phase insertion. Constraint-4 and Constraint-5 constrain the phase insertion interval. One marks the shortest period between the tram’s beginning of the phase and the end of its initial green light phase. The remaining reflects the minimum gap between the start time of the following cycle’s original green light phase and the end time of phase insertion;
Constraint-5: is considered as a phase protection restriction to prevent phase insertion, which splits the inserted phase’s green light duration into two pieces. This type of inappropriate phase insertion will reduce intersection safety and efficiency. As a result, the phase insertion occurrence period must encompass the start of phase 3 or phase 4.
4.5. Mathematical Model
The mathematical model [
27] including objective and constraints discussed and detailed in
Section 4.3 and
Section 4.4 is detailed as follows:
where the variables are described as follows:
x is the decision vector;
is the objective function;
, , and are the weight coefficients for transit time, energy consumption, and road comfort, respectively;
is the transit time for the fully loaded trams;
is the energy consumption of trams;
is the average absolute value of the acceleration rate;
is the coast traveled distance;
is the braking traveled distance;
is the traction traveled distance;
is the duration of the green extension;
is the maximum duration of TSP;
is the binary variable that determines whether a cycle uses TSP (1 for TSP in use and 0 for no TSP use);
, , and are the duration of three TSPs for trams;
is the starting of a phase;
is the end of the tram green light phase in the current cycle;
is the minimum interval of phase insertion;
is the starting of a green phase provided to the tram in the next cycle;
is the end of the phase insertion in the current cycle;
and are the start of phase 3 and phase 4, respectively;
to are the constraints.
5. Methods
The proposed way to calculate TSP using the proposed model and genetic algorithm is to first encode the decision variables and constraints into a chromosome representation. This can be done by mapping the variables and constraints to different genes in the chromosome. For example, the decision variables such as , , and can be encoded as real numbers, while the binary variable can be encoded as a binary gene. The constraints can also be encoded as genes with specific bounds or ranges. Next, a fitness function can be defined that assigns a fitness value to each chromosome based on how well it satisfies the constraints and optimizes the objective function. This can be done by evaluating the chromosome’s genes against the constraints and calculating a score based on how well the constraints are satisfied. Additionally, the objective function can be evaluated using the chromosome’s genes and the weight coefficients. Finally, the genetic algorithm can be applied using the encoded chromosomes and fitness function. This can involve initializing a population of chromosomes, applying genetic operators such as crossover and mutation to generate new chromosomes, and selecting the best chromosomes based on their fitness values to form the next generation. This process can be repeated iteratively until a satisfactory TSP solution is found.
5.1. Genetic Algorithm
The basic steps of the suggested genetic are as follows:
Initialization: Create an initial population of candidate solutions (i.e., decision vectors) randomly;
Evaluation: Evaluate the objective function and constraints for each candidate solution in the population;
Selection: Select the best candidate solutions from the current population based on their objective function values. These solutions will be used for the next generation;
Crossover: Combine the selected solutions to create new solutions by exchanging some of their components. The crossover operator can be chosen based on the problem’s characteristics;
Mutation: Introduce random variations into the new solutions created by the crossover operator;
Repeat steps 2–5 for a fixed number of generations or until a satisfactory solution is found;
The best solution found in the final population is the optimal solution for the problem.
5.1.1. Chromosome Encoding
The chromosome encoding for this suggested model include:
Binary representation for the binary variable ;
Real-valued numbers for the decision variables , , , , , , , , , , ;
Integer values for the number of fully loaded trams and the number of passengers in the CV;
Real-valued numbers for the full load ratio, braking duration, cruise, traction, transit time of the CV, and the mass of the CV;
Real-valued numbers for the weight coefficients , , and ;
Real-valued numbers for the minimum interval of phase insertion and the maximum duration of TSP ;
Real-valued numbers for , , .
The encoded chromosome can then be used as an input to a genetic algorithm, where the decision variables and coefficients can be decoded and used to evaluate the objective function and constraints. The genetic algorithm can then optimize the chromosome by evolving it through the process of selection, crossover, and mutation to find the optimal solution of the model.
5.1.2. Speed Guidance for CV
The speed guidance of CV using TSP can be calculated using the following equation:
where:
is the speed guidance of the CV,
is the maximum speed of the CV,
is the TSP gain factor,
is the green time phase duration provided by TSP, and
is the estimated time of arrival of the CV at the intersection.
This equation calculates the speed guidance of the CV by subtracting the TSP gain factor multiplied by the difference between the green phase duration provided by TSP and the estimated time of arrival of the CV at the intersection from the maximum speed of the CV. The TSP gain factor is a constant that can be adjusted to optimize the performance of the algorithm.
5.1.3. Fitness Function
A fitness function for this algorithm could be defined as:
where
is the objective function defined in the model, and
is a value added for each constraint violation. The
value could be calculated as the product of a predefined penalty coefficient and the number of constraints violated by the solution represented by the chromosome
x. For example, if
x violates two constraints, then the value of
would be:
The fitness function is used to evaluate the quality of solutions represented by chromosomes. The higher the value of the fitness function, the better the solution. The genetic algorithm will then use this fitness function to select the best solutions and combine them to generate new, better solutions in the next generation. The process continues until a satisfactory solution is found or a stopping criterion is met.
6. Experimentation
6.1. Case Study
The traffic phases plan, volume and lanes number, and settings of the simulated intersection are detailed in
Table 1,
Table 2 and
Table 3, respectively. The layout of the tram is central and the platform adopted is of asymmetric side type. The data collected before the case analysis includes the timing information, lane number, volume of traffic, the level of service of each entry at the intersection, and capacity.
In the east-west direction, 10 lanes are adopted while in the north-south direction, 8 lanes are at the simulated intersection. The tram is located at the east-west side of the intersection. In order to simplify the calculation, we merged multi-lanes in the same direction into a single lane. We considered the traffic volume as the quotient of the original traffic volume in that direction along with the number of the original lanes. The conventional method is compared with the target guidance method designed in this paper to analyze the effect of cooperative optimization of tram and CVs.
6.2. Comparison and Performance
In this work, 100 is considered as the number of iterations where the optimal plan is obtained when the last iteration is reached (refer to
Figure 2. The conventional and suggested target guidance techniques are benchmarked to analyze the impact of cooperative optimization on tram and CVs.
When the tram is delayed and cannot cross the intersection while following the corresponding phase as previously planned, it is hence necessary to control the tram to reduce its delay. Usually, the conventional method provides TSP for trams based on the arrival time of the tram to minimize the public transport delay. In the case in which the conventional method is considered, and at the beginning of the second phase of the cycle, the tram attends the intersection. Here, the TSP type has a green extension. In the case of using the target guidance method, the tram arrives at the beginning of the third phase of the cycle to the intersection. Here, the TSP type is phase insertion. For the TSP set at the third phase, CVs are not affected when crossing the intersection during the second phase. The TSP of tram is set at the third phase, and multiple CVs are able to cross the intersection with the tram in the TSP. This process allows for a reduction of the traffic pressure of the first phase during the upcoming cycle. In addition, the CVs overall trajectory is optimized when they are passing in the first phase.
6.3. Results and Applicability
As shown in
Figure 3, an increase of 45.8% occurs in the transit time of trams, while a decrease of 17.1% is experienced by the overall transit time of trams and CVs. The performance of the proposed guidance system was evaluated in terms of energy consumption and passenger comfort, as illustrated in
Figure 4 and
Figure 5. The results showed that the system enabled trams and CVs to operate smoothly, without the need for excessive acceleration and deceleration. The total energy consumption of both vehicle types was reduced by 34.7%, and the non-comfort index was reduced by 25.8%.
To assess the applicability of the system, the passenger ratio between trams and other vehicles was analyzed, taking into account differences between workdays and non-workdays, and between peak and off-peak hours, as depicted in
Figure 6. It was found that the conventional method led to a decreasing trend in the objective function value as the proportion of tram passengers increased. In contrast, the optimization of the proposed model yielded a zigzag pattern of first decreasing, then increasing, and finally decreasing objective function values.
Overall, the path plan generated by the proposed guidance system was effective in reducing the overall transit time, energy consumption, and comfort index for different types of intersection users.
6.4. Findings
The study conducted experiments to compare the performance of the conventional method and the proposed target guidance method in optimizing traffic flow for trams and connected vehicles (CVs). The simulated intersection had 10 lanes in the east-west direction and 8 lanes in the north-south direction, with the tram located on the east-west side. The proposed method was able to optimize the traffic flow by controlling the tram delay and reducing traffic pressure in the first phase. The results showed that the proposed method was able to reduce the transit time for trams by 45.8% and the overall transit time for trams and CVs by 17.1% compared to the conventional method. Additionally, the system was able to reduce energy consumption by 34.7% and the non-comfort index by 25.8%. Furthermore, the proposed method was analyzed in terms of its applicability, specifically regarding the passenger ratio between trams and other vehicles during peak and off-peak hours on workdays and non-workdays. The results showed that the conventional method led to a decreasing trend in the objective function value as the proportion of tram passengers increased. In contrast, the proposed method yielded a zigzag pattern of first decreasing, then increasing, and finally decreasing objective function values, indicating its applicability across different types of intersection users. Overall, the proposed guidance system proved to be effective in reducing the overall transit time, energy consumption, and non-comfort index for trams and CVs at the simulated intersection.
7. Discussion
Our article has succeeded to find a compromise that covers the limitations of the related work mentioned in
Section 2.4. Therefore, we highlight in the following what limitations are covered totally and/or partially:
Introducing a Transit Signal Priority (TSP) system and a guidance framework that seeks to minimize unintended delays for trams while minimizing the negative impact on Connected Vehicles (CV), passenger comfort, energy consumption, and overall travel time;
Employing a collaborative optimization system and an improved genetic algorithm to adjust both the signal phase duration and the operating path;
Considering the impact of tram length on Transit Signal Priority (TSP) in the analysis;
Proposing a digital integration of trams, CVs, and intersection signals;
Developing a collaborative optimization algorithm running in an online mode to deal with the cross-transportation mode optimization problem;
Proposing an enhanced elitist genetic algorithm that is based on adaptive thought to improve efficiency and avoid local optima;
Validating the proposed system using a simulated case and demonstrating that the TSP strategy effectively reduced right-of-way wastage and minimized conflicts between trams and CVs;
Contributing to the development of a more efficient and sustainable transportation system for the future;
Providing a solution to a pervasive problem in connected transportation networks;
Setting the stage for future research that will focus on incorporating the proposed method into arterial intersection traffic signal control systems and addressing mixed traffic comprised of connected and unconnected vehicles.
Multiple choices have been considered in this work based on our expertise in the intelligent transportation domain. We highlight the most important ones and provide the reasons behind them:
The choice of the genetic algorithm was based on our prior research and the characteristics of the optimization problem in the bimodal transportation system [
27].
We determined the parameters in the simulation settings based on the characteristics of the transportation system and our prior knowledge of the behavior of passengers [
1,
28].
The simulation data has been provided by experts in the field. Through a simulation-optimization process, we have obtained the values mentioned in
Table 2.
However, our work has limitations. These limitations are related to the approach of Collaborative Trajectories Optimization (CTO), which are as follows:
Performance metrics: The CTO approach optimizes performance metrics that are relevant only in specific traffic situations, namely under-saturated conditions when roads are empty. This is not representative of typical urban traffic conditions, where the relevant metric to assess intersection performance would be the traffic throughput;
Space constraints: The CTO approach assumes that there is enough free space on the roads to avoid stopping, as defined by the speed guide zones. This may not be feasible in dense urban areas, where road space is limited;
Connectivity requirements: The CTO approach requires connectivity between trams, traffic signals, and all vehicles, and the ability of traffic signal phases to be adapted in real-time. This is a major requirement for the approach to be effective;
Mixed traffic scenario: The CTO approach assumes that all vehicles are connected and does not address the scenario where there is a mix of connected and unconnected vehicles. This is a crucial limitation as a 100% penetration rate of connectivity is not a realistic scenario;
Testing required: The CTO approach is only suitable for intersections in under-saturated conditions and may not perform well in dense urban areas with low space for guidance zones. Further testing is required to determine its effectiveness in these scenarios.
8. Conclusions
In this study, we proposed a Transit Signal Priority (TSP) strategy to address the right-of-way conflicts that occur between connected vehicles (CVs) and trams within intersections. Our objective was to minimize transit time, energy consumption, and discomfort levels by constructing corresponding objective functions. To achieve this goal, we proposed a digital integration of trams, CVs, and intersection signals, and developed a collaborative optimization algorithm running in an online mode to deal with the cross-transportation mode optimization problem. To improve efficiency and avoid local optima, we proposed an enhanced elitist genetic algorithm. Our study identified several managerial points that could aid in the successful implementation of TSP. These include investing in technology, developing training programs, collaborating with stakeholders, launching pilot projects, creating public awareness, and continuous monitoring and evaluation. Investing in the latest technology is crucial to making TSP a reality. Governments and public transportation agencies should also develop training programs to educate stakeholders about TSP’s objectives and operation. Collaboration with government agencies, public transportation companies, and technology providers will be essential to the success of TSP. Pilot projects should be launched to test TSP’s feasibility, identify potential challenges, and evaluate its effectiveness before implementing it on a larger scale.Public transportation users should be informed about TSP’s benefits through awareness campaigns, and its success should depend on continuous monitoring and evaluation. Our proposed TSP strategy effectively reduced right-of-way wastage and minimized conflicts between trams and CVs, demonstrating its good applicability. Future research will focus on incorporating our method into arterial intersection traffic signal control systems and address mixed traffic comprised of connected and unconnected vehicles. Overall, TSP has the potential to improve travel time, safety, and emissions in urban transportation, and our study provides a foundation for its successful implementation. In this study, we aimed to address the issue of right-of-way conflicts that occur between connected vehicles (CVs) and trams within intersections. We also considered the impact of tram length on Transit Signal Priority (TSP) in our analysis. Our objective was to minimize transit time, energy consumption, and discomfort levels by constructing corresponding objective functions. To achieve this goal, we proposed a digital integration of trams, CVs, and intersection signals, and developed a collaborative optimization algorithm running in an online mode to deal with the cross-transportation mode optimization problem. To improve efficiency and avoid local optima, we proposed an enhanced elitist genetic algorithm. The latter is mainly based on adaptive thought. We validated the proposed system using a simulated case and found that our TSP strategy effectively reduced right-of-way wastage and minimized conflicts between trams and CVs. The results demonstrate the good applicability of our proposed method. Future research will focus on incorporating our method into arterial intersection traffic signal control systems and address mixed traffic comprised of connected and unconnected vehicles.
Author Contributions
Conceptualization, A.L.; methodology, A.L.; software, A.L.; validation, A.L.; resources, E.K; writing—original draft preparation, A.L.; writing—review and editing, A.L.; visualization, A.L.; project administration, E.K.; funding acquisition, A.L. and E.K. All authors have read and agreed to the published version of the manuscript.
Funding
This research was funded by the Deanship of Scientific Research at Prince Sattam bin Abdulaziz University, Grant number IF2/PSAU/2022/01/21571.
Institutional Review Board Statement
Not applicable.
Informed Consent Statement
Not applicable.
Data Availability Statement
The data could be provided upon reasonable request from the corresponding author via email contact (
a.louati@psau.edu.sa).
Acknowledgments
The authors extend their appreciation to the Deputyship for Research and Innovation, Ministry of Education in Saudi Arabia for funding this research work through the project number (IF2/PSAU/2022/01/21571).
Conflicts of Interest
The authors declare no conflict of interest.
References
- Louati, A. A hybridization of deep learning techniques to predict and control traffic disturbances. Artif. Intell. Rev. 2020, 53, 5675–5704. [Google Scholar] [CrossRef]
- Louati, A.; Elkosantini, S.; Darmoul, S.; Ben Said, L. An immune memory inspired case-based reasoning system to control interrupted flow at a signalized intersection. Artif. Intell. Rev. 2019, 52, 2099–2129. [Google Scholar] [CrossRef]
- Wang, Y.; Zhao, M.; Yu, X.; Hu, Y.; Zheng, P.; Hua, W.; Zhang, L.; Hu, S.; Guo, J. Real-time joint traffic state and model parameter estimation on freeways with fixed sensors and connected vehicles: State-of-the-art overview, methods, and case studies. Transp. Res. Part C Emerg. Technol. 2022, 134, 103444. [Google Scholar] [CrossRef]
- Rehman, G.U.; Haq, M.I.U.; Zubair, M.; Mahmood, Z.; Singh, M.; Singh, D. Misbehavior of nodes in IoT based vehicular delay tolerant networks VDTNs. Multimed. Tools Appl. 2023, 82, 7841–7859. [Google Scholar] [CrossRef]
- Gholamhosseinian, A.; Seitz, J. A comprehensive survey on cooperative intersection management for heterogeneous connected vehicles. IEEE Access 2022, 10, 7937–7972. [Google Scholar] [CrossRef]
- Yang, H.; Almutairi, F.; Rakha, H. Eco-driving at signalized intersections: A multiple signal optimization approach. IEEE Trans. Intell. Transp. Syst. 2020, 22, 2943–2955. [Google Scholar] [CrossRef] [Green Version]
- Khan, M.A.; Nasralla, M.M.; Umar, M.M.; Khan, S.; Choudhury, N. An Efficient Multilevel Probabilistic Model for Abnormal Traffic Detection in Wireless Sensor Networks. Sensors 2022, 22, 410. [Google Scholar] [CrossRef]
- Rehman, G.U.; Zubair, M.; Qasim, I.; Badshah, A.; Mahmood, Z.; Aslam, M.; Jilani, S.F. EMS: Efficient Monitoring System to Detect Non-Cooperative Nodes in IoT-Based Vehicular Delay Tolerant Networks (VDTNs). Sensors 2023, 23, 99. [Google Scholar] [CrossRef]
- Louati, A.; Lahyani, R.; Aldaej, A.; Aldumaykhi, A.; Otai, S. Price forecasting for real estate using machine learning: A case study on Riyadh city. Concurr. Comput. Pract. Exp. 2022, 34, e6748. [Google Scholar] [CrossRef]
- Zang, Z.; Gong, J.; Li, Z.; Song, J.; Liu, H.; Gong, C.; Zhang, X.; Li, Y. Formation Trajectory Tracking Control of UTVs: A Coupling Multi-Objective Iterative Distributed Model Predictive Control Approach. IEEE Trans. Intell. Veh. 2022, 8, 2222–2232. [Google Scholar] [CrossRef]
- Li, S.; Shu, K.; Chen, C.; Cao, D. Planning and decision-making for connected autonomous vehicles at road intersections: A review. Chin. J. Mech. Eng. 2021, 34, 133. [Google Scholar] [CrossRef]
- Zhai, C.; Wu, W.; Xiao, Y. Cooperative car-following control with electronic throttle and perceived headway errors on gyroidal roads. Appl. Math. Model. 2022, 108, 770–786. [Google Scholar] [CrossRef]
- Zhai, C.; Wu, W. Designing continuous delay feedback control for lattice hydrodynamic model under cyber-attacks and connected vehicle environment. Commun. Nonlinear Sci. Numer. Simul. 2021, 95, 105667. [Google Scholar] [CrossRef]
- Minh, Q.T.; Le Hoang, H.N.; Nhat, M.N. Effective traffic routing for urban transportation capacity and safety enhancement. IATSS Res. 2022, 46, 574–585. [Google Scholar] [CrossRef]
- Stewart, A.F.; Attanucci, J.P.; Wilson, N.H. Ridership response to incremental Bus Rapid Transit upgrades in North America: Demographic and network effects. Transp. Res. Rec. 2015, 2538, 37–43. [Google Scholar] [CrossRef]
- Wu, K.; Guler, S.I. Estimating the impacts of transit signal priority on intersection operations: A moving bottleneck approach. Transp. Res. Part C Emerg. Technol. 2019, 105, 346–358. [Google Scholar] [CrossRef]
- Ni, Y.C.; Lo, H.H.; Hsu, Y.T.; Huang, H.J. Exploring the effects of passive transit signal priority design on bus rapid transit operation: A microsimulation-based optimization approach. Transp. Lett. 2022, 14, 14–27. [Google Scholar] [CrossRef]
- Li, Y.; Chen, K. Optimization of Modern Tram Operation Line Based on Genetic Algorithm. In Proceedings of the 2017 5th International Conference on Frontiers of Manufacturing Science and Measuring Technology (FMSMT 2017), Taiyuan, China, 24–25 June 2017; Atlantis Press: Paris, France, 2017; pp. 897–902. [Google Scholar]
- Li, Z.; Pourmehrab, M.; Elefteriadou, L.; Ranka, S. Intersection control optimization for automated vehicles using genetic algorithm. J. Transp. Eng. Part A Syst. 2018, 144, 04018074. [Google Scholar] [CrossRef]
- Zhou, W.; Bai, Y.; Li, J.; Zhou, Y.; Li, T. Integrated optimization of tram schedule and signal priority at intersections to minimize person delay. J. Adv. Transp. 2019, 2019, 4802967. [Google Scholar] [CrossRef] [Green Version]
- Wu, C.; Lu, S.; Xue, F.; Jiang, L.; Chen, M.; Yang, J. A Two-Step Method for Energy-Efficient Train Operation, Timetabling, and Onboard Energy Storage Device Management. IEEE Trans. Transp. Electrif. 2021, 7, 1822–1833. [Google Scholar] [CrossRef]
- Su, S.; Wang, X.; Cao, Y.; Yin, J. An energy-efficient train operation approach by integrating the metro timetabling and eco-driving. IEEE Trans. Intell. Transp. Syst. 2020, 21, 4252–4268. [Google Scholar] [CrossRef]
- Bärmann, A.; Gemander, P.; Hager, L.; Nöth, F.; Schneider, O. EETTlib—Energy-efficient train timetabling library. Networks 2023, 81, 51–74. [Google Scholar] [CrossRef]
- Koufakis, A.M.; Rigas, E.S.; Bassiliades, N.; Ramchurn, S.D. Offline and online electric vehicle charging scheduling with V2V energy transfer. IEEE Trans. Intell. Transp. Syst. 2019, 21, 2128–2138. [Google Scholar] [CrossRef]
- Alhariqi, A.; Gu, Z.; Saberi, M. Calibration of the intelligent driver model (IDM) with adaptive parameters for mixed autonomy traffic using experimental trajectory data. Transp. B Transp. Dyn. 2022, 10, 421–440. [Google Scholar] [CrossRef]
- Li, D.; Zhang, Z.; Zhou, L.; Liu, P.; Wang, Z.; Deng, J. Multi-time-step and multi-parameter prediction for real-world proton exchange membrane fuel cell vehicles (PEMFCVs) toward fault prognosis and energy consumption prediction. Appl. Energy 2022, 325, 119703. [Google Scholar] [CrossRef]
- Louati, A.; Lahyani, R.; Aldaej, A.; Mellouli, R.; Nusir, M. Mixed integer linear programming models to solve a real-life vehicle routing problem with pickup and delivery. Appl. Sci. 2021, 11, 9551. [Google Scholar] [CrossRef]
- Louati, A.; Louati, H.; Li, Z. Deep learning and case-based reasoning for predictive and adaptive traffic emergency management. J. Supercomput. 2021, 77, 4389–4418. [Google Scholar] [CrossRef]
| Disclaimer/Publisher’s Note: The statements, opinions and data contained in all publications are solely those of the individual author(s) and contributor(s) and not of MDPI and/or the editor(s). MDPI and/or the editor(s) disclaim responsibility for any injury to people or property resulting from any ideas, methods, instructions or products referred to in the content. |
© 2023 by the authors. Licensee MDPI, Basel, Switzerland. This article is an open access article distributed under the terms and conditions of the Creative Commons Attribution (CC BY) license (https://creativecommons.org/licenses/by/4.0/).


