Article

Environmental Regulation and Corporate Environmental Performance: Evidence from Chinese Carbon Emission Trading Pilot

1
School of Economics and Management, Beijing Jiaotong University, Beijing 100044, China
2
Graduate School of International Social Sciences, Yokohama National University, Yokohama 240-8501, Japan
*
Authors to whom correspondence should be addressed.
Sustainability 2023, 15(11), 8518; https://doi.org/10.3390/su15118518
Submission received: 19 April 2023 / Revised: 19 May 2023 / Accepted: 22 May 2023 / Published: 24 May 2023
(This article belongs to the Special Issue Corporate Social Responsibility and Environmental Resource Governance)

Abstract

:
Using archival data of the Chinese A-share listed companies from 2011 to 2019, this article empirically examines the effectiveness of the Chinese carbon emission trading pilot, from the perspective of market-ranked corporate environmental performance. The main findings demonstrate that compared with companies not selected in the pilot, regulated enterprises tend to create a better environmental performance after the implementation of the pilot. Second, regarding the two possible influential channels, the lowering production level channel is empirically supported, while the increasing green investment channel lacks salient explanatory power. Finally, greater environmental pressures and better internal control quality present synergistic effects in amplifying the positive connection between the pilot and corporate environmental performance. Our conclusions remain valid under various robustness test methods. Potential related directions for future research are also identified and suggested in this article. Overall, using the Chinese carbon emission trading pilot as a research setting, our study provides additional evidence on whether and how environmental regulations affect corporate environmental performance ranked by capital market participants.

1. Introduction

Since the rapid development of industrialization, socio-economic growth has long been accompanied by large emissions of various carbon compounds, gradually causing climate concerns of the greenhouse effect worldwide. According to the statistics published by the UN’s Intergovernmental Panel on Climate Change (IPCC), during the 2010 to 2019 period, average annual global greenhouse gas emissions were at the highest level in human history, with a total emission of around 59 billion tons in 2019 [1]. While the average annual growth rate of the emission amount has declined from 2.1% in the 2000s to 1.3% in the 2010s, it is still essential for governments to work closely and take measures to mitigate the negative impacts of greenhouse gases [1]. Among the identified greenhouse gases, carbon dioxide is by all means the most widespread and the most influential [2], making governments and international organizations put more efforts in creating available carbon-reducing technologies, as well as regulatory policies. For instance, starting from 2005, the European Union launched its Emissions Trading Scheme (EU-ETS) to use market mechanisms in chasing the EU’s carbon-reducing targets. For now, the EU-ETS has become the world largest carbon emission trading market, providing practical guidance for countries using similar market-incentive methods for carbon emission regulations. Moreover, the United Nations Climate Change Conference in Glasgow (COP26) has made progress on setting rules for building the global carbon trading market, making the effectiveness of the carbon trading mechanism in helping achieve the carbon-reducing goal a highly discussed topic, in both the academic and practical areas.
Following the practical experience of EU-ETS, the Chinese government began to prepare the Chinese carbon emission trading pilot in 2011, and successively launched its pilot trading system from 2013 in eight provinces or cities. This includes Beijing, Shanghai, Shenzhen, Guangdong and Tianjin in 2013, Hubei and Chongqing in 2014, and finally Fujian in 2016 [
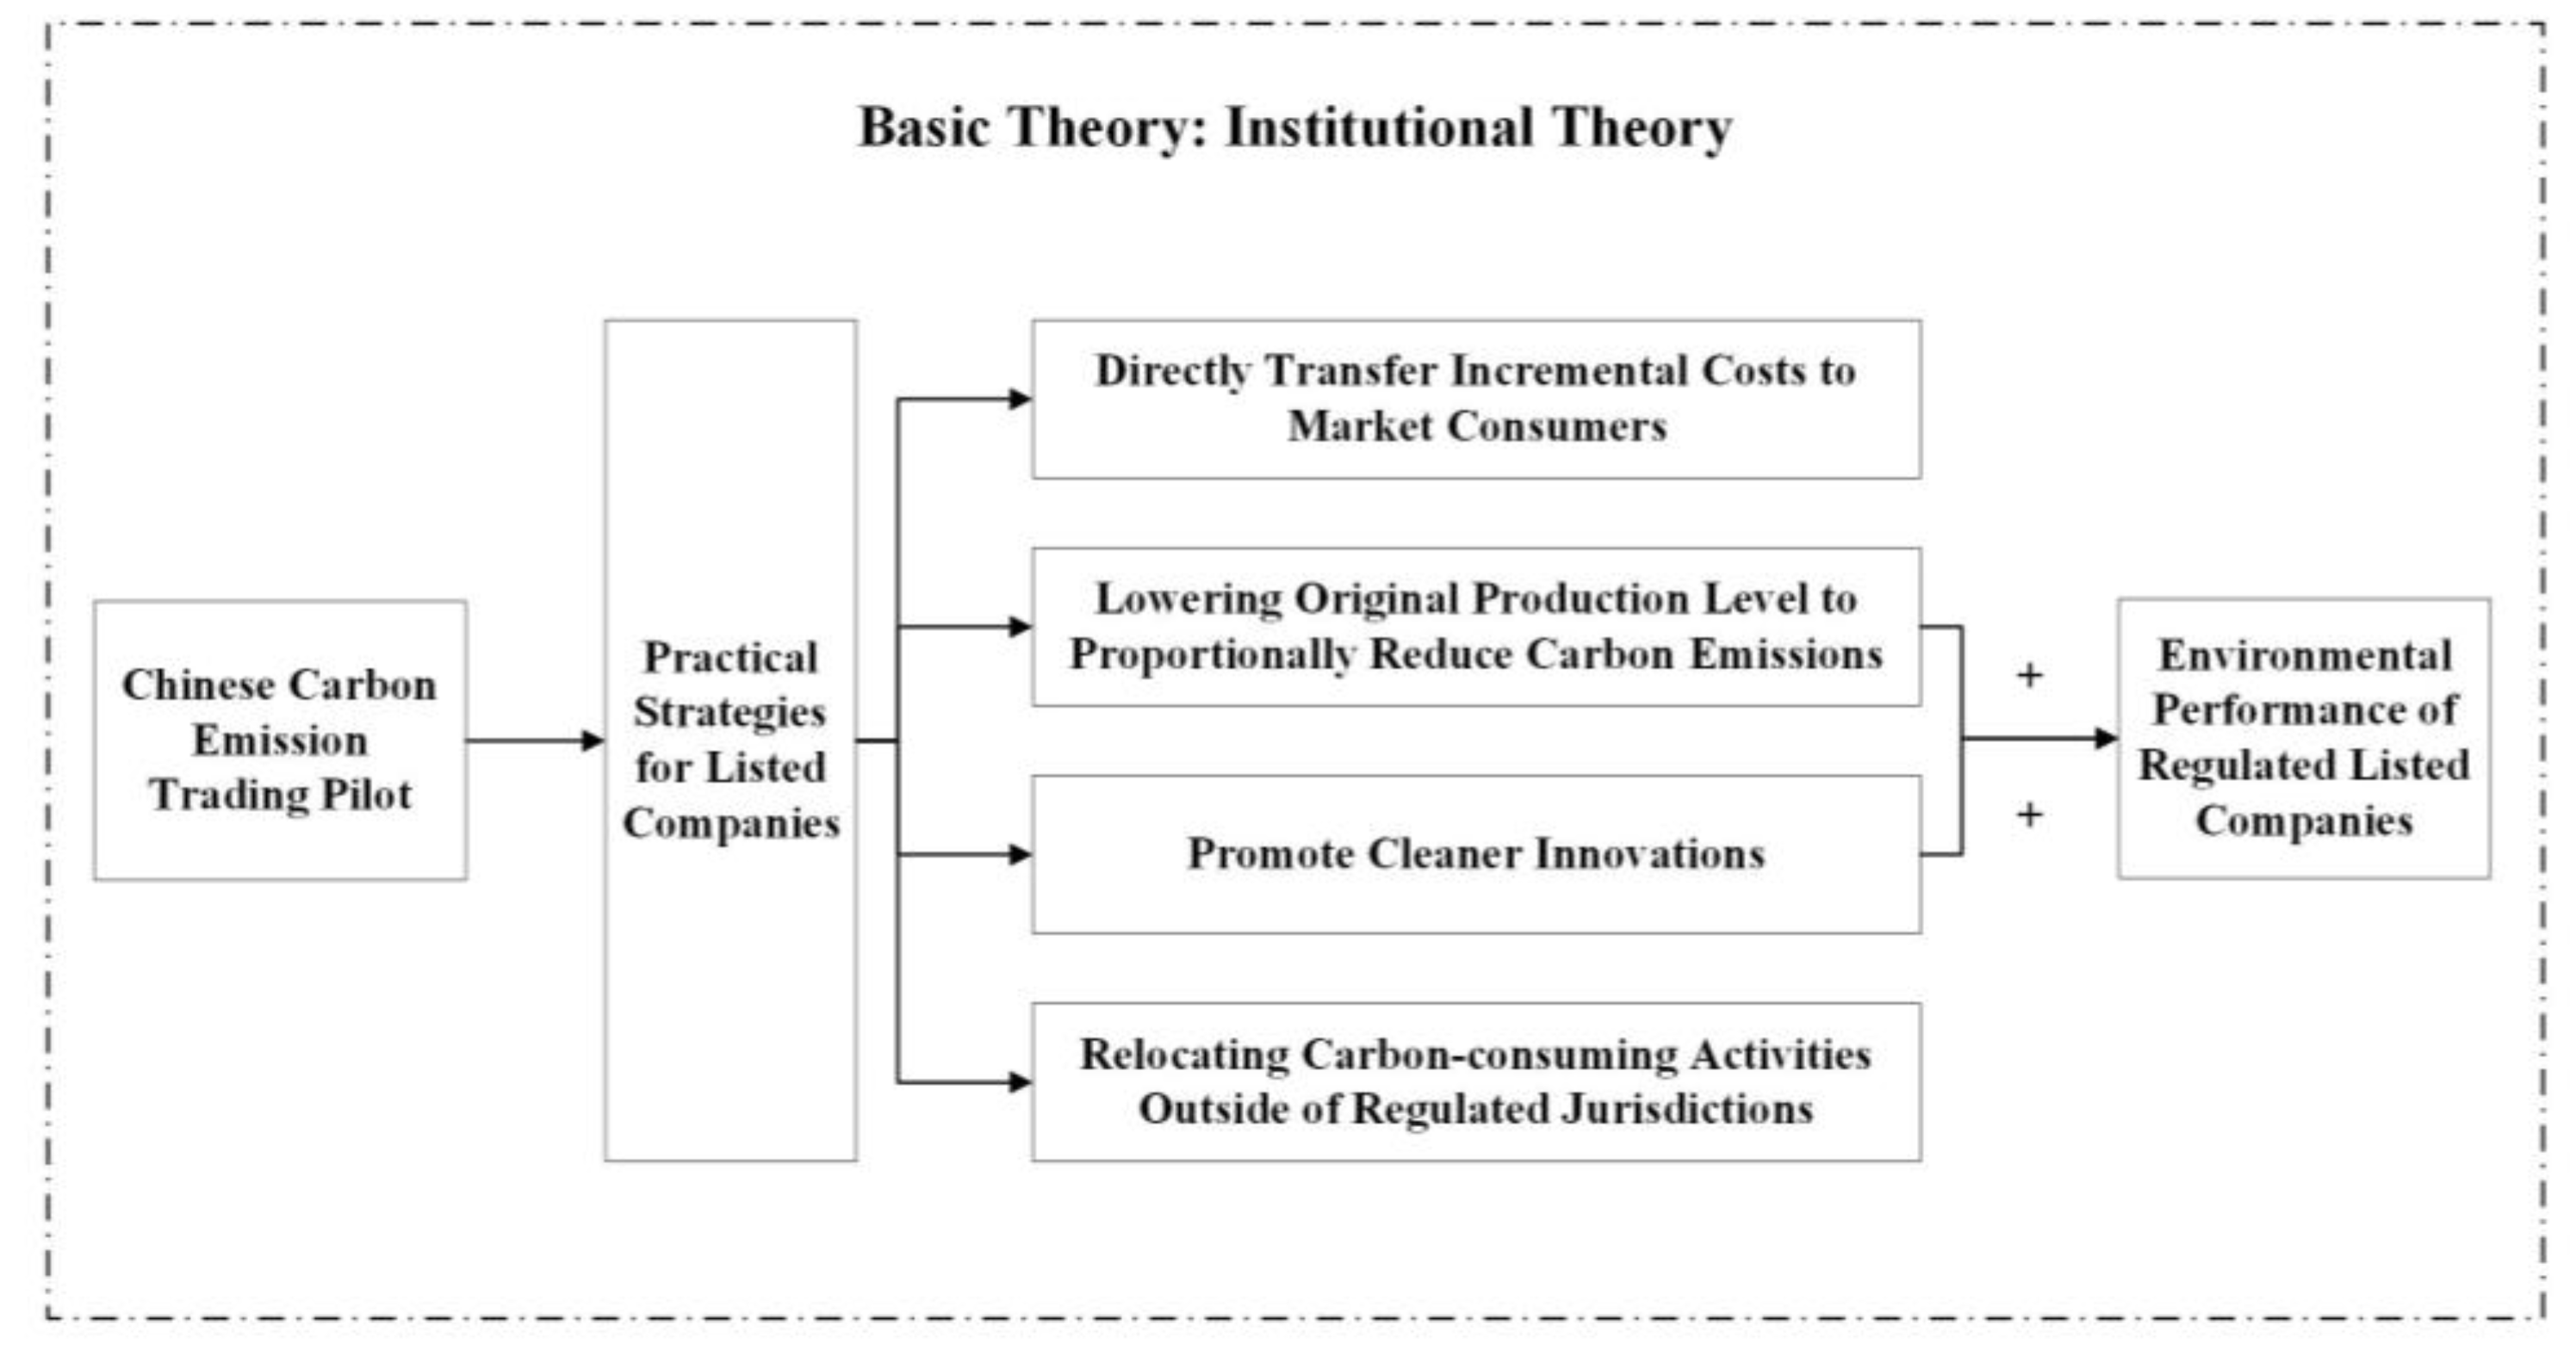
3]. After the several-year pilot operating and the nationwide system designing in 2021, the national carbon emission trading market was officially launched in cooperation with China’s “carbon peaking” and “carbon neutrality” targets set in 2020. In fact, to the best of our knowledge, the carbon emission trading system is currently the only market-incentive carbon-reducing practice in China, and thus attracts academic discussions on its practical effectiveness. Specifically, from the micro perspective at the firm level, existing literature generally concludes that Chinese companies under such market-incentive regulation will significantly reduce their carbon emissions [4,5], promote their own green innovation activities [6,7], and experience increased corporate total productivities in the long term [8,9]. On the other hand, from the macro perspective at the regional level, studies present mixed results by stating that the leakage effect of carbon emitting and the spillover effect of carbon reducing may simultaneously exist after the implementation of the Chinese carbon emission trading pilot [10,11]. With the fact that one public policy can have positive or negative impacts on certain entities and that a favorable outcome to one social entity might be unfavorable to another, examining policy impacts from different perspectives brings insights on comprehensively understating how a certain policy affects socio-economic development. While commonly using Chinese A-share listed companies as the research sample, current studies seem to leave how the capital market evaluates the influence of the Chinese pilot on corporate environmental performance an undiscussed topic. Such issue remains vital both because environment protection is a crucial factor of socio-economic sustainable development and because evaluations from capital market participants generally determines the survival of the listed companies, especially in the current period, under China’s carbon peaking and carbon neutrality goals, as well as under the comprehensive reform of the registration-based IPO system in the Chinese capital market. By focusing on the connection between a market-incentive environmental regulation and market-ranked corporate environmental performance, we provide additional evidence in this article to extend the current research scope in the empirical field of environmental accounting.
Using archival data of the Chinese A-share listed companies from 2011 to 2019, we empirically examine whether and how the Chinese carbon emission trading pilot affects corporate environmental performance, ranked by a professional market rating agency, the Bloomberg database. The major findings demonstrate that the market-ranked environmental performance of the companies that are selected in the pilot experience significant improvements after the pilot implementation, suggesting that such environmental regulation enhances corporate sustainable investment values in the capital market. Second, compared with the hypothesized increasing green investment channel, the lowering production level channel is statistically salient in explaining how the Chinese listed companies improve their environmental performance during the pilot period, revealing the listed companies’ preferences of short-term carbon-reducing behaviors rather than the long-term sustainable methods. Finally, moderating effect analyses further prove the synergistic effects of corporate environmental pressure and internal control quality. That is, the positive capital market value-adding effect of the pilot can be strengthened in companies that are under greater pressures of the external environmental law enforcement or that operate with better internal control systems.
This study contributes to the current literature in the following aspects. First, when discussing the effectiveness of the Chinese carbon emission trading pilot on micro socio-economic areas, previous studies mainly focus on how the Chinese listed companies react to such environmental regulation [7,12], while often ignoring evaluations from professional capital market participants, such as indexing or rating agencies. Given the fact that market institutions are essential information intermediaries among various stakeholders in the capital market, the way in which they assess corporate environmental performance before and after the pilot implementation reflects the views of capital market investors, and thus contains direct market-incentive information, which potentially redirect market fund flows. From the perspective of capital market investors, we supplement the current studies regarding whether and how the capital market participants respond to the new environmental regulation implementations, and thus provide additional empirical evidence for deeply and comprehensively understanding the socio-economic impacts of a market-incentive environmental regulation in the Chinese emerging market. Second, concerning the existing debate about how the listed companies trade off among multiple methods in dealing with carbon emission quota limitations under the pilot [13,14,15], we present new evidence to support the view that companies will generally lower their production levels in response to emission quota limitations, which then helps them achieve better environmental performance, while making few environment protection investments under the pilot regulation. Our findings thus shed light on internal connections between the implementation of the Carbon emission trading pilot and the promotion of the Chinese listed companies’ market-ranked environmental performance. Third, by examining the moderating effects of corporate environmental pressures and internal control quality, this study provides additional evidence on regulatory synergies brought by both the external law enforcement and corporate internal governance, emphasizing the necessity for developing systemic environmental regulatory mechanisms among policy makers, law enforcers, and corporate governors.
The remaining parts of this article are: Section 2, which provides the literature review and hypothesis development; our research design is introduced in Section 3; Section 4 shows the empirical results, including baseline regression, robustness tests, influential mechanism analysis, and moderating effect analysis; the main findings are then further discussed in Section 5; and Section 6 concludes the whole article.

2. Literature Review and Hypothesis Development

2.1. Impacts of the Carbon Emission Trading Scheme

As one of the commonly used market-incentive environmental regulations worldwide, the carbon emission trading scheme plays an essential role in internalizing firms’ negative environmental externalities [16]. Since the contradictions between environmental protection and current economic development remine evident, the practical effects of the carbon emission trading scheme are still the focal points in related research fields.
When evaluating a regulatory policy, whether this policy achieves its major target is always the most important index. Focusing on the basic carbon emission reduction effect, Bayer and Aklin [17] suggest that during 2008 to 2016, the European Union Emissions Trading System (EU-ETS) has successfully saved around 1.2 billion tons of carbon dioxide emissions, which is equal to 3.8% of the incremental carbon emission reductions Europe-wide. Detailed data further conclude that the carbon emission reductions in four European countries, including France, the Netherlands, Norway, and the United Kingdom, were around 6% during 2005 to 2007, and 15% during 2008 to 2012, respectively [18]. Although the Chinese carbon emission trading scheme is still less mature with infrequent trading, and is just comparable to the initial stage of the EU-ETS [19], the recent literature provides evidence that compared with companies not been regulated by the pilot, regulated ones have significantly reduced their carbon dioxide emissions, and thus promote carbon emission reductions, as well as the regional air quality [4,12,20,21]. With continuous implementations of the trading scheme, the positive carbon-reducing effect tends to be significant in the long term [5].
However, based on the fact that traditional carbon-consuming resources such as fossil fuels are still the basis of modern industrial development, the carbon emission trading scheme will asymmetrically increase the operating costs between regulated and unregulated companies [22], and thus enlarge the existing gaps within companies’ market competitiveness [23]. In fact, regarding the influences on competitiveness, existing literature conclusions remain mixed. From the perspective of innovation, study results mainly suggest that when facing environmental regulatory pressures, companies have strong incentives to minimize their regulation costs by complying with regulatory requirements [6,17]. Considering that environmental regulations are always expected to last for a long period and with support from both the government and research institutions, companies are likely to increase their investments in green technologies, and thus receive better carbon-reducing innovation performance, such as creating more green patents and improving low-carbon technical efficiency [7,13,14,24]. The positive connection between the implementation of the Chinese carbon trading pilot and the listed companies’ total factor productivity and provincial energy efficiency further supports the innovation–promotion effect [8,9,25]. By comparing the costs between directly purchasing the carbon emission quotas and investing in green innovation activities, Zhang et al. [15] suggest that, with the Chinese carbon emission market still lacking efficiency at the current stage, the trading scheme can actually impede green innovations, since the cost of companies’ incremental carbon emissions remains relatively low. From the perspective of the Chinese firms’ export product quality, Zhang et al. (2023) [26] conclude that the quality of the listed companies’ exported products generally suffers from a long-lasting decline after the implementation of carbon trading system, mainly because of the increased compliance costs brought by such policy. Using the companies’ financial data of revenue, fixed asset, employment level, and operating profit, Dechezlepretre et al. [18] summarize that the EU-ETS does not significantly deteriorate the regulated companies’ economic performance, providing additional evidence for the conclusion proposed by Dechezlepretre and Sato [27] that environmental policies generally lead to significant, but relatively tiny negative effects on competitiveness indicators such as trade, employment, plant location, and productivity.
While the innovation–promotion effect of the carbon emission trading scheme supports the major view of the Porter hypothesis that environmental regulations will trigger innovations more than fully offset the costs of complying with them [28], another concern came up with the pollution haven hypothesis, which states that, as the environmental compliance costs increase, companies will shift their pollution-intensive activities to regions with lax environmental regulations, leading to a policy-induced pollution leakage [27,29]. Several studies examine the existence of the pollution haven phenomenon brought by the carbon emission trading scheme, but arrive at contradictory findings. For example, using provincial and industrial data from China, Gao et al. [10] find empirical evidence proving the carbon emission outsourcing moves from pilot to non-pilot regions. However, the positive spatial spillover effect is then proven within the Chinese transportation industry, illustrating that the basic carbon-reducing effect can be expanded to non-pilot regions with similar distances to the capital city center of each pilot province [11]. When focusing on the Japanese regional emission trading scheme in Tokyo and Saitama, Sadayuki and Arimura [30] provide additional evidence to the spillover effect. They demonstrate that entities not only reduce the carbon dioxide emitted by their regulated facilitates in Tokyo and Saitama regions, but also put efforts in cutting down carbon emissions from unregulated facilities outside the Tokyo and Saitama areas.

2.2. Influential Factors of Corporate Environmental Performance

Although still lacking a unanimous definition, corporate environmental performance generally refers to the environmental contributions or damages caused by corporate operating activities [31], including, but not limited to, pollution emissions, excessive energy consumptions, and environmental protection inputs. Since pursuing favorable environmental performance does not always belong to the top-tier hierarchy in daily corporate operations [32], when discussing potential improvement methods for corporate environmental performance in developing areas, the literature mainly focuses on external influential factors such as environmental regulations and market participants’ requirements [33]. For example, Wang et al. [34] compare environmental performance between Chinese state-owned and non-state-owned enterprises. They conclude that the Chinese SOEs have higher-level performance of environmental protections because they have more responsibilities to achieve government policy targets. Considering the listed companies, the full research sample, Zhang et al. [35] illustrate that the supervisions implemented by higher-level administrative entities have stronger positive impacts on corporate environmental performance, while regulatory activities carried out by market entities, such as public media, tend to receive relatively weakened outcomes. Then, regarding the regulation strengths among entities at the same administrative level, empirical evidence demonstrates the positive connection between regional environmental regulation enforcement and corporate environmental performance [36,37]. Additionally, when corporate environmental performance is required or evaluated by capital market investors, companies also need to rely on favorable environmental information to show their sustainability capacities and gain stakeholders’ supports, and thus put more resources to promote their environmental performance [33,38]. Corporate fundamentals, such as internal governance, shareholding structures, green innovation intensities and digitalization degrees, may play the synergistic factors in companies’ pursuit of a better environmental performance [39,40,41,42,43].

2.3. Hypothesis Development

As illustrated by the institutional theory, legitimacy is the basic source of business success. Thus, by abiding to legal regulations and social norms, enterprises can then obtain recognitions of their operating legitimacy from government regulators and market stakeholders [44]. Under the ultimate goal of tightening carbon emissions from operating entities, each regulated company is given a certain amount of carbon emission quota mainly based on its historical emission level. The regulated companies can use the carbon emission trading system to sell their unused quotas or buy extra quotas for their excessive carbon emissions [4,45]; that is, as long as the quotas are set to encourage companies to reduce their carbon-consuming activities, regulated companies will certainly face increasing costs and decreasing profits, even if they change nothing after being selected in the pilot [9]. Therefore, to comply with regulatory rules and maintain the operating performance, regulated companies are highly motivated to lower their carbon emissions, leading to better market-ranked environmental performance.
Specifically, regulated companies may choose several practical strategies to deal with stricter environmental regulations in the carbon emission trading pilot period. The first one is to directly transfer the incremental costs to market consumers. One example occurs in the European electricity industry, whereby electricity users bear higher electricity costs, since the electricity producers pay more carbon emission costs after the implementation of the EU-ETS [27]. Lowering the original production level to proportionally reduce carbon emissions is the second available option, since higher production activities inevitably lead to greater carbon emissions, with non-updated production technologies and facilities [46]. The third strategy follows what the Porter hypothesis states, i.e., that cleaner innovations will lead to higher productivity and less firm-level environmental concerns in the long term, which can fully offset incremental costs brought by environmental regulations such as the carbon emission trading scheme [28]. Using proxies measuring low-carbon innovations, several studies offer empirical evidence supporting companies’ choices on the hypothesized innovation strategy [6,14]. The pollution haven hypothesis reveals the fourth option for the regulated companies; that is, to avoid additional environmental costs, companies may relocate their carbon-consuming activities outside of jurisdictions set by the carbon emission trading scheme [27,29].
Among the identified strategies, reducing original production levels and promoting green innovations are bound to promote achieving low carbon emission targets to regulated companies, and thus to obtain favorable market-ranked environmental performance. T major target for the remaining strategies is transferring environmental costs that are raised by the implementation of environmental regulations to non-regulated entities or regions, instead of causing higher carbon emissions or pollutions. Therefore, when regulated companies mainly use the product price-rising strategy or the production relocation strategy, their carbon emission levels and environmental performance tend to experience no significant change. Taken together, we propose that under the carbon emission trading scheme, regulated companies can generally achieve a higher environmental performance compared with non-regulated ones. Based on the analysis above, our main hypothesis is presented below and Figure 1 summaries the theoretical framework of our main hypothesis:
H1. 
The Chinese carbon emission trading pilot will significantly improve the environmental performance of regulated companies.

3. Research Design

3.1. Model Specification

When empirically examining the socio-economic impacts of an exogenous policy that aims at certain entities, the difference-in-difference (DID) method has been widely used both because it mitigates potential endogenous concerns from an effective model design and because it shows the net impacts of such policy by simultaneously considering differences in time trends and group characteristics. To empirically examine the influence of the carbon emission trading pilot on the quality of the Chinese listed companies’ sustainable development practices in environmental-related aspects, we use the difference-in-difference (DID) method to construct Model (1), following existing literature [7,13,18,47]:
Envscorei,t = α0 + α1CCETi,t + α2Sizei,t + α3Levi,t + α4ROAi,t + α5Independenti,t + α6Pollutioni,t + Year + Ind + ε
where the dependent variable, CCET, captures whether a Chinese listed company is selected to participate in the carbon emission trading pilot in the observation year. Specifically, the variable CCET equals one if the company is under regulation of one Chinese carbon emission exchange in the observation year, and zero otherwise. That is, the variable CCET only equals one when a firm-year observation in the research sample belongs to both the treat group and the policy implementing period at the same time, and thus in the DID research design, the regression coefficient of the variable CCET actually captures the net impact of China’ carbon emission trading pilot. The dependent variable Envscore represents the quality of a company’s environmental-related sustainable development practices, empirically ranked by Bloomberg. The control variables include the natural logarithm of the firm’s yearly revenue (Size), the year-end leverage ratio (Lev), the return on total assets (ROA), the independent director ratio (Independent), and whether the company is deemed the key pollution monitoring unit by the local government (Pollution). Year and Ind are dummy variables controlling the year and industrial effects, while ε is the residual term. Table 1 presents detailed calculations of all dependent, independent, and control variables. The coefficient α1 is what we are interested in, and it is expected to be significantly positive.

3.2. Sample Selection

Data regarding the participation status of the Chinese companies in the carbon emission trading pilot are collected from official websites of Chinese carbon emission exchanges (Shenzhen, Shanghai, Beijing, Guangzhou, Tianjin, Hubei, Chongqing, and Fujian) and from CSMAR (China Stock Market and Accounting Research) database, while the companies’ annual environmental scores are gathered from the Bloomberg ESG rating system. Other firm-level data are collected from the CSMAR and WIND databases. Considering the pilot implementation period and also to eliminate the influences caused by the COVID pandemic, we select firm-year data from 2011 to 2019. Before constructing the research sample, we implement the following procedures: (1) all firms operating in the financial sector are excluded; (2) firms that are labeled “ST” (special treatment) or “PT” (particular transfer) by capital market regulators in the observation year are then excluded; (3) observations with missing data are also excluded. The final research sample consists of 7084 observations. To mitigate the potential impacts caused by extreme values, all continuous data are Winsorized at both the upper and lower 1% level. Table 2 below summarizes our data extraction process.

4. Empirical Results

4.1. Descriptive Statistics

Table 3 presents the descriptive statistics of our sample. On average, from 2011 to 2019, only 4% of the Chinese listed companies were required to participate in the carbon emission trading pilot, while around 25% of the listed companies were deemed pollution-monitoring units. Ranked according to the Bloomberg ESG rating standards, the companies’ environmental scores differed largely, from 2.08 to 41.09, with a standard deviation of 7.32 and 9.30 as the median level, respectively. The mean values of the variable Lev and the variable ROA are 0.48 and 0.05, respectively, and the average independent ratio of all the companies in our research sample is about 40%.

4.2. Baseline Regression Results

We first use the OLS (ordinary least square) method to regress our baseline Model (1) and provide regression results in Table 4. A significantly positive coefficient of the variable CCET illustrates that, consistent with our hypothesis, companies generally perform better in their environmental-related operating activities after they are required to take part in the carbon emission trading pilot, compared with companies not selected.

4.3. Robustness Tests

Theoretically, regression results may be influenced by technical factors such as regression methods and research sample selections. To mitigate such endogenous concerns about our baseline results, we implemented three robustness tests in this section.

4.3.1. Firm-Level Fixed Effect Regression

Compared with the OLS method, the fixed-effect model can mitigate the potential influences brought by companies’ individual specific characteristics in a more effective way. Therefore, to alleviate concerns that some unobservable factors can also cause significant impacts on our baseline results, we use firm-level fixed-effect model to retest Model (1) and provide empirical results in Panel A of Table 5 below. The coefficient of the variable CCET is 1.674, and is significant at the 1% level, proving that our baseline results are robust under different regression methods.

4.3.2. Excluding Observations in and after 2015

An alternative explanation of the baseline results states that the observed significant influences can be brought by the Chinese new Environmental Protection Law, implemented from the beginning of 2015. As another essential institutional change in the environmental protection practices in China, the new Environmental Protection Law distinctly raises both the financial and the administrative costs of companies’ environment-polluting behaviors. Therefore, under the regulatory pressures of a stricter Law, the listed companies, especially those already selected in the carbon emission trading pilot, are more likely to take actions to reduce their original pollution levels and thus get higher environmental rankings by capital market participants.
Considering that the implementation overlaps between our focused policy and the new Environmental Protection Law, we exclude firm-year observations in and after 2015 to further strengthen our baseline results. The regression sample in this robustness test consists of 1829 firm-year observations from 2011 to 2014. The regression results shown in Panel B of Table 5 prove the validity of our main findings in Table 4.

4.3.3. Propensity Score Matching (PSM) Method

As whether to participate in the carbon emission trading pilot is not decided by the companies themselves, it may cause concerns that only companies with a higher or lower environmental performance are affected by the pilot, potentially raising severe endogeneity problems that our baseline results are simply caused by the ex-ante selection procedure. To empirically alleviate such endogeneity concern, we deem companies in the carbon emission trading pilot as the treat group and then use the propensity score matching method to choose the companies that have similarities to the treat group, but are not selected in the pilot as the control group.
Considering that government agencies such as the carbon emission exchanges may revise the carbon emission regulatory lists every year, to clearly identify each company’s first year in participating in the pilot, we require that companies in the study group have successive trading data from their first year in the pilot to the year of 2019. Then, we use the variable Size, Lev, Independent, and Pollution as the matching variables to choose the control group from all industries where the study companies are operating. Specifically, for every company in the study group, we chose one company as its matched sample. Next, setting the year in which a company is selected to participate in the carbon emission trading pilot at its first time as its year zero, Figure 2 shows the trend of the dependent variable Env_score between the treat and the control group. Clearly, before the pilot, a stale trend is shown between the two groups, while the trend difference becomes bigger after the study group is affected by the pilot.
To ensure robustness, we implemented both the OLS and the firm-level fixed methods to examine our baseline results using the PSM sample and show empirical results in Panel A of Table 6. Significant positive coefficients of the variable CCET illustrate that our baseline results are statistically solid. We also provide results of the sample balance test in Panel B of Table 6 to present more details of the PSM method. Comparing the t-values before and after the PSM procedure, it is obvious that variable differences between the study and the control group have been effectively minimized by the PSM method.
Then, for companies in the PSM sample, we assume that the carbon emission trading pilot begins one year later than its real year and use the placebo test method to alleviate the potential concerns that the significant effect of the pilot can be caused by time trends or by non-observable factors. In the placebo test section, an insignificant coefficient of the variable CCET is expected if our hypothesized causality does exist. Table 7 below shows the results of the placebo tests. Insignificant coefficients of the variable CCET under both the OLS and the firm-level fixed effect regression methods further strengthen the validity of the PSM test.

4.4. Influential Mechanism Analyses

As stated in the Section 2.3, the current literature finds that, when facing carbon emission reduction pressures from market regulators, companies will mainly choose to lower their production levels or make more investments in environmental protection aspects such as energy-saving facilitates, as well as green technological innovations [48,49]. Nevertheless, compared with directly reducing production levels to satisfy the carbon emission requirements, making a green investment need both the financial resources and periods for preparing and implementing, and thus becomes a relatively costly way for companies to use in the short run [46]. Therefore, one major internal mechanism in explaining how the selected companies practically improve their environmental performance could be the lowering production channel, while the hypothesized increasing green investment channel may play a minor role.
To empirically examine the mediating effect of the two potential channels, following the model specification method used by Baron and Kenny [50], we construct Model (2) and Model (3), as shown below. The variable Production and the variable Envinv represent a company’s production level and environmental investment amount, respectively. Original financial data were collected from the CSMAR database. For the variable Production, we first use the basic accounting equation to estimate a company’s production amount, and then divide it by the firm’s year-end total asset value to complete the calculation. For the variable Envinv, we use the natural logarithmic form of each company’s environmental protection investment amount published in its annual reports.
According to the basic principles of the mediating effect test and based on the regression results of Model (1), the hypothesized influential mechanism holds if the coefficient of the variable CCET in Model (2) and the coefficient of the variable Production (Envinv) in Model (3) are all significant. Specifically, for the lowering production channel to be valid, both α1 in Model (2) and α2 in Model (3) should be significantly negative. However, for the increasing green investment channel to be empirically reliable, both α1 in Model (2) and α2 in Model (3) should be significantly positive.
Productioni,t (Envinvi,t) = α0 + α1CCETi,t + α2Sizei,t + α3Levi,t + α4ROAi,t + α5Independenti,t + α6Pollutioni,t + Year + Ind + ε
Envscorei,t = α0 + α1CCETi,t + α2Production i,t (Envinvi,t) + α3Sizei,t + α4Levi,t + α5ROAi,t + α6Independenti,t + α7Pollutioni,t + Year + Ind + ε
Panel A and Panel B in Table 8 present the mediating effect examines of the lowering production level channel and the increasing green investment channel, respectively. Both the regression coefficients and the Sobel test results illustrate that only the lowering production level channel is statistically valid. However, although the regression coefficient of the variable Envinv in Panel B is statistically positive at the 1% level, the insignificant coefficient of the variable CCET in Model (2) suggests that companies generally do not choose to raise their green investment levels when they are in the carbon emission trading pilot, even though such investments are likely to be favorably evaluated by professional market institutions.

4.5. Moderating Effect Analyses

While the effectiveness of the carbon emission trading scheme has been generally proven to sustainably meet the government targets regarding environmental protection and carbon neutrality in the long term, amplifying the influences of the carbon emission trading scheme have become an emerging topic for further studies. Existing literature discusses the synergistic effects of trading rules, including carbon prices and emission quota allocation methods set by the carbon trading scheme [5,17,47]. We focus on two potential firm-level moderating factors in this section, namely the environmental pressure and the internal control quality, respectively.
In both the theoretical and the practical aspects, stricter environmental regulations will make companies put more resources into achieving environmental goals [37]. Reasons behind such reality come from two aspects: the first one is that government entities will pay closer supervision attentions to companies causing severe or wide-range pollutions, using an administrative means to increase corporate environmental pressures [36]; and the second one is that capital market stakeholders, such as investors, consumers, suppliers, and social media will consider heavy-polluting enterprises as the counterparts experiencing high compliance risks, and further rely on market-based methods to push companies to chase improved environmental performance. Thus, when facing greater environmental pressures caused by previous polluting activities, enterprises are more urgent to promote environmental performance under a new regulation such as the carbon emission trading scheme.
In addition, better internal control quality may synergize the carbon emission trading scheme in promoting corporate environmental performance in two ways: first, internal control effectiveness is positively correlated with corporate operational and investment efficiency [51,52], securing companies’ high-quality responses in dealing with environmental drawbacks; and second, since the information asymmetry problem is less severe in companies with better internal control quality, market participants are usually willing to provide companies with more financial resources and trusts in disclosed information [53,54], and thus help companies enhance their environmental performance under sudden regulatory changes.
Based on the analyses above, we propose that higher environmental pressures and better internal control quality have synergistic effects on the connection between the Chinese carbon emission trading pilot and corporate environmental performance. To empirically examine the moderating effects, we construct Model (4) as follows:
Envscorei,t = α0 + α1CCETi,t × EPi,t (ICi,t) + α2CCETi,t + α3Epi,t (ICi,t) + α4Sizei,t + α5Levi,t + α6ROAi,t + α7Independenti,t + α8Pollutioni,t + Year + Ind + ε
where the variable EP and the variable IC represent environmental pressure and internal control quality of the Chinese listed companies, respectively. We collected the annual government charges on the companies’ emitted air pollutants as the original data source to calculate the variable EP. Specifically, the ratio of the air pollutant charge to revenue is used to distinguish companies with higher environmental pressures and those with lower pressures. If a company’s air pollutant charge ratio is higher than the industrial median level in the observation year, then the variable EP of that company equals to one, and is zero otherwise. Similarly, after gathering the original internal control quality index from the DIB database, we set the variable IC to one if a company’s internal control quality is ranked above the industrial level where the company operates in the observation year, and to zero otherwise. In this section, the regression coefficient of the interaction term CCET × EP (IC) captures the combined effects of the carbon emission trading pilot and the listed companies’ characteristics.
While excluding the firm-year observations with the missing data, we use both the OLS and firm-level fixed-effect methods to further ensure robustness. The regression results regarding the moderating effects of the companies’ environmental pressures and internal control qualities are shown in Panel A and Panel B of Table 9, respectively. Significantly positive coefficients of interaction terms suggest that the carbon emission trading pilot will have greater improvements on the companies’ environmental performance when the companies are facing greater environmental pressures or have higher internal control qualities.

5. Discussion

We present empirical evidence on whether and how the Chinese carbon emission trading pilot affects the listed companies’ market-ranked environmental performance, and thus extend related research scope from the capital market evaluation perspective. Still, similar with exiting literature, e.g., [4,5,6,7,8,9], the ultimate goal of this study is to examine whether and how the carbon emission trading pilot causes influences on regulated companies within the Chinese capital market. Overall, we present additional favorable results on China’s first market-incentive carbon-reducing regulatory practices, stating that compared with the companies not required to participate in the pilot, regulated companies will lower their production level and therefore achieve higher environmental performance ranked by the rating institution in the capital market. For the companies not regulated by the pilot, their environmental performance shows no significant changes during our research period, as shown in Figure 2. However, our main results do not deny the identified carbon leakage effect [10], in that the regulated listed companies may not choose another listed company for potential carbon emission transferring, even though the company has not been regulated by the pilot. Instead, potential carbon emission outsourcing activities may be empirically found between the regulated companies and their affiliated enterprises, of which the data are not observable at the current stage.
One limitation of this article exists in exploring how capital market institutions actually use and evaluate corporate environmental performance data in their rating system. Although ordinary rating considerations and rating results are commonly available to the public, researchers would shed more light on the original processes of turning environmental regulatory policies to incremental value-adding information in the capital market if they were accessible to the actual rating practices in capital market institutions. We thus hope that further studies will provide complements to this limitation in the topic, by implementing field or case studies.
Besides proving the validity of our research topic, the regression results also suggest some potential directions for future research. For example, the regression coefficient of the variable CCET in Panel A of Table 8 remains significant when examining the lowering production channel, implying that there may be other influential mechanisms that can explain the connection between the carbon emission trading pilot and the Chinese listed companies’ environmental performance. Alongside that, from the mediating effect analyses, it is worth noticing that when dealing with environmental regulations, the Chinese listed companies generally tend to be short-sighted in choosing not to invest in green innovation activities, but to simply lower their production levels instead. We speculate that such an unsustainable situation might be influenced by some immature rules in the carbon emission trading pilot, and we thus suggest for further studies to keep up with this potential direction in finding internal reasons and improvement measures. Moreover, future research may focus on potential connections between other institutional changes and companies’ environmental-related behaviors, or consider comparing carbon-emission-reducing practices among various capital markets as a feasible starting point.

6. Conclusions

Using data of the Chinese A-share listed companies from 2011 to 2019, we empirically examine the potential connections between the Chinese carbon emission trading pilot and companies’ environmental performance. The main results reveal that companies will improve their environmental performance after they are selected to participate in the pilot. Several robustness tests are also implemented to prove the validity of our conclusions. Second, influential mechanism analyses illustrate that the lowering production channel plays an essential role in explaining our identified connections, while the explanatory power of the increasing green investment channel is not salient. Third, the results of the moderating effect tests indicate that, along with the development of the carbon emission trading market, regulators can also put efforts on strengthening environmental regulation enforcement and improving corporate internal governance to maximize favorable impacts of environmentally friendly policies.
Based on the main findings in this study, the implications for future environmental regulatory practices may include improving the listed companies’ environmental performance in the long-term, more environmental regulations either encouraging or requiring companies’ environmental protection activities that can be carefully designed and implemented in the future, as such market- or administrative-incentive regulations are likely to cause significant influences on the listed companies’ operating decisions. Second, it is noticeable that under environmental regulation that may bring an additional economic burden, the listed companies generally promote their environmental performance at the cost of directly lowering the production levels, instead of making long-term green investments. This phenomenon should be further improved by regulatory adjustments such as providing subsidies for companies to equip greener facilities and setting a transitional period for companies to better prepare for stricter environmental regulations, since sustainable development requires finding a balance point between companies’ economic benefit chasing and environmental protection activities. Third, ensuring environmental law enforcement and making companies build a better internal governance system are also essential for well-designed environmental policy to play a strengthened role. Thus, regulators in both legal institutions and the capital market are advised to further provide high-quality supportive mechanisms in promoting the effectiveness of well-designed environmental policies.

Author Contributions

Conceptualization, L.Z. and J.C.; methodology, L.Z. and J.C.; software, L.Z.; validation, L.Z., A.O., J.C. and X.G.; formal analysis, L.Z.; resources, L.Z. and X.G.; data curation, L.Z.; writing—original draft preparation, L.Z.; writing—review and editing, A.O. and J.C.; supervision, A.O. and X.G.; project administration, A.O. and X.G.; funding acquisition, A.O., J.C. and X.G. All authors have read and agreed to the published version of the manuscript.

Funding

This research was funded by the Grant-in-Aid for Scientific Research (C), grant number 22K01780, by the National Natural Science Foundation of China, grant number 72272010.

Institutional Review Board Statement

Not applicable.

Informed Consent Statement

Not applicable.

Data Availability Statement

Data in this article can be gathered from the CSMAR (https://cn.gtadata.com/, accessed on 15 December 2022) and DIB databases (http://www.dibdata.cn/, accessed on 15 December 2022).

Acknowledgments

This research was also supported by the CSC-YNU Joint Scholarship Program.

Conflicts of Interest

The authors declare no conflict of interest. The funders had no role in the design of the study; in the collection, analyses, or interpretation of data; in the writing of the manuscript; or in the decision to publish the results.

References

  1. IPCC Six Assessment Report. Climate Change 2022: Mitigation of Climate Change. Available online: https://www.ipcc.ch/report/ar6/wg3/ (accessed on 15 May 2023).
  2. World Meteorological Organization. Available online: https://public.wmo.int/en/media/press-release/greenhouse-gas-bulletin-another-year-another-record (accessed on 15 February 2023).
  3. Song, D.; Zhu, W.; Wang, B. Micro-empirical evidence based on China’s carbon trading companies: Carbon emissions trading, quota allocation methods and corporate green innovation. China Popul. Resour. Environ. 2021, 31, 37–47. (In Chinese) [Google Scholar]
  4. Xuan, D.; Ma, X.; Shang, Y. Can China’s policy of carbon emission trading promote carbon emission reduction? J. Clean. Prod. 2020, 270, 122383. [Google Scholar] [CrossRef]
  5. Shi, B.; Li, N.; Gao, Q.; Li, G. Market incentives, carbon quota allocation and carbon emission reduction: Evidence from China’s carbon trading pilot policy. J. Environ. Manag. 2022, 319, 115650. [Google Scholar] [CrossRef] [PubMed]
  6. Chen, Y.; Yao, Z.; Zhong, K. Do environmental regulations of carbon emission and air pollution foster green technology innovation: Evidence from China’s prefecture-level cities. J. Clean Prod. 2022, 350, 131537. [Google Scholar] [CrossRef]
  7. Lv, M.; Bai, M. Evaluation of China’s carbon emission trading policy from corporate innovation. Financ. Res. Lett. 2021, 39, 101565. [Google Scholar] [CrossRef]
  8. Xiao, J.; Li, G.; Zhu, B.; Xie, L.; Hu, Y.; Huang, J. Evaluating the impact of carbon emissions trading scheme on Chinese firms’ total factor productivity. J. Clean Prod. 2021, 306, 127104. [Google Scholar] [CrossRef]
  9. Pan, X.; Pu, C.; Yuan, S.; Xu, H. Effect of Chinese pilots carbon emission trading scheme on enterprises’ total factor productivity: The moderating role of government participation and carbon trading market efficiency. J. Environ. Manag. 2022, 316, 115228. [Google Scholar] [CrossRef] [PubMed]
  10. Gao, Y.; Li, M.; Xue, J.; Liu, Y. Evaluation of effectiveness of China’s carbon emissions trading scheme in carbon mitigation. Energy Econ. 2020, 90, 104872. [Google Scholar] [CrossRef]
  11. Li, S.; Liu, J.; Wu, J.; Hu, X. Spatial spillover effect of carbon emission trading policy on carbon emission reduction: Empirical data from transport industry in China. J. Clean Prod. 2022, 371, 133529. [Google Scholar] [CrossRef]
  12. Chen, Y.; Xu, Z.; Zhang, Z.; Ye, W.; Yang, Y.; Gong, Z. Does the carbon emission trading scheme boost corporate environmental and financial performance in China? J. Clean Prod. 2022, 368, 133151. [Google Scholar] [CrossRef]
  13. Liu, M.; Li, Y. Environmental Regulation and Green Innovation: Evidence from China’s Carbon Emissions Trading Policy. Financ. Res. Lett. 2022, 48, 103051. [Google Scholar] [CrossRef]
  14. Cai, W.; Ye, P. Does carbon emission trading improve low-carbon technical efficiency? Evidence from China. Sustain. Prod. Consum. 2022, 29, 46–56. [Google Scholar] [CrossRef]
  15. Zhang, W.; Li, G.; Guo, F. Does carbon emissions trading promote green technology innovation in China? Appl. Energy 2022, 315, 119012. [Google Scholar] [CrossRef]
  16. Mo, J.; Agnolucci, P.; Jiang, M.; Fan, Y. The impact of Chinese carbon emission trading scheme (ETS) on low carbon energy (LCE) investment. Energy Policy 2016, 89, 271–283. [Google Scholar] [CrossRef]
  17. Bayer, P.; Aklin, M. The European Union Emissions Trading System reduced CO2 emissions despite low prices. Proc. Natl. Acad. Sci. USA 2020, 117, 8804–8812. [Google Scholar] [CrossRef]
  18. Dechezleprêtre, A.; Nachtigall, D.; Venmans, F. The joint impact of the European Union emissions trading system on carbon emissions and economic performance. J. Environ. Econ. Manag. 2023, 118, 102758. [Google Scholar] [CrossRef]
  19. Sun, L.; Xiang, M.; Shen, Q. A comparative study on the volatility of EU and China’s carbon emission permits trading markets. Phys. A Stat. Mech. Its Appl. 2020, 560, 125037. [Google Scholar] [CrossRef]
  20. Zhang, Y.; Li, S.; Luo, T.; Gao, J. The effect of emission trading policy on carbon emission reduction: Evidence from an integrated study of pilot regions in China. J. Clean Prod. 2020, 265, 121843. [Google Scholar] [CrossRef]
  21. Dong, Z.; Xia, C.; Fang, K.; Zhang, W. Effect of the carbon emissions trading policy on the co-benefits of carbon emissions reduction and air pollution control. Energy Policy 2022, 165, 112998. [Google Scholar] [CrossRef]
  22. Chan, H.S.; Li, R.; Zhang, F. Firm competitiveness and the European union emissions trading scheme. Energy Policy 2013, 63, 1056–1064. [Google Scholar] [CrossRef]
  23. Wang, W.; Zhang, Y. Does China’s carbon emissions trading scheme affect the market power of high-carbon enterprises? Energy Econ. 2022, 108, 105906. [Google Scholar] [CrossRef]
  24. Aghion, P.; Dechezleprêtre, A.; Hémous, D.; Martin, R.; Van Reenen, J. Carbon Taxes, Path Dependency, and Directed Technical Change: Evidence from the Auto Industry. J. Polit. Econ. 2016, 124, 1–51. [Google Scholar] [CrossRef]
  25. Zhang, D.; Kong, Q.; Wang, Y.; Vigne, S.A. Exquisite workmanship through net-zero emissions? The effects of carbon emission trading policy on firms’ export product quality. Energy Econ. 2023, in press. [CrossRef]
  26. Song, M.; Zheng, H.; Shen, Z. Whether the carbon emissions trading system improves energy efficiency—Empirical testing based on China’s provincial panel data. Energy 2023, 275, 127456. [Google Scholar] [CrossRef]
  27. Dechezleprêtre, A.; Sato, M. The Impacts of Environmental Regulations on Competitiveness. Rev. Environ. Econ. Policy 2017, 11, 183–206. [Google Scholar] [CrossRef]
  28. Porter, M.E.; van der Linde, C. Toward a New Conception of the Environment-Competitiveness Relationship. J. Econ. Perspect. 1995, 9, 97–118. [Google Scholar] [CrossRef]
  29. Levinson, A.; Taylor, M. Unmasking the pollution haven effect. Int. Econ. Rev. 2008, 49, 223–254. [Google Scholar] [CrossRef]
  30. Sadayuki, T.; Arimura, T.H. Do regional emission trading schemes lead to carbon leakage within firms? Evidence from Japan. Energy Econ. 2021, 104, 105664. [Google Scholar] [CrossRef]
  31. Zhu, D.; Gao, X.; Luo, Z.; Xu, W. Environmental performance and corporate risk-taking: Evidence from China. Pacific. Basin. Financ. J. 2022, 74, 101811. [Google Scholar] [CrossRef]
  32. Sun, X.; Gunia, B.C. Economic resources and corporate social responsibility. J. Corp. Financ. 2018, 51, 332–351. [Google Scholar] [CrossRef]
  33. Zhang, R.; Fu, W.; Lu, T. Capital market opening and corporate environmental performance: Empirical evidence from China. Financ. Res. Lett. 2022, in press. [CrossRef]
  34. Wang, Q.; Liu, M.; Zhang, B. Do state-owned enterprises really have better environmental performance in China? Environmental regulation and corporate environmental strategies. Resour. Conserv. Recycl. 2022, 185, 106500. [Google Scholar] [CrossRef]
  35. Zhang, Y.; Zhang, R.; Zhang, C. Insight into the driving force of environmental performance improvement: Environmental regulation or media coverage. J. Clean. Prod. 2022, 358, 132024. [Google Scholar] [CrossRef]
  36. Zhang, W.; Luo, Q.; Liu, S. Is government regulation a push for corporate environmental performance? Evidence from China. Econ. Anal. Policy 2022, 74, 105–121. [Google Scholar] [CrossRef]
  37. Zhang, B.; Wang, Y.; Sun, C. Urban environmental legislation and corporate environmental performance: End governance or process control? Energy Econ. 2023, 118, 106494. [Google Scholar] [CrossRef]
  38. Wellalage, N.H.; Kumar, V.; Hunjra, A.I.; Al-Faryan, M. Environmental performance and firm financing during COVID-19 outbreaks: Evidence from SMEs. Financ. Res. Lett. 2022, 47, 102568. [Google Scholar] [PubMed]
  39. Xiao, G.; Shen, S. To pollute or not to pollute: Political connections and corporate environmental performance. J. Corp. Financ. 2022, 74, 102214. [Google Scholar] [CrossRef]
  40. Yu, X.; Shi, J.; Wan, K.; Chang, T. Carbon trading market policies and corporate environmental performance in China. J. Clean Prod. 2022, 371, 133683. [Google Scholar] [CrossRef]
  41. Zhang, R.; Fu, W. Multiple large shareholders and corporate environmental performance. Financ. Res. Lett. 2023, 51, 103487. [Google Scholar] [CrossRef]
  42. Carrión-Flores, C.; Innes, R. Environmental innovation and environmental performance. J. Environ. Econ. Manag. 2010, 59, 27–42. [Google Scholar] [CrossRef]
  43. Yang, Y.; Yang, X.; Xiao, Z.; Liu, Z. Digitalization and environmental performance: An empirical analysis of Chinese textile and apparel industry. J. Clean Prod. 2023, 382, 135338. [Google Scholar] [CrossRef]
  44. Meyer, J.W.; Rowan, B. Institutionalized Organizations: Formal Structure as Myth and Ceremony. Am. J. Sociol. 1977, 83, 340–363. [Google Scholar] [CrossRef]
  45. An, Q.; Zhu, K.; Xiong, B.; Shen, Z. Carbon resource reallocation with emission quota in carbon emission trading system. J. Environ. Manag. 2022, 327, 116837. [Google Scholar] [CrossRef] [PubMed]
  46. Shen, H.; Huang, N.; Liu, L. A Study of the Micro–effect and Mechanism of the Carbon Emission Trading Scheme. J. Xiamen Univ. (Arts Soc. Sci.) 2017, 239, 13–22. (In Chinese) [Google Scholar]
  47. Cui, J.; Wang, C.; Zhang, J.; Zheng, Y. The effectiveness of China’s regional carbon market pilots in reducing firm emissions. Proc. Natl. Acad. Sci. USA 2021, 118, e2109912118. [Google Scholar] [CrossRef] [PubMed]
  48. Caparrós, A.; Péreau, J.; Tazdaït, T. Emission trading and international competition: The impact of labor market rigidity on technology adoption and output. Energy Policy 2013, 55, 36–43. [Google Scholar] [CrossRef]
  49. Smale, R.; Hartley, M.; Hepburn, C.; Ward, J.; Grubb, M. The impact of CO2 emissions trading on firm profits and market prices. Clim. Policy 2006, 6, 31–48. [Google Scholar] [CrossRef]
  50. Baron, R.M.; Kenny, D.A. The moderator-mediator variable distinction in social psychological research: Conceptual, strategic, and statistical considerations. J. Pers. Soc. Psychol. 1986, 51, 1173–1182. [Google Scholar] [CrossRef] [PubMed]
  51. Cheng, M.; Dhaliwal, D.S.; Dhaliwal, D.S.; Zhang, Y. Does investment efficiency improve after the disclosure of material weaknesses in internal control over financial reporting. J. Account. Econ. 2013, 56, 1–18. [Google Scholar] [CrossRef]
  52. Cheng, Q.; Goh, B.W.; Kim, J. Internal Control and Operational Efficiency: Internal Control and Operational Efficiency. Contemp. Account. Res. 2018, 35, 1102–1139. [Google Scholar] [CrossRef]
  53. Jain, P.; Jiang, C.X.; Mekhaimer, M.A. Executives’ Horizon, Internal Governance and Stock Market Liquidity. J. Corp. Financ. 2016, 40, 1–23. [Google Scholar] [CrossRef]
  54. Gao, X.; Jia, Y. Internal Control over Financial Reporting and the Safeguarding of Corporate Resources: Evidence from the Value of Cash Holdings. Contemp. Account. Res. 2016, 33, 783–814. [Google Scholar] [CrossRef]
Figure 1. Theoretical framework of the hypothesis.
Sustainability 15 08518 g001
Figure 2. Comparison between the study group and the control group.
Sustainability 15 08518 g002
Table 1. Variable calculations.
VariableMeasurement Method
EnvscoreDependent variable equals the firm’s environmental score ranked by the Bloomberg ESG rating system
CCETIndependent variable equals 1 if the listed company is selected to participate in the Chinese carbon emission trading pilot in the observation year, and 0 otherwise
SizeCorporate size equals the natural logarithm of a firm’s total revenue
LevYear-end corporate leverage level equals the year-end total liabilities/year-end total assets
ROAReturn on assets equals the net income/average total assets
IndependentProportion of independent directors in the company equals the number of independent directors/the number of total directors
PollutionHigh-pollution entity indicator equals 1 if the company is deemed a pollution monitoring unit by the local government, and 0 otherwise
YearYear dummy
IndIndustry dummy
Source: CSMAR (China Stock Market and Accounting Research) database, WIND database.
Table 2. Data extraction process.
Extraction ProcessFirm-Year Observations
Original firm-year data from 2011 to 20197763
Excluding data from financial sectors7389
Excluding ST or PT firms7124
Excluding observations with missing data7084
Final research sample7084
Source: Authors.
Table 3. Descriptive statistics.
VariableNMeanStd. DevMin.Med.Max.
Envscore708410.577.322.089.3041.09
CCET70840.040.190.000.001.00
Size708422.501.4419.3722.4026.40
Lev70840.480.200.070.500.87
ROA70840.050.06−0.170.040.24
Independent70840.380.070.250.360.60
Pollution70840.250.430.000.001.00
Table 4. Baseline regression results.
VariableEnvscore
CCET1.437 ***
(2.70)
Size2.087 ***
(26.95)
Lev−3.708 ***
(−6.54)
ROA−5.237 ***
(−3.57)
Independent0.552
(0.52)
Pollution1.648 ***
(7.11)
Constant−34.337 ***
(−20.52)
Year and IndControlled
N7084
Adj. R20.218
***, represents the 1% level of significance. T-values are presented beneath the coefficient estimates in parentheses.
Table 5. Robustness: Firm-level fixed-effect regression and the excluding observations in and after 2015.
VariablePanel A: Firm-Level Fixed EffectPanel B: Excluding Observations in and after 2015
EnvscoreEnvscore
CCET1.674 ***2.410 **
(3.01)(2.00)
Size0.577 ***1.480 ***
(3.46)(12.62)
Lev0.642−5.949 ***
(0.86)(−5.91)
ROA3.040 **−10.549 ***
(2.20)(−4.14)
Independent−1.951 **−2.123
(−2.12)(−1.29)
Pollution1.579 ***0.166
(8.10)(0.32)
Constant−2.572−18.745 ***
(−0.71)(−7.86)
Year and IndControlledControlled
N70631829
Adj. R20.6810.178
***, **, represent the 1%, and 5% level of significance, respectively. T-values are presented beneath the coefficient estimates in parentheses.
Table 6. Robustness: Propensity score matching method.
VariablePanel A: PSM MethodPanel B: Sample Balance Test
OLSFEPSMTreatControlT-Value
EnvscoreEnvscore
CCET1.472 **1.710 **
(2.02)(2.39)
Size2.663 ***0.964Before23.61923.1188.96 ***
(10.48)(1.20)After23.52323.2312.96 ***
Lev−5.352 ***3.973 *Before0.5000.4822.13 **
(−2.70)(1.80)After0.4690.4660.20
ROA−18.581 ***4.582Before0.0510.0462.24 ***
(−3.87)(1.00)After0.0560.0550.37
Independent0.092−0.655Before0.3870.3782.77 ***
(0.02)(−0.22)After0.3910.3841.22
Pollution2.856 ***2.782 ***Before0.2850.2422.31 **
(3.69)(4.66)After0.2780.2700.26
Constant−43.934 ***−12.293
(−8.00)(−0.67)
Year and IndControlledControlled
N831829
Adj. R20.3660.742
***, **, * represent the 1%, 5%, and 10% level of significance, respectively. T-values are presented beneath the coefficient estimates in parentheses.
Table 7. Robustness: PSM method—Placebo test.
VariableOLSFE
EnvscoreEnvscore
CCET0.6530.259
(0.82)(0.32)
Size3.249 ***2.094 **
(10.82)(2.49)
Lev−3.907−2.851
(−1.50)(−1.16)
ROA−7.73615.262 ***
(−1.32)(2.69)
Independent1.900−4.664
(0.53)(−1.44)
Pollution1.848 **2.383 ***
(2.29)(3.46)
Constant−63.444 ***−33.634 *
(−9.97)(−1.76)
Year and IndControlledControlled
N788786
Adj. R20.3110.741
***, **, * represent the 1%, 5%, and 10% level of significance, respectively. T-values are presented beneath the coefficient estimates in parentheses.
Table 8. Influential mechanism analyses.
Panel A: Lowering Production LevelPanel B: Increasing Green Investment
VariableProductionEnvscoreVariableEnvinvEnvscore
CCET−0.041 **1.345 **CCET0.0891.389 ***
(−2.46)(2.53) (0.54)(2.63)
Production −2.014 ***Envinv 0.540 ***
(−7.32) (12.32)
Size0.129 ***2.356 ***Size0.183 ***1.988 ***
(32.52)(27.45) (7.12)(25.73)
Lev−0.080 ***−3.966 ***Lev0.067−3.744 ***
(−2.63)(−6.94) (0.33)(−6.71)
ROA−0.097 *0.238ROA−0.568−4.930 ***
(−1.81)(0.22) (−1.12)(−3.40)
Independent−0.301 ***−6.047 ***Independent−0.0780.594
(−3.76)(−4.06) (−0.20)(0.57)
Pollution0.00011.635 ***Pollution0.725 ***1.256 ***
(0.01)(7.09) (7.94)(5.47)
Constant−2.150 ***−38.806 ***Constant−3.583 ***−32.401 ***
(−25.68)(−21.75) (−6.60)(−19.32)
Year and IndControlledControlledYear & IndControlledControlled
Sobel2.330 **Sobel0.539
N70427042N70847084
Adj. R20.3790.226Adj. R20.0990.247
***, **, * represent the 1%, 5%, and 10% level of significance, respectively. T-values are presented be-neath the coefficient estimates in parentheses.
Table 9. Moderating effect analyses.
Panel A:
Companies’ Environmental Pressures
Panel B:
Companies’ Internal Control Quality
VariableEnvscoreEnvscoreVariableEnvinvEnvscore
OLSFEOLSFE
CCET × EP3.653 ***1.420 *CCET × IC3.302 ***1.759 **
(3.34)(1.90) (3.28)(2.51)
CCET−0.1351.387 **CCET−0.3800.731
(−0.19)(1.99) (−0.59)(1.14)
EP−0.195−0.085IC0.039−0.128
(−1.07)(−0.63) (0.23)(−1.10)
Size2.275 ***0.614 ***Size2.075 ***0.582 ***
(25.25)(2.85) (26.27)(3.48)
Lev−4.454 ***0.121Lev−3.713 ***0.675
(−6.59)(0.13) (−6.53)(0.90)
ROA−7.296 ***2.570ROA−5.792 ***2.951 **
(−4.20)(1.45) (−3.78)(2.07)
Independent0.024−2.456 **Independent0.510−2.001 **
(0.02)(−2.28) (0.48)(−2.18)
Pollution1.477 ***1.393 ***Pollution1.658 ***1.584 ***
(5.85)(6.58) (7.13)(8.12)
Constant−34.872 ***−2.357Constant−34.020 ***−2.605
(−19.84)(−0.51) (−20.03)(−0.72)
Year and IndControlledControlledYear & IndControlledControlled
N57475733N70657041
Adj. R20.2150.720Adj. R20.2210.728
***, **, * represent 1 the %, 5%, and 10% level of significance, respectively. T-values are presented be-neath the coefficient estimates in parentheses.
Disclaimer/Publisher’s Note: The statements, opinions and data contained in all publications are solely those of the individual author(s) and contributor(s) and not of MDPI and/or the editor(s). MDPI and/or the editor(s) disclaim responsibility for any injury to people or property resulting from any ideas, methods, instructions or products referred to in the content.

