Article

Will Green Innovation Bring about the Financial Spillover Effect? Evidence from China’s High-Carbon Listed Companies

Accounting College, Hunan University of Technology and Business, Changsha 410082, China
*
Author to whom correspondence should be addressed.
Sustainability 2023, 15(1), 89; https://doi.org/10.3390/su15010089
Submission received: 31 October 2022 / Revised: 16 December 2022 / Accepted: 19 December 2022 / Published: 21 December 2022
(This article belongs to the Special Issue Corporate Social Responsibility and Environmental Resource Governance)

Abstract

:
Is there a spillover effect from enterprises’ green innovation activities that promotes the coordinated development of the economy and the environment? Very few studies examine the impact of green innovation on corporate performance. Based on the data from Chinese listed firms in high-carbon industries from 2000 to 2021, this paper finds that green innovation has a significant promotion effect on enterprise performance, and the degree of regional intellectual property protection and enterprises’ financial resource base positively regulate the relationship between green innovation and enterprise performance. Further heterogeneity analysis shows that high-quality green innovation can better promote improvements in enterprise performance. In nonstate-owned enterprises, the spillover effect of such high-quality green innovation is more significant than that in state-owned enterprises. Meanwhile, the heterogeneity of the corporate governance level also affects the relationship between green innovation and enterprise performance. Green innovation has played a more significant role in promoting company performance in companies with high equity ratios. Finally, this paper proposes that companies should completely utilize their resource advantages to carry out high-quality green innovation practices to realize the coordinated development of the economy and the environment. This study provides empirical evidence and policy implications for accelerating the high-quality, sustainable development of enterprises.

1. Introduction

Environmental issues have increasingly become a global concern for people from all walks of life [1]. As an important creator of social and economic wealth and a claimant of natural resources, enterprises are the most critical factor in coordinating economic development with ecological and environmental protection and achieving sustainable economic development [2]. How to achieve environmental sustainability while maintaining economic growth is the key issue to be solved [3]. At present, innovation-driven, high-quality development has increasingly become the mainstream of sustainable economic development, and green innovation has attracted the attention of many scholars in recent years. As a key way for enterprises to achieve green transformation [4], green innovation is widely regarded by stakeholders as an important strategy to achieve enterprises’ sustainable development goals [5]. Therefore, we cannot help but wonder what impact green innovation will have on corporate performance. Can enterprises carry out green innovation activities to achieve a sustainable development strategy that takes into account the dual goals of “steady growth” and “excellent environment”?
The literature on green innovation mainly focuses on its relevant driving factors. On the one hand, the pressure of environmental regulation is discussed from the perspective of the external environment [6,7,8,9] and stakeholder pressure [10,11] on corporate green innovation practices. On the other hand, from the perspective of the internal environment, this paper discusses the driving effect of managers’ environmental cognition and organizational resource capability on green innovation [12,13]. However, academia has not reached a consensus on whether green innovation can improve corporate performance. Scholars who hold the view of “promotion” believe that green innovation can effectively improve the utilization rate of corporate resources, reduce corporate costs [14], meet the green needs of consumers, improve the green competitiveness of enterprises, and afford competitive advantages. Then, enterprise performance is improved [15,16]. Scholars who hold the view of “inhibition” believe that enterprises’ investments in green innovation activities crowd out enterprise resources, increase the additional costs of enterprises, and thus have a negative impact on enterprise performance [5]. Some scholars also believe that the relationship between green innovation and enterprise performance shows a nonlinear, U-shaped relationship [17].
Through a literature review, it was found that studies on green innovation achieve some valuable results but still have the following shortcomings. First, the existing discussion on the relationship between green innovation and corporate performance is mostly from the overall perspective of the whole industry and lacks a comparison of the different industries. Second, the discussion on the impact mechanism of green innovation on corporate performance is insufficient, and there is a lack of in-depth mechanism analysis on how green innovation affects corporate performance. Third, few existing studies distinguish the nature of green innovation and whether it is high-quality green innovation. Based on this background, this paper takes data on Shanghai and Shenzhen A-share listed companies in heavy pollution industries for 2000–2021 as the research sample and shows an empirical relationship between green innovation and business performance. Based on the dual perspective of the internal and external environments of an enterprise, we consider the areas of intellectual property protection and financing restraints as adjustment variables in the relationship between green innovation and enterprise performance. By mining the influence mechanism of the green innovation and enterprise performance relationship between situational factors, further analysis found that the heterogeneity of high-quality green innovation that can promote enterprise performance has increased more in nonstate-owned enterprises than in state-owned enterprises (SOEs). The high-quality spillover effect of green innovation is more significant. At the same time, the heterogeneity in corporate governance levels also affects green innovation and its relationship with corporate performance. Green innovation plays a more significant role in promoting corporate performance in companies with a high equity ratio than in companies with a low equity ratio. Finally, in this paper, we propose that companies should give full play to their resource advantages to carry out high-quality green innovation practices to realize the coordinated development of the economy and the environment. The research contribution of this paper is that it provides empirical evidence and policy enlightenment related to accelerating the high-quality development of enterprises and carrying out green innovation practices to achieve a sustainable development strategy that takes into account the dual goals of “steady growth” and “excellent environment.”
The remainder of the paper is organized as follows: Section 2 presents the theoretical background, reviews previous studies, and suggests hypotheses; Section 3 dis-cusses the data, variable measurement methods, and empirical model used in this study. Section 4 reports the results of empirical analysis and conducts a series of robustness tests. Finally, Section 5 summarizes the research conclusions and significance, analyzes the limitations, and proposes suggestions for future research.

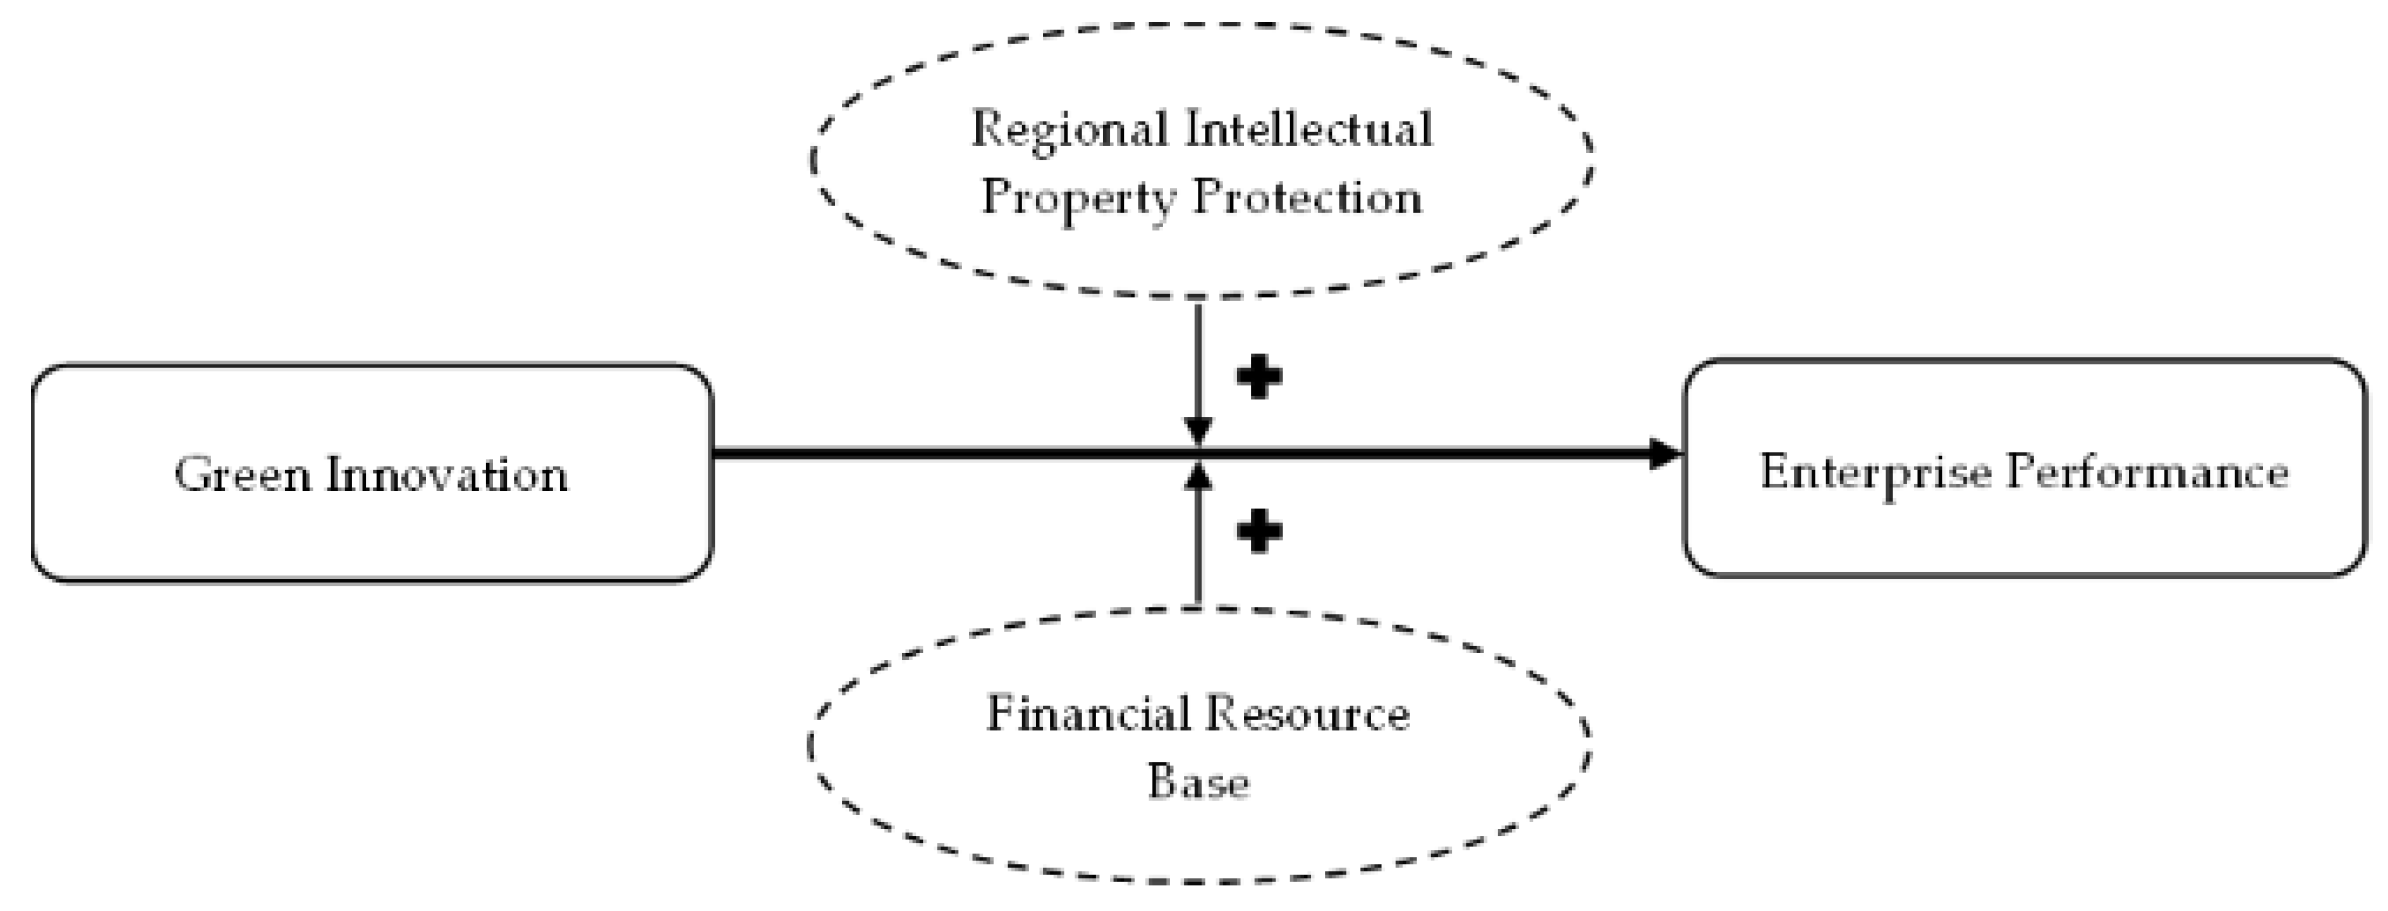
2. Theoretical Basis and Research Hypotheses

2.1. Green Innovation and Enterprise Performance

Green innovation refers to the general term for the technologies, processes and products that follow ecological principles and ecological economic laws [18] and can not only achieve value-added for customers and enterprises but also significantly reduce the adverse impacts on the environment [15,19,20] and achieve win-win economic and environmental benefits. Compared with traditional innovation activities, green innovation emphasizes its unique attributes of environmental benefits in product design, technological process, market positioning, consumption experience and other aspects [21]; green innovation emphasizes the efficient use of resources and an effective reduction in pollution through new knowledge, new technology and new ideas [22]. In addition, green innovation can not only help enterprises obtain good environmental effects but also promote improvements in economic benefits [5,23,24]. At present, most of the research on green innovation focuses on three aspects: green process innovation, green product innovation and green management innovation. First, green process innovation includes the two aspects of clean production technology innovation and terminal treatment technology innovation [25,26], and these two forms of green innovation are complementary [27]. Clean production technology innovation focuses on improving energy efficiency at the source through energy substitution, process improvements and resource recycling [16], as well as preventing and reducing the generation of pollutants. In the long run, on the one hand, cleaner production technology innovation can reduce the negative environmental externalities of enterprises; on the other hand, cleaner production technology innovation can reduce costs by accelerating innovation [28,29], thus promoting improvements in enterprise performance. End governance focuses on technology innovation through the control of industrial pollutants to reduce pollution emissions. Although increased costs accompany the practice, environmental governance reduces the environmental impact of an enterprise, earns enterprises a good social reputation, enhances enterprises’ competitive advantages, and has a positive impact on enterprise performance [30,31,32,33]. Second, green product innovation can fully tap into the blind areas of resource utilization, encourage enterprises to explore new development channels, and ultimately improve enterprise performance [34,35]. In addition, the outstanding green attributes of products help enterprises form differentiated competitive advantages, and such advantages can help them obtain environmental premiums and improve their performance [36]. Finally, enterprises implementing green management innovation can improve the efficiency of resource allocation and use by adopting green management technologies and methods [37,38], enhance their overall green learning ability [39,40], and enhance their competitive advantages in the market [4,41]. At the same time, green management innovation also helps enterprises build a green image that actively reflects social responsibilities and generates a good reputation effect [16].
Green innovation is a long-term, dynamic evolution process that requires enterprises to constantly seek new resources and identify new opportunities. In addition, the continuous accumulation of green resources and capabilities provides strong support for the implementation of green innovation. The continuous pursuit of market demand and current development trends enable enterprises to gain an advantage over competitors and finally win the favor of consumers, thereby gaining market share and improving performance. Therefore, this paper proposes the following hypothesis.
Hypothesis 1 (H1).
Green innovation has a positive impact on the performance of listed firms in heavily polluting industries.

2.2. Degree of Intellectual Property Protection, Green Innovation and Enterprise Performance

The intellectual property protection system and technological innovation under its protection have increasingly become decisive factors in enhancing comprehensive national strength. On the one hand, based on externality theory, the intellectual property acquired by enterprises through R&D activities has the risk of being imitated by other enterprises. In areas where weaker protection of intellectual property rights is more likely to induce infringement and inert green technology innovations [42], once a company’s innovations are mastered by rivals, it will not only affect the company’s enthusiasm for innovation but also affect its ability to break through with leading technology and innovation and, thereby, adversely affect improvements in its performance. Therefore, in an environment where market regulation fails, effective intellectual property protection can reduce the risk of enterprises’ R&D achievements being stolen, alleviate the externalities of intellectual property to a certain extent, and help improve the expected returns of enterprises’ R&D investments [43,44]. Compared with nongreen innovation, green innovation needs more incentivization [45]. At the same time, to effectively ensure that intellectual property rights can fully stimulate their research enthusiasm and innovation power, enterprises must be more willing to increase their R&D investments. Through technology upgrades and product updates, the enterprise will have a unique competitive advantage, realize an expansion of its market share, and promote its performance. On the other hand, enterprises’ R&D activities largely depend on whether they can obtain sufficient external financing [46]. Based on information asymmetry theory, in regions with a higher degree of intellectual property protection, enterprises are more willing to actively disclose information on R&D innovation to external stakeholders, thus alleviating the problem of information asymmetry. Improvements in corporate information transparency enable investors to deepen their understanding of R&D project information and future prospects, so they are more willing to provide innovation financing to enterprises. Improvements in financing capacity, in turn, further promote the innovation investments of enterprises, and the virtuous cycle between the two further promotes continuous improvements in enterprise performance. Therefore, this paper proposes the following hypothesis.
Hypothesis 2 (H2).
The degree of regional intellectual property protection has a moderating effect on the relationship between green innovation and firm performance in heavily polluting industries.

2.3. Resource Base, Green Innovation and Enterprise Performance

According to the resource-based view, the resources owned by enterprises strongly affect their decision making and play an important role in building their long-term competitive advantages. Therefore, resource allocation has always been a strategic issue that enterprises should focus on. However, innovation activities are often characterized by high risks, which require large-scale R&D investments and continuous capital investments. A higher level of financing constraints undoubtedly increases the risk perception of innovation activities [47]. Therefore, the strength of enterprises’ resources and their resistance to risk are particularly important to their innovation practices. At the same time, as the internal driving force of enterprise technological innovation, R&D investments play a crucial role in ensuring long-term operations and improving enterprise performance. At present, existing studies have confirmed that enterprises’ innovation investments have a positive promotion effect on their performance [48,49]. As a form of innovation activity, green innovation practices require large investments and have increased risk, long cycles, and strong uncertainty related to transforming achievements and creating economic benefits. Therefore, the enthusiasm and initiative of enterprises in carrying out green innovation practices are easily affected by their resource strength [3], and the output of green innovation is closely related to their performance levels.
In summary, a firm’s resource base is closely related to its innovation investments, and the impact of an innovation practice on firm performance depends on the level of financial constraints. Therefore, this paper proposes the following hypothesis.
Hypothesis 3 (H3).
The resource base has a moderating effect on the relationship between green innovation and firm performance in heavily polluting industries.
The theoretical model of this paper is shown in Figure 1.

3. Research Design

3.1. Sample Selection and Data Sources

In this paper, data on China’s A-share listed enterprises in heavy pollution industries from 2000 to 2021 are used as samples. This paper selects 16 heavily polluting industries, such as coal, mining, textile, tanning, paper making, petrochemical, pharmaceutical, chemical, metallurgy and thermal power. The data related to the green innovation of listed companies in this paper come from the State Intellectual Property Office of the People’s Republic of China (SIPO), and we manually collect the corresponding data. Data for the remaining variables come from the CSMAR database. After collecting the original data, this paper processes them as follows: (1) we eliminated enterprises treated as ST, *ST and PT in the sample; (2) we eliminated missing data during the study period and observed values in an IPO year; and (3) all continuous variables were winsorized at the 1% level to avoid the influence of extreme values. After the above screening, a total of 12,490 company-year observations were obtained.

3.2. Definition of Variables

3.2.1. Explained Variable: Enterprise Performance

The literature has mainly used Tobin’s Q value, return on total assets, return on equity and other indicators to measure corporate performance. Tobin’s Q reflects the ratio of the value of an enterprise’s assets between two different valuation methods. Tobin’s Q more effectively than other measurements combines an enterprise’s market and financial data to better evaluate its growth in value. A high Tobin’s Q value means a high return on investments, and corporate earnings growth is often used in related research. Therefore, referring to the method of Zhu and Zhang [49], this paper adopts Tobin’s Q to measure enterprise performance.

3.2.2. Explanatory Variable: Green Innovation

Green innovation generally refers to technologies, processes and products that reduce environmental pollution and the use of raw materials and energy [50]. Compared to traditional innovation, green innovation emphasizes the use of new technologies and concepts to achieve efficient use of resources and effective pollution reduction [51]. At present, the international authoritative institutions World Intellectual Property Organization (WIPO) and the Organization for Economic Cooperation and Development (OECD) have given the most comprehensive definition of green technology innovation. Their classification of green technology innovation includes the disposal of pollutants related to environmental pollution and green technology related to climate change mitigation, and both are based on patented technology classification. Patent data contain a large amount of microinformation, such as technology segments, applicants, and filing dates, which has natural advantages as a measure of green innovation [52] and is a suitable indicator for measuring green innovation. Therefore, this paper uses the number of green patent applications of the sample companies to measure the level of their green innovation. The green technology innovation of high carbon enterprises is generally in the aspects of cleaner production technology and end-treatment technology. Therefore, this paper uses the IPC classification numbers for green patents listed in the International Patent Green Classification List launched by the World Intellectual Property Organization (WIPO) in 2010 and draws on the research of Qi et al. [53] and Li and Xiao [3]. We take alternative energy production, waste management and energy conservation as specific green patent projects. Then, on the SIPO advanced search page, listed companies in heavy pollution industries are manually sorted, and green patent applications are organized with the number 1. Then, the natural logarithm is used to measure the level of green innovation of listed companies in a heavily polluting industry. For a company, the larger the value is, the greater its level of green innovation.

3.2.3. Moderating Variables

  • Resource base
Referring to the research of Liu and Liu [54], this paper uses the ratio of EBIT to interest expense, namely, the interest coverage multiple (IPM), to measure the degree of enterprises’ financial constraints. The larger the value is, the lower the degree of financing constraints and the stronger the resource strength of the enterprise.
2.
Regional intellectual property protection degree
Drawing on the research of Tian and Hao [55], this paper uses the ratio of technology market turnover to local GDP in each region to measure the level of regional intellectual property protection (IPP).

3.2.4. Control Variables

To exclude the influence of other factors on the results of the regression analysis, this paper refers to the research of Huang and Li [56], Zhang et al. [57], Gu and Ouyang [58], and Liu and Liu [59] and controls the following indicators, which may affect enterprise performance as control variables: (1) enterprise size (Size): natural logarithm of the total assets of the enterprise; (2) capital structure (Lev): total liabilities/total assets; (3) enterprise age (Age): natural logarithm of enterprise age; (4) enterprise growth (Growth): (current operating income—previous operating income)/previous operating income; (5) cash flow (Ocf): net cash flow from operating activities/total assets; and (6) ownership concentration (Top1): shareholding ratio of the first shareholder. In addition, the year dummy variable (Year), industry dummy variable (Industry) and region dummy variable (Province) are added to control for year, industry and region effects. To alleviate the endogeneity problem and take into account the possible time lag of enterprise performance itself, this paper uses the explanatory variable method lagged by one period. The definition of each variable is shown in Table 1.

3.3. Model Establishment

To test the impact of the green innovation of listed companies in heavily polluting industries on corporate performance, this paper constructs Model (1). In Model (1), this paper mainly focuses on the direction and significance of the coefficient β1 of the explanatory variable lnG. If the green innovation activities of listed firms in heavily polluting industries have a promotion effect on firm performance, then β1 should be significantly positive, assuming that hypothesis H1 is supported.
TobinQi,t = β0 + β1 lnGi,t−1 + Σβn Controlsi,t + Year + Industry + Province + εi,t

4. Results

4.1. Descriptive Statistics of Variables

Table 2 shows that the mean value of lnG, the green innovation level of listed companies of heavy pollution industries in China, is 0.261, the median is 0, and the standard deviation is 0.628. More than half of the listed companies in heavy pollution industries have no green innovation output, which shows that listed companies in heavy pollution industries in China have an overall low green innovation level and that there are large differences in different enterprises’ green innovation levels. The mean value of Tobin’s Q is 1.780, and the median value is 1.383, but the difference between the companies is large, with the standard deviation reaching 1.207. The descriptive statistics of the other control variables are consistent with existing research [56,57,58,59] and are not repeated here.
The correlation coefficients of the variables are reported in Table 3. After a further multicollinearity diagnosis, the results of the variance inflation factor (VIF) test of each variable show that the maximum VIF value is 1.63, far less than the critical value of 10, proving that there is no significant multicollinearity among the variables, and multicollinearity will not affect subsequent regression results.

4.2. Hypothesis Testing

4.2.1. Direct Effect Test

To investigate the impact of the green innovation activities of listed enterprises in heavy pollution industries on enterprise performance, this paper first conducts a regression analysis using Model (1), and Table 4 lists the regression results. Table 4 shows that the regression coefficients of lnG, the green innovation level, lagged by 1–3 periods are 0.060, 0.044 and 0.060, respectively, and the significance level is no less than 10%.
The results show that the green innovation activities of listed enterprises in heavily polluting industries have a significant promotion effect on corporate performance. The regression results of other control variables show that more abundant cash flow results in higher growth, a longer enterprise establishment period, and higher enterprise performance. The scale of the company and the degree of ownership concentration are significantly negatively correlated with corporate performance. Moreover, as corporate debt increases, corporate performance decreases significantly. The correlation between these control variables and the enterprise performance level dependent variable is consistent with that in the previous literature [57,60,61].

4.2.2. Moderating Effect of Regional Intellectual Property Protection on the Relationship between Green Innovation and Enterprise Performance

In the pilot period before the regulations for intellectual property rights (IPR) protection went into effect, the intellectual property protection level by enterprise region was greater than the annual median. The industries of the listed companies in heavy pollution industries are divided into high and low intellectual property protection groups, and the green innovation and relationship between the performance points of the sample are analyzed. The regression results in Table 5 show that green innovation has a significant promotion effect on enterprise performance only in the group with high intellectual property protection. This result shows that improvements in regional intellectual property protection can enhance the promotion effect of green innovation on enterprise performance; that is, Hypothesis H2 is verified.

4.2.3. Moderating Effect of the Resource Base on the Relationship between Green Innovation and Enterprise Performance

Before testing the moderating effect of the degree of financing constraints, we introduce the dummy variable IPM_dummy and divide the samples into strong and weak resource-based groups according to whether the interest guarantee multiple is greater than the annual and industrial medians. If the enterprise’s interest guarantee multiple is greater than the median of the sample, then its financing constraints are low and its resources are strong, and the IPM_dummy is assigned a value of 1; otherwise, it is assigned a value of 0. The regression results in Table 5 show that green innovation has a significant promotion effect on enterprise performance only in the group with low financing constraints. This result shows that the degree of corporate financial constraints has a moderating effect on the relationship between green innovation and corporate performance.

4.3. Robustness Test
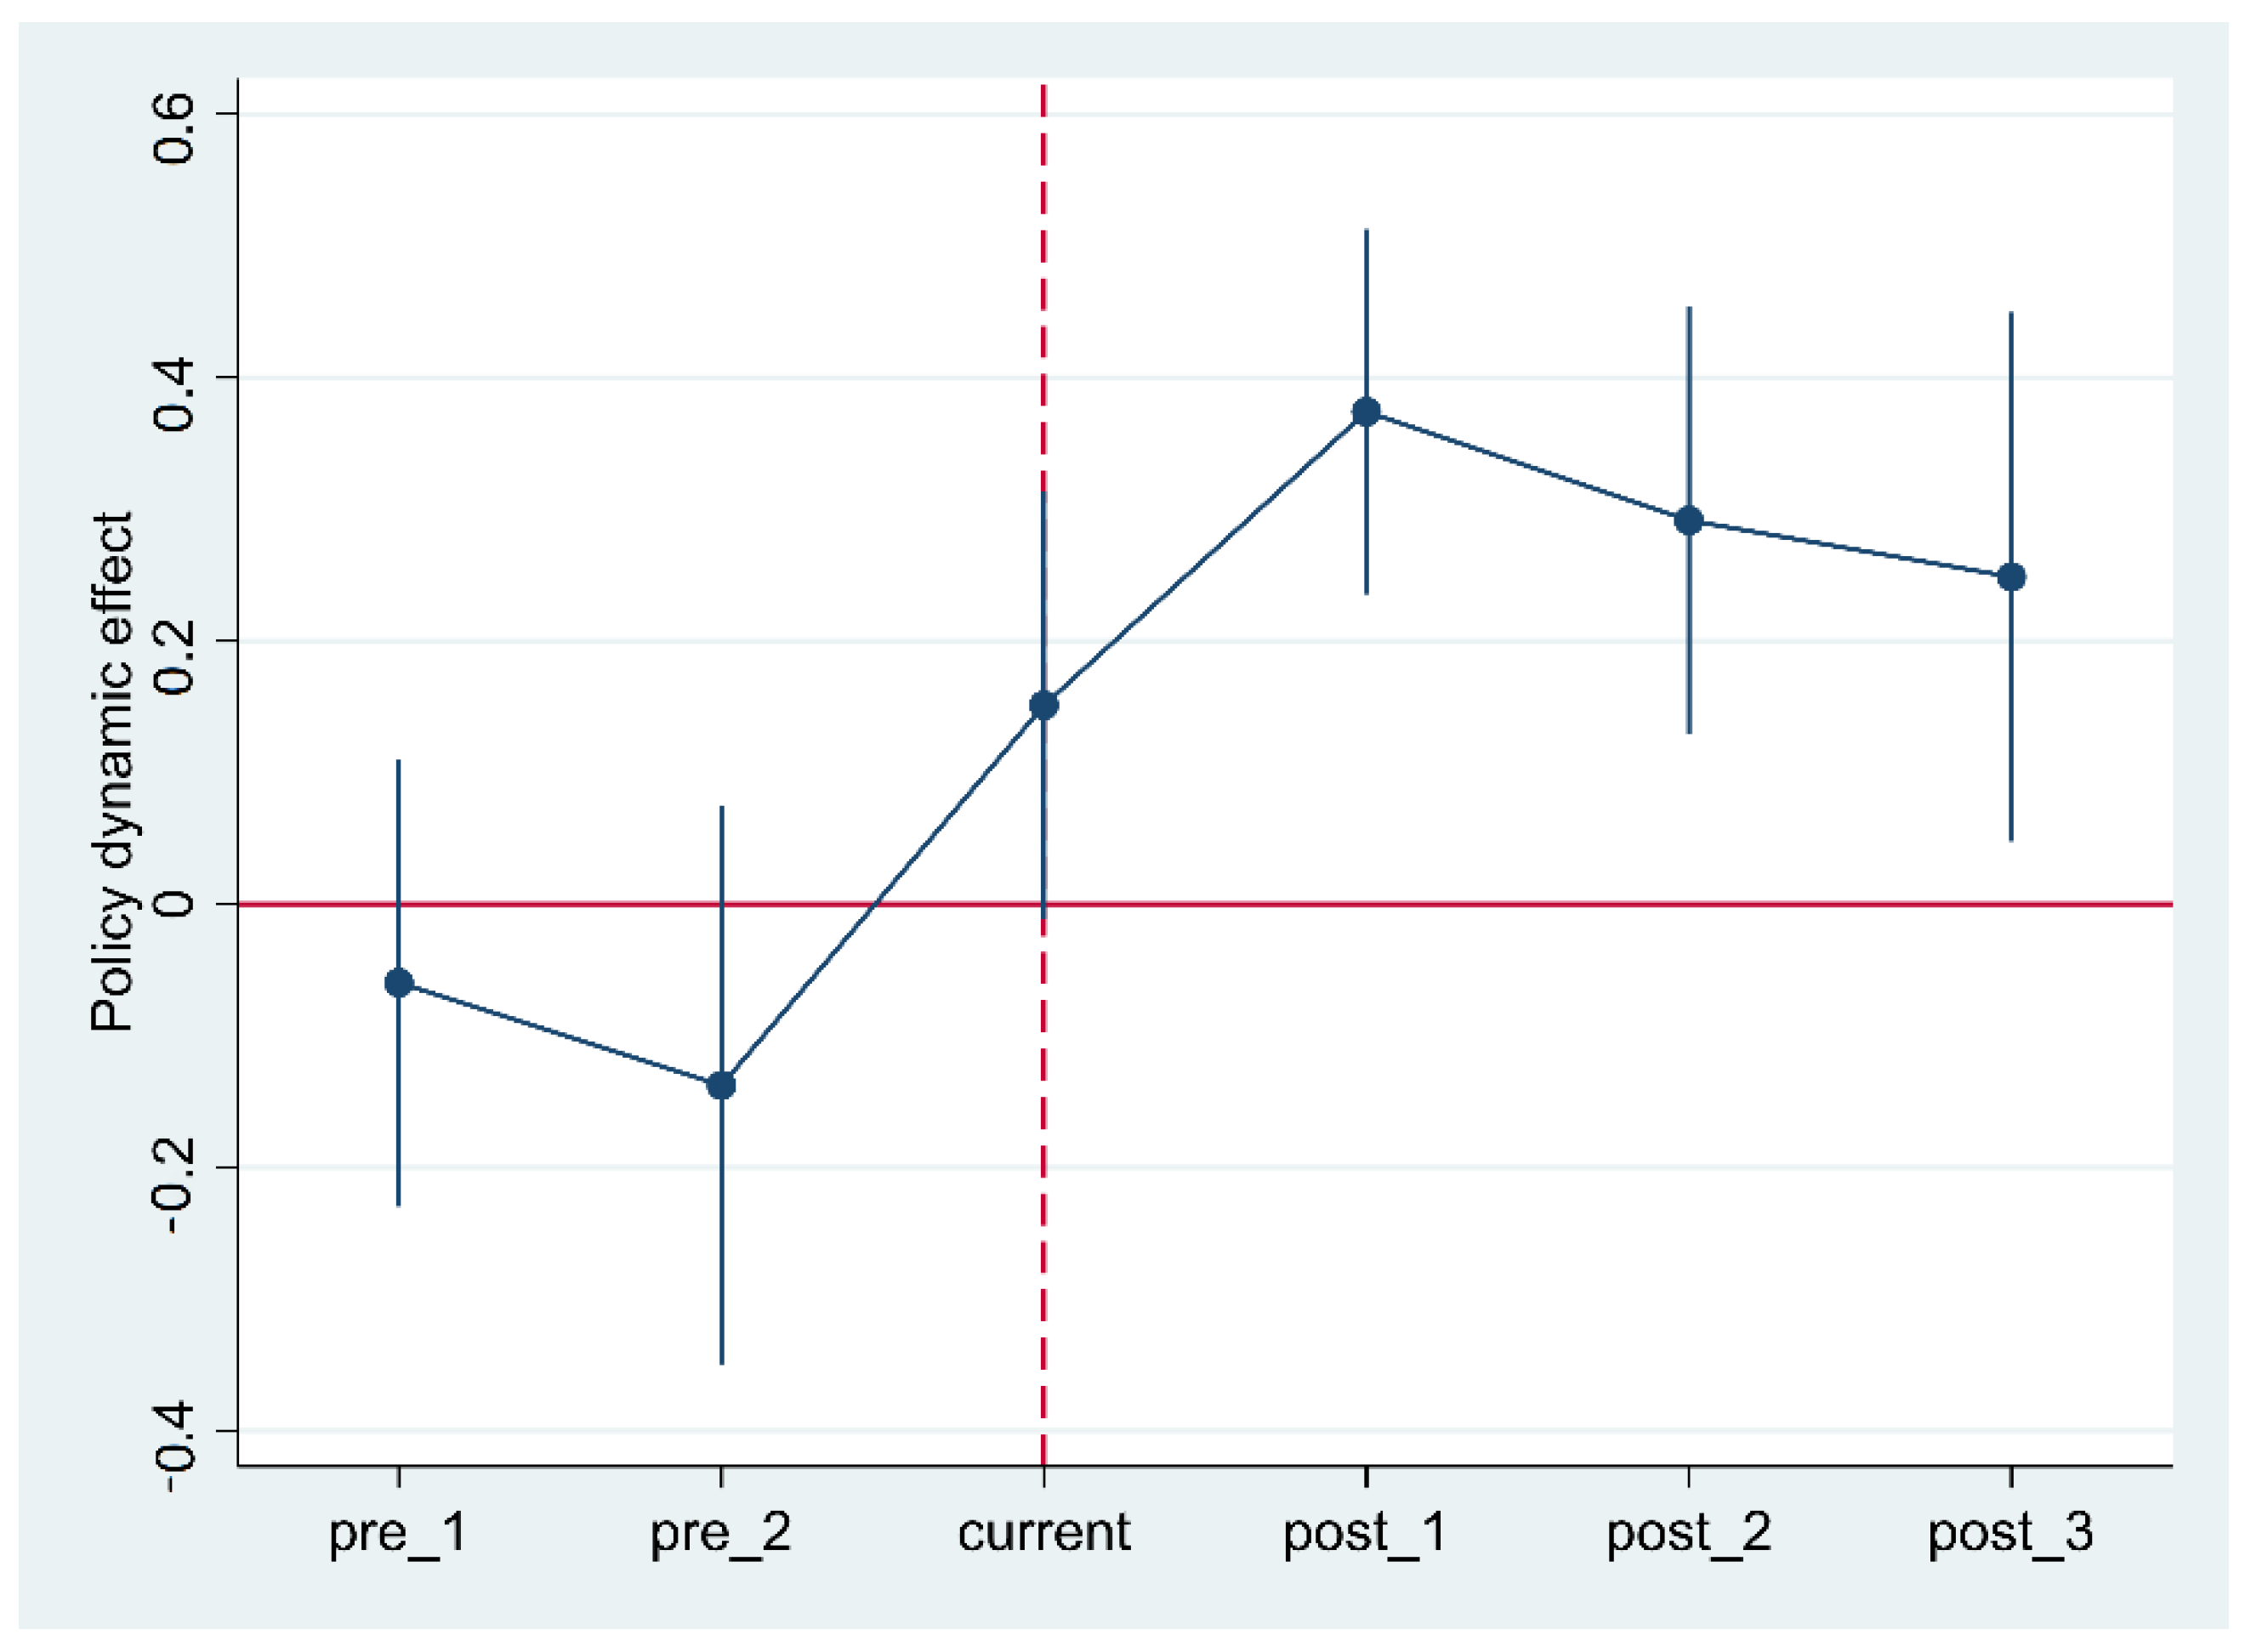
4.3.1. DID Test

To better solve the endogeneity problem, this paper uses the Environmental Protection Tax Law of the People’s Republic of China, which was passed on 25 December 2016, and officially implemented on 1 January 2018, as an exogenous policy shock to again conduct the difference-in-differences (DID) test on the relationship between green innovation and enterprise performance of listed enterprises in heavily polluting industries. Considering that the impact of policies on enterprises with different characteristics will be quite different, this paper constructs the control group and the experimental group based on such characteristic differences by referring to the literature [62]. Specifically, referring to the practice of Liu and Cao [63] and Wu et al. [62], this paper calculates the mean value of green innovation (lnG) of listed enterprises in the three years before the formal implementation of the Environmental Protection Tax (2015–2017) and uses the third percentile to classify the level of green innovation. That is, enterprises with a green innovation level higher than that of the upper third are included in the experimental group, and Treat takes the value of 1. Listed companies with a green innovation level lower than that of the lower third are included in the control group, and Treat takes the value of 0. For the time window, we select the three years before and after the formal implementation of the Environmental Protection Tax as the standard (2015–2020). The measurement model is as follows:
TobinQi,t = β0 + β1 Treati,t × Afteri,t + β2 Treati,t + β3 Afteri,t + Σ βn Controlsi,t + Year + Industry + Province + εi,t
In Model (2), the coefficient β of Treat×After1 is the focus of this paper. In addition, the premise of the DID test is that there is a parallel trend between the explained variables of the experimental group and the control group samples before the policy. To this end, this paper combines the event study approach to test the parallel trend in the dynamic effect of policy implementation, and the results are shown in Figure 2. We take the year before the policy (2017) as the benchmark group, and the black vertical line in the figure is the 95% confidence interval. The explained variable (lnG) in this paper satisfies the common trend before the implementation of the policy (Figure 2) (Table 6).

4.3.2. PSM Test

Considering that not all enterprises engage in green innovation behaviors, this paper further adopts the propensity score matching method to solve the estimation errors caused by sample selection errors in the regression analysis. First, the dummy variable Green_dummy is generated for green innovation. This paper takes enterprise size (Size), enterprise age (Age), capital structure (Lev), enterprise growth (Growth), cash flow (Ocf) and ownership concentration (Top1) as characteristic variables. The logit model is used to regress all characteristic variables (control variables) on Green_dummy and calculate the propensity score value. Then, the nearest neighbor matching method is used for one-to-many matching. Finally, the samples satisfying the common support hypothesis are retained and retested using Model (1). According to Table 7, the regression results are consistent with the above conclusions.

4.3.3. Heckman Test

This paper uses the Heckman two-step method to control the sample selection of whether enterprises conduct green innovation. The Heckman test is carried out in two steps. If the enterprise chooses green innovation, the Green_dummy is assigned the value of 1; otherwise, it is assigned the value of 0. Since a certain decision-making activity of an enterprise is easily affected by the same activities of other enterprises in the same industry and region [64], we refer to the practice of Li and Xiao (2020) and take the mean value of green innovation of other listed enterprises in the same industry as the instrumental variable for whether the enterprise conducts green innovation. At the same time, in the first-stage regression equation, the explanatory variables of redundant resources SR (the natural logarithm of a firm’s operating income), R&D intensity RI (the ratio of R&D investment to operating income), enterprise size (Size), capital structure (Lev), enterprise age (Age), enterprise growth (Growth), cash flow (Ocf) and ownership concentration (Top1) are also included to predict the possibility that enterprises engage in green innovation. The specific model is as follows:
Probit (Green_dummyi,t) = β0 + β1 IV_Greeni,t + β2 SRi,t + β3 RIi,t + β4 Sizei,t + β5 Levi,t + β6 Agei,t + β7 Growthi,t + β8 Ocfi,t + β9Top1i,t + εi,t
Among them, the probit (Green_dummyi,t) represents the probability that the ith sample chooses to carry out green innovation. In the second stage, we add to Model (1) the inverse Mills ratio obtained in the first stage. The results show that in the first stage, the regression coefficient of the instrumental variable is significantly positive at the 1% level, indicating that this variable is valid. In the second stage, the regression coefficient of lnG is significantly positive at the 1% level. Therefore, after controlling for the endogeneity of whether enterprises conduct green innovation, the results are still consistent with the above (Table 8).

4.3.4. Change the Measurement Method of Variables

This paper adopts three other methods to measure green innovation and uses Model (1) to retest it. First, the natural logarithm of the number of green patents granted by enterprises in the current year plus 1 (lnGrant) is used to remeasure green innovation. Second, the natural logarithm of the total number of patent applications +1 (lnPatent) is used to remeasure green innovation. Third, the green innovation propensity index (Green) is used to remeasure green innovation and takes the value of 1 if a company has at least one green patent and 0 otherwise. The results in Table 9 show that regardless of the measurement method of the independent variables, the regression coefficient of green innovation is significantly positive. These results are consistent with the research conclusions of this paper.

4.4. Heterogeneity Test

4.4.1. Examining the Heterogeneity of Patent Types

To further ensure the robustness of the regression results, we examine the effects of different types of green innovation activities on enterprise performance. In the patent database of SIPO, there is a greater possibility of green innovation activities for invention patents and utility model patents. Based on enterprises’ motivation to engage in green innovation, we divide green innovation into substantive green innovation and strategic green innovation. In the empirical analysis, the natural logarithm of the number of green invention patent applications plus 1 (lnGI) and the natural logarithm of the number of green utility model patent applications plus 1 (lnGU) are used as the measurement indicators of the two types of green innovation to verify the impact of different types of green innovation activities on enterprise performance. According to the regression results in Table 10, we find that the coefficients of lnG and lnGI are significantly positive, while the coefficient of lnGU is not significant, indicating that an increase in green patents, especially green invention patents, while the application of green utility model patents has no significant relationship with enterprise performance. This result shows that substantive innovation oriented by technological progress is the source of corporate value, while strategic innovation can enable enterprises to obtain other benefits but cannot increase their long-term value [65].

4.4.2. Examining the Heterogeneity of Enterprise Ownership

To further investigate the promotion effect of the green innovation of listed enterprises in heavily polluting industries on the performance of enterprises with different ownership structures, we let SOE be the index of enterprise ownership type; that is, the value of SOE is 1 for SOEs and 0 otherwise. The regression results in Table 11 show that the regression coefficients of lnG and lnGI are only significant in the nonstate-owned group. Among them, the regression coefficient of lnG in the nonstate-owned group is 0.125, which is significantly positive at the 5% level. The regression coefficient of lnGI in the nonstate-owned group is 0.214, which is significantly positive at the 1% level. The coefficient of lnGU is nonsignificant in both state-owned and nonstate-owned groups.
This means that the nature of property rights has the effect of inhibiting the positive impact of green innovation on firm performance because under the traditional economic system, SOEs themselves are in a dominant position, with more key resources, higher political legitimacy, and advantages in market access and financing that non-SOEs lack [66]. In addition, as a special political subject, SOEs consider the realization of both economic and social goals at the same time and cannot pursue profit maximization as their only goal. However, non-SOEs have clearer business objectives for achieving profit maximization and long-term development than do SOEs, and their green innovation is pursued more to realize economic value. Therefore, compared with SOEs, non-SOEs’ green innovation activities have a greater positive impact on their performance [67]. At the same time, when grouping enterprise ownership types, the impact of different types of green innovation on enterprise performance is also consistent with the above findings.

4.4.3. Equity Ratios

Major shareholders often hold more residual control rights and easily overlook the interests of minority shareholders. According to principal–agent theory, a certain degree of equity restrictions can avoid the situation of “one dominant share” in enterprises, balancing the shareholding ratio of major shareholders and effectively reducing the second type of agency cost [68]. At the same time, the existence of equity restrictions is conducive to enhancing the participation of major shareholders in corporate governance, improving the realization of effective management supervision, improving governance quality, promoting corporate growth and improving corporate performance [69]. Therefore, based on the practice of Chen and Chen [70], this paper uses the ratio of the sum of the shareholding ratio of the second to the fifth largest shareholders to the shareholding ratio of the largest shareholder to measure the equity ratio of the enterprise. According to whether the equity ratio of enterprises is greater than the annual and industry medians, we divide the enterprises into high and low equity ratio groups to test the relationship between green innovation and the performance of listed enterprises in heavily polluting industries by subsamples. The regression results in Table 12 show that green innovation has a significant promotion effect on enterprise performance only in the group with high equity restrictions. This finding further shows that a high equity ratio is more conducive to improving corporate governance, improving the decision-making efficiency of enterprises, helping enterprises grasp the best investment opportunities, promoting enterprises’ R&D activities, and further affecting enterprises’ performance.

5. Research Conclusions and Implications

In the context of China’s vigorous promotion of high-quality development, green innovation is the key for enterprises to achieve green transformation and the strategic choice for promoting enterprises’ sustainable development. Based on data on Chinese A-share listed firms in heavily polluting industries from 2000 to 2021, this paper manually collects relevant information on green innovation, empirically tests the impact of green innovation on firm performance, and examines the moderating effect of regional intellectual property protection and financial constraints on their relationship. The main conclusions are as follows. (1) Green innovation has a significant promotion effect on enterprise performance, and this conclusion is still valid after the robustness test for controlling endogeneity and changing the variable definitions. (2) The degree of regional intellectual property protection positively moderates the relationship between green innovation and firm performance; that is, the higher the degree of regional intellectual property protection is, the stronger the promotion effect of green innovation on firm performance. (3) The resource base of enterprises positively moderates the relationship between green innovation and enterprise performance; that is, the lower the level of financial constraints of enterprises is, the stronger the resource strength and the promotion effect of green innovation on enterprise performance. (4) Further research finds that substantive green innovation but not strategic green innovation promotes improvements in enterprise performance. In addition, the promotion effect of green innovation on corporate performance depends on the level of internal corporate governance; that is, green innovation plays a more significant role in promoting the performance of companies with a high equity ratio.
The current study has several theoretical and practical implications. In terms of theoretical implications, we have noticed that by developing eco-innovation, environmental reputation can be improved and consequently so can market competitiveness [70]. This study provides further evidence that green innovation can bring about positive financial-related spillovers. At the same time, existing studies show that relevant environmental regulation policies promote the expansion of enterprises’ green technology innovation quantity but also lead to a decline in the quality of related innovation activities. Companies tend to “emphasize quantity over quality” strategy responses and lack substantial improvement in enterprise value and development quality [9,66]. This study distinguishes the quantity and quality of green innovation patents and finds that high-quality green innovation can increase financial performance, which enriches the research content of the spillover effect of green innovation.
The current study offers several potential implications for practice. First, enterprises raise green innovation to a strategic level to stimulate enterprise managers to adopt green development, develop green environmental protection consciousness, increase the intensity of R&D investments in green, integrate technology improvements and product design processes into green development, constantly improve the quality of green innovations, set up a green enterprise image, enhance their green competitiveness, and create a unique competitive advantage. Second, when engaging in green innovation practices, enterprises should fully consider the strength of their resources. Enterprises with few resources should actively expand their financing channels, while government departments should reduce their credit discrimination, strengthen green credit support for enterprises, and increase incentives for green innovation. Third, the government should strengthen the protection of intellectual property rights. Government departments at all levels should increase publicity for protecting intellectual property rights and enhance the legal system’s awareness of protecting intellectual property rights while increasing the enforcement of intellectual property laws in courts at all levels, thus improving the legal environment for enterprise green innovation and actively promoting the green transformation of regional economic development and enhancing economic strength.
This research, like previous studies, has limitations that open the path for future empirical research. First, the sample size of the study in this paper is not large enough because the data on green innovation are manually sorted, which requires a large amount of work, and most of the existing studies are about heavily polluting industries. Therefore, this paper only examines listed companies in high-carbon industries, which limits the universality of the research results to a certain extent. In the future, we can increase the workload and expand the sample scope to include the data of all listed companies for further verification and analysis. Second, the study of this paper only starts from the green innovation activities of enterprises themselves and examines the corresponding spillover effects. It lacks the impact of the green innovation of upstream companies in the supply chain on business performance from the perspective of the life cycle [51], which provides space for further research in the future. Third, although we believe that regional intellectual property protection and firms’ own financial resource base will affect the financial spillover effect of firms’ green innovation, our study finds that it is more of a correlation than a causal relationship. Future studies can try to find appropriate instrumental variables or mediating variables for analysis to conduct a more robust analysis of causality. Despite the above limitations, we believe that our study is relevant in the context of contemporary China, where sustainable carbon reduction innovations and high-quality corporate development are gaining more public attention.

Author Contributions

Methodology, M.Z.; Formal analysis, P.Z.; Data curation, Y.S.; Writing—original draft, M.Z.; Writing—review & editing, P.Z. All authors have read and agreed to the published version of the manuscript.

Funding

This research was funded by the Scientific Research of Education Department of Hunan Province, grant number 19B320 and by the Social Science Foundation of Hunan Province, China, grant number 19ZDB009/21YBQ073.

Data Availability Statement

In this paper the data related to the green innovation of listed companies in this paper come from the State Intellectual Property Office of the People’s Republic of China (SIPO), and we manually collect the corresponding data. Data for the remaining variables come from the CSMAR database.

Conflicts of Interest

The authors declare no conflict of interest.

References

  1. Xie, X.; Huo, D.; Wang, H. A Research on the Relationship between Green Process Innovation and Financial Performance of the Manufacturing Industry. Sci. Res. Manag. 2019, 40, 63–73. [Google Scholar]
  2. Li, W.; Zhang, Y.; Zheng, M.; Li, X.; Cui, G.; Li, H. Research on Green Governance of Chinese Listed Companies and Its Evaluation. Manag. World 2019, 35, 126–133+160. [Google Scholar]
  3. Li, Q.; Xiao, Z. Hetergeneous Environmental Regulation Tools and Green Innovation Incentives: Evidence from Green Patents of Listed Companies. Econ. Res. J. 2020, 55, 199–208. [Google Scholar]
  4. Huang, M.; Li, M.Y.; Liao, Z.H. Do Political Connected CEOs Promote Chinese Listed Industrial Firms’ Green Innovation? The Mediating Role of External Governance Environments. J. Clean. Prod. 2021, 278, 123634. [Google Scholar] [CrossRef]
  5. Huang, J.W.; Li, Y.H. Green innovation and Performance: The View of Organization Capability and Social Reciprocity. J. Bus. Ethics 2017, 145, 309–324. [Google Scholar] [CrossRef]
  6. Hu, J.; Huang, N.; Shen, H. Can Market-Incentive Environmental Regulation Promote Corporate Innovation? A Nature Experiment Based on China’s Carbon Emissions Trading Mechanism. J. Financ. Res. 2020, 1, 171–189. [Google Scholar]
  7. Xu, J.; Cui, J. Low-Carbon Cities and Firms’ Green Technological Innovation. China Ind. Econ. 2020, 12, 178–196. [Google Scholar]
  8. Cheng, B.; Xiong, T.; Yin, J. The Stones of those Hills, Serve to Polish Gems: Spillover Effect of Green Tax System on Firm’s Innovation. Can. J. Adm. Sci. 2021, 6, 176–188. [Google Scholar]
  9. Tao, F.; Zhao, J.; Zhou, H. Does Environmental Regulation Improve the Quality of Green Innovation—Evidence from the Target Responsibility System of Environmental Protection. China Ind. Econ. 2021, 38, 136–154. [Google Scholar]
  10. Chan, H.K.; Yee, R.W.Y.; Dai, J.; Lim, K.M. The Moderating Effect of Environmental Dynamism on Green Product Innovation and Performance. Int. J. Prod. Econ. 2016, 181, 384–391. [Google Scholar] [CrossRef]
  11. Delgado-Ceballos, J.; Aragór-Correa, J.A.; Mandojana, N. The Effect of Internal Barriers on the Connection Between Stakeholder Integration and Proactive Environmental Strategies. J. Bus. Ethics 2012, 107, 181–293. [Google Scholar] [CrossRef]
  12. He, S.; Huang, X.; Chen, Q. Does Manager’s Environmental Cognition Improve Firms Performance? The Mediating Role of Proactive Environmental Strategy and the Moderating Role of Business Environmental Uncertainty. Nankai Bus. Rev. 2016, 19, 49–57. [Google Scholar]
  13. Lin, Y.H.; Chen, Y.S. Determinants of Green Competitive Advantage: The Roles of Green Knowledge Sharing, Green Dynamic Capabilities and Green Service Innovation. Qual. Quant. 2017, 51, 1663–1685. [Google Scholar] [CrossRef]
  14. Dangelco, R.M.; Pontrandolfo, P. Being Green and Competitive: The Impact of Environmental Actions and Collaborations on Firm Performance. Bus. Strateg. Environ. 2015, 24, 413–430. [Google Scholar] [CrossRef]
  15. Hojnik, J.; Ruzzier, M. The Driving Forces of Process Eco-innovation and Its Impact on Performance: Insights from Slovenia. J. Clean. Prod. 2016, 133, 6812–6825. [Google Scholar] [CrossRef]
  16. Xie, X.; Zhu, Q. How Can Green Innovation Solve the Dilemmas of “Harmonious Coexistence”? J. Manag. World 2021, 37, 128–149. [Google Scholar]
  17. Zhang, G.; Chen, X.; Xiao, H. Process and Outcome Dimensions of Environmental Governance and Corporate Financial Performance. BMJ 2020, 42, 120–139. [Google Scholar]
  18. Chen, Y.S. The Driver of Green Innovation and Green Image—Green Core Competence. J. Bus. Ethics 2008, 81, 531–543. [Google Scholar] [CrossRef]
  19. Xu, Q.; Xu, L.; Xie, Z.; Jin, M. Does Business Group Matter for the Relationship between Green Innovation and Financial Performance? Evidence from Chinese Listed Companies. Sustainability 2021, 13, 13204. [Google Scholar] [CrossRef]
  20. Xing, X.; Liu, T.; Shen, L.; Wang, J. Linking Environmental Regulation and Financial Performance: The Mediating Role of Green Dynamic Capability and Sustainable Innovation. Sustainability 2020, 12, 1007. [Google Scholar] [CrossRef]
  21. Hizarci-Payne, A.K.; İpek, I.; Gümüş, G.K. How environmental innovation influences firm performance: A meta-analytic review. Bus. Strategy Environ. 2021, 30, 1174–1190. [Google Scholar] [CrossRef]
  22. Al-Hakimi, M.A.; Al-Swidi, A.K.; Gelaidan, H.M.; Mohammed, A. The influence of green manufacturing practices on the corporate sustainable performance of SMEs under the effect of green organizational culture: A moderated mediation analysis. J. Clean. Prod. 2022, 376, 134346. [Google Scholar] [CrossRef]
  23. Xie, X.; Huo, J.; Qi, G.; Zhu, K.X. Green Process Innovation and Performance in Emerging Economies: Moderating Effects of Absorptive Capacity and Green Subsidies. IEEE Trans. Eng. Manag. 2016, 63, 101–112. [Google Scholar] [CrossRef]
  24. Küçükoğlu, M.T.; Pınar, R.I. Positive Influence of Green Innovation on Company Performance. Procedia Soc. Behav. Sci. 2015, 195, 1232–1237. [Google Scholar] [CrossRef] [Green Version]
  25. Frempong, M.F.; Mu, Y.; Adu-Yeboah, S.S.; Hossin, M.A.; Adu-Gyamfi, M. Corporate Sustainability and Firm Performance: The Role of Green Innovation Capabilities and Sustainability-Oriented Supplier–Buyer Relationship. Sustainability 2021, 13, 10414. [Google Scholar] [CrossRef]
  26. Wijethilake, C.; Munir, R.; Appuhami, R. Environmental Innovation Strategy and Organizational Performance: Enabling and Controlling Uses of Management Control Systems. J. Bus. Ethics 2018, 151, 1139–1160. [Google Scholar] [CrossRef]
  27. Hammar, H.; Löfgren, Å. Explaining Adoption of End of Pipe Solutions and Clean Technologies—Determinants of Firm’s Investments for Reducing Emissions to Air in Four Sectors in Sweden. Energy Policy 2010, 38, 3644–3651. [Google Scholar] [CrossRef]
  28. Chien, C.C.; Peng, C.W. Does Going Green Pay Off in the Long Run? J. Bus. Res. 2012, 65, 1636–1642. [Google Scholar] [CrossRef]
  29. Zhang, Q.; Ma, Y. The impact of environmental management on firm economic performance: The mediating effect of green innovation and the moderating effect of environmental leadership. J. Clean. Prod. 2021, 292, 126057. [Google Scholar] [CrossRef]
  30. Aftab, J.; Abid, N.; Sarwar, M.; Veneziani, M. Environmental ethics, green innovation, and sustainable performance: Exploring the role of environmental leadership and environmental strategy. J. Clean. Prod. 2022, 178, 134639. [Google Scholar] [CrossRef]
  31. Tang, M.; Walsh, G.; Lerner, G.; Fitza, M.A.; Li, Q. Green Innovation, Managerial Concern and Firm Performance: An Empirical Study. Bus. Strategy Environ. 2018, 27, 39–51. [Google Scholar] [CrossRef]
  32. Zhao, X.; Ding, X.; Li, L. Research on Environmental Regulation, Technological Innovation and Green Transformation of Manufacturing Industry in the Yangtze River Economic Belt. Sustainability 2021, 13, 10005. [Google Scholar] [CrossRef]
  33. Li, J.; Yan, D. Exploration on the Mechanism of the Impact of Green Supply Chain Management on Enterprise Sustainable Development Performance. Sustainability 2021, 13, 9906. [Google Scholar] [CrossRef]
  34. Li, F.; Xu, X.; Li, Z.; Du, P.; Ye, J. Can low-carbon technological innovation truly improve enterprise performance? The case of Chinese manufacturing companies. J. Clean. Prod. 2021, 293, 125949. [Google Scholar] [CrossRef]
  35. Environmental regulations, innovation and firm performance: A revisit of the Porter hypothesis. J. Clean. Prod. 2017, 155, 79–92. [CrossRef] [Green Version]
  36. Hermundsdottir, F.; Aspelund, A. Sustainability innovations and firm competitiveness: A review. J. Clean. Prod. 2021, 280, 124175. [Google Scholar] [CrossRef]
  37. Zhao, X.; Zhao, Y.; Zeng, S.; Zhang, S. Corporate Behavior and Competitiveness: Impact of Environmental Regulation on Chinese Firms. J. Clean. Prod. 2015, 86, 311–322. [Google Scholar] [CrossRef]
  38. Ma, Y.; Hou, G.; Yin, Q.; Xin, B.; Pan, Y. The Sources of Green Management Innovation: Does Internal Efficiency Demand Pull or External Knowledge Supply Push? J. Clean. Prod. 2018, 202, 582–590. [Google Scholar] [CrossRef]
  39. Rezende, L.A.; Bansi, A.C.; Alves, M.F.R.; Galina, S.V.R. Take your time: Examining when green innovation affects financial performance in multinationals. J. Clean. Prod. 2019, 233, 993–1003. [Google Scholar] [CrossRef]
  40. Chen, Y.S.; Lai, S.B.; Wen, C.T. The Influence of Green Innovation Performance on Corporate Advantage in Taiwan. J. Bus. Ethics 2006, 67, 331–339. [Google Scholar] [CrossRef]
  41. Environmental Compliance and Economic and Environmental Performance: Evidence from Handicrafts Small Businesses in Mexico. J. Bus. Ethics 2015, 126, 381–393. [CrossRef]
  42. Li, B.; Han, X.; Li, N. Does IPR Strength Affect the OFDI Reverse Innovation Spillover in China? Case Stud. Sport Manag. 2019, 34, 46–60. [Google Scholar]
  43. Wu, C.; Tang, D. Intellectual Property Rights Enforcement, Corporate Innovation and Operating Performance: Evidence from China’s Listed Companies. Econ. Res. J. 2016, 51, 125–139. [Google Scholar]
  44. Lee, J.M.; Joo, S.H.; Kim, Y. The complementary effect of intellectual property protection mechanisms on product innovation performance. R D Manag. 2018, 48, 320–330. [Google Scholar] [CrossRef]
  45. Roh, J.; Lee, K.; Yang, J.Y. How do intellectual property rights and government support drive a firm’s green innovation? The mediating role of open innovation. J. Clean. Prod. 2021, 317, 128422. [Google Scholar] [CrossRef]
  46. Ang, J.S.; Cheng, Y.; Wu, C. Does Enforcement of Intellectual Property Rights Matter in China? Evidence from Financing and Investment Choices in the High-Tech Industry. Rev. Econ. Stat. 2014, 96, 332–348. [Google Scholar] [CrossRef]
  47. Wu, W.; Zhang, T. The Asymmetric Influence of Non-R&D Subsidies and R&D Subsidies on Innovation Output of New Ventures. J. Manag. World. 2021, 37, 137–160. [Google Scholar]
  48. Tian, P.; Liu, B. Impact of financing constraints on firm’s environmental performance: Evidence from China with survey data. J. Clean. Prod. 2019, 217, 432–439. [Google Scholar] [CrossRef]
  49. Zhu, Y.; Zhang, M. Enterprise Management Team Human Capital, R & D Investment and Enterprise Performance. Can. J. Adm. Sci. 2013, 11, 45–52+96. [Google Scholar]
  50. Braun, E.; Wield, D. Regulation as a Means for the Social Control of Technology. Technol. Anal. Strateg. 1994, 6, 259–272. [Google Scholar] [CrossRef]
  51. García-Granero, E.M.; Galdeano-Gómez, E. Eco-innovation Measurement: A Review of Firm Performance Indicators. J. Clean. Prod. 2018, 191, 304–317. [Google Scholar] [CrossRef]
  52. Dechezleprêtre, A.; Glachant, M.; Haščič, I.; Johnstone, N.; Ménière, Y. Invention and Transfer of Climate Change-Mitigation Technologies: A Global Analysis. Rev. Env. Econ. Policy 2010, 5, 109–130. [Google Scholar] [CrossRef] [Green Version]
  53. Qi, S.; Lin, S.; Cui, J. Do Environmental Rights Trading Schemes Induce Green Innovation? Evidence from Listed Firms in China. Econ. Res. J. 2018, 53, 129–143. [Google Scholar]
  54. Liu, S.; Liu, Y. The effect of financing constraints on firm growth—Based on the leading science and technology enterprises. J. Inf. Technol. Educ. 2015, 34, 13–19. [Google Scholar]
  55. Tian, H.; Hao, W. FDI, Environmental Regulation and Green Innovation Efficiency. Case. Stud. Sport Manag. 2020, 8, 174–183. [Google Scholar]
  56. Huang, C.; Li, S. Shareholders Link Network, Information Advantage and Firm Performance. Nankai Bus. Rev. 2019, 22, 75–88+127. [Google Scholar]
  57. Zhang, X.; Xu, J.; Xu, L. Can Elite Governance of Senior Executives Improve Performance? Econ. Res. J. 2015, 50, 100–114. [Google Scholar]
  58. Gu, L.; Ouyang, W. Corporate Philanthropy, Marketing Capability and Firm Performance. Nankai Bus. Rev. 2017, 20, 94–107. [Google Scholar]
  59. Liu, X.; Liu, Y. Leverage, Short-term Debt for Long-term Use and Firm Performance. Econ. Res. J. 2019, 54, 127–141. [Google Scholar]
  60. Qu, L.; Ren, G. The Effect of Executive Political Relations to the Performance of State-Owned Enterprises: And a Simultaneous Discussion on the De-Administration Reform of State-Owned Enterprises. BMJ 2012, 34, 50–59. [Google Scholar]
  61. Chen, X.; Huang, J. Split Share Structure Reform, Ownership Pyramid and Firm Performance. Can. J. Adm. Sci. 2016, 37, 56–62+96. [Google Scholar]
  62. Wu, J.; Wang, J.; Liu, J.; Wang, H. Marketization Reform of Loan Interest Rate and Firm Total Factor Productivity—Evidence from Cancellation of Upper and Lower Limits for Loan Interest Rate. Can. J. Adm. Sci. 2021, 42, 145–156. [Google Scholar]
  63. Liu, H.; Cao, T. The Economic Impacts of Rollover Restrictions on Enterprise. Econ. Res. J. 2018, 53, 108–121. [Google Scholar]
  64. Kaustia, M.; Rantala, V. “Social Learning and Corporate Peer Effects”. J. Financ. Econ. 2015, 117, 653–669. [Google Scholar] [CrossRef]
  65. Li, W.; Zheng, M. Is it substantive innovation or strategic innovation?—Impact of macroeconomic policies on micro-enterprise’ innovation. Econ. Res. J. 2016, 51, 60–73. [Google Scholar]
  66. Tang, Y.; Ma, W.; Xia, L. Quality of Environmental Information Disclosure, Internal Control “Level” and Enterprise Value—Empirical Evidence from Listed Companies in Heavy Polluting Industries. Can. J. Adm. Sci. 2021, 7, 69–84. [Google Scholar]
  67. Liu, Z.; Li, X.; Peng, X.; Lee, S. Green or nongreen innovation? Different strategic preferences among subsidized enterprises with different ownership types. J. Clean. Prod. 2020, 245, 118786. [Google Scholar] [CrossRef]
  68. Chen, Y.; Mao, S.; Wang, B. Dividend Stability, Equity Balance and Enterprise Value of Manufacturing Industry. Financ. Account. Manag. 2019, 13, 46–52. [Google Scholar]
  69. Chen, Z.; Xu, P.; Bai, G. The Relationship between Equity Balance and Performance in Listed Companies from a Perspective of Dynamic Competition. Front. Eng. Manag. 2014, 36, 3–11. [Google Scholar]
  70. Chen, D.; Chen, Y. Ownership Structure and Corporate Performance: Positive Study on Small and Medium Board Market in 2007~2009. Can. J. Adm. Sci. 2011, 32, 38–43. [Google Scholar]
Figure 1. Theoretical model.
Sustainability 15 00089 g001
Figure 2. Parallel trend test.
Sustainability 15 00089 g002
Table 1. Variable definitions.
Variable TypeVariable SymbolVariable Definition
Explained variableTobinQThe market value of the firm/the replacement cost of the firm’s assets
Explanatory variablelnGThe natural log of the number of green patent applications added by 1
Moderating variablesIPPRegional technology market turnover/regional GDP
IPMInterest protection multiple
Control variablesSizeThe natural log of total assets
LevTotal liabilities/total assets
AgeThe natural log of firm age
Growth(Current period operating income—previous period operating income)/previous period operating income
OcfCash flow from operating activities/total assets
Top1The number one shareholder holding ratio
YearYear dummy variable
IndustryIndustry dummy variable
ProvinceProvince dummy variable
Table 2. Descriptive Statistics.
VariablesObservationMeanP10MedianP90Std. Dev
1. TobinQ12,4901.7800.8871.3833.1141.207
2. lnG12,4900.2610.0000.0001.0990.628
3. Size12,49022.12820.62121.93423.9421.288
4. Lev12,4900.4410.1700.4440.6990.198
5. Age12,4902.6461.9462.7733.1780.497
6. Growth12,4900.182−0.1470.1230.5160.369
7. Ocf12,4900.060−0.0180.0580.1450.067
8. Top112,49037.06517.69035.17560.00015.867
Table 3. Correlation Matrix.
TobinQlnGSizeLevAgeGrowthOcfTop1
1. TobinQ1
2. lnG−0.084 ***1
2. Size−0.299 ***0.388 ***1
3. Lev−0.246 ***0.103 ***0.364 ***1
4. Age0.135 ***0.143 ***0.286 ***0.033 ***1
5. Growth0.024 ***−0.019 **0.029 ***−0.080 ***0.0051
6. Ocf0.061 ***0.073 ***0.121 ***−0.008−0.167 ***0.070 ***1
7. Top1−0.199 ***0.055 ***0.200 ***−0.315 ***0.075 ***0.047 ***0.121 ***1
** and *** indicate that the regression coefficient is significant at the levels of 5% and 1%.
Table 4. Direct effect test.
Variables(1)
Lag Phase i
(2)
Lag Phase ii
(3)
Lag Phase iii
TobinQTobinQTobinQ
L.lnG0.060 ***
(2.71)
L2.lnG 0.044 *
(1.88)
L3.lnG 0.060 **
(2.53)
Size−0.353 ***−0.377 ***−0.369 ***
(−12.53)(−12.92)(−12.34)
Lev−0.438 ***−0.593 ***−0.666 ***
(−2.76)(−3.57)(−3.88)
Age0.283 ***0.237 ***0.213 ***
(4.41)(3.16)(2.60)
Growth0.153 ***0.187 ***0.189 ***
(4.46)(5.03)(4.92)
Ocf2.277 ***2.277 ***2.119 ***
(8.32)(8.10)(7.28)
Top1−0.003 **−0.002−0.003
(−2.14)(−0.94)(−1.41)
Constant8.603 ***8.883 ***8.674 ***
(13.76)(13.45)(12.89)
Observations11147101039141
R-squared0.3580.3820.387
Year FEYesYesYes
Industry FEYesYesYes
Province FEYesYesYes
*, ** and *** indicate that the regression coefficient is significant at the levels of 10%, 5% and 1%, respectively, and the t value clustered to the enterprise level is shown in brackets.
Table 5. The moderating effect of the degree of regional intellectual property protection/financing constraints.
Variables(1)
All
(2)
High IPP
(3)
Low IPP
(4)
High IPM
(5)
Low IPM
TobinQTobinQTobinQTobinQTobinQ
L.lnG0.060 ***0.077 **0.0140.091 ***0.032
(2.71)(2.54)(0.44)(3.12)(1.64)
Size−0.353 ***−0.367 ***−0.340 ***−0.313 ***−0.382 ***
(-12.53)(−8.97)(−10.83)(−10.90)(−12.99)
Lev−0.438 ***−0.217−0.559 ***−0.1570.295 *
(−2.76)(−0.91)(−3.26)(−0.78)(1.72)
Age0.283 ***0.306 ***0.315 ***0.1170.261 ***
(4.41)(3.31)(4.04)(1.35)(4.27)
Growth0.153 ***0.157 ***0.073 *0.126 ***0.069 *
(4.46)(2.92)(1.90)(2.60)(1.77)
Ocf2.277 ***2.470 ***2.125 ***2.724 ***−0.208
(8.32)(5.80)(6.44)(7.45)(−0.97)
Top1−0.003 **−0.005 **−0.001−0.002−0.002 *
(−2.14)(−2.25)(−0.57)(−1.29)(−1.68)
Constant8.603 ***9.060 ***8.294 ***7.163 ***9.511 ***
(13.76)(11.99)(11.05)(11.73)(16.06)
Coefficient difference 0.06 *0.06 *
Observations111475133505945554859
R-squared0.3580.3620.4160.3380.434
Year FEYesYesYesYesYes
Industry FEYesYesYesYesYes
Province FEYesYesYesYesYes
*, ** and *** indicate that the regression coefficient is significant at the levels of 10%, 5% and 1%, respectively, and the t value clustered to the enterprise level is shown in brackets.
Table 6. Robustness test—DID test.
VariableTobinQ
Treat×After0.314 ***
(4.76)
Treat−0.009
(−0.11)
After−0.863 ***
(−11.98)
Size−0.431 ***
(−11.02)
Lev−0.166
(−0.70)
Age0.398 ***
(3.38)
Growth0.194 ***
(3.19)
Ocf2.115 ***
(5.23)
Top1−0.003
(−1.24)
Constant10.895 ***
(13.02)
Observations4848
R-squared0.352
Year FEYes
Industry FEYes
Province FEYes
*** indicate that the regression coefficient is significant at the levels of 1%, respectively, and the t value clustered to the enterprise level is shown in brackets.
Table 7. Robustness test—PSM test.
Variables(1)
PSM
(2)
All
TobinQTobinQ
L.lnG0.041 *0.060 ***
(1.89)(2.71)
Size−0.257 ***−0.353 ***
(−9.69)(−12.53)
Lev−0.705 ***−0.438 ***
(−4.37)(−2.76)
Age0.210 ***0.283 ***
(2.83)(4.41)
Growth0.175 ***0.153 ***
(3.70)(4.46)
Ocf2.209 ***2.277 ***
(7.28)(8.32)
Top1−0.003 *−0.003 **
(−1.84)(−2.14)
Constant6.636 ***8.603 ***
(10.61)(13.76)
Observations674711147
R-squared0.3400.358
Year FEYesYes
Industry FEYesYes
Province FEYesYes
*, ** and *** indicate that the regression coefficient is significant at the levels of 10%, 5% and 1%, respectively, and the t value clustered to the enterprise level is shown in brackets.
Table 8. Robustness test—Heckman.
Variables(1)
Phase One
(2)
Phase Two
Green_DummyTobinQ
IV_industry0.723 ***
(5.38)
SR0.281 ***
(4.95)
RI0.025 **
(2.55)
lnG 0.121 ***
(3.39)
Size0.001−0.351 ***
(0.02)(−9.71)
Lev0.145−0.271
(0.84)(−1.39)
Age−0.0910.367 ***
(−1.07)(4.17)
Growth−0.0452.742 ***
(−0.94)(7.26)
Ocf0.769 **0.222 ***
(2.18)(4.45)
Top1−0.003−0.005 **
(−1.59)(−2.38)
imr −0.076 **
(−2.27)
Constant−6.862 ***8.455 ***
(−10.69)(9.72)
Observations71887188
R-squared0.1040.304
Year FENoYes
Industry FENoYes
Province FENoYes
** and *** indicate that the regression coefficient is significant at the levels of 5% and 1%, respectively, and the t value clustered to the enterprise level is shown in brackets.
Table 9. Robustness test—Substitution of explanatory variables.
Variables(1)(2)(3)
TobinQTobinQTobinQ
L.lnGrant0.064 ***
(2.77)
L.lnPatent 0.042 **
(2.56)
L.Green 0.072 *
(1.94)
Size−0.351 ***−0.365 ***−0.349 ***
(−12.28)(-13.16)(−12.50)
Lev−0.439 ***−0.424 ***−0.441 ***
(−2.76)(−2.67)(−2.77)
Age0.283 ***0.289 ***0.282 ***
(4.41)(4.53)(4.39)
Growth0.152 ***0.153 ***0.151 ***
(4.45)(4.48)(4.41)
Ocf2.280 ***2.286 ***2.278 ***
(8.33)(8.35)(8.33)
Top1−0.003 **−0.003 **−0.003 **
(−2.14)(−2.13)(−2.16)
Constant8.577 ***8.780 ***8.527 ***
(13.54)(14.07)(13.76)
Observations11,14711,14711,147
R-squared0.3580.3590.358
Year FEYesYesYes
Industry FEYesYesYes
Province FEYesYesYes
*, ** and *** indicate that the regression coefficient is significant at the levels of 10%, 5% and 1%, respectively, and the t value clustered to the enterprise level is shown in brackets.
Table 10. The heterogeneity of green patent types.
Variables(1)(2)(3)
TobinQTobinQTobinQ
L.lnG0.060 ***
(2.71)
L.lnGI 0.083 ***
(2.66)
L.lnGU 0.039
(1.46)
Size−0.353 ***−0.353 ***−0.347 ***
(−12.53)(−12.66)(−11.93)
Lev−0.438 ***−0.435 ***−0.439 ***
(−2.76)(−2.75)(-2.76)
Age0.283 ***0.281 ***0.282 ***
(4.41)(4.39)(4.38)
Growth0.152 ***0.152 ***0.150 ***
(4.46)(4.46)(4.40)
Ocf2.276 ***2.279 ***2.286 ***
(8.32)(8.33)(8.34)
Top1−0.003 **−0.003 **−0.003 **
(−2.14)(−2.14)(−2.17)
Constant8.603 ***8.603 ***8.482 ***
(13.76)(13.87)(13.20)
Observations11,14711,14711,147
R-squared0.3580.3580.357
Year FEYesYesYes
Industry FEYesYesYes
Province FEYesYesYes
** and *** indicate that the regression coefficient is significant at the levels of 5% and 1%, respectively, and the t value clustered to the enterprise level is shown in brackets.
Table 11. The heterogeneity of enterprise ownership types.
Variables(1)
State
(2)
NonState
(3)
State
(4)
NonState
(5)
State
(6)
NonState
TobinQTobinQTobinQTobinQTobinQTobinQ
L.lnG0.0070.125 **
(0.34)(2.39)
L.lnGI 0.0050.214 ***
(0.16)(2.65)
L.lnGU 0.0210.022
(0.89)(0.40)
Size−0.311 ***−0.418 ***−0.310 ***−0.420 ***−0.312 ***−0.406 ***
(−10.86)(-8.04)(−10.80)(−8.23)(−10.98)(−7.42)
Lev−0.640 ***−0.104−0.639 ***−0.100−0.640 ***−0.109
(−3.72)(−0.39)(-3.70)(−0.38)(−3.72)(−0.41)
Age0.1310.400 ***0.1300.395 ***0.1320.398 ***
(1.34)(4.01)(1.33)(4.00)(1.34)(3.99)
Growth0.146 ***0.166 ***0.146 ***0.164 ***0.147 ***0.165 ***
(3.49)(3.17)(3.49)(3.15)(3.49)(3.14)
Ocf1.616 ***3.088 ***1.618 ***3.087 ***1.613 ***3.098 ***
(5.60)(7.10)(5.62)(7.11)(5.59)(7.10)
Top1−0.001−0.005 *−0.001−0.004 *−0.001−0.005 *
(−0.61)(−1.73)(−0.62)(−1.71)(−0.61)(−1.75)
Constant8.042 ***9.417 ***8.030 ***9.462 ***8.065 ***9.157 ***
(11.90)(8.96)(11.86)(9.17)(12.00)(8.21)
Coefficient difference−0.118 ***−0.209 ***−0.001
Observations523650625236506252365062
R-squared0.4400.3350.4400.3360.4400.333
Year FEYesYesYesYesYesYes
Industry FEYesYesYesYesYesYes
Province FEYesYesYesYesYesYes
*, ** and *** indicate that the regression coefficient is significant at the levels of 10%, 5% and 1%, respectively, and the t value clustered to the enterprise level is shown in brackets.
Table 12. The heterogeneity of Equity ratios.
Variables(1)
All
(2)
Low Equity Balance
(3)
High Equity Balance
TobinQTobinQTobinQ
L.lnG0.060 ***0.0020.124 ***
(2.71)(0.09)(3.37)
Size−0.353 ***−0.361 ***−0.336 ***
(−12.53)(−9.95)(−8.66)
Lev−0.438 ***−0.140−0.655 ***
(−2.76)(−0.77)(−2.77)
Age0.283 ***0.134 *0.435 ***
(4.41)(1.75)(4.55)
Growth0.153 ***0.162 ***0.143 ***
(4.46)(3.16)(2.99)
Ocf2.277 ***2.251 ***2.337 ***
(8.32)(6.94)(6.12)
Top1−0.003 **−0.002−0.009 ***
(−2.14)(−1.04)(−2.86)
Constant8.603 ***9.181 ***7.937 ***
(13.76)(13.31)(9.77)
Coefficient difference 0.122 ***
Observations11,14756585489
R-squared0.3580.4010.354
Year FEYesYesYes
Industry FEYesYesYes
Province FEYesYesYes
*, ** and *** indicate that the regression coefficient is significant at the levels of 10%, 5% and 1%, respectively, and the t value clustered to the enterprise level is shown in brackets.
Disclaimer/Publisher’s Note: The statements, opinions and data contained in all publications are solely those of the individual author(s) and contributor(s) and not of MDPI and/or the editor(s). MDPI and/or the editor(s) disclaim responsibility for any injury to people or property resulting from any ideas, methods, instructions or products referred to in the content.

