1. Introduction
The productivity improvement brought about by technological development, and the rapid iterative market demand spawned by economic prosperity, have made the life cycle of products shorter and shorter [
1]. While meeting the huge demands of the market, modern industries have also produced a series of environmental problems, including resource wasting, climate warming, increasing sea levels, which have captured the attention of both the general public and the government. The 21st century brought the advancement of technology, including electronic and electrical equipment such as cell phones, laptops, and smart hardware, which have all become increasingly popular. While satisfying the diverse needs of consumers, they also posed several threats to humanity. These threats are related to discarded or terminated electrical and electronic equipment, which is also known as waste electrical and electronic equipment (WEEE) [
2]. WEEE contains toxic chemicals which are extremely harmful to the soil and the atmosphere. In addition, WEEE is growing at a rate of 5% per year [
3]. If this continues, it will become one of the greatest threats to human survival [
4].
To improve this situation, both academics and industries have began to study closed-loop supply chains (CLSCs). A CLSC involves adding a reverse supply chain to the traditional forward supply chain [
5]. The reverse supply chain includes the recycling and remanufacturing of waste products to restore them into a new state in terms of appearance and function, which can effectively reduce the environmental pollution caused by WEEE. Dowlatshahi [
6] proposed the theory of reverse logistics, on the basis of which the concept of CLSCs was finally refined. Considering environmental problems, discounts, and uncertainty, Ghahremani Nahr et al. [
7] designed a stable CLSC network. Pietro et al. [
8] optimized the return process in CLSCs to maximize the profits of the remanufacturer. Yang et al. [
9] established a general CLSC network model, including raw material suppliers, manufacturers, retailers, consumers, and recycling centers, which improves net income by optimizing the network balance. Xiao et al. [
10,
11] designed CLSCs in different conditions, and they optimally solved the model to maximize the profit of the supply chain dominant. More and more companies are aware of the economic effects of CLSCs, and most of them have introduced or started to introduce CLSCs. By recycling used printers, Xerox has saved approximately 40% to 65% on manufacturing costs. HP and Kodak have adopted the same approach; they focused on recycling parts of their products, which helps to save costs [
12]. Caterpillar takes a full life-cycle approach to deliver consumer value by designing and manufacturing products with multiple life cycles that can be remanufactured at the end of their useful life. Companies such as Apple, Lenovo, and Huawei use recycled components instead of new raw materials in their production, mainly because it can save 30–50% in costs [
13]. It is not only academics and industries that have undertaken research on CLSCs; governments have introduced various policies to encourage the development of CLSCs. The Chinese government issued Regulations on the Management of the Recycling and Disposal of Waste Electrical and Electronic Products in 2008, which regulates the recycling and treatment of WEEE and supports formal dismantling enterprises [
14]. In China Made 2025 and other major policies, the Chinese government has clearly stated that developing the remanufacturing industry, recycling, and remanufacturing will become important factors in Chinese manufacturing development. The EU has also legislated to establish a mechanism for the recycling of auto parts [
15]. E-waste recycling laws in the US require manufacturers to recycle end-of-life products used by customers for further use.
The economic benefits of CLSCs are one reason for their popularity. As consumers become more environmentally conscious, some companies have noticed that remanufacturing is an integral part of their business. They attract and retain more customers by fostering corporate social responsibility (CSR). By participating in CSR activities, companies can not only generate good stakeholder attitudes and better supportive behaviors, but also build a good corporate image in the long term [
16]. Li et al. [
17] studied the role of corporate social responsibility within companies, and they found that believing in corporate social responsibility has a positive impact on employee happiness. It can be seen that CSR can jointly influence the development of enterprises from inside and outside businesses.
Governments have introduced various policies in the hope that companies can maximize recycling of WEEE through CLSC management; however, companies largely seek to maximize economic benefits through manufacturing cost savings and government rewards. Generally speaking, the recycling of WEEE includes three models: manufacturer recycling, retailer recycling, and third-party recycler recycling. The selection of recycling mode has an important impact on the decision making of CLSCs and affects decision variables such as product pricing and recycling rate. Therefore, in order to achieve their optimal goals, the government and related enterprises may have contradicting selected recycling channels. To resolve this contradiction, this paper will explore the following questions:
- (1)
How do manufacturers that consider CSR in CLSCs make optimal decisions under the government’s RPP? How will they choose the recycling channel for WEEE?
- (2)
Under the government’s RPP, will the social responsibility investment of the enterprises effectively promote profit growth?
- (3)
How can governments guide enterprises to maximize the recycling rate while considering CSR and pursuing economic benefits?
This study mainly deepens the following research. (1) The existing research is mainly focused on CSR decision making of single enterprise. In this study, a channel selection and decision-making model of CLSCs considering CSR is established, and CSR is integrated into the study of CLSC value co-creation. It reveals the behavior of CLSC enterprises considering CSR and expands the research boundary of CSR and CLSCs. (2) Previous studies mainly focused on the impact of CSR on corporate economic value. This study analyzes the relationship between the economic value of CLSCs and the CSR, and proposes an effective path to achieve the win-win situation of the economic value of CLSCs and CSR.
Due to the serious environmental pollution of WEEE, it takes a lot of financial resources to deal with it. The application of CLSCs solves this problem to a certain extent. In addition to improving the economic benefits of enterprises and reducing the pressure on the governments’ treatment of WEEE, it can also enhance corporate image and attract more consumers to buy through effective publicity. Therefore, while developing CLSCs, some enterprises actively consider improving CSR to achieve the effect of half-effort. The research of this article provides a literature foundation for the integration of CLSCs and CSR.
The structure of this paper is as follows.
Section 2 is a literature review relating to our study.
Section 3 describes the problem and builds the model of this paper.
Section 4 solves the model and compares the results for different scenarios.
Section 4.5 makes the numerical study. In
Section 5, we discuss the results.
Section 6 concludes this paper and shows the directions of future research.
2. Literature Review
This paper considers three aspects: enterprises’ CSR behaviors, the impact of government economic intervention on CLSCs, and. the decision making and recycling channel selection of CLSCs.
Corporate social responsibility (CSR) has been a prominent research topic in recent years. Jones [
18] clarified the concept of CSR and believed that CSR covers morality, environmental protection, and consumer welfare. Following on from this, scholars have undertaken significant research on CSR. With regards to empirical research, scholars have demonstrated that the implementation of CSR can positively regulate brand awareness, and it offers a more competitive advantage than enterprises that only consider profits [
19]. Some scholars define CSR as a company’s response to the interests of its stakeholders. Panda [
20] believed that CSR is the concern of consumer surplus. He found that channel members’ improving CSR level will reduce their own profits but will increase market demand. However, the above studies discussed the CSR behavior of a single enterprise. In reality, CSR is no longer the act of a single core enterprise, and it has an important impact on the supply chain. Modak et al. [
21] regarded corporate donation as a way to undertake CSR and studied the selection and coordination of recycling channels in a two-level CLSC. They regarded CSR as an endogenous variable and focused on the decision making of enterprises’ CSR investment. Ebrahimi and Hosseini-Motlagh [
22] constructed a green supply chain model in which a single manufacturer conducts green manufacturing, and two retailers invest in CSR, respectively. They found that the competition of retailers’ CSR investments will motivate the manufacturer to increase their green R&D investment.
CLSCs play a key role in cost saving and environmental protection, and governments have also started to formulate policies to promote the improvements to the social benefits of CLSCs. Scholars are undertaking increasingly in-depth research on government guidance for CLSC members. From the perspective of government-provided consumption subsidies, Ma et al. [
23] studied the government’s optimal consumption subsidy strategy in CLSCs. The study showed that government consumption subsidies are conducive to improving the total profit of the supply chain, consumer surplus, and social welfare. Based on the perspective that the government encourages consumers to buy remanufactured products and provides consumer subsidies, Zhao and Sun [
24] believed that when the government guides third-party recyclers to recycle waste products, manufacturers focus on remanufacturing, which is conducive to improving the recycling rate of waste products. It can be seen that third-party recyclers have certain advantages in recycling. Li et al. [
1] explored the cooperative decision making of enterprises in CLSCs in the context of government recycling subsidies. They found that when manufacturers, retailers, and third-party recyclers make joint decisions, CLSCs can obtain the most profits, but this easily leads to the emergence of monopolistic behavior, which is not conducive to the development of the industry and the improvement of social welfare. Hong and Yeh [
25] took the retailer-led CLSC as the background, constructed three different recycling models, and studied the impact of government subsidies on the selection of recycling channels and pricing decisions. The results show that government recycling subsidies can increase the overall profits of supply chain members and systems. When the manufacturer is responsible for recycling, the government’s recycling subsidy mechanism is most effective. In addition, some scholars considered the impact of government regulation on CLSC decision making in the context of manufacturer competition in green CLSCs [
26], altruistic preference [
27], and second-hand product collection [
28].
The recycling channels of CLSCs usually have three modes: manufacturer recycling, retailer recycling, and third-party recycler recycling. Scholars have previously studied the selection of recycling channels for CLSC in different scenarios. Atabaki et al. [
29] considered the management cost of recycling products and the cost of remanufacturing and explored the impact of direct and indirect recycling modes on corporate revenue. Chu et al. [
30] established a third-party recycling model of CLSCs under specific circumstances, and the study showed that third-party recycling serving multiple manufacturers is superior to recycling by a single retailer or manufacturer. In the process of exploring the recycling of automobile batteries, Li et al. [
31] compared the recycling channels of manufacturers, retailers, and third-party recyclers, and found that the improvement of recycling technology can improve the recycling enthusiasm of third-party recyclers. He et al. [
32] studied recycling channels in the context of competitive supply chains and analyzed the selection of optimal recycling channels from the perspective of recycling rate and win-win situations. Su et al. [
33] constructed four recycling channel models, and they found that the system benefits the most when the retailer, the third-party recycler, and the manufacturer share the responsibility for recycling. Taleizadeh et al. [
34] analyzed and reviewed the research status of recycling issues in terms of the selection of recycling modes, the comparison and formulation of recycling strategies, etc., and proposed the selection of multi-agent mixed channels in complex environments, and the subsidy under multi-group and different strategies. The determination and selection of methods will be the focus of future research on CLSC recycling. In different research scenarios, the CLSC recycling channels decided by scholars are different.
From the perspective of social responsibility practice, this paper introduces CSR as a decision variable into the objective functions, and the government’s reward–penalty unit is used as a profit item. Combined with the above conditions, we make decisions of CLSCs.
3. Problem Description and Model Building
In order to simplify the calculation, this paper designs a three-level CLSC that includes a manufacturer and a retailer, or a manufacturer, a retailer, and a third-party recycler. According to the different recycling channels, the members of CLSCs are also different. When the manufacturer or the retailer is responsible for recycling, CLSCs only include two member companies. When they are not responsible for recycling, CLSCs need to introduce a third-party recycler for WEEE recycling. This paper makes the optimal decision using the Stackelberg game method. The manufacturer is the leader of the game and is responsible for the manufacture of new products and the remanufacturing of recycled WEEE. The retailer and the third-party recycler are followers in the game, and the retailer is responsible for selling products to customers. In different recycling strategies, the manufacturer, the retailer, and the third-party recycler are responsible for recycling WEEE from customers, respectively. Based on the traditional CLSC, this paper introduces the government’s RPM and CSR. The government’s RPM is a strict mechanism to encourage enterprises to recycle WEEE, which sets a threshold of recovery rate. When the recovery rate is higher than the threshold, the enterprise will be rewarded with cash subsidies, tax deductions, or other incentives. On the contrary, the enterprise will be punished. The descriptions of parameters are shown in
Appendix A.
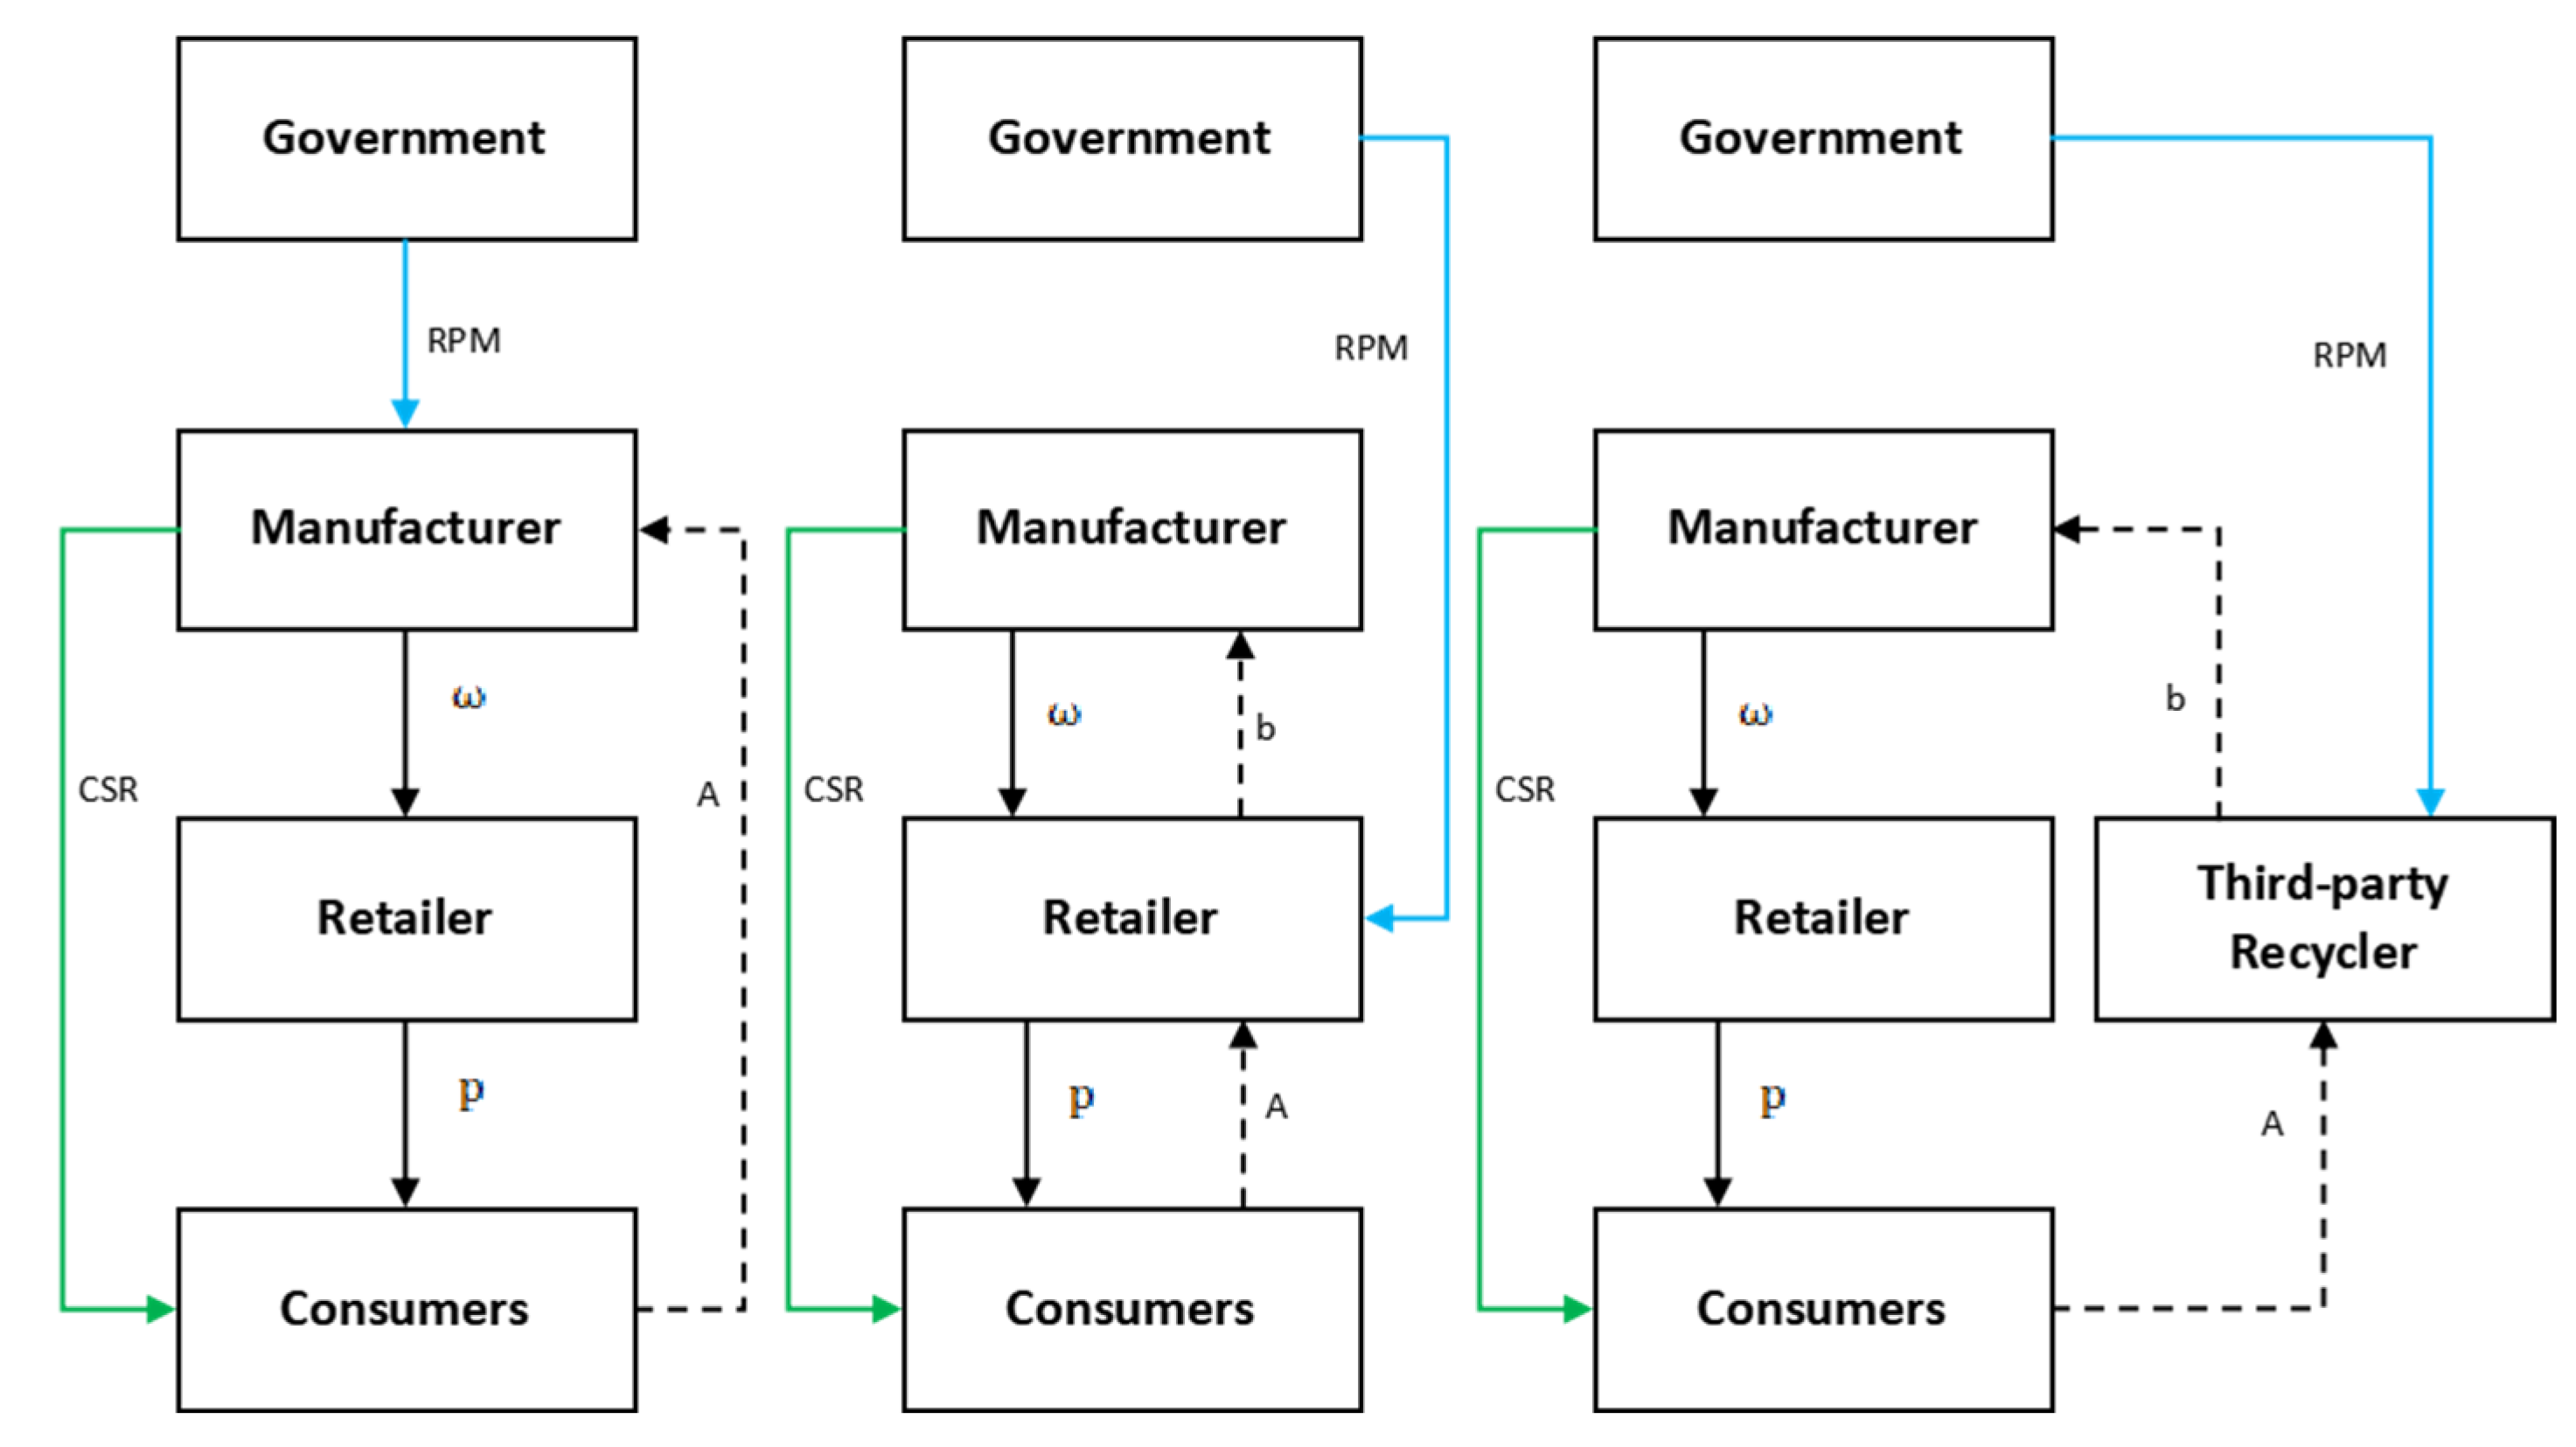
To facilitate identification, in the following formulas M refers to the manufacturer, R refers to the retailer, and T refers to the third-party recycler. According to the different member responsible for recycling, this paper studies three recycling strategies: MR strategy, RR strategy, and TR strategy. In the three recycling strategies, the manufacturer, the retailer, and the third-party recycler are responsible for recycling WEEE, respectively. The model diagrams of the three recycling strategies are shown in
Figure 1.
In order to make the model reasonable, this paper makes the following assumptions.
- (1)
The newly manufactured products and the remanufactured products using recycled WEEE are identical in appearance and function. That is, they are sold at the same price on the market.
- (2)
As the profit generated in the WEEE recycling process is relatively low, let the transfer payment price be equal to the price of recycling WEEE, that is, b = A.
- (3)
The market demand function is .
- (4)
When the manufacturer considers CSR, the product will get the favor and recognition of customers, and the demand will increase accordingly. Since the products involved in this paper are electronic and electrical products, we assume that the target customers are medium-income or high-income individuals. We adjusted the market demand function to , where .
- (5)
In the process of recycling WEEE, the member in charge needs to spend , where represents the ratio of quantity of the recycled WEEE used for remanufacturing to the market demand. The threshold is set by the government, when , the member in charge of recycling WEEE will be rewarded with , otherwise, they will be penalized .
- (6)
To achieve the CSR investment level e, the cost to the manufacturer is .
4. Results
In this section, we discuss the three recycling strategy models introduced in
Section 3. We will make optimal decisions based on the Stackelberg game for each of them, and compare the decision results of each model to provide a basis for the recycling strategy choices of the manufacturer and the government. This section solves the optimal value of each model, and the proof process is summarized in
Appendix B.
4.1. MR Model
In the MR model, the CLSC contains only two members: the manufacturer and the retailer. While manufacturing products and wholesaling them to the retailer, the manufacturer is also responsible for recycling WEEE from consumers. In the game of this model, the manufacturer decides the wholesale price
, the recycling rate
, and the CSR investment level e, then the retailer decides the sale price p. The profit function of the manufacturer is shown as follow:
In the formula, the first item on the right is the profit from wholesaling new manufactured products to the retailer. The second item is the profit from wholesaling remanufactured products to the retailer. The third item is the government’s reward–penalty, if , the item is positive, otherwise, it is negative. The fourth item is the cost of recycling WEEE, including recovery effort and recovery cost. The last item is the cost of CSR investment.
The profit function of the retailer is shown as follows:
The formula only has one item, which is the profit from selling products to consumers.
Theorem 1. In the MR model, when, the equations have a unique optimal solution. The optimal prices, recycling rate, and CSR investment level are written as follows: The optimal profits for the manufacturer and the retailer are as follows:
Corollary 1. In the MR model, as the government’s reward–penalty coefficient m increases, the optimal recycling rate of WEEEincreases, the market demand q increases, and the optimal level of CSR investmentincreases. When, as m increases, the optimal wholesale priceincreases, otherwise,decreases. When, the optimal sale priceincreases with the increase in m, otherwise,decreases.
Corollary 2. In the MR model, the optimal profit of the retailerincreases with the increase in the government’s reward–penalty coefficient m. When, the optimal profit of the manufacturerincreases with the increase in the government’s reward–penalty coefficient m.
Corollary 1 shows that when the government increases the reward–penalty coefficient m, in order to pursue more profits, the manufacturer will also increase the recycling rate of WEEE. As the proportion of remanufacturing increases, the unit production cost decreases accordingly, and the manufacturer will increase investment in CSR. Generally speaking, consumers are more sensitive to CSR than price, so the market demand will increase. When the increase in market demand brought by CSR can resist the increase in investment costs, the manufacturer and the retailer will increase the wholesale price and the sale price to obtain more profits; on the contrary, they will lower the price. Corollary 2 shows that when the government sets the recycling rate threshold within a reasonable range, the manufacturer participating in recycling WEEE can increase its profit as the government increases the reward–penalty coefficient. However, when the recycling rate threshold is set too high, not only will the manufacturer not be rewarded, they will also be severely punished, resulting in lower profit.
4.2. RR Model
In the RR model, the CLSC contains two members: the manufacturer and the retailer. The manufacturer is responsible for manufacturing and remanufacturing products and wholesaling them to the retailer. The retailer is responsible for selling products to consumers and recycling WEEE. In the game of this model, the manufacturer decides the wholesale price
and the CSR investment level e, then the retailer decides the sale price p and the recycling rate
. The profit function of the manufacturer is as follows:
In the formula, the first item on the right is the profit from selling new manufactured products to the retailer, the second item is the profit from selling remanufactured products to the retailer, the third item is the transfer cost for WEEE, and the last item is the cost of CSR investment.
The profit function of the retailer is shown as follows:
In the formula, the first item on the right is the profit from selling products to consumers, the second item is the government’s reward–penalty, and the last item is the cost of effort invested in recycling WEEE.
Theorem 2. In the RR model, the optimal prices, recycling rate, and CSR investment level are written as follows: The optimal profits for the manufacturer and the retailer are as follows:
Corollary 3. In the RR model, as the government’s reward–penalty coefficient m increases, the optimal recycling rate of WEEEincreases, the market demand q increases, and the optimal level of CSR investmentincreases. When, as m increases, the optimal wholesale priceand the optimal sale priceincrease, otherwise, they decrease.
Corollary 4. In the RR model, when, the optimal profit of the retailerincreases with the increase in the government’s reward–penalty coefficient m. The optimal profit of the manufacturerincreases with the increase in the government’s reward–penalty coefficient m.
Corollary 3 shows that in the situation where the retailer is responsible for recycling WEEE, when the government increases the reward–penalty coefficient m, in order to obtain more profit, the retailer will increase the recycling rate of WEEE. As the proportion of remanufacturing in the optimal result increases, the unit production cost decreases accordingly, and the manufacturer will increase their investment in CSR. As consumers are sensitive to CSR, the increase in CSR investment will increase customers’ trust in the company’s brand, and the market demand will increase. When the increase in market demand brought about by CSR can resist the increase in investment costs, the manufacturer and the retailer will increase wholesale price and sale price to gain more profits, otherwise, they will reduce prices. Corollary 4 shows that when the government sets the upper threshold of the recycling rate, the retailer participating in recycling WEEE can obtain more profit as the government increases the reward–penalty coefficient. When the government sets the lower limit of the recovery rate threshold, that is, the government only raises the recovery rate threshold, companies will not be penalized for failing to meet the recovery rate target.
4.3. TR Model
In the TR model, the Stackelberg game has three members: the manufacturer, the retailer, and the third-party recycler. In this model, the manufacturer is responsible for manufacturing and remanufacturing products and wholesaling them to the retailer. The retailer is responsible for selling products to consumers. The third-party recycler is responsible for recycling WEEE. In the game of this model, the manufacturer decides the wholesale price ω and the CSR investment level e, then the retailer decides the sale price p, and the third-party recycler decides the recycling rate τ. The profit function of the manufacturer is as follows:
In the formula, the first item on the right is the profit from selling new manufactured products to the retailer, the second item is the profit from selling remanufactured products to the retailer, the third item is the transfer cost for WEEE, and the last item is the cost of CSR investment.
The profit function of the retailer is shown as follows:
The formula only has one item, which is the profit from selling products to consumers.
The profit function of the third-party recycler is shown as follows:
In the formula, the first item on the right is the government’s reward–penalty, and the second item is the cost of effort invested in recycling WEEE.
Theorem 3. In the TR model, the optimal prices, recycling rate, and CSR investment level are written as follows: The optimal profits for the manufacturer and the retailer are as follows:
Corollary 5. In the TR model, as the government’s reward–penalty coefficient m increases, the optimal recycling rate of WEEEincreases, the market demand q increases, and the optimal level of CSR investmentincreases. When, as m increases, the optimal wholesale priceincreases, otherwise, it decreases. When, as m increases, the optimal sale priceincreases, otherwise, it decreases.
Corollary 6. In the TR model, the optimal profit of the manufacturerincreases with the increase in the government’s reward–penalty coefficient m. The optimal profit of the retailerincreases with the increase in the government’s reward–penalty coefficient m. The optimal profit of the third-party recyclerincreases with the increase in the government’s reward–penalty coefficient m.
Corollary 5 shows that in the situation where the third-party recycler is responsible for recycling WEEE, when the government increases the reward–penalty coefficient m, in order to obtain more profit, the third-party recycler will increase the recycling rate of WEEE. As the proportion of remanufacturing increases, the unit production cost decreases accordingly, and the manufacturer will increase their investment in CSR. As consumers are sensitive to CSR, the increase in CSR investment will increase customers’ trust in the company’s brand, so the market demand will increase. When the increase in market demand brought about by CSR can resist the increase in investment costs, the manufacturer and the retailer will increase wholesale price and sale price to gain more profits, otherwise, they will reduce prices. Corollary 6 shows that when a third-party organization unrelated to product sales is responsible for recycling WEEE, the improvement of the government’s reward–penalty coefficient can promote the profit improvement of each member enterprise of CLSCs.
4.4. Results Comparison
As the leader of the Stackelberg game, the manufacturer makes different decisions under different recycling models. Typically, the manufacturer prioritizes profit. However, for long-term and sustainable development, in addition to the profit factor, the manufacturer should also consider the level of CSR investment. This subsection compares the results of the three recycling models and explores the differences in the optimal decision making of enterprises under different recycling models.
Theorem 4. Under the MR model, the manufacturer obtains the highest profit, and under the RR model, the manufacturer obtains the lowest profit, that is, .
Theorem 5. Under the MR model, the manufacturer’s CSR investment level is the largest, and under the RR model, the manufacturer’s CSR investment level is the lowest, that is,.
4.5. Numerical Simulation
In order to analyze the results more intuitively, we assign values to the parameters. Let Q = 1000,
,
,
,
, A = 1,
,
,
.
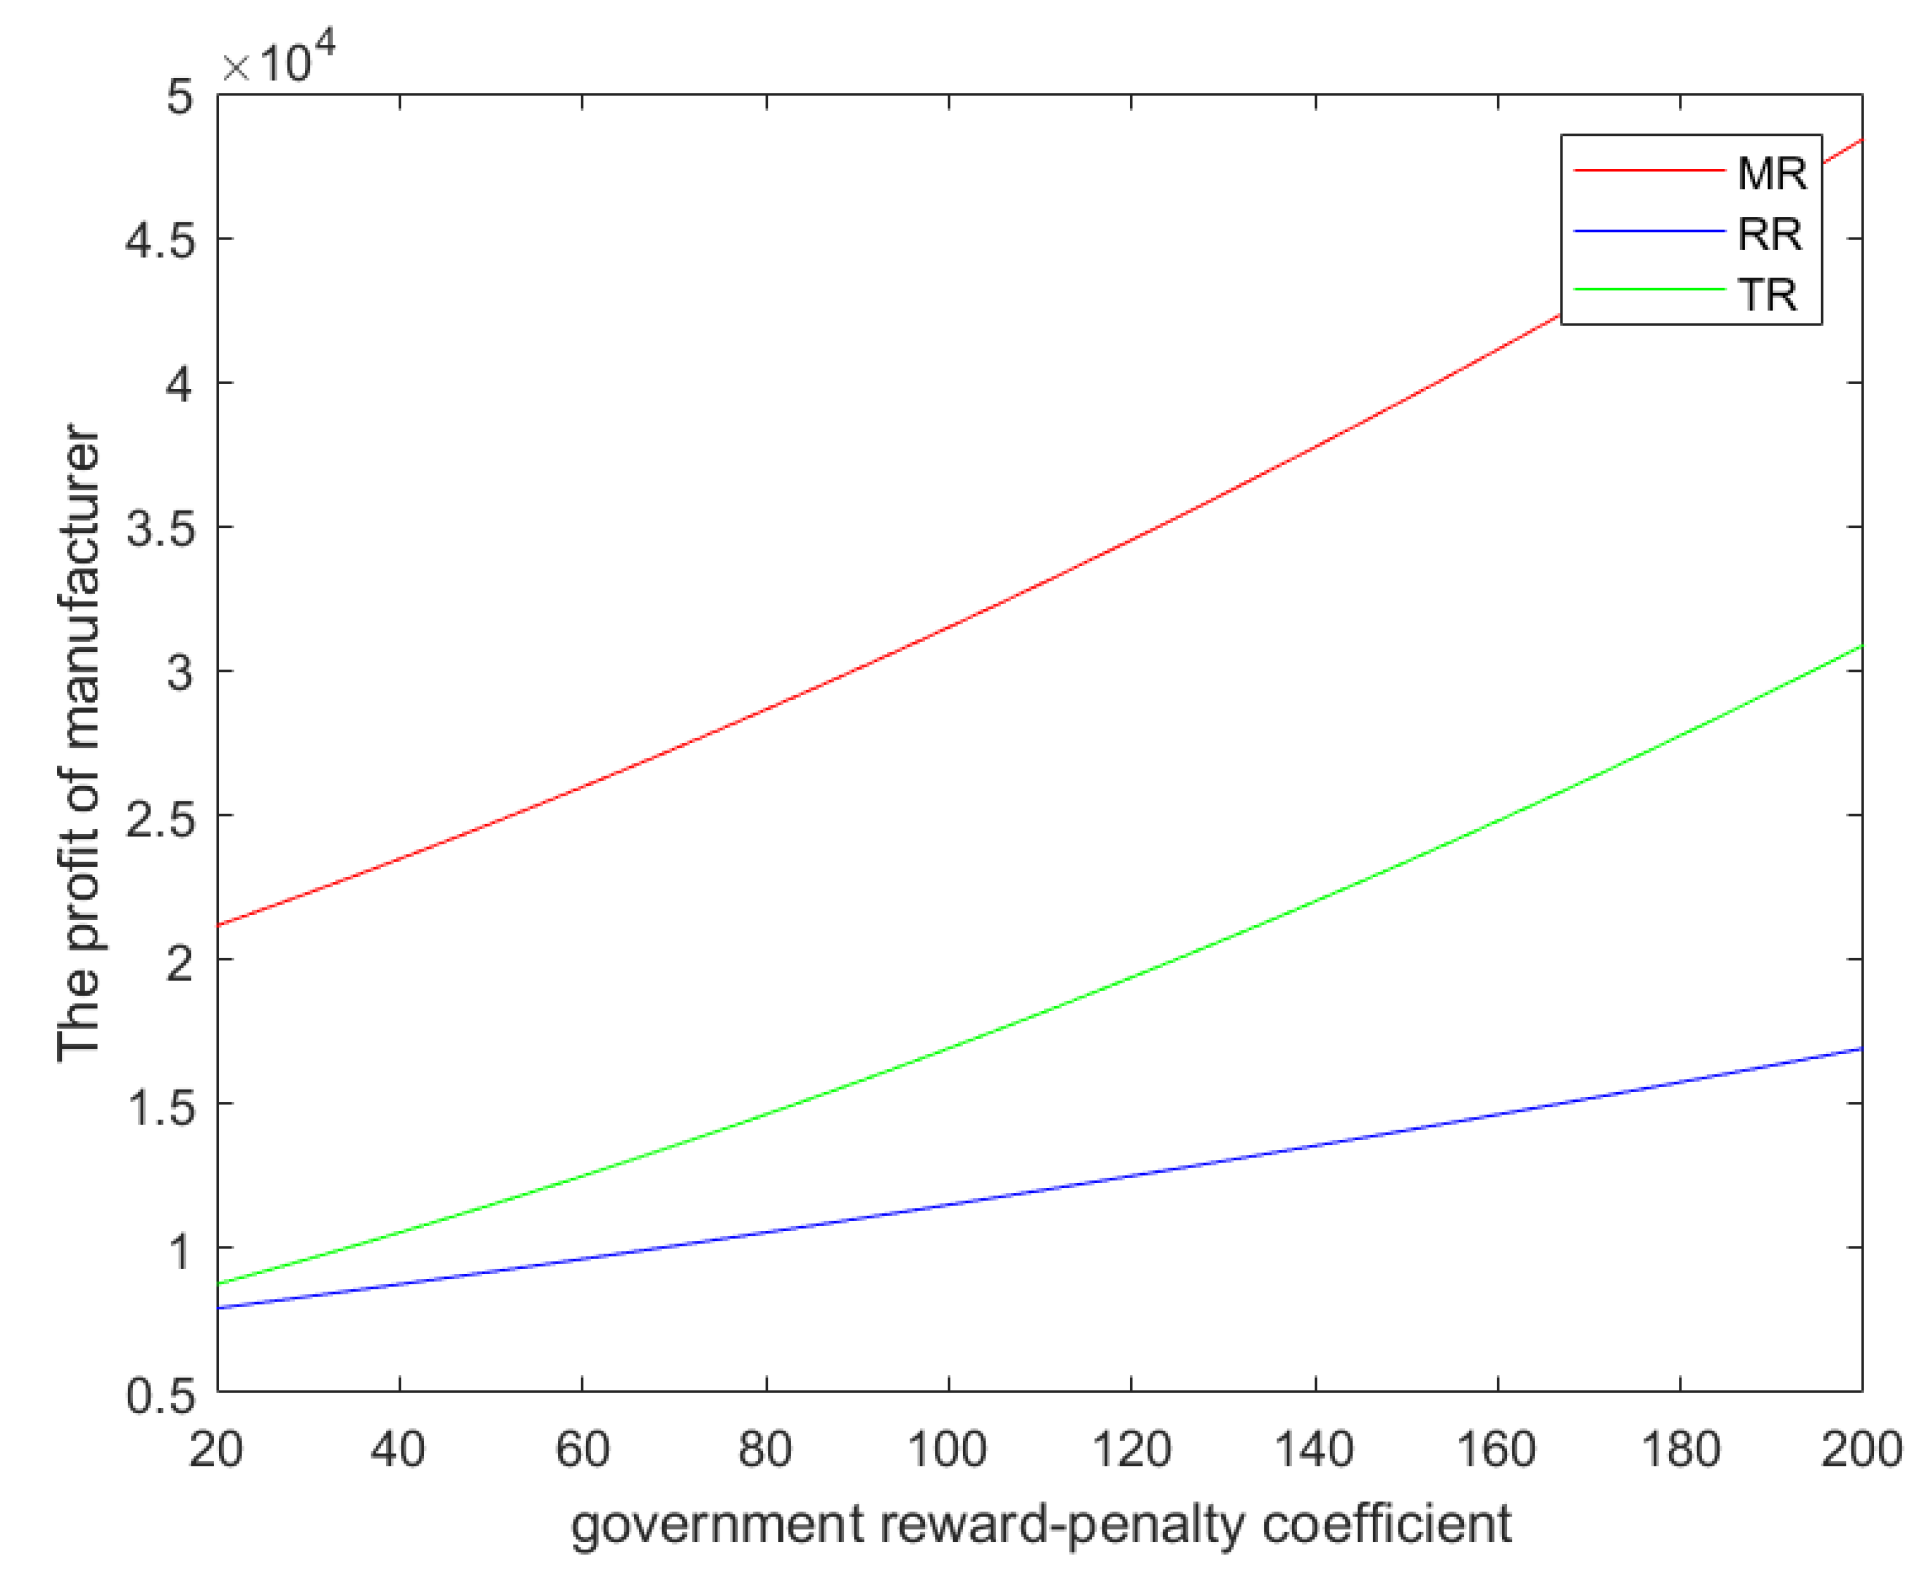
Figure 2 shows that with the increase in the government’s reward–penalty coefficient, the manufacturer’s optimal profits under all models increase. In the MR model, the manufacturer has the largest profit and the largest growth slope, followed by the TR model, and the manufacturer in the RR model has the lowest profit and the smallest growth slope. This result can verify Theorem 4.
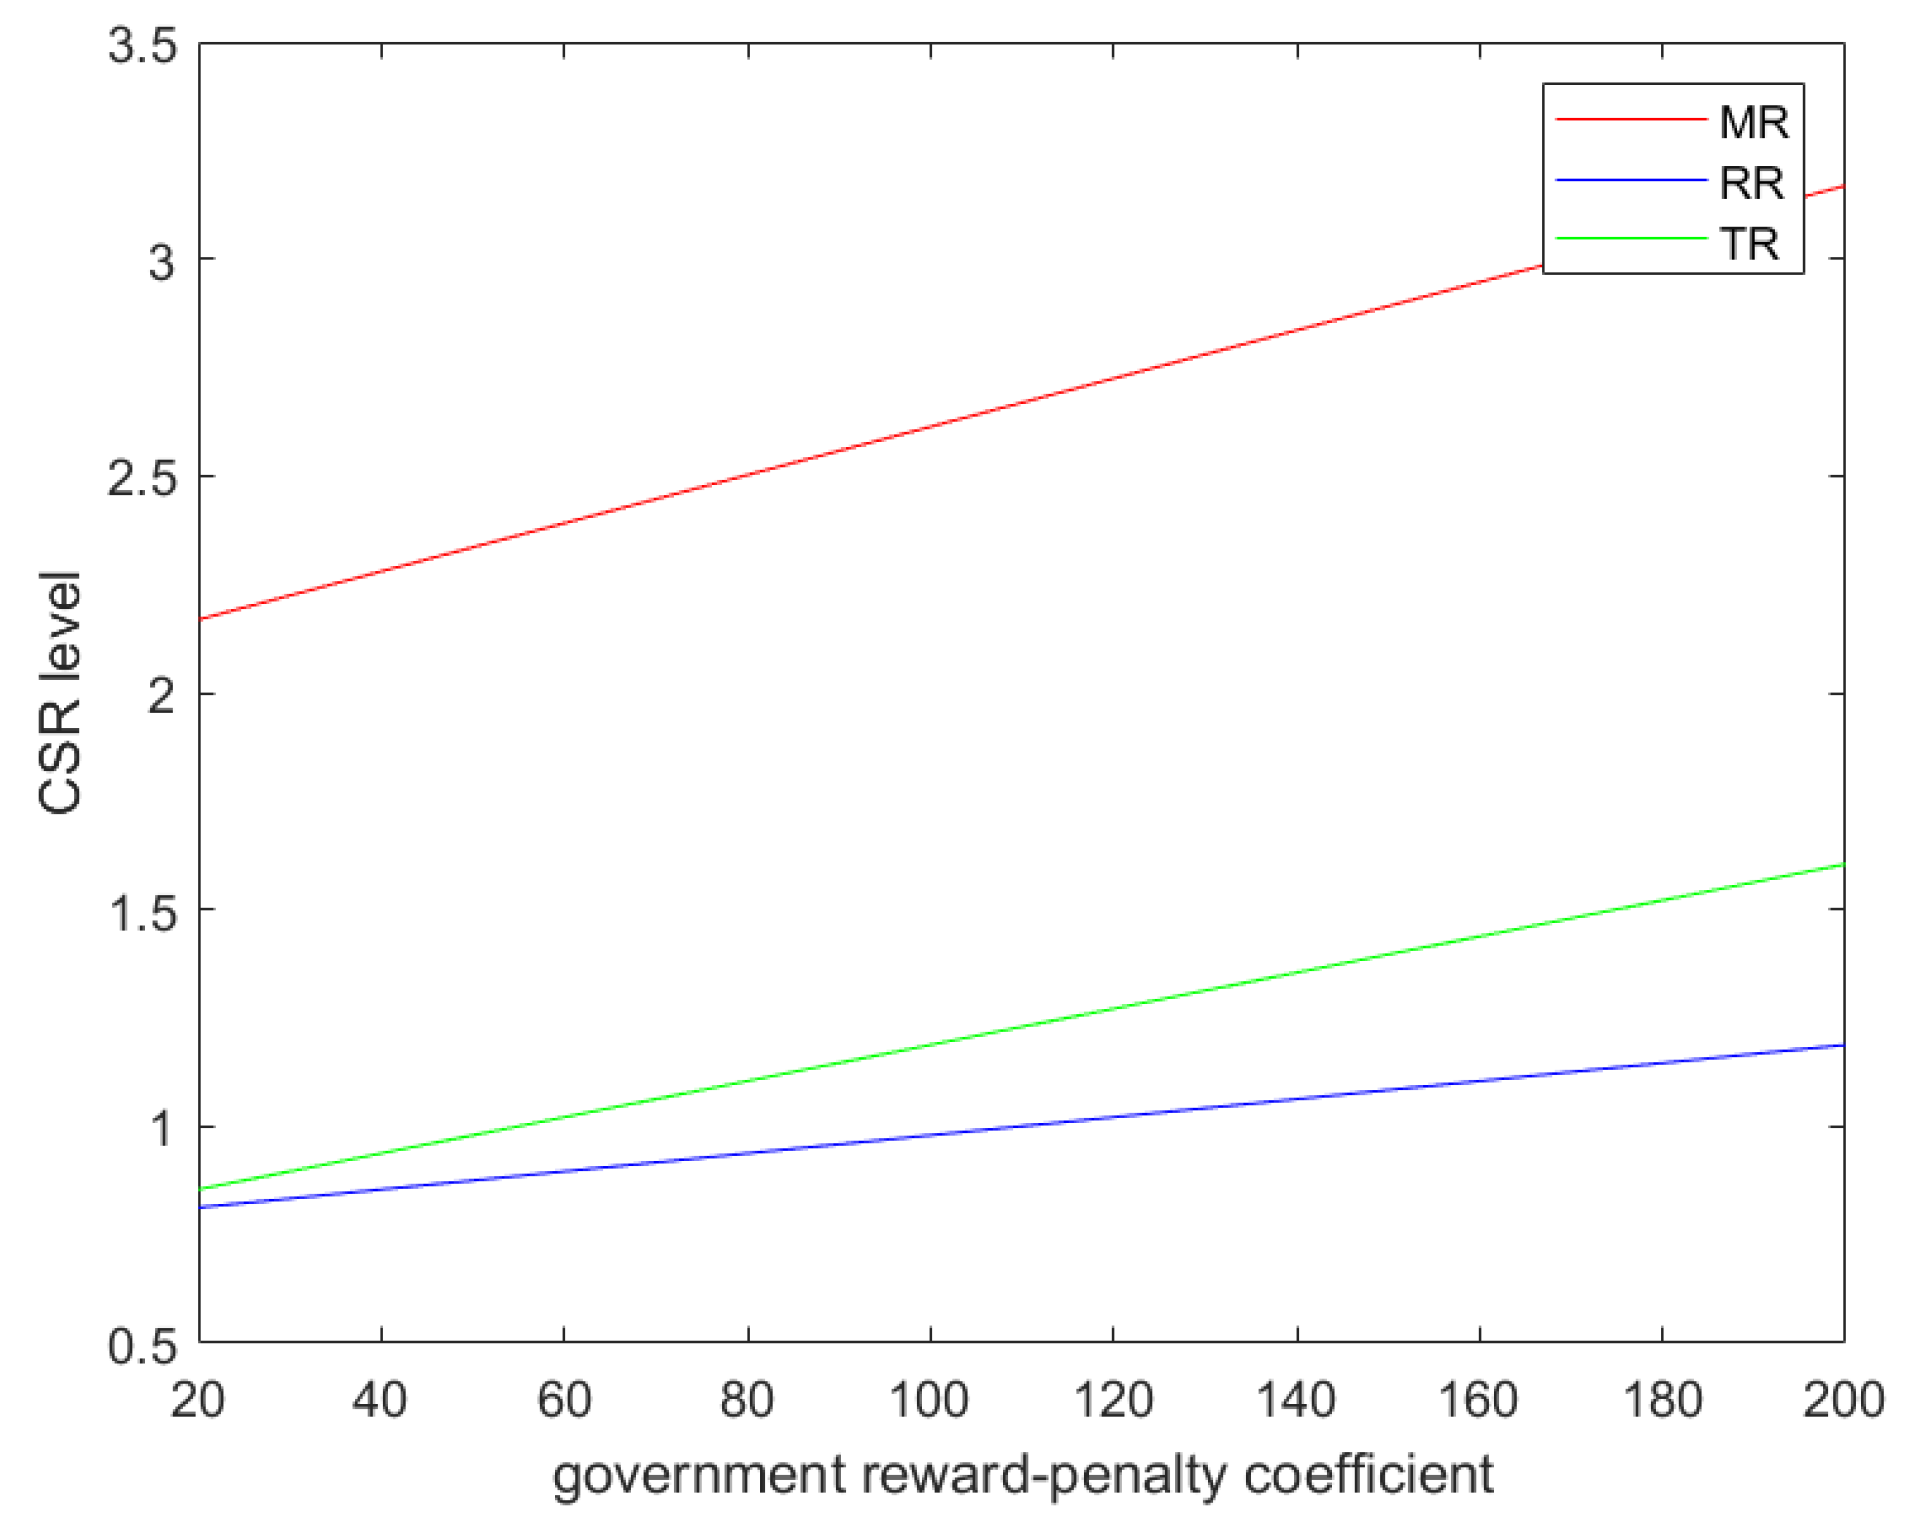
Figure 3 compares the CSR investment levels of CLSCs in three models. It can be seen from the figure that regardless of which recycling mode is used, the CSR investment level of the manufacturer increases with the increase in the government’s reward–penalty coefficient. The manufacturer has the highest CSR investment level in the MR model and the lowest CSR investment level in the RR model.
Figure 3 verifies Theorem 5. In a numerical simulation,
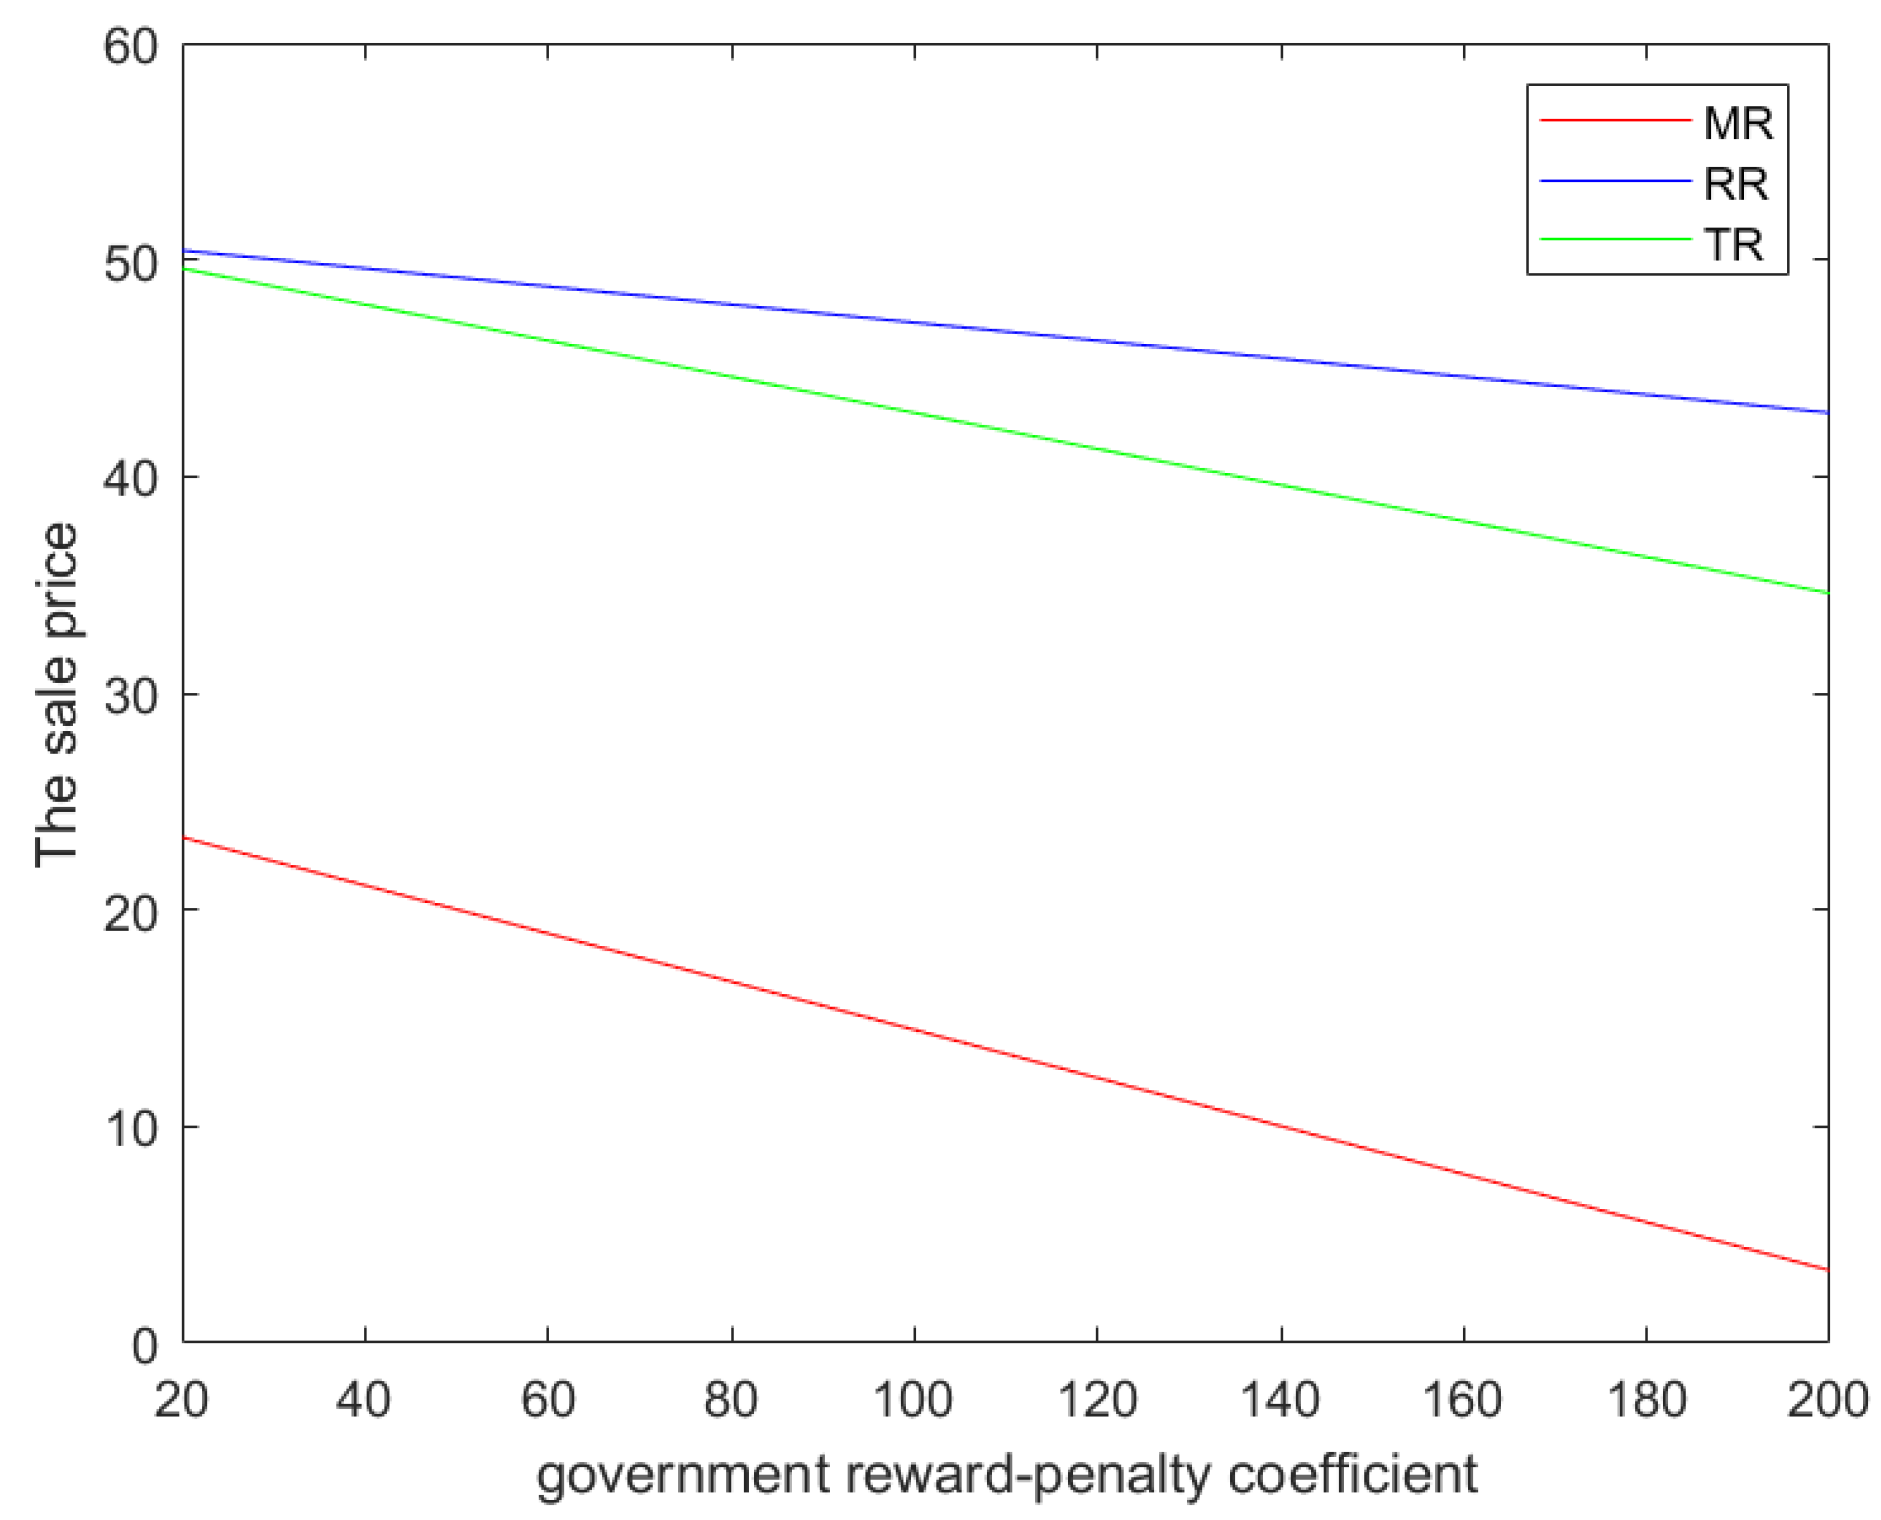
. It can be seen from
Figure 4 that the retail price of products decreases with the increase in the government’s reward–penalty coefficient. This verifies Corollary 1, Corollary 3, and Corollary 5.
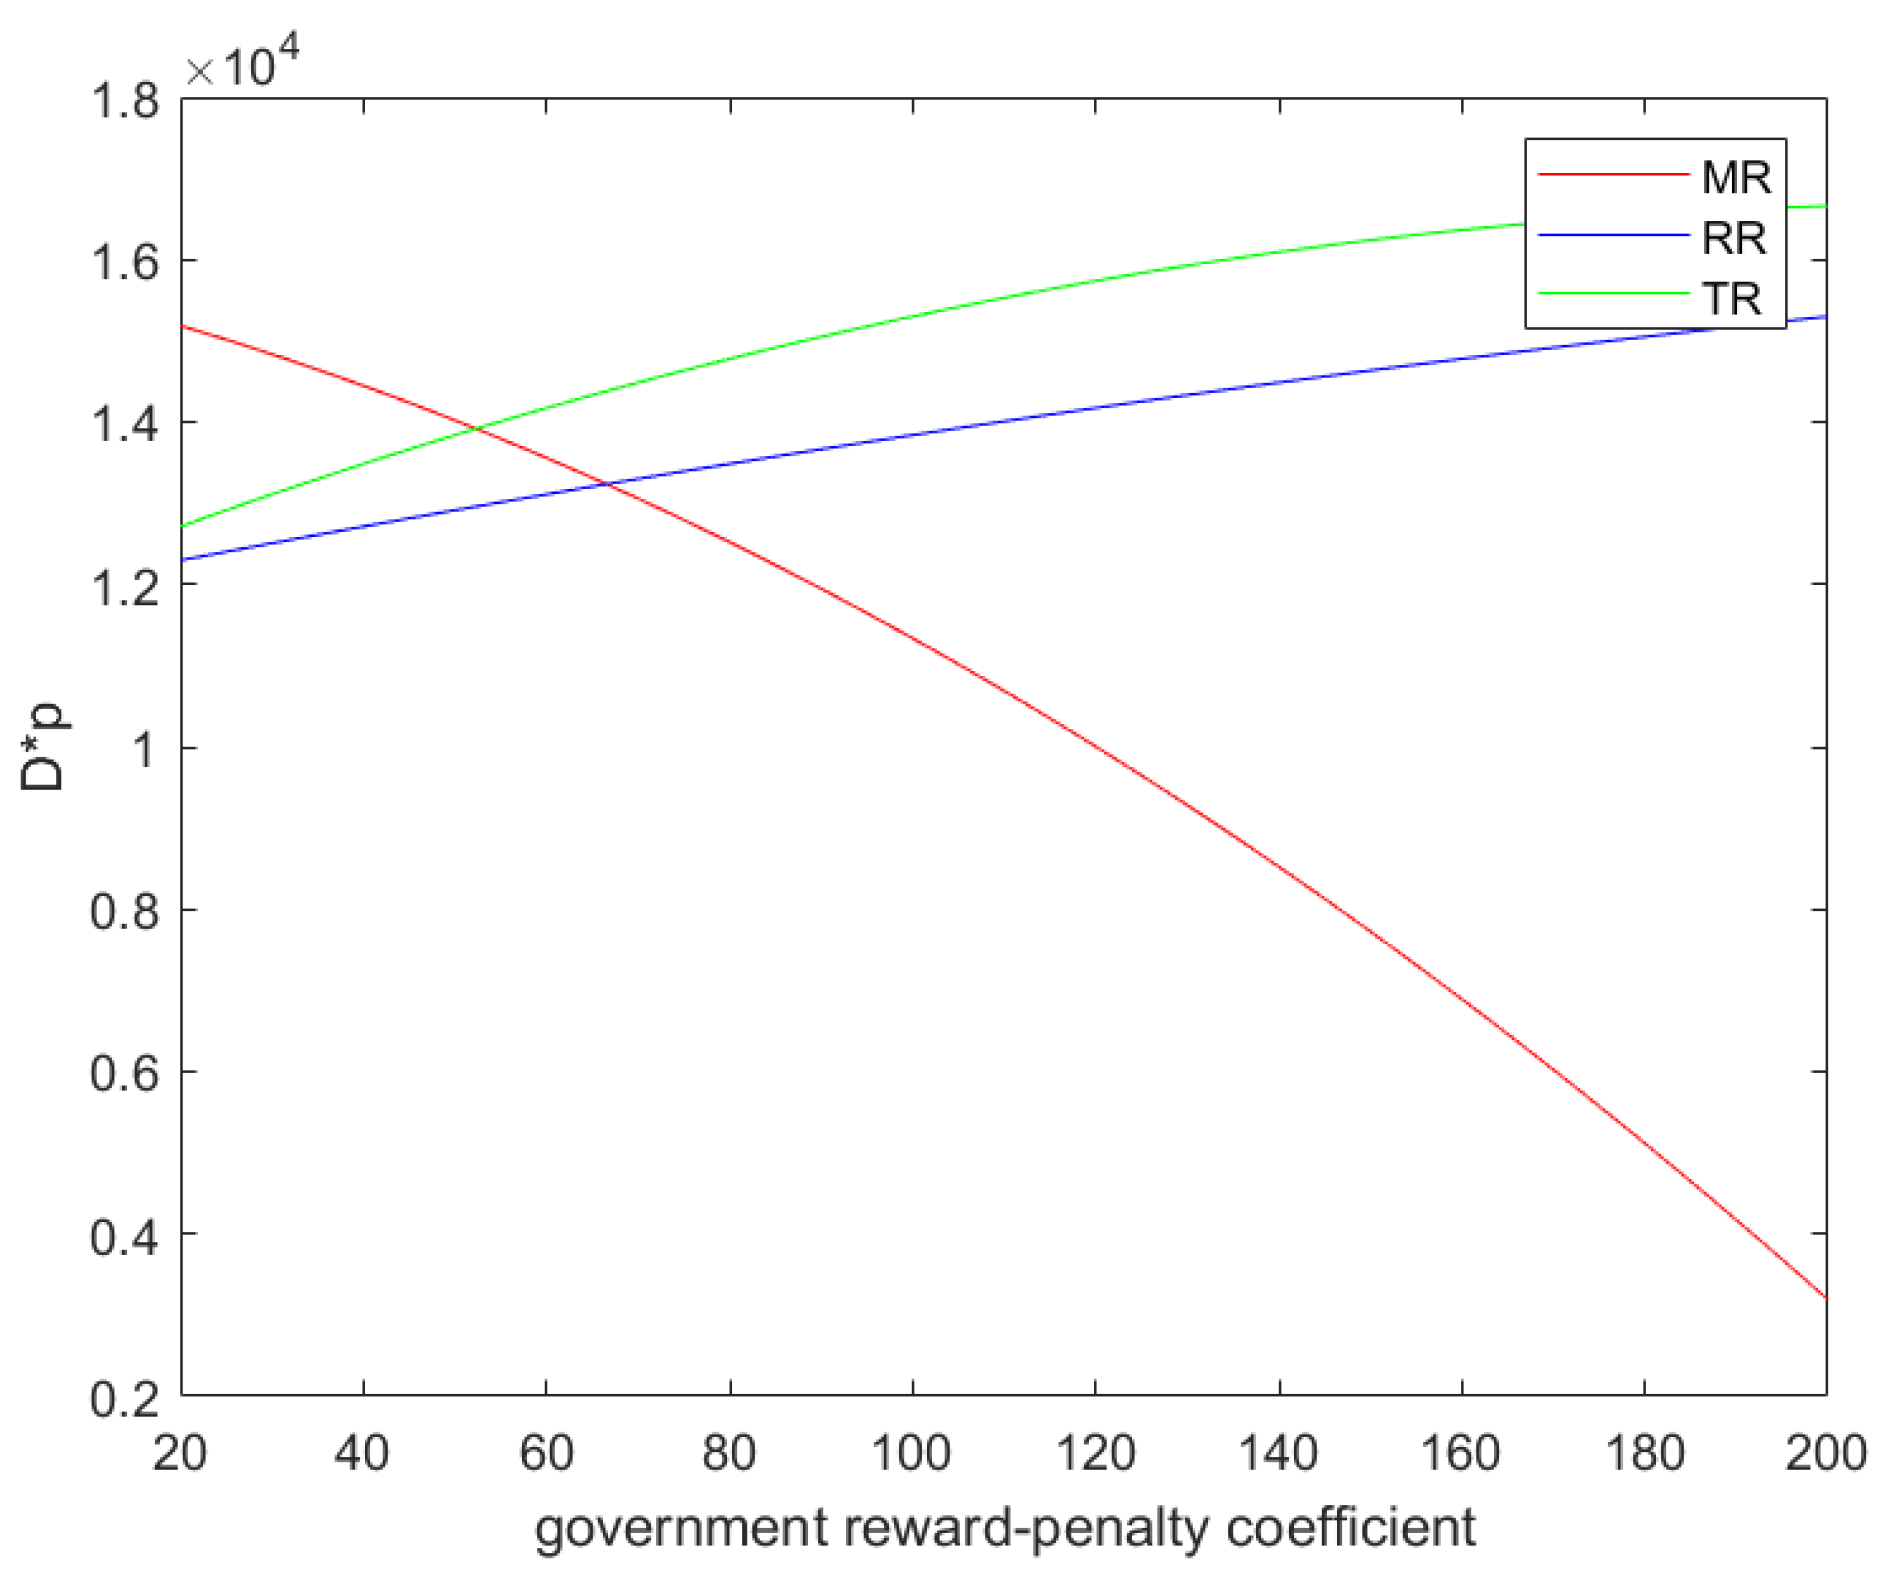
Figure 5 shows that the market demand increases with the increase in the government’s reward–penalty coefficient. The market demand under the MR model is the largest, and the market demand under the RR model is the smallest. The market demand multiplied by the product retail price can be regarded as an indicator of contribution to GDP. As can be seen from
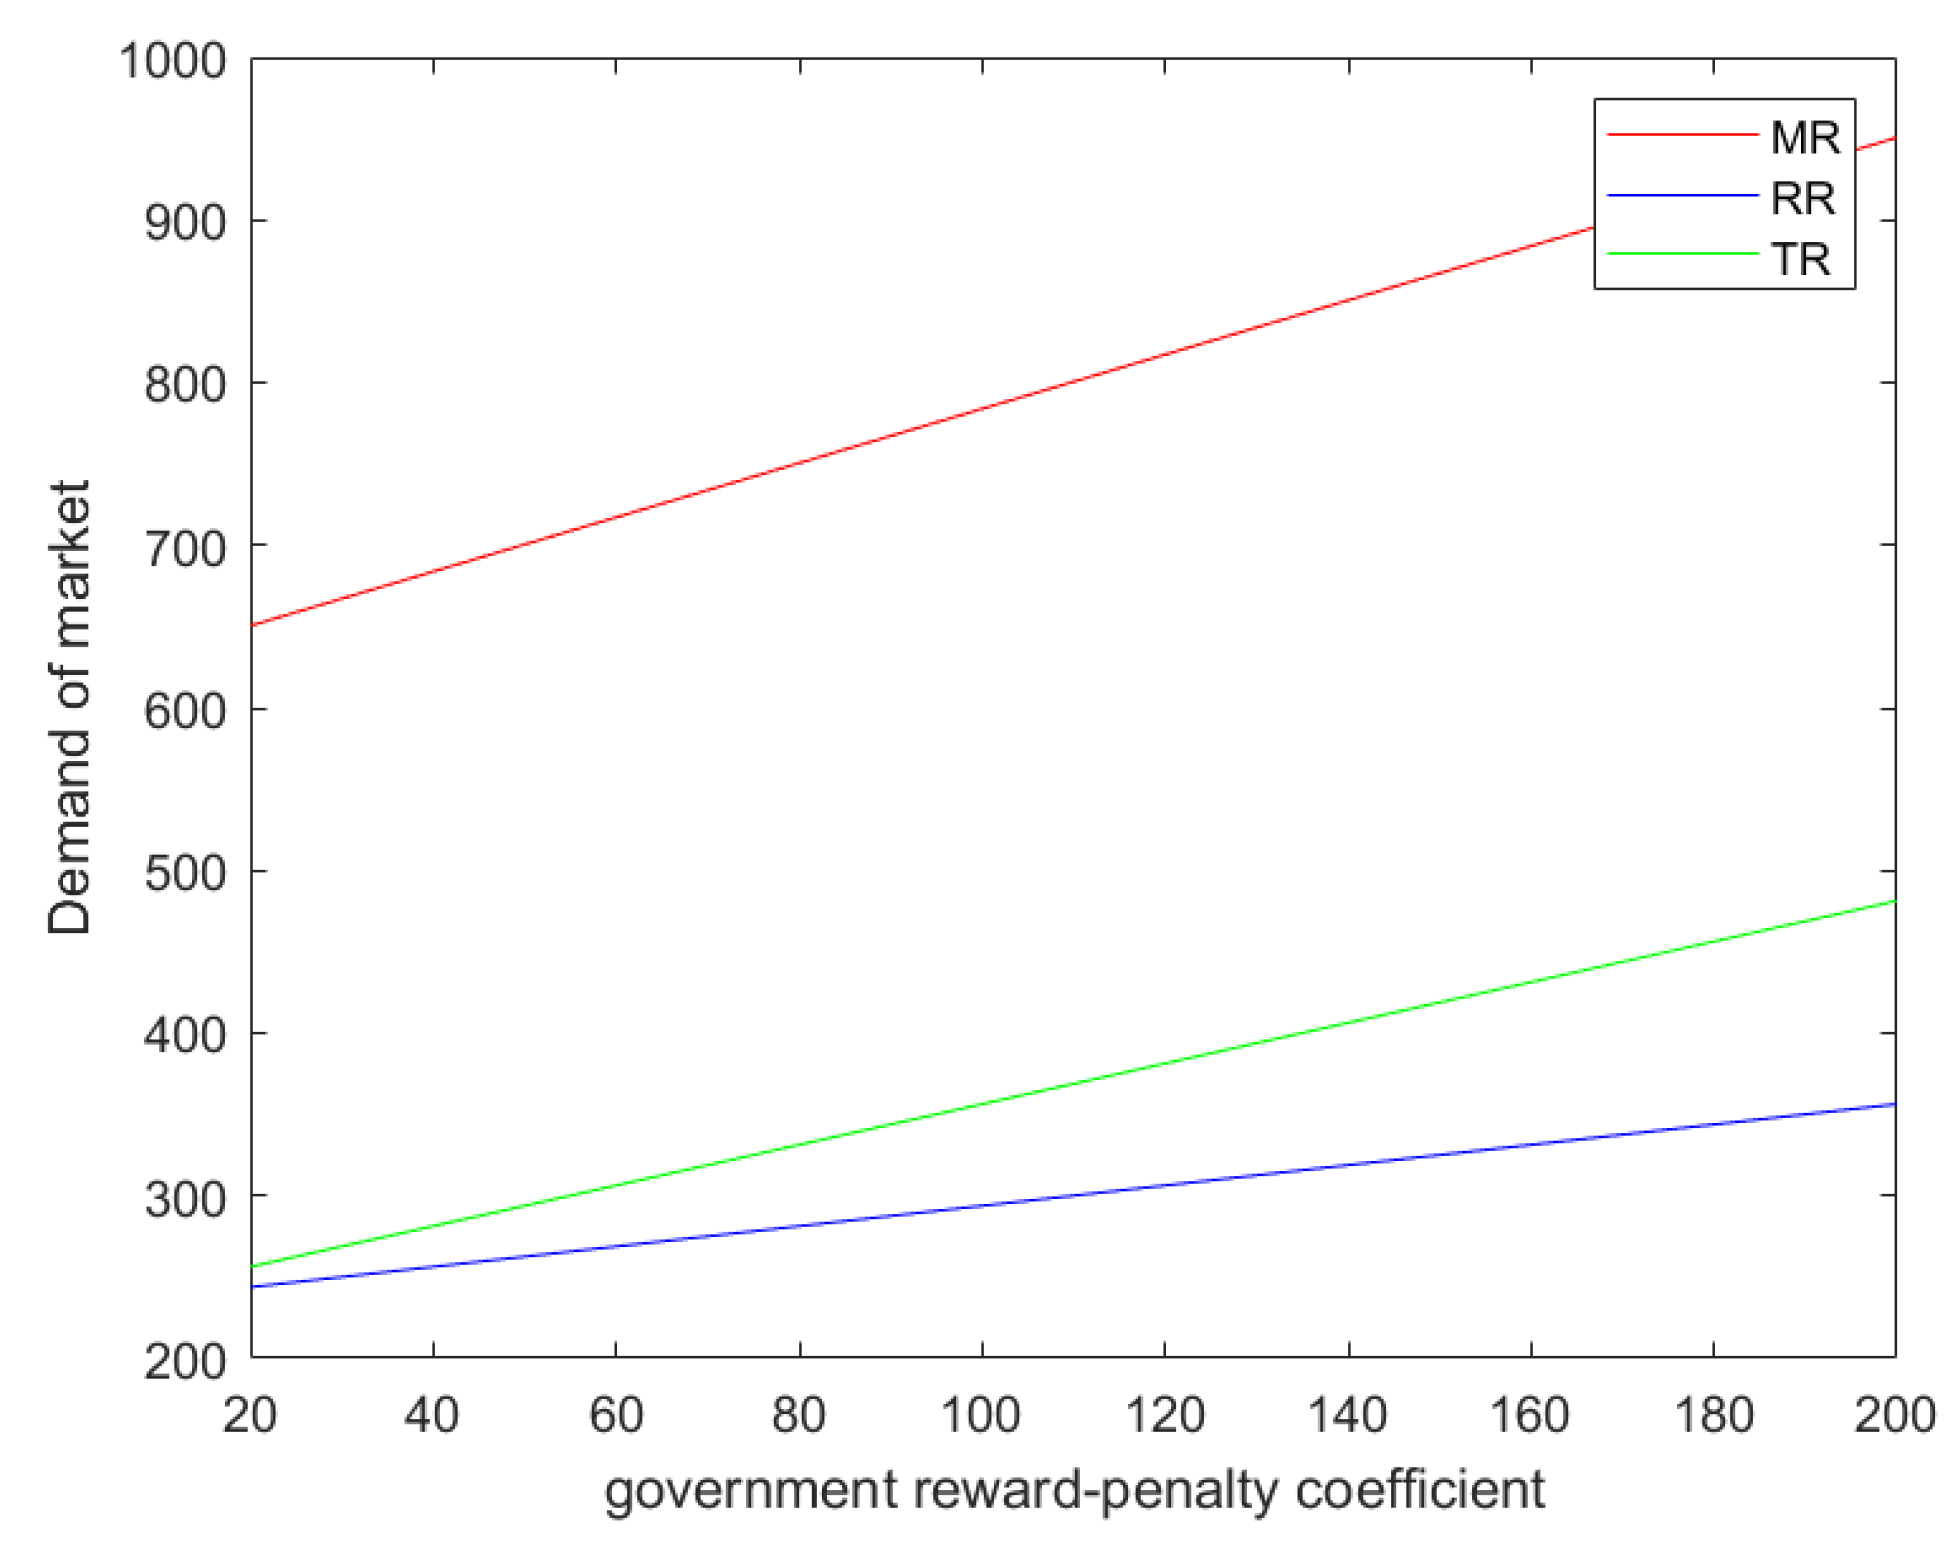
Figure 6, with the increase in the government’s reward–penalty coefficient, under the MR model, the GDP contribution decreases. Under the RR model and the TR model, the GDP contribution increases.
5. Discussion
This paper explores the issue of CLSC decision making and recycling channel selection in a CSR investment context. By analyzing and solving three different recovery models, we derive a series of theorems and corollaries. Some of them can be corroborated with previous related research. Zhao et al. [
35] believed that the investment of CSR can promote the overall development of CLSCs. This paper not only considers the investment of CSR, but also considers the implementation of the government’s reward–penalty policy. It is believed that with the increase in the government’s reward–penalty coefficient, the level of CSR investments will increase, and the profits of members of CLSCs will be further improved. Mohsin et al. [
36] constructed a third-party recycling CLSC operation and coordination model, and they analyzed the relationship between the level of CSR investment and market demand and recycling rate. The findings showed that CSR investments by the manufacturer and the retailer have a mutual incentive effect, which is beneficial to expand market demand for new products and improve the scrap recycling rate. This paper also draws the corresponding conclusion, that is, under certain conditions, there is a positive correlation between the manufacturer’s CSR investment level and market demand and WEEE recovery rate. Modak et al. [
21] integrated the specific behavior of CSR into CLSC management, and they believed that the investment of CSR and CLSC management complement each other and promote together. Mondal et al. [
37] proposed a closed-loop supply chain model with dual recycling channels, and they believed that a higher corporate social responsibility investment can promote the sustainable development of closed-loop supply chains. Their studies are consistent with the conclusions of this paper. Based on government subsidies and demand disruption, Ma [
38] constructed a CLSC with three government-subsidized models of government-subsidized manufacturers, retailers, and customers. This research showed that government-subsidized retailers can bring huge economic benefits and environmental benefits to CLSCs. Li et al. [
1] believed that in CLSCs, no matter what cooperation mode the member enterprises adopt, the government’s reward–penalty policy can promote the development of CLSCs. This paper draws a similar conclusion, showing that the improvement of the government’s reward and punishment coefficient can effectively promote the improvement of the profits of closed-loop supply chain member companies.
In this article, we can also draw some unique conclusions. When the manufacturer is responsible for recycling WEEE, the manufacturer obtains the largest profit and the highest level of CSR investment. With the change of the government’s reward–penalty coefficient, the MR model still maintains advantages in these two aspects. Therefore, the manufacturer will choose itself as the channel for recycling WEEE for the purpose of prioritizing their interests and enhancing their brand. At the same time, we can also see that under the MR model, the retail price of the products is the lowest, which is also the most acceptable situation for customers. In practice, many manufacturers are involved in the recycling of their own WEEE, such as Huawei and Apple. For governments however, these factors are only part of their consideration. We consider market demand multiplied by the retail price of a product as a measure of GDP contribution. We name it GDP contribution. From
Figure 6, we can see that with the improvement of the government’s reward–penalty coefficient, the curve of the MR model shows a downward trend, and the curves of the RR model and TR model show an upward trend. When the government’s reward–penalty coefficient is low, the GDP contribution of the MR model is greater than that of the RR model and TR model. When the government’s reward–penalty coefficient is high, the MR model’s GDP contribution is smaller than that of the RR model and TR model. In order to promote the improvement of GDP contribution, the government will set a higher reward–penalty coefficient, and hope manufacturers choose retailers or third-party recyclers to be responsible for the recycling of WEEE.
6. Conclusions
This paper constructs three CLSC models with different recycling channels, explores the decision making of CLSCs when the manufacturer considers CSR under the government’s reward–penalty policy, and compares the three recycling channels. This paper draws the following conclusions. (1) When the manufacturer is responsible for recycling WEEE, the enterprise has the highest level of optimal CSR investment and can obtain the maximum profit. For the manufacturer, choosing to recycle WEEE by itself is the best channel to obtain long-term and sustainable development. (2) Under the three recycling models, the manufacturer’s optimal profit and CSR investment level are in the same order, and they all increase with the increase in the government’s reward–penalty coefficient. (3) When the manufacturer is responsible for recycling WEEE, the enterprise can obtain the most profit and the largest CSR investment level, but since the GDP contribution at this time decreases with the increase in the government’s reward–penalty coefficient, this is not the best choice for the government. When the retailer or the third-party recycler is responsible for recycling WEEE, the GDP contribution increases with the increase in the government’s reward–penalty coefficient, and the government is more inclined to this choice.
Due to the complexity of the model and the lack of data, there are certain limitations in this study. The supply chain structure in reality is more complicated, and each member of the supply chain plays a more important role. It is difficult for the manufacturer to occupy an absolute leadership position. Therefore, in the future, a more complex power structure will be introduced into a CLSC, considering the CSR demands of node companies in the supply chain, and further deepening the existing research. In addition, this paper simplifies the relationship between CSR and market demand in the model, describing them as a simple linear increasing relationship. For people with middle or high income, this may be applicable, but for low-income individuals, the relationship between CSR and demand is weak, and this model is no longer applicable. Therefore, in future research, the relationship between market demand and CSR will be optimized in combination with reality to be closer to the actual market operation relationship.


