
FVM-RANS Modeling of Air Pollutants Dispersion and Traffic Emission in Dhaka City on a Suburb Scale

 , ,
, ,  and
and 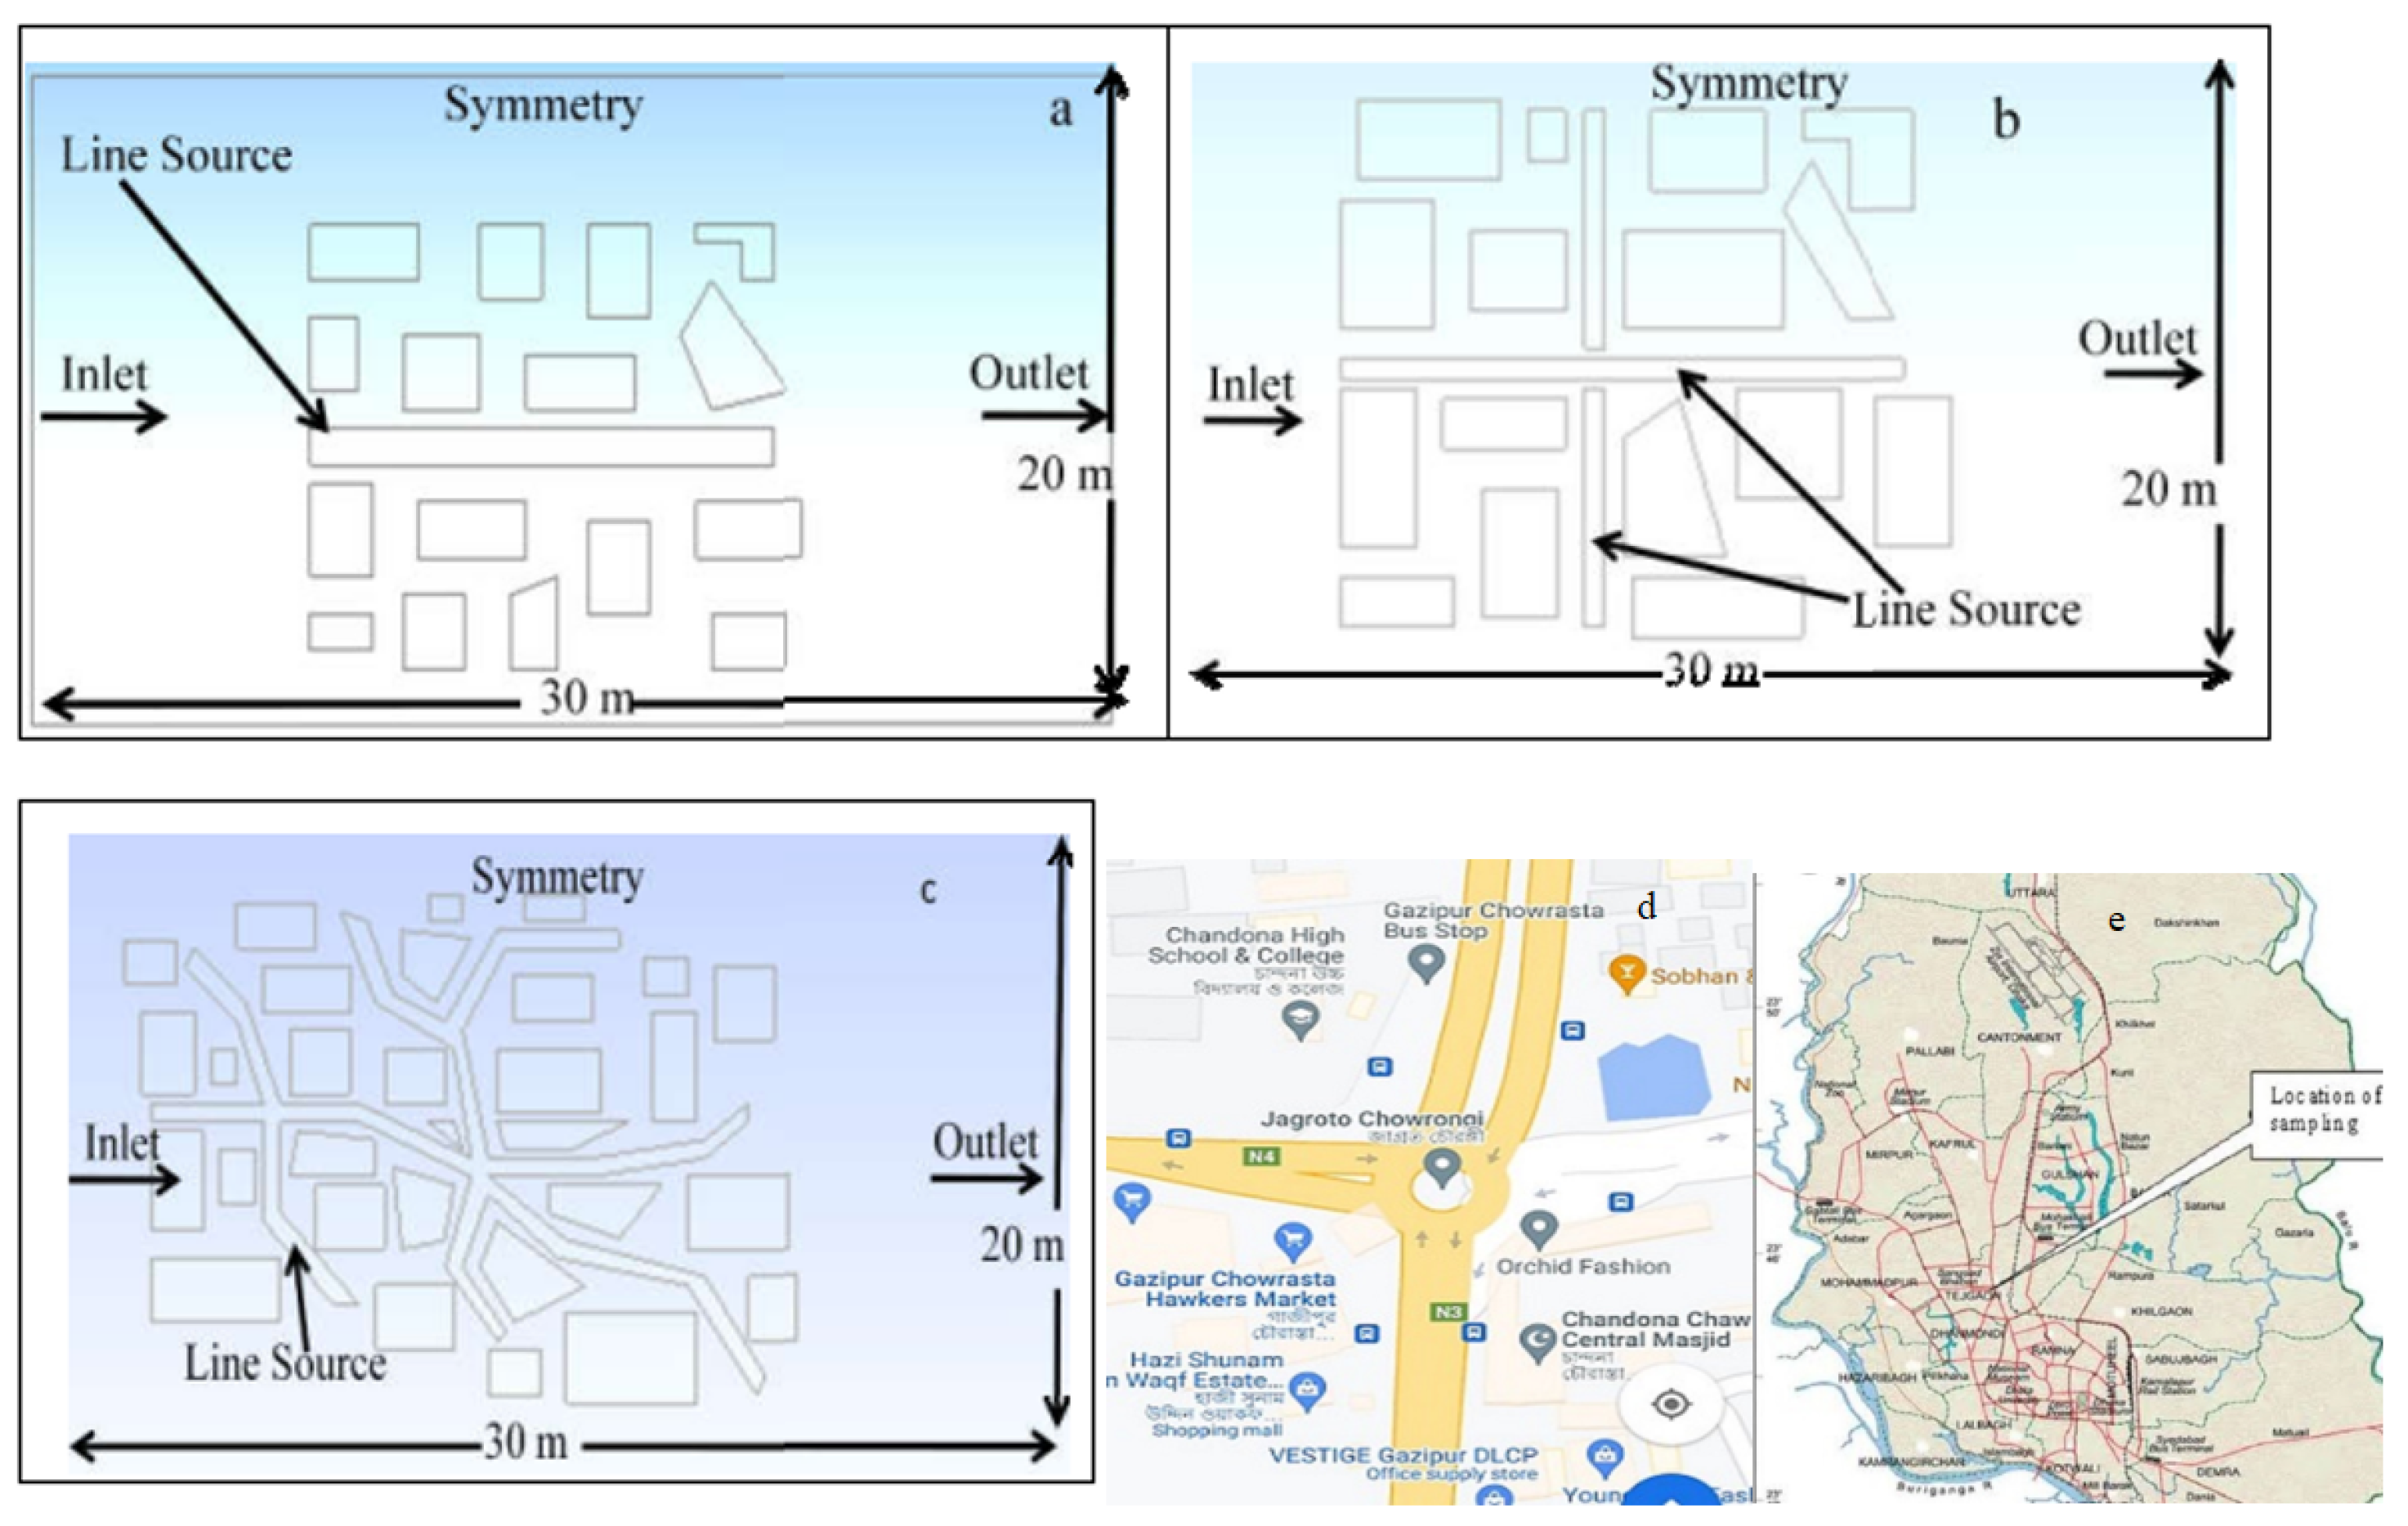
Abstract
:1. Introduction
2. Mathematical Formulation
2.1. Continuity, Momentum, and Pollutants Transport Equations
2.2. Turbulence Model
2.3. Boundary Condition
2.4. Turbulent Kinetic Energy
3. Methodology
3.1. Measurement Site, Wind Direction, and Seasonal Impact
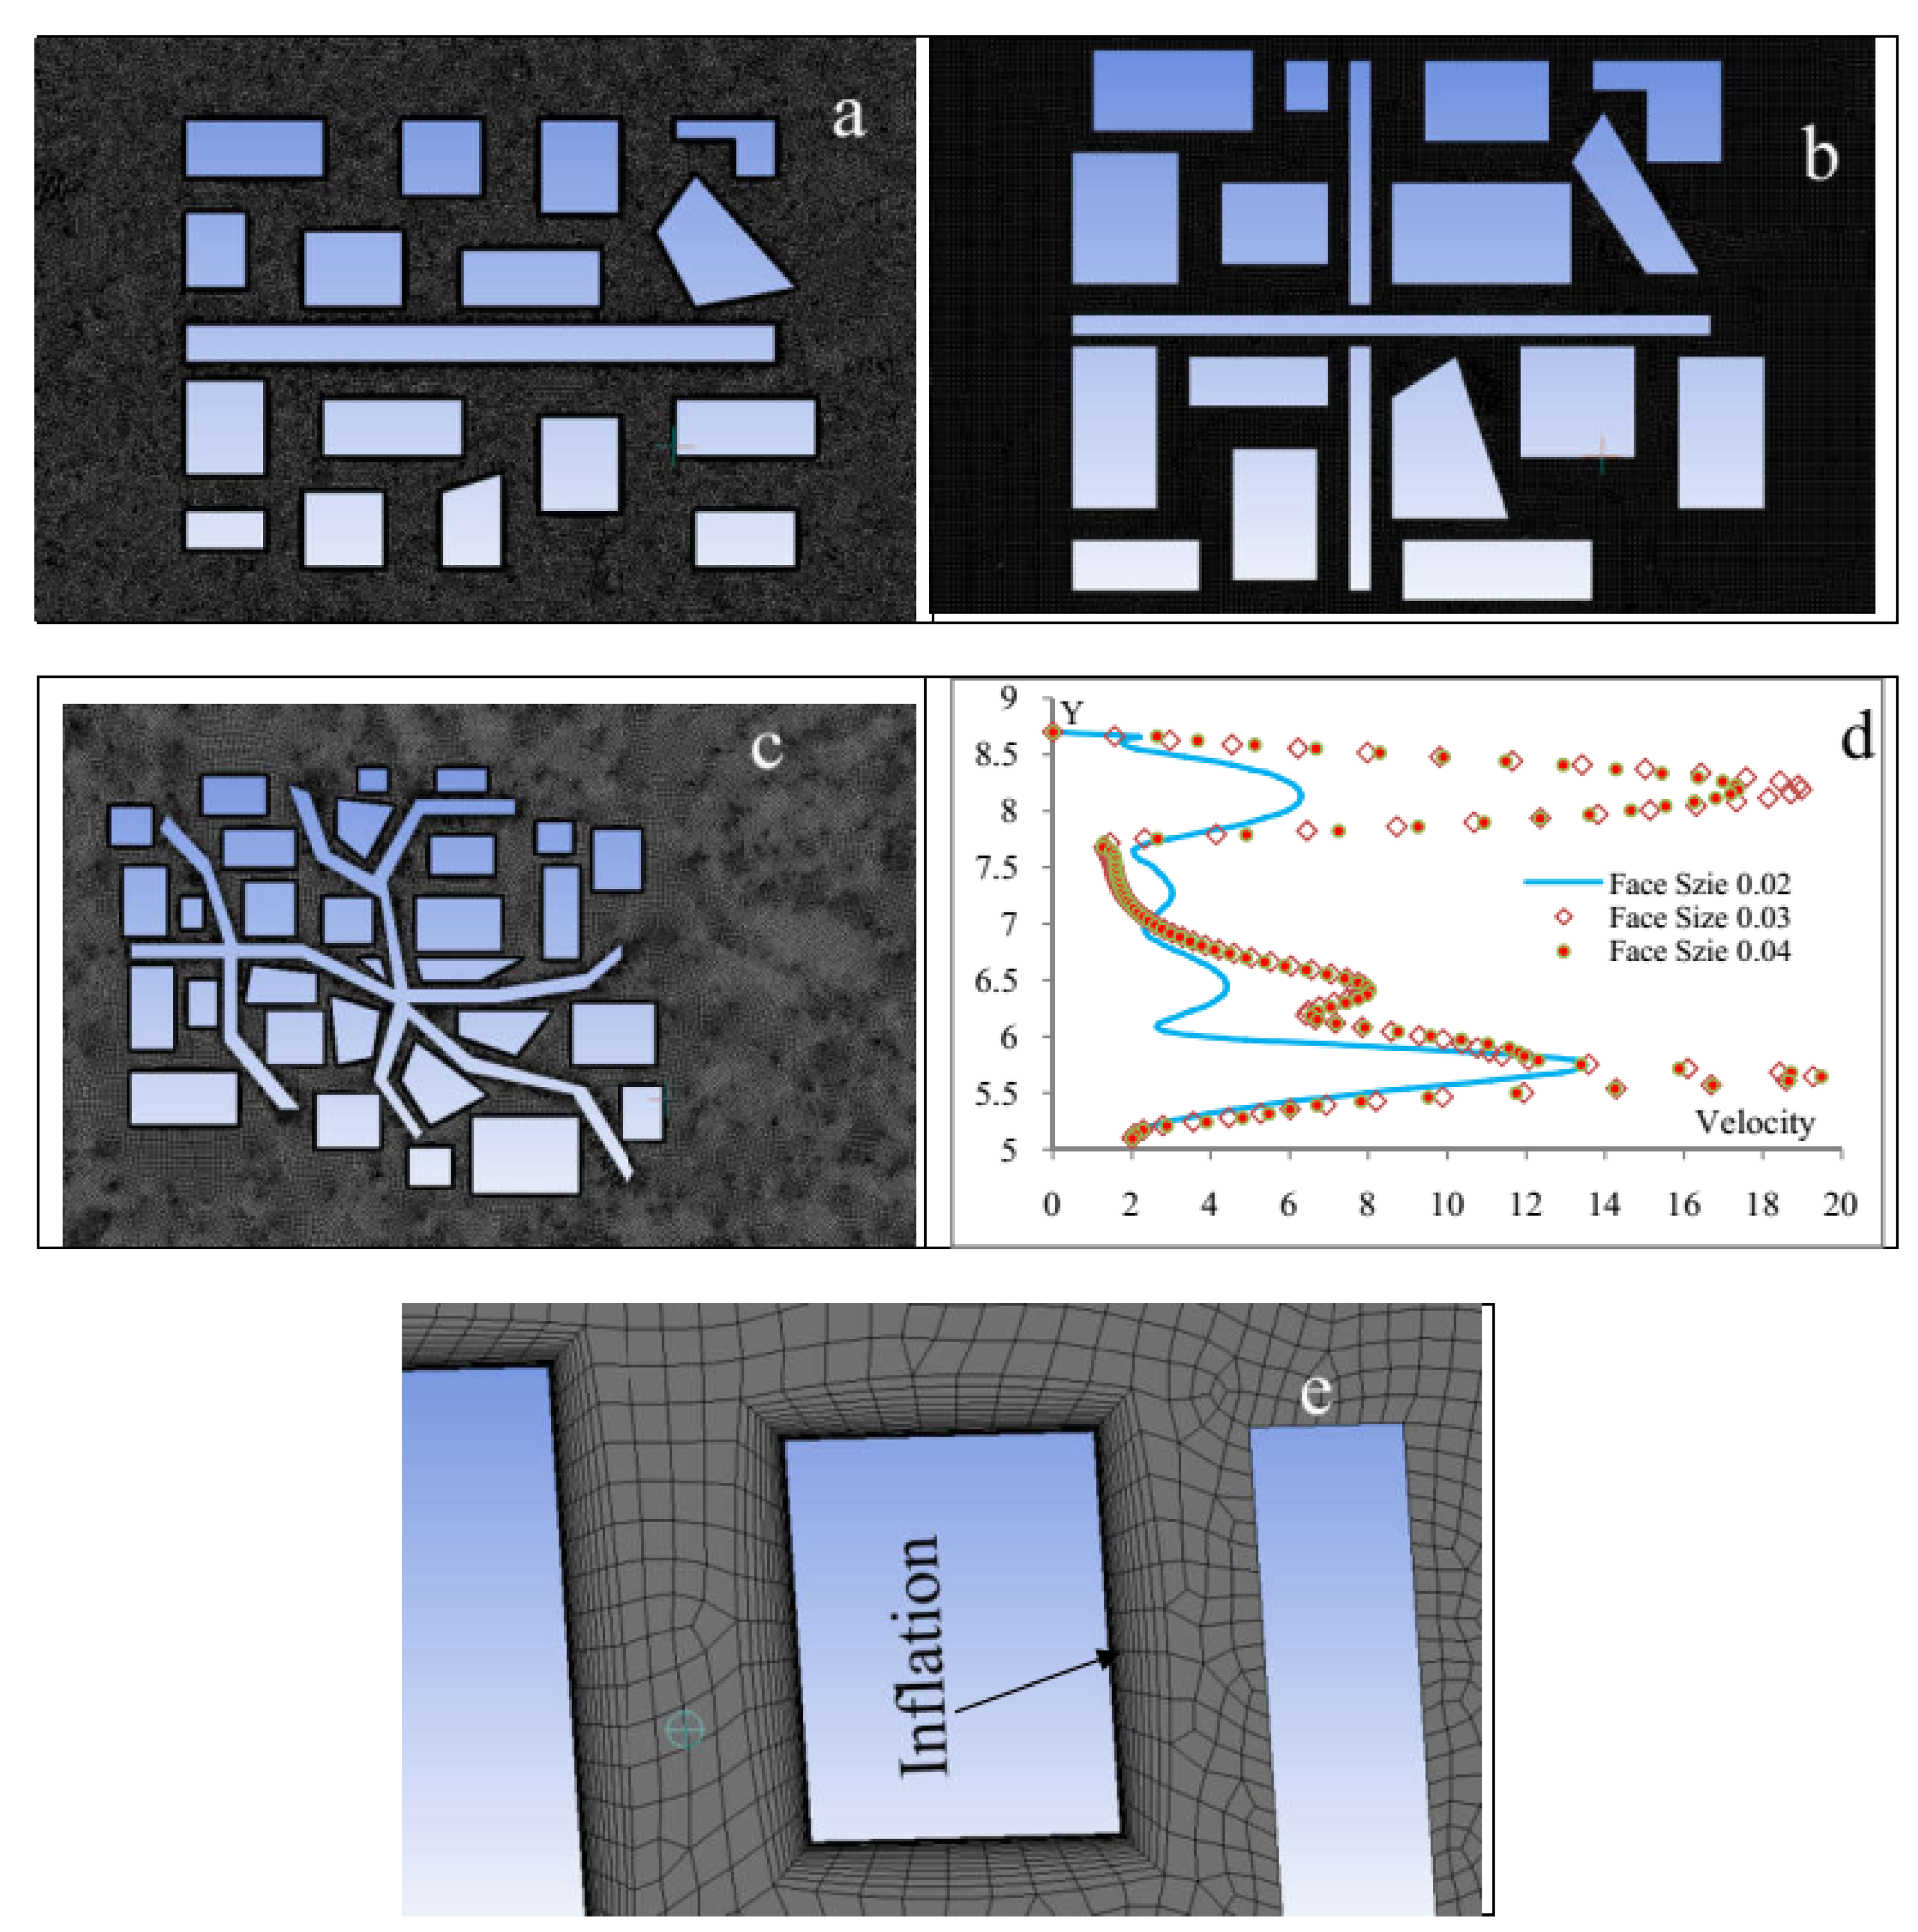
3.2. Computational Domain Discretization
3.3. Model Development and Variables
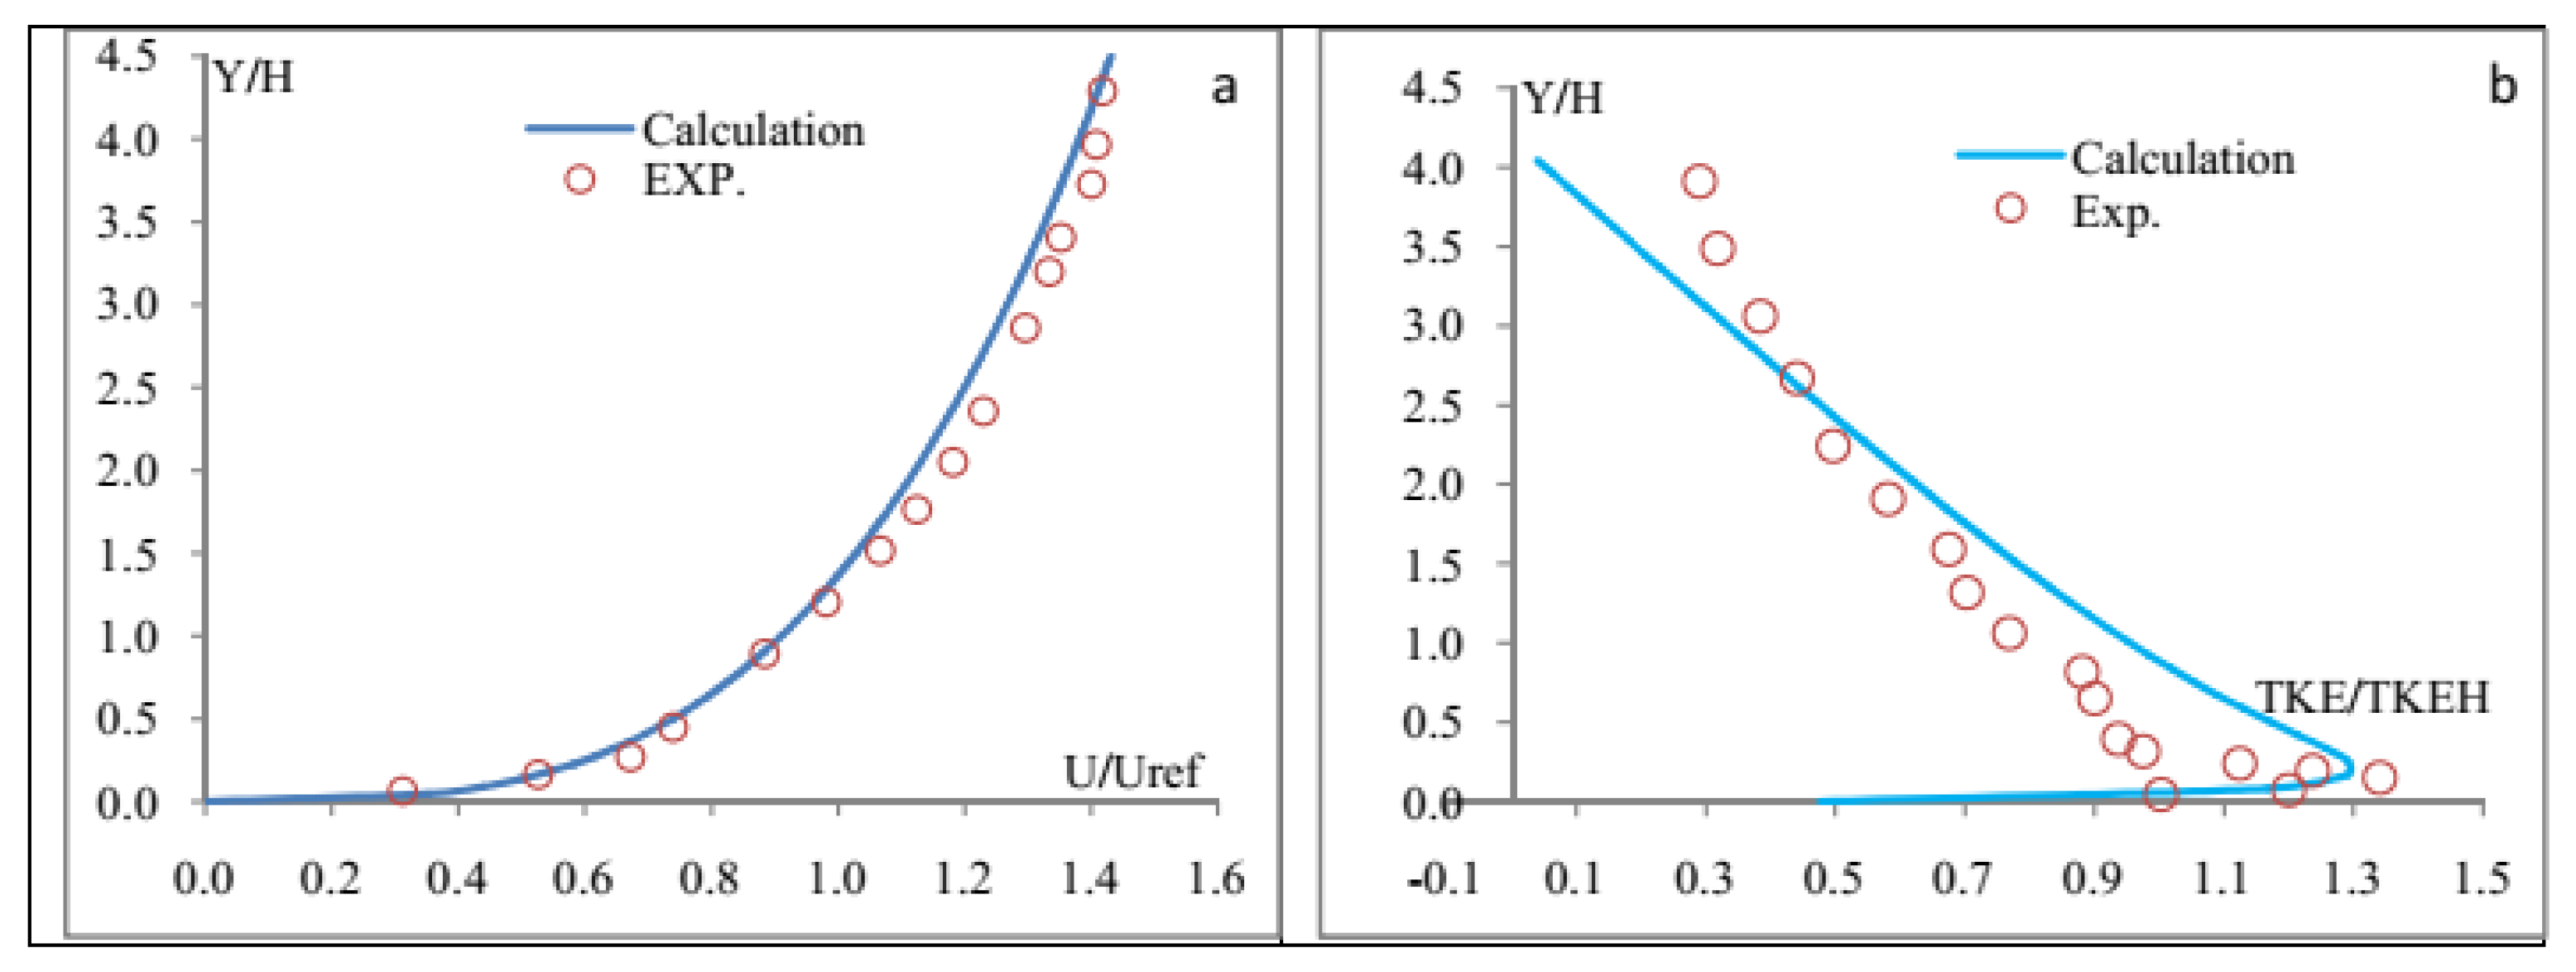
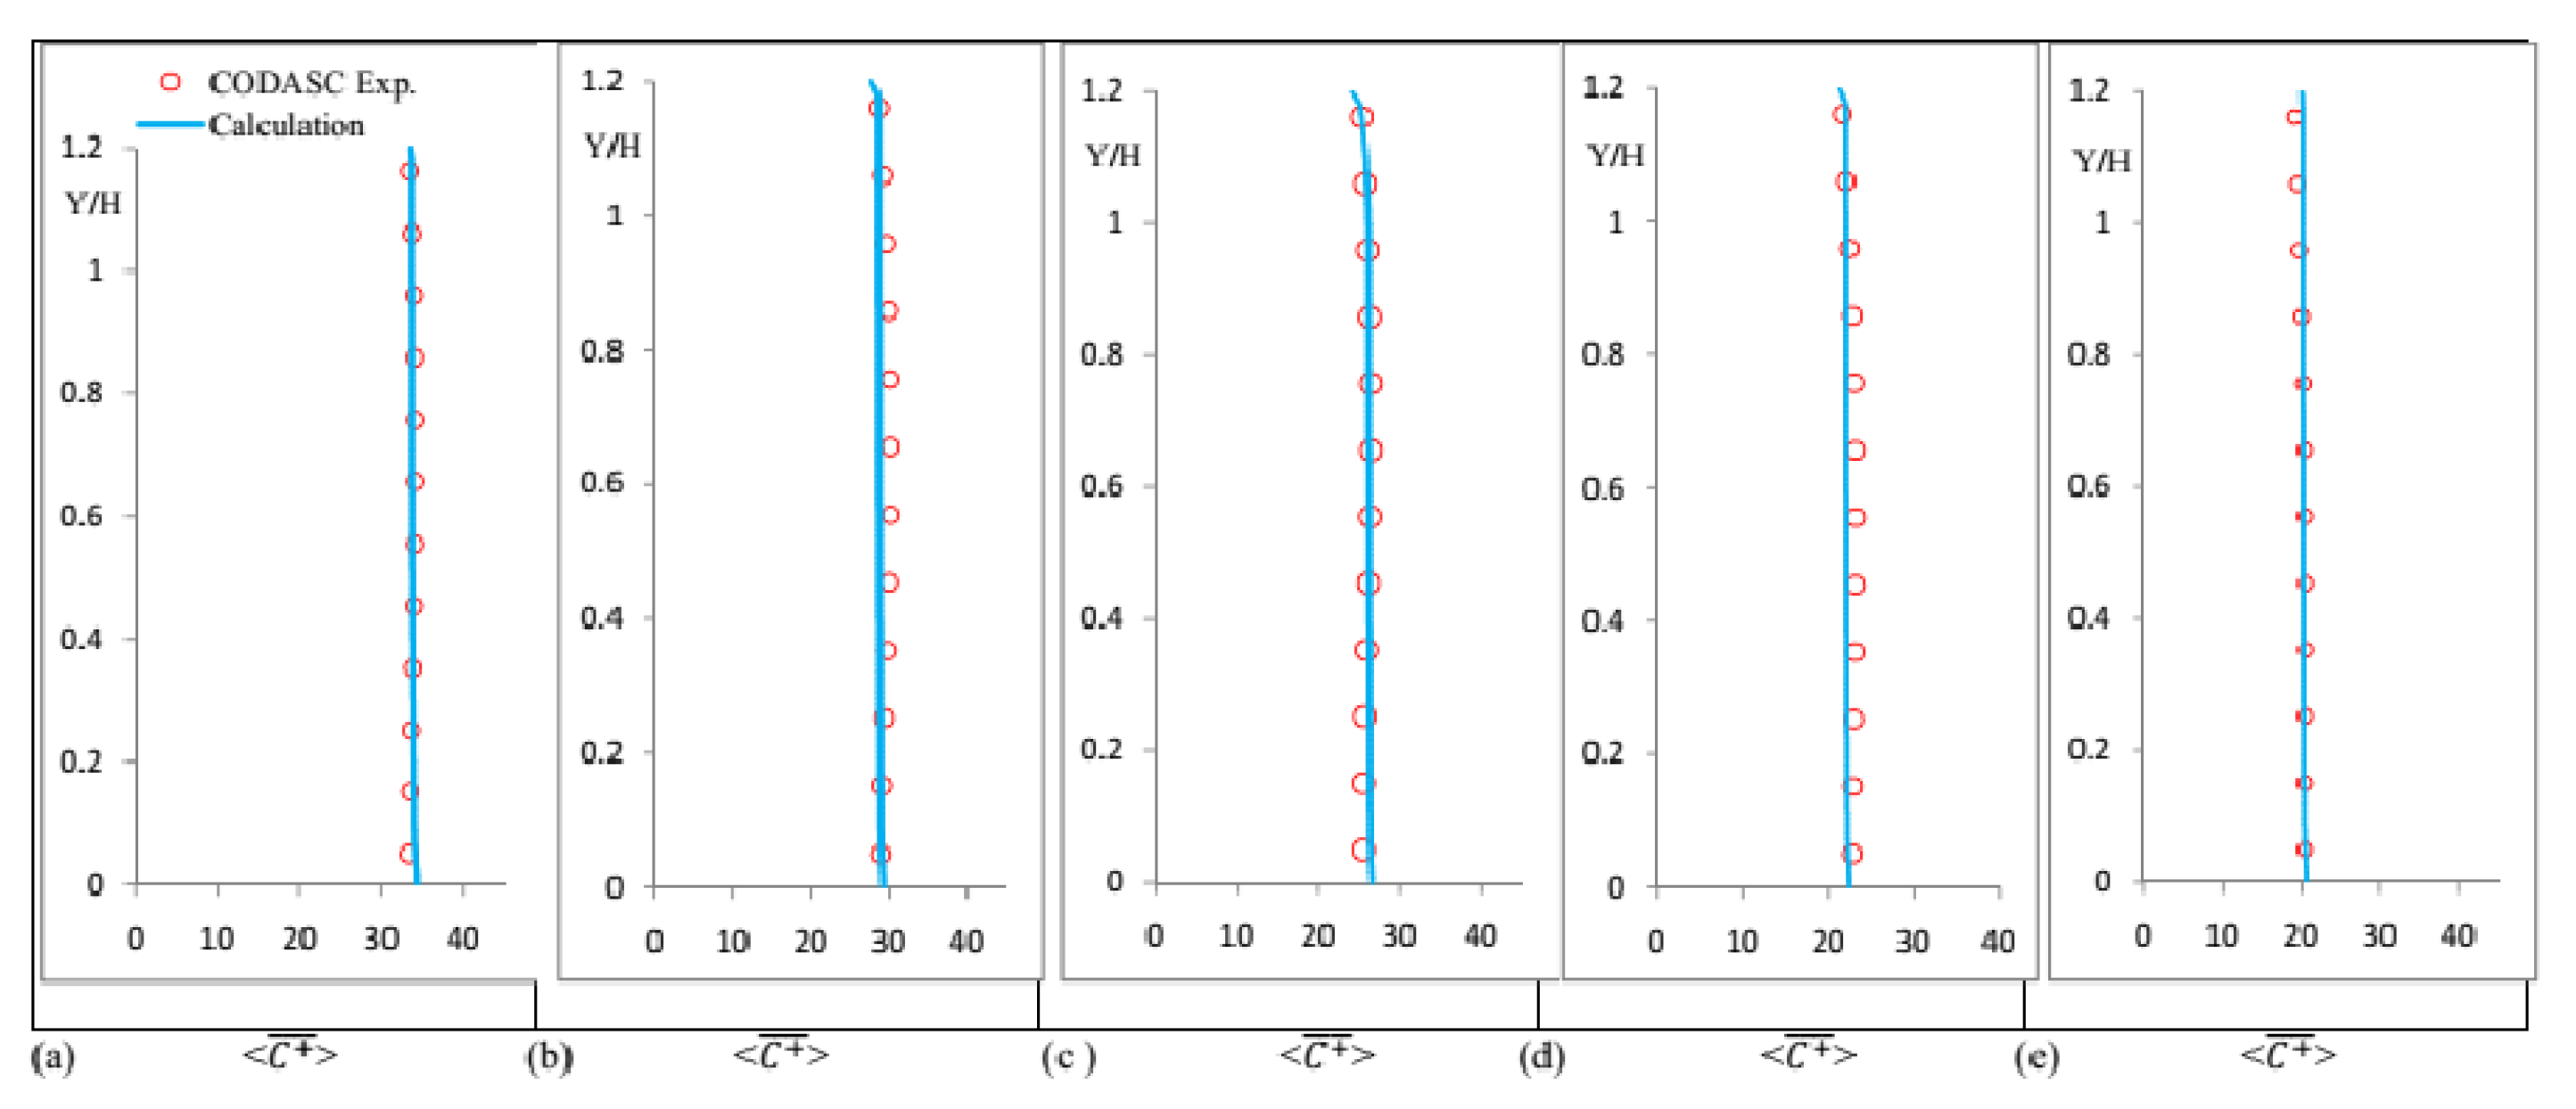
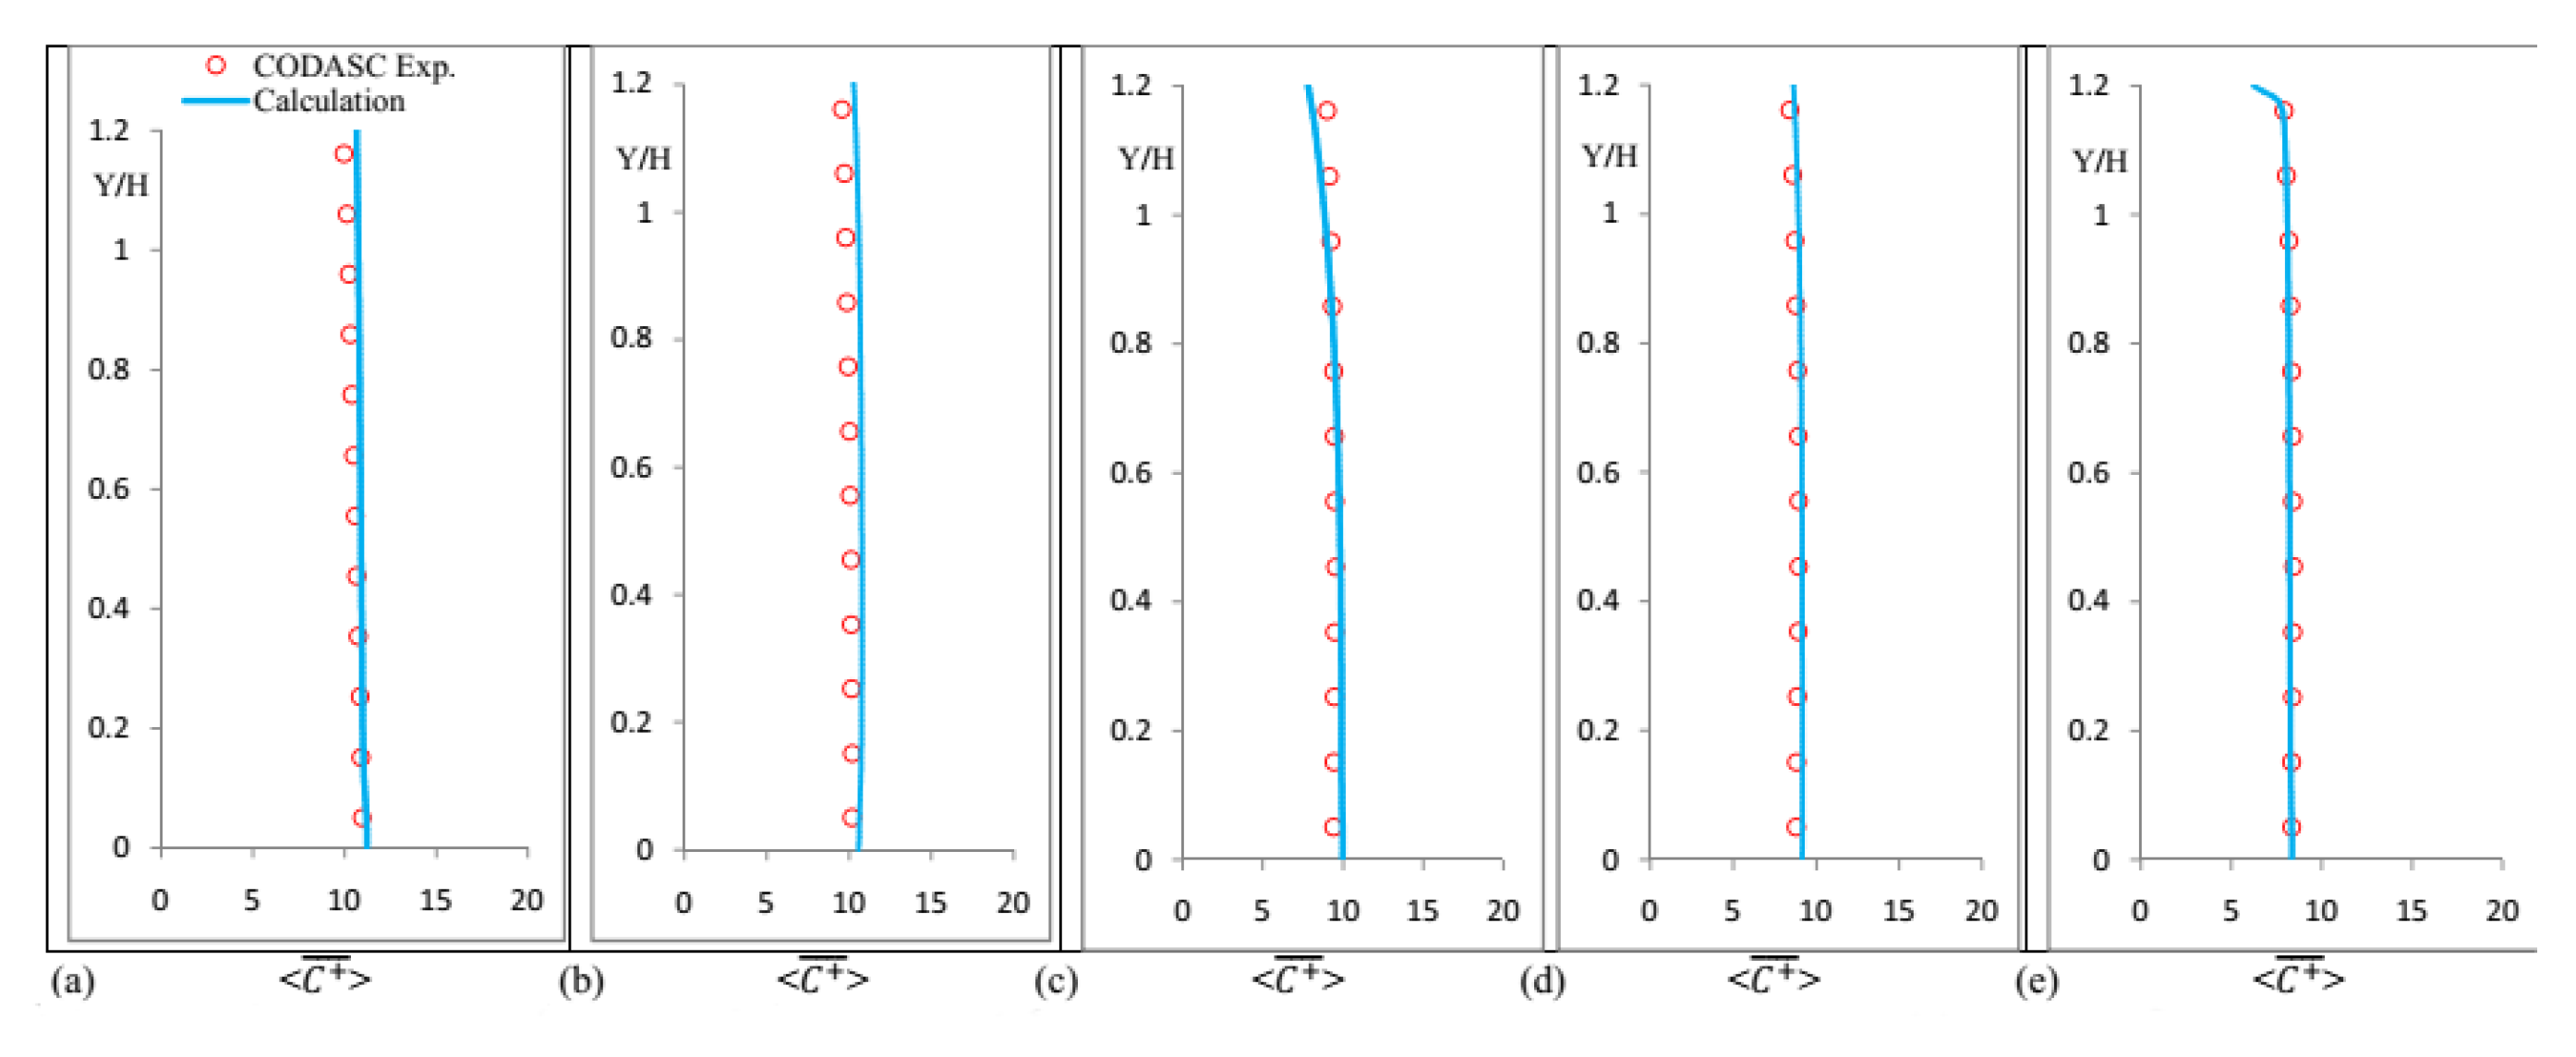
3.4. Model Validation and Grid Independence
4. Simulated Results
4.1. Case Studies on the Street Geometries
4.1.1. Case Study I: Influence of Single Street
4.1.2. Case Study II: Impact of Double-Crossed Streets
4.1.3. Case Study III: Effect of Multiple Irregular Streets
4.2. Impact of Wind Velocity and Direction
4.2.1. Effect of Wind Direction and Seasonal Cycle
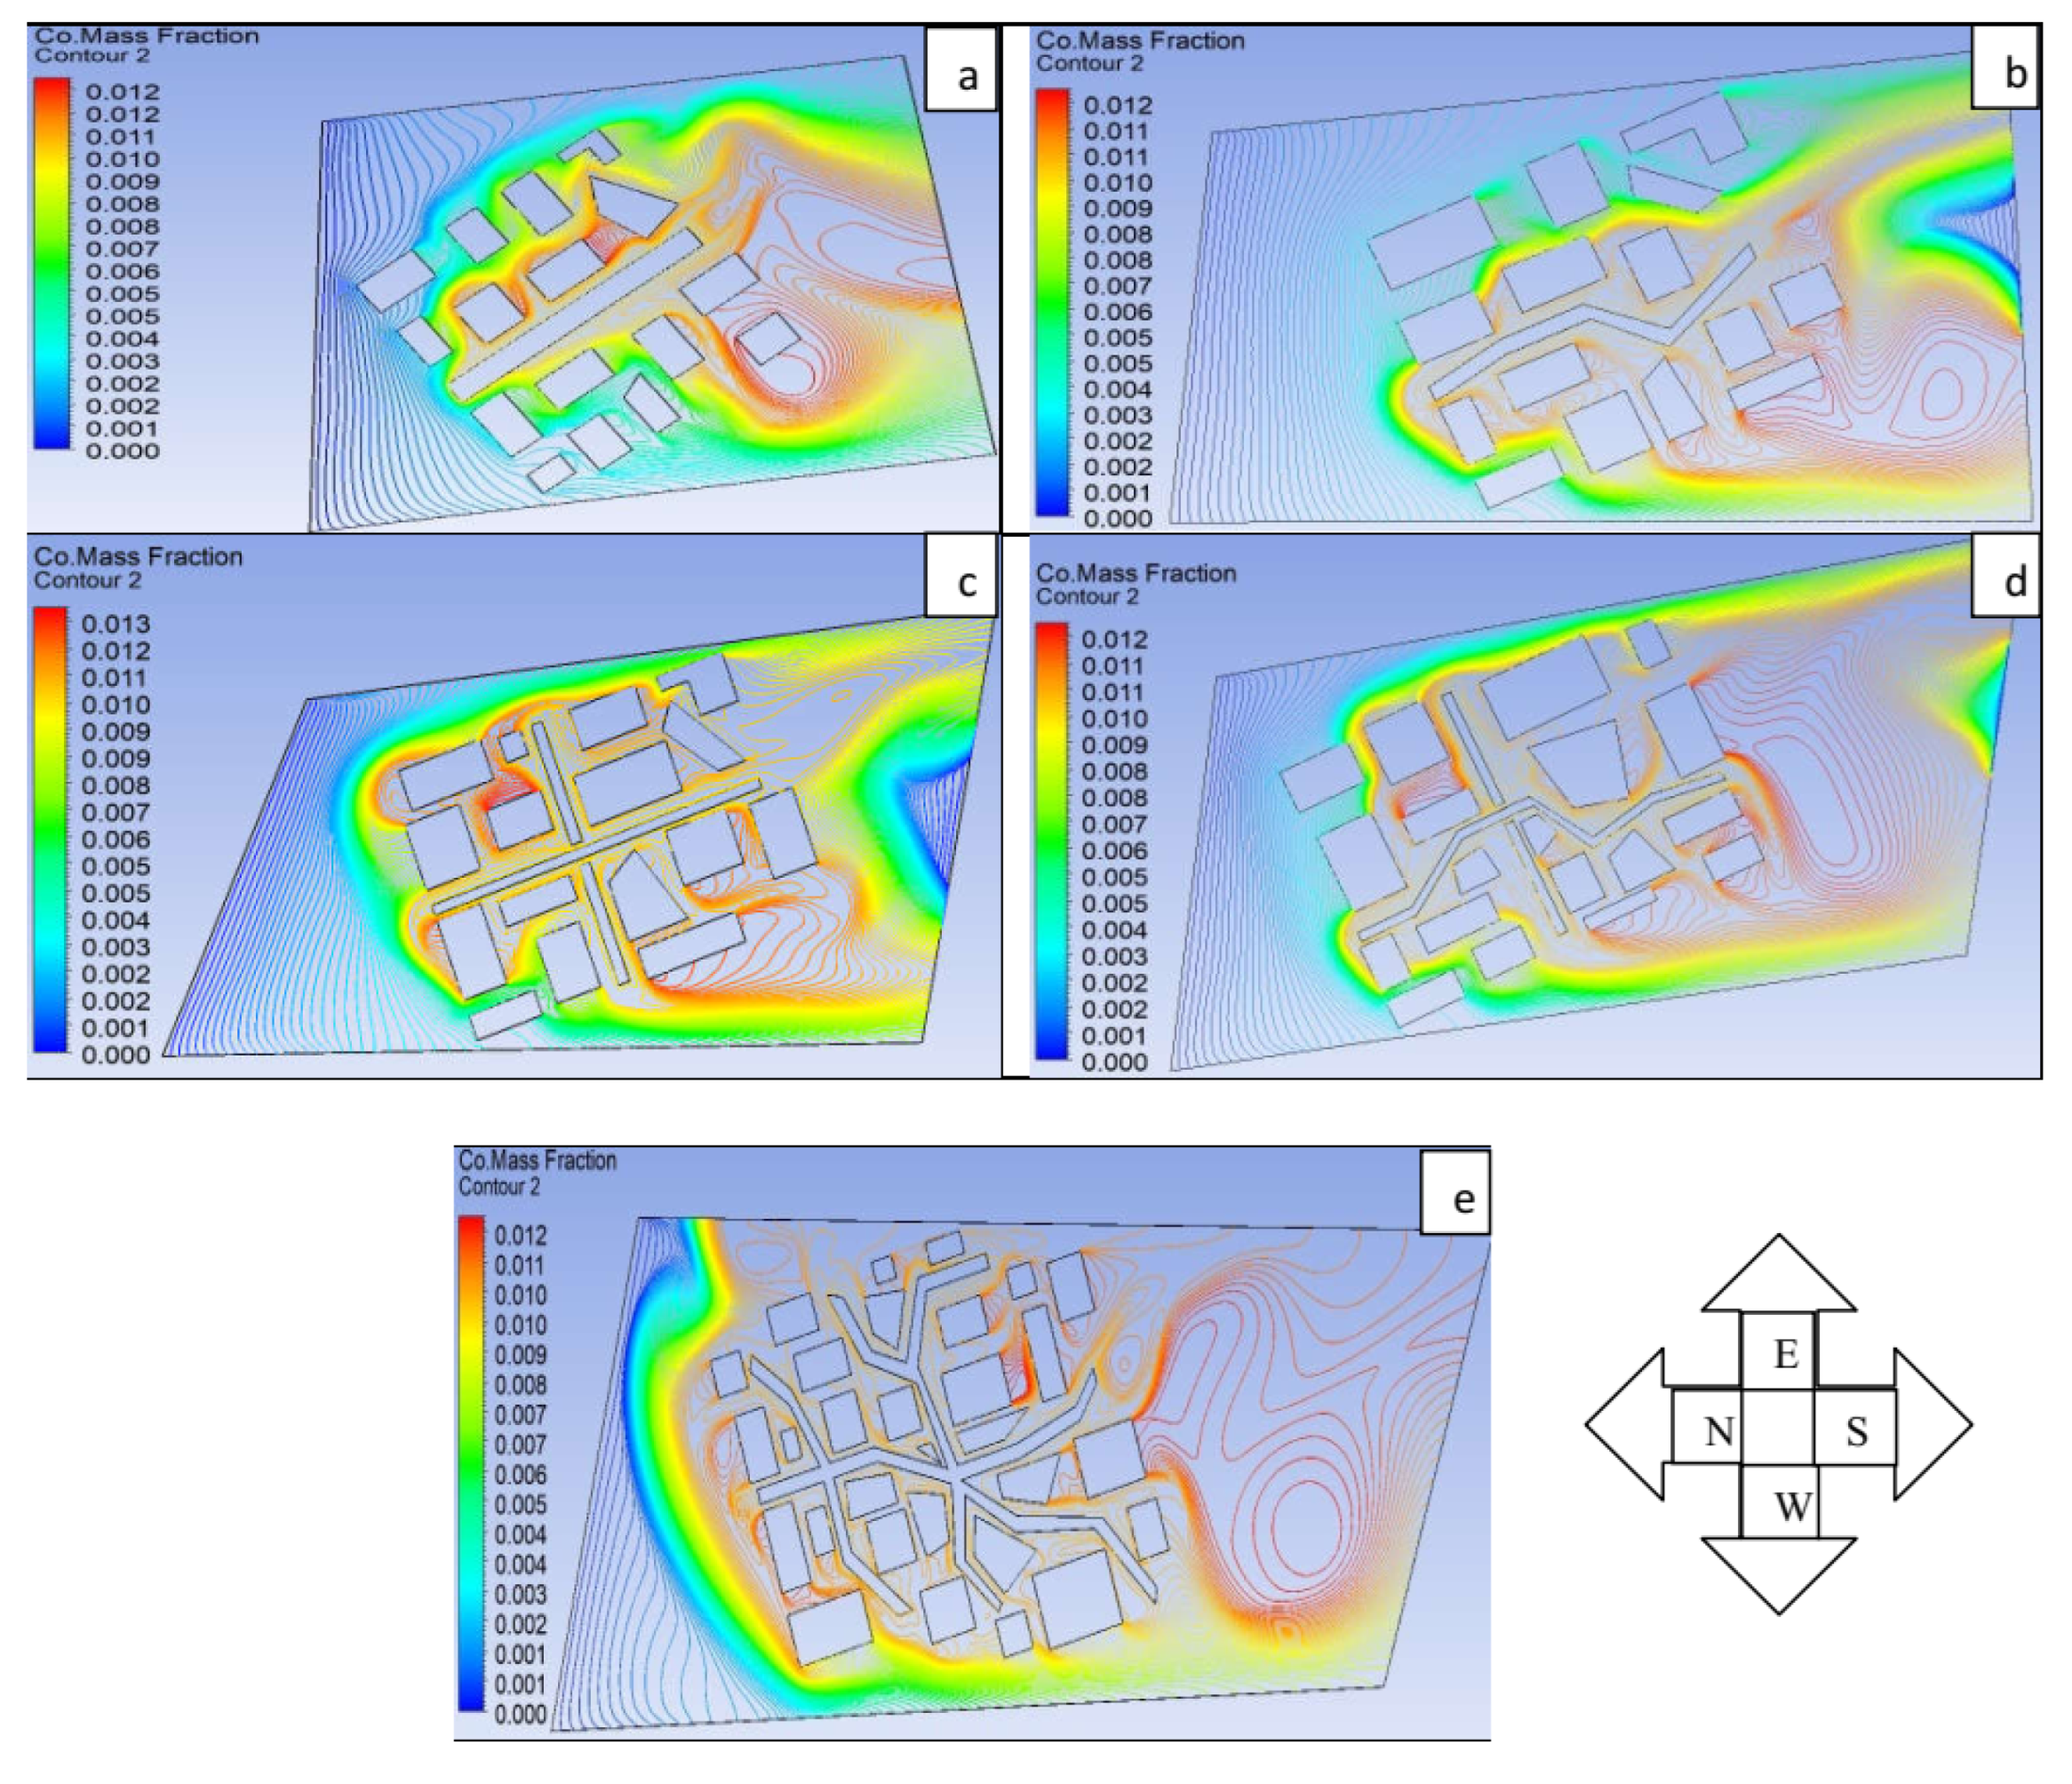
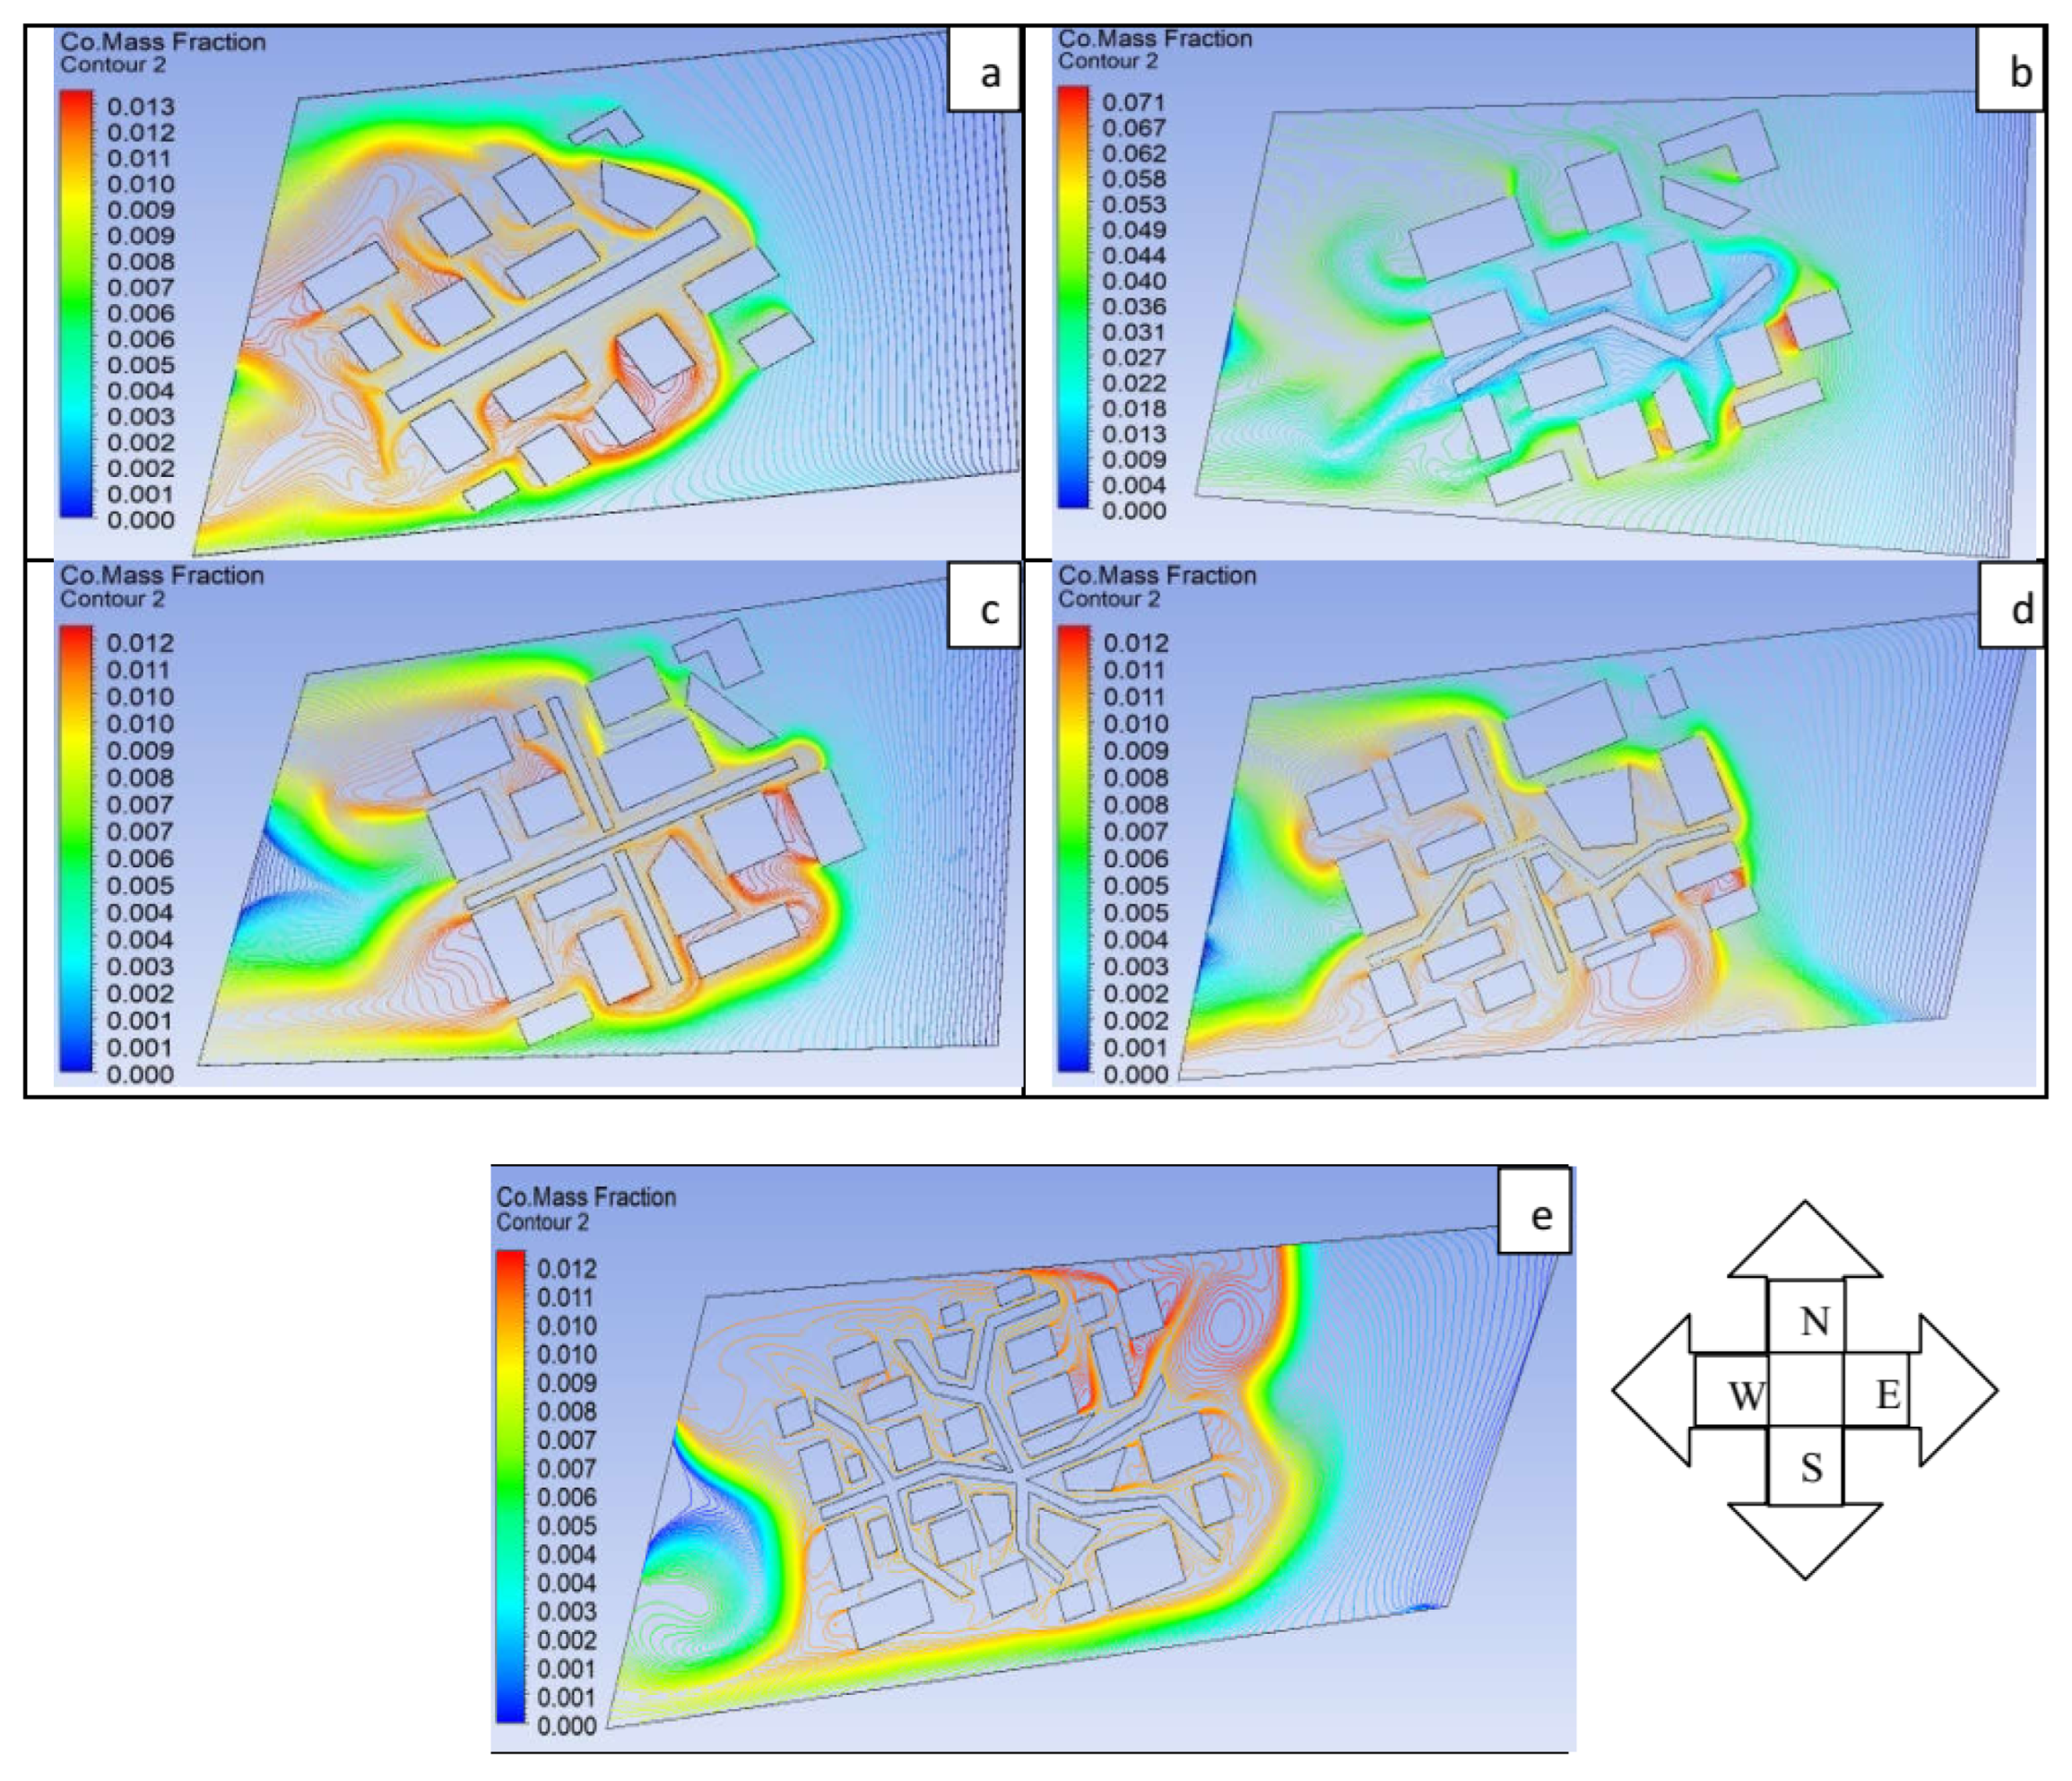
4.2.2. Influence of Wind Direction in CO Mass Fraction Distribution
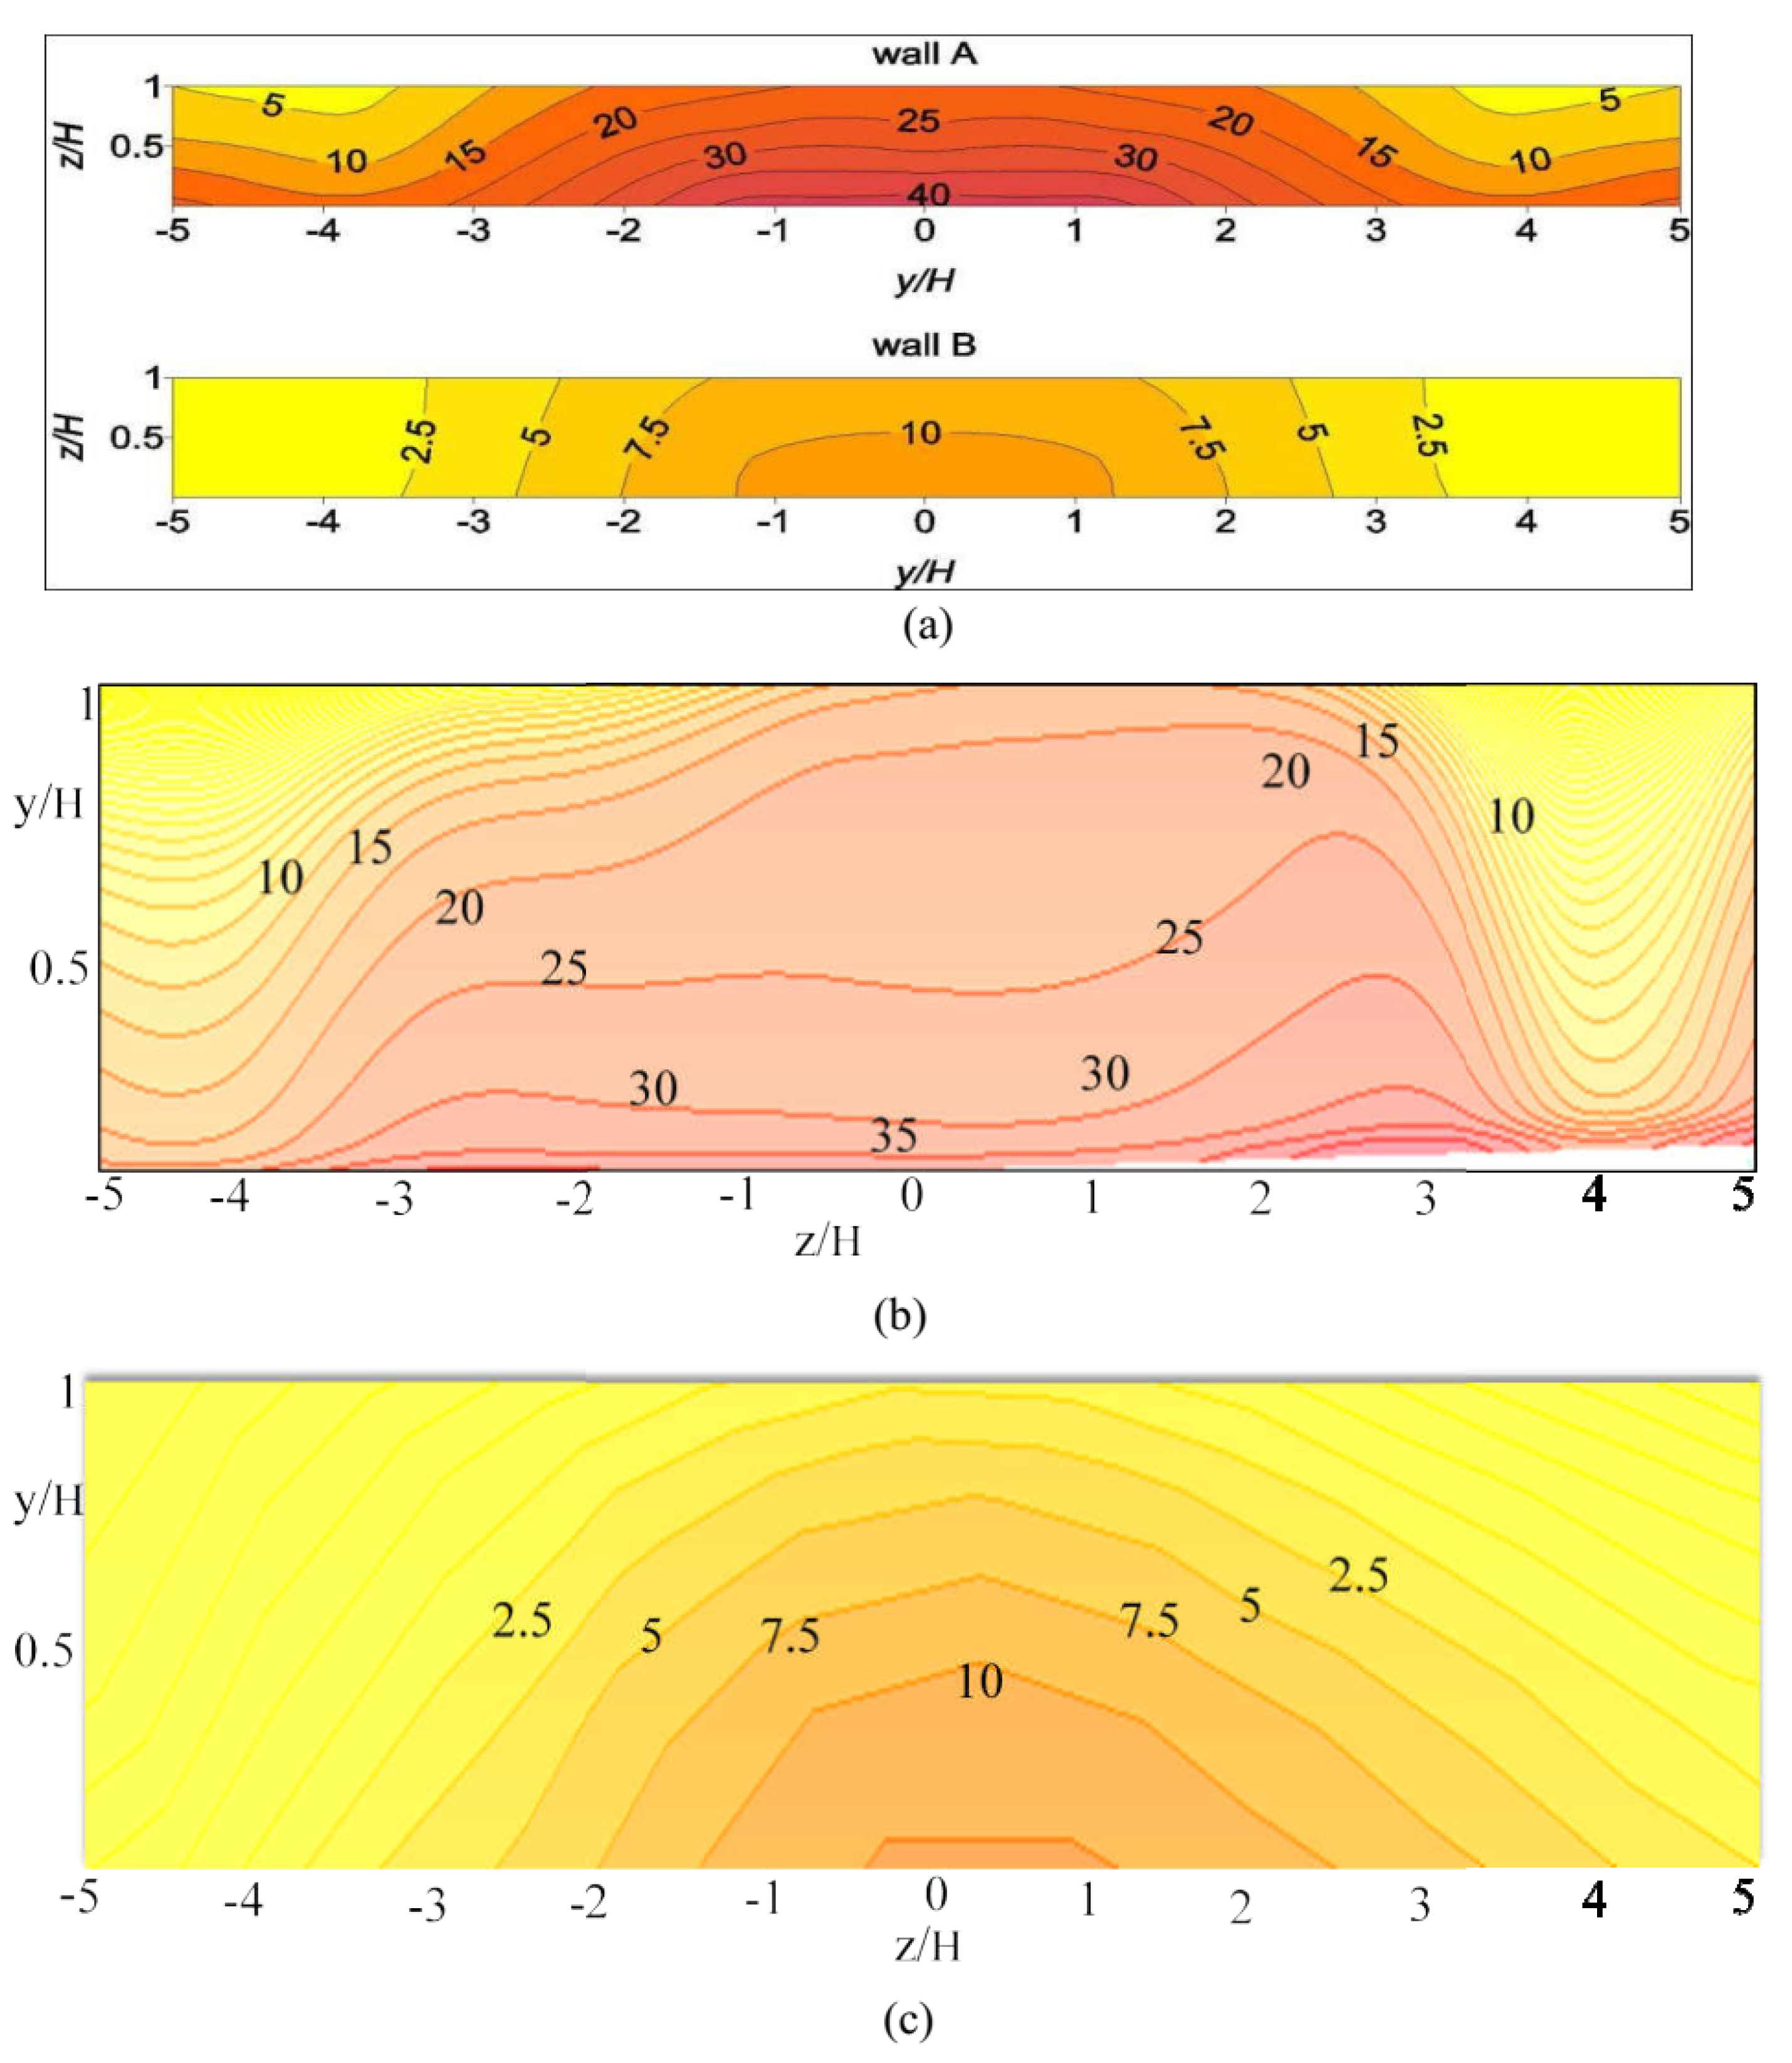
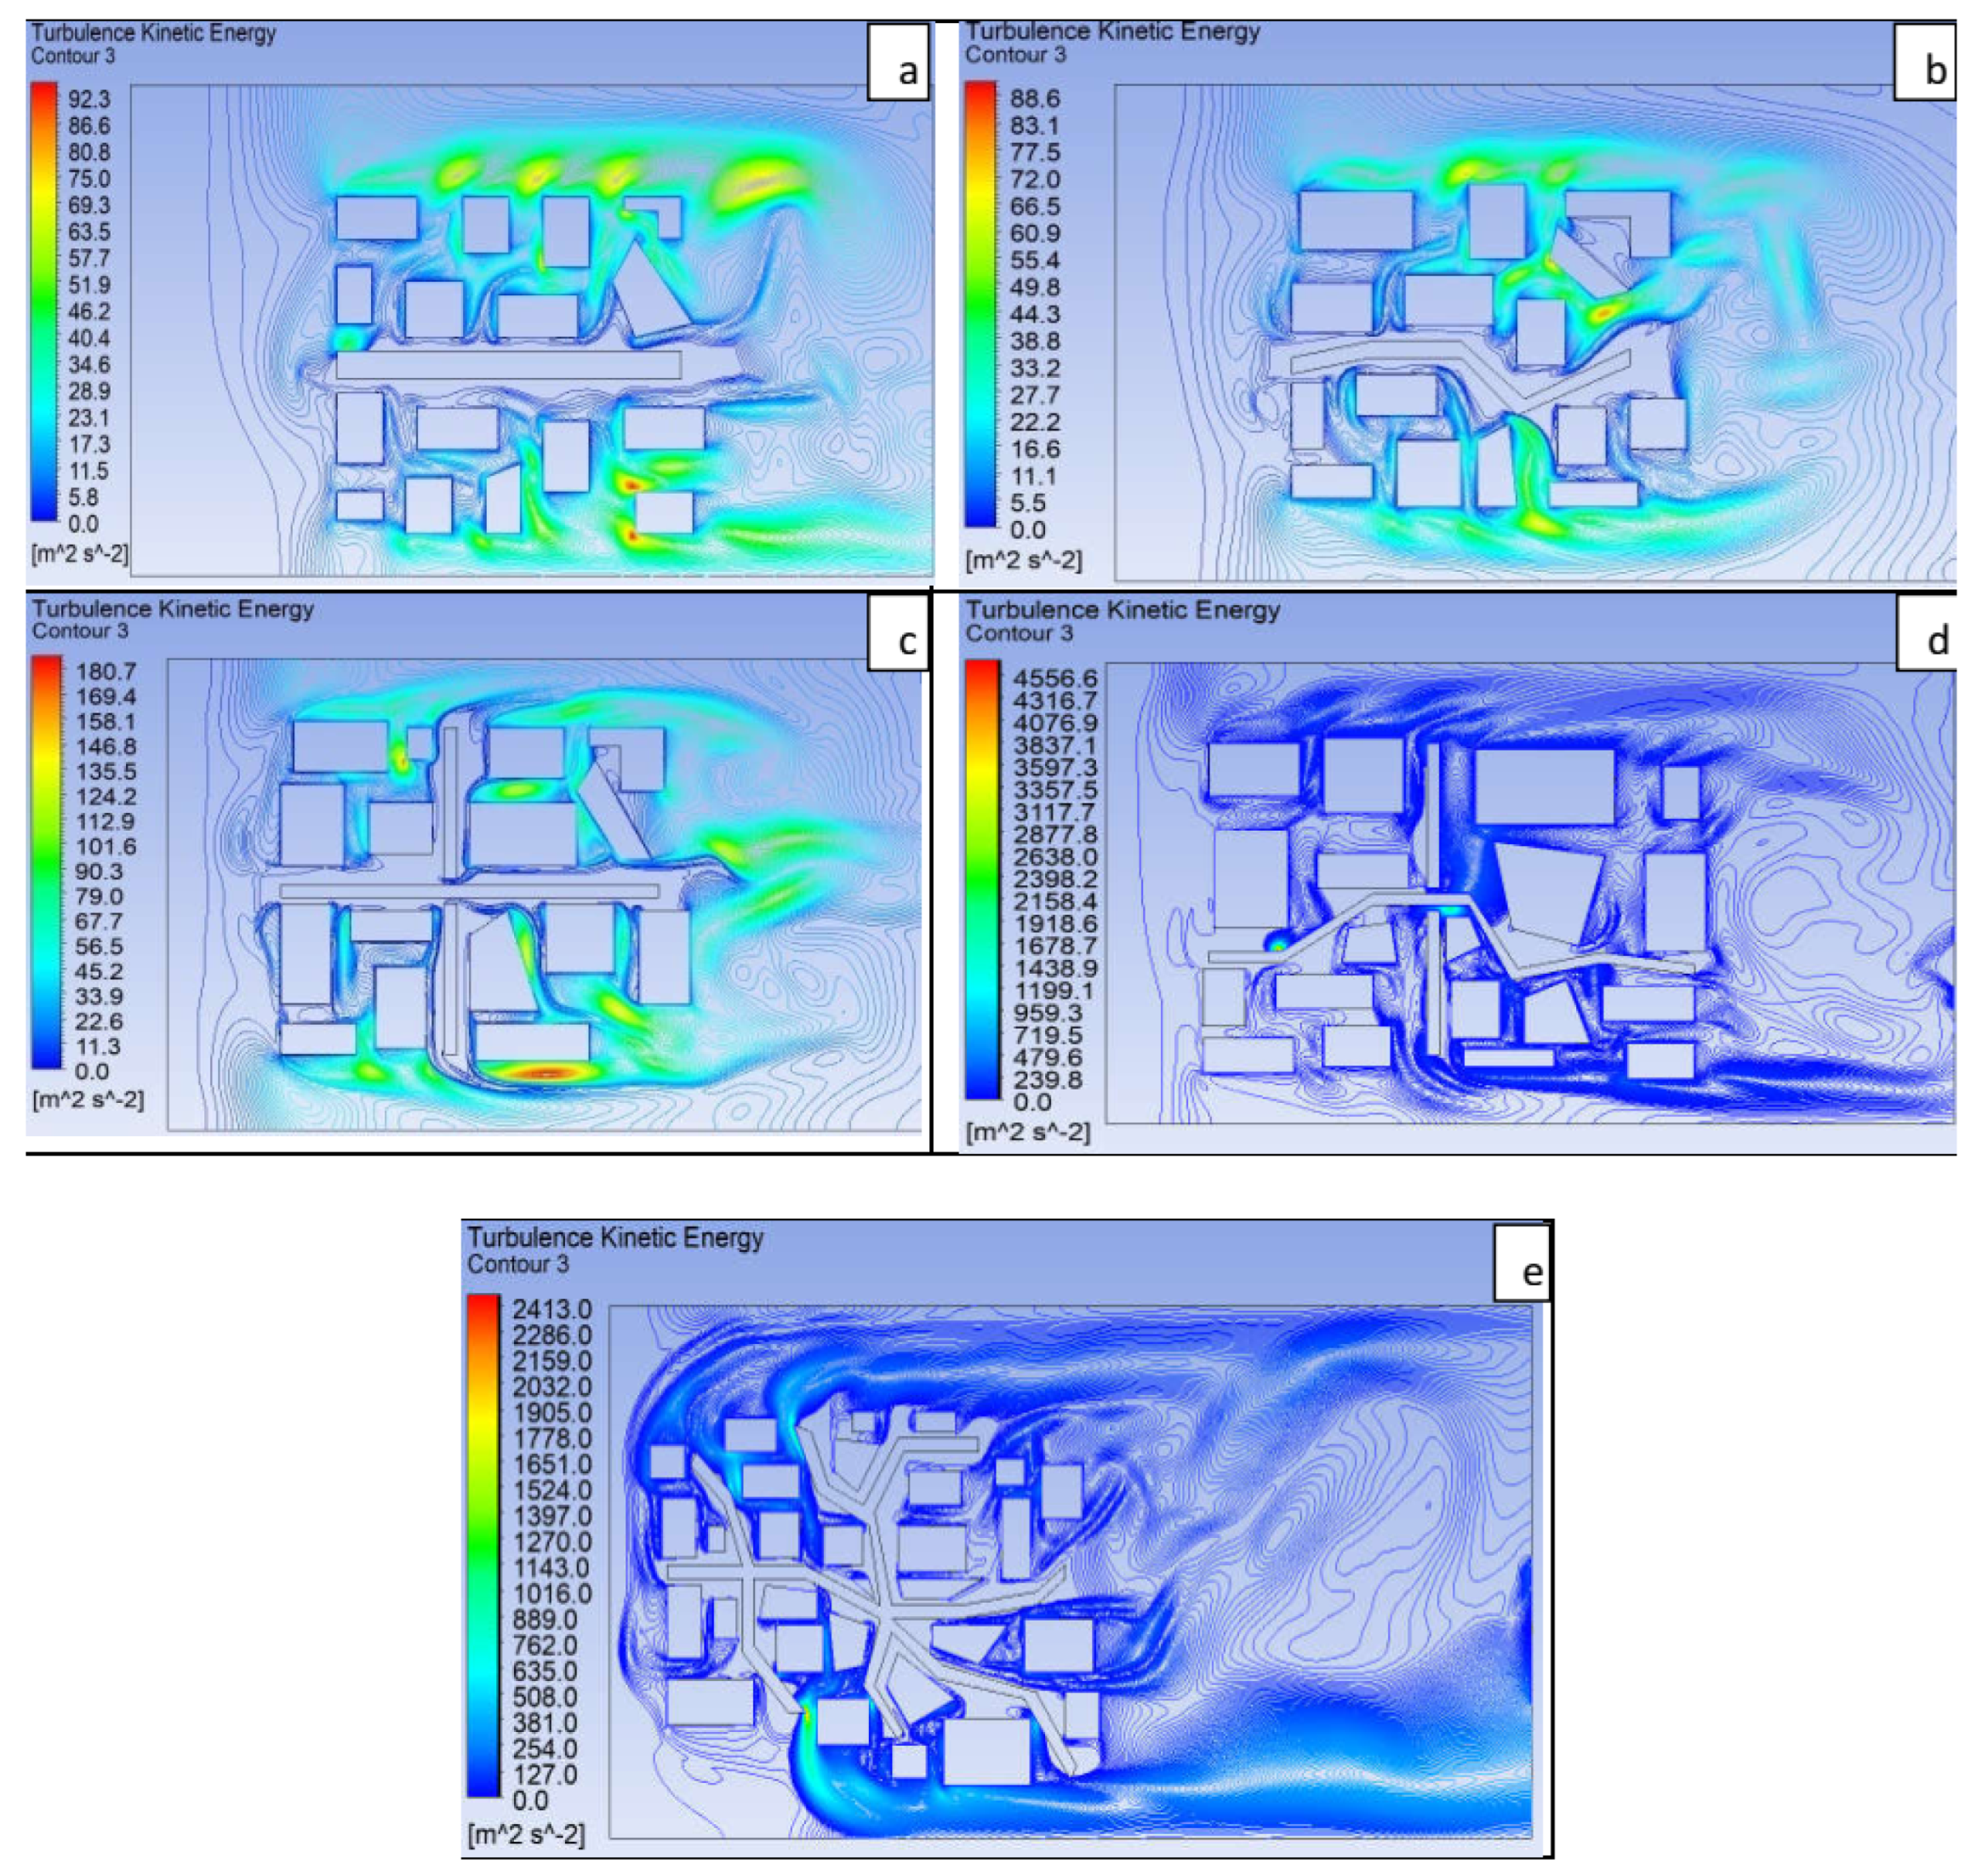
4.3. Effect of Street Dimensions on Turbulent Kinetic Energy
5. Discussion of the Results
5.1. Purpose of Five Different Street Geometries and Major Findings
5.1.1. Single Regular Street
5.1.2. Single Irregular Street
5.1.3. Double Regular Street
5.1.4. Double Irregular Street
5.1.5. Multi-Irregular Street
5.2. Consideration of RANS over LES
5.3. Ability of the Present Model as a Generic Model
5.4. Limitations of the Study and Future Plan
6. Conclusions
- A single regular street creates fewer obstacles to the wind, and therefore, the inhabitants residing in close proximity are exposed to the highest concentration of pollutants from the traffic. The situation remains the same in the winter and summer seasons as well where dwellers near the single regular street experience approximately 50% and 53.84% more concentration of traffic emission compared to other inhabitants living reasonably far from the street. Therefore, more structural obstacles or trees would be required to mitigate the pollutants dispersion as well as a disciplined traffic system.
- A single irregular street reduces the exposure rate for the inhabitants near the street due to the existence of corners and obstacles by around 20%; however, the inhabitants near the east region still experience the most air pollutants. This suffering augments increasingly in the summer season when the wind blows from the southeast region. The density of traffic-generated pollutants increases by 491.66%, which is an alarming finding.
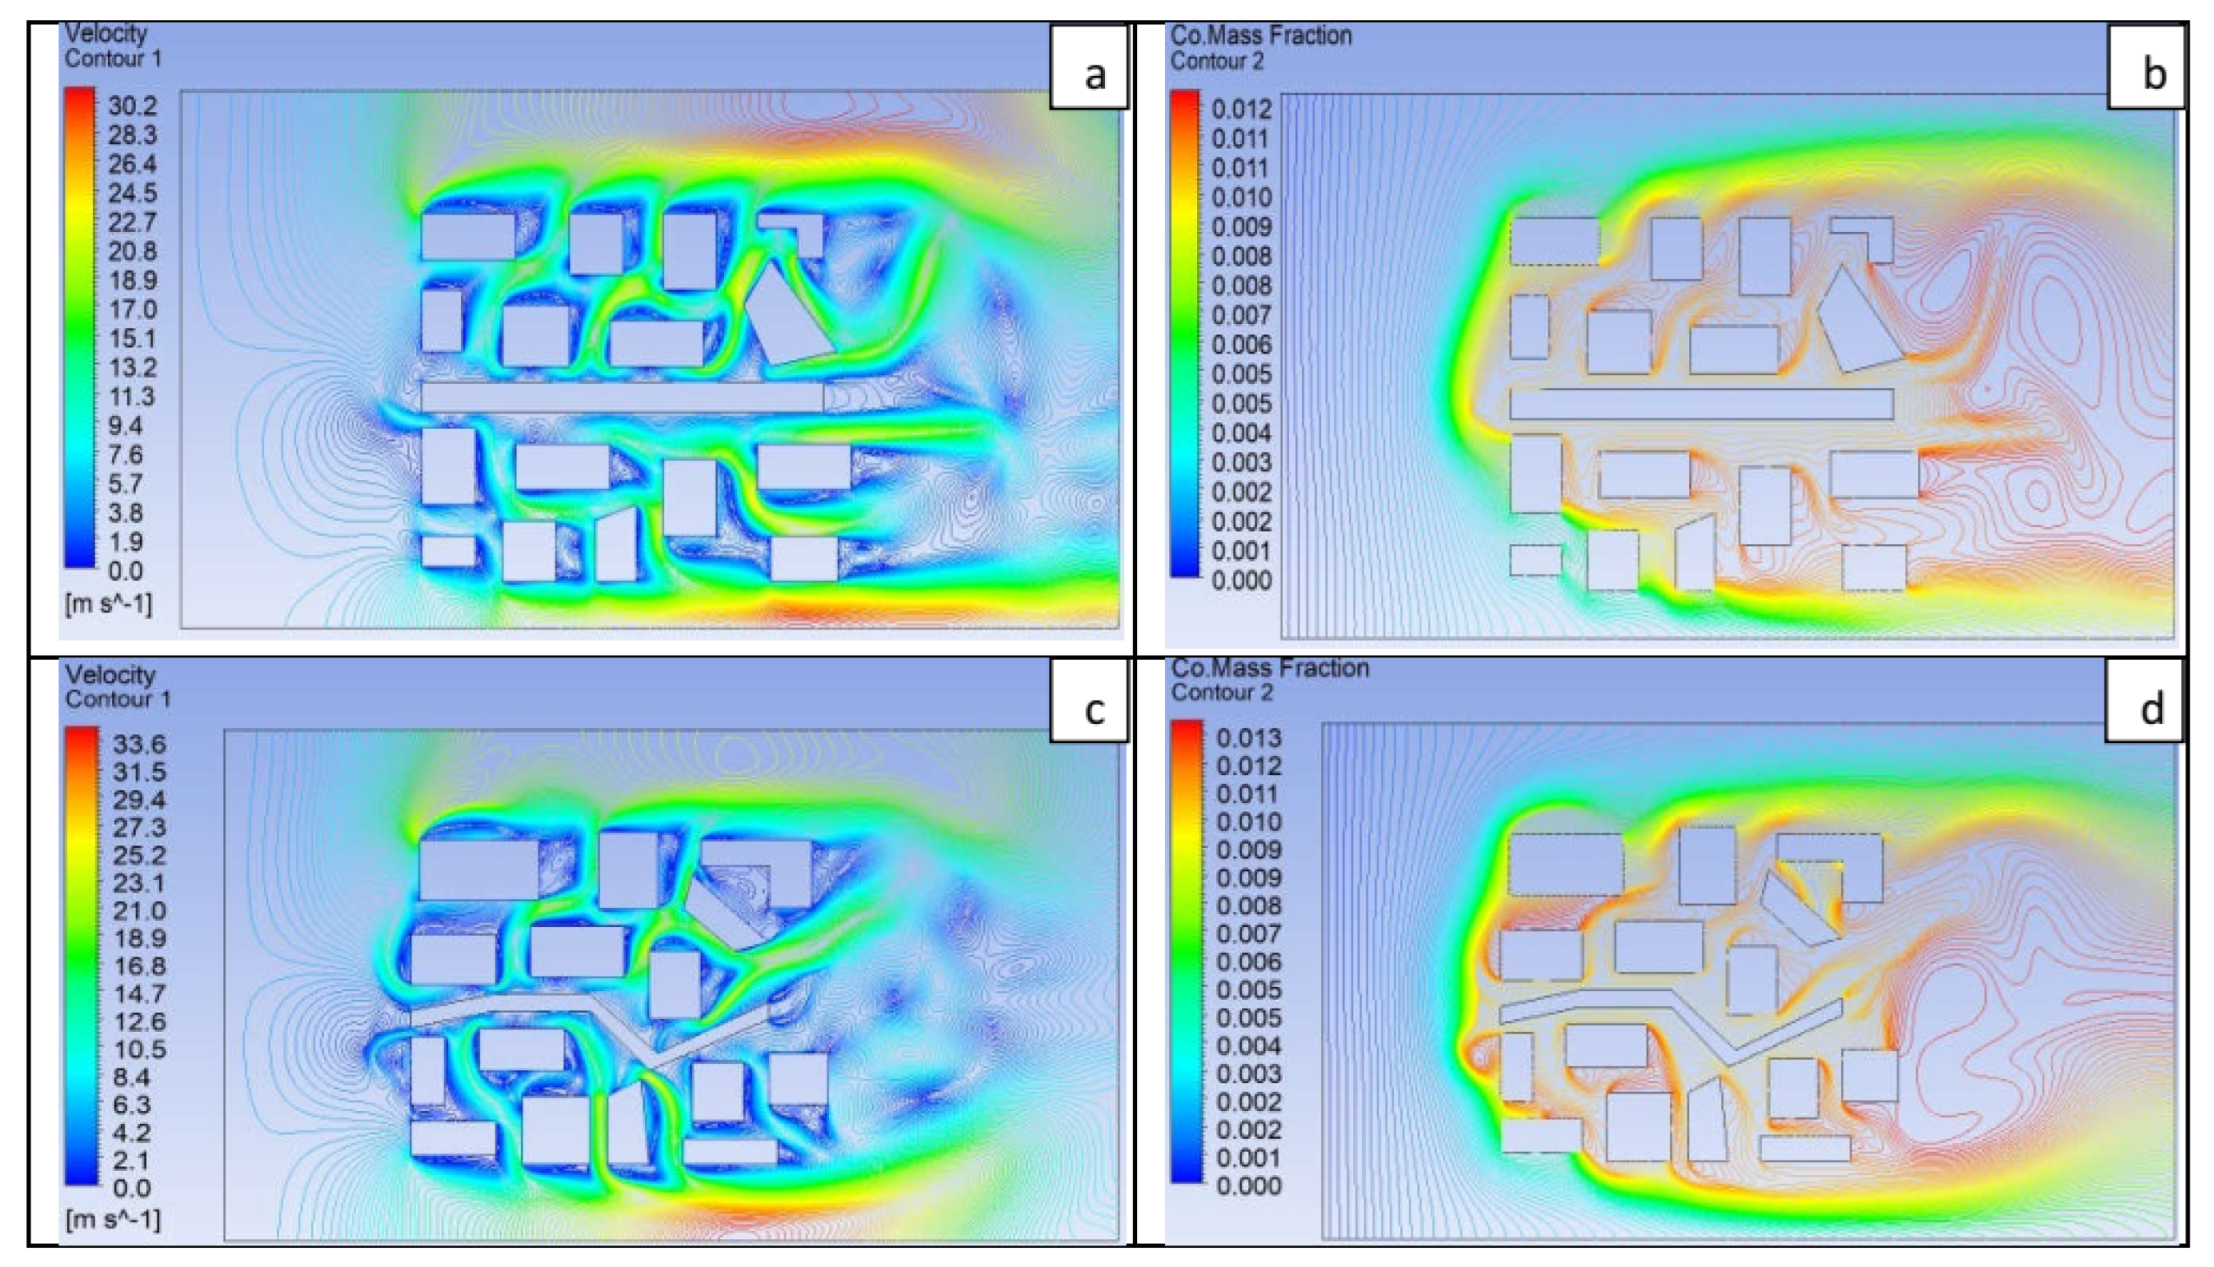
- A double regular streets canyon works well considerably to disperse pollutants. However, due to low wind velocity as well as much traffic in the cross-section region, the pollutants concentration was almost 10% higher than that of other parts of the canyon.
- Double irregular streets considerably reduced the pollutants concentration by approximately 8.33% in the mid-section due to the increased hindrance. However, the inhabitants near the east region still remain the worst victims with at least 10% more exposure to the CO mass fraction compared to that of inhabitants in other regions. This could also be linked with the fact that double irregular streets exhibited the most turbulence kinetic energy, which was at least more than that of the multiple irregular streets.
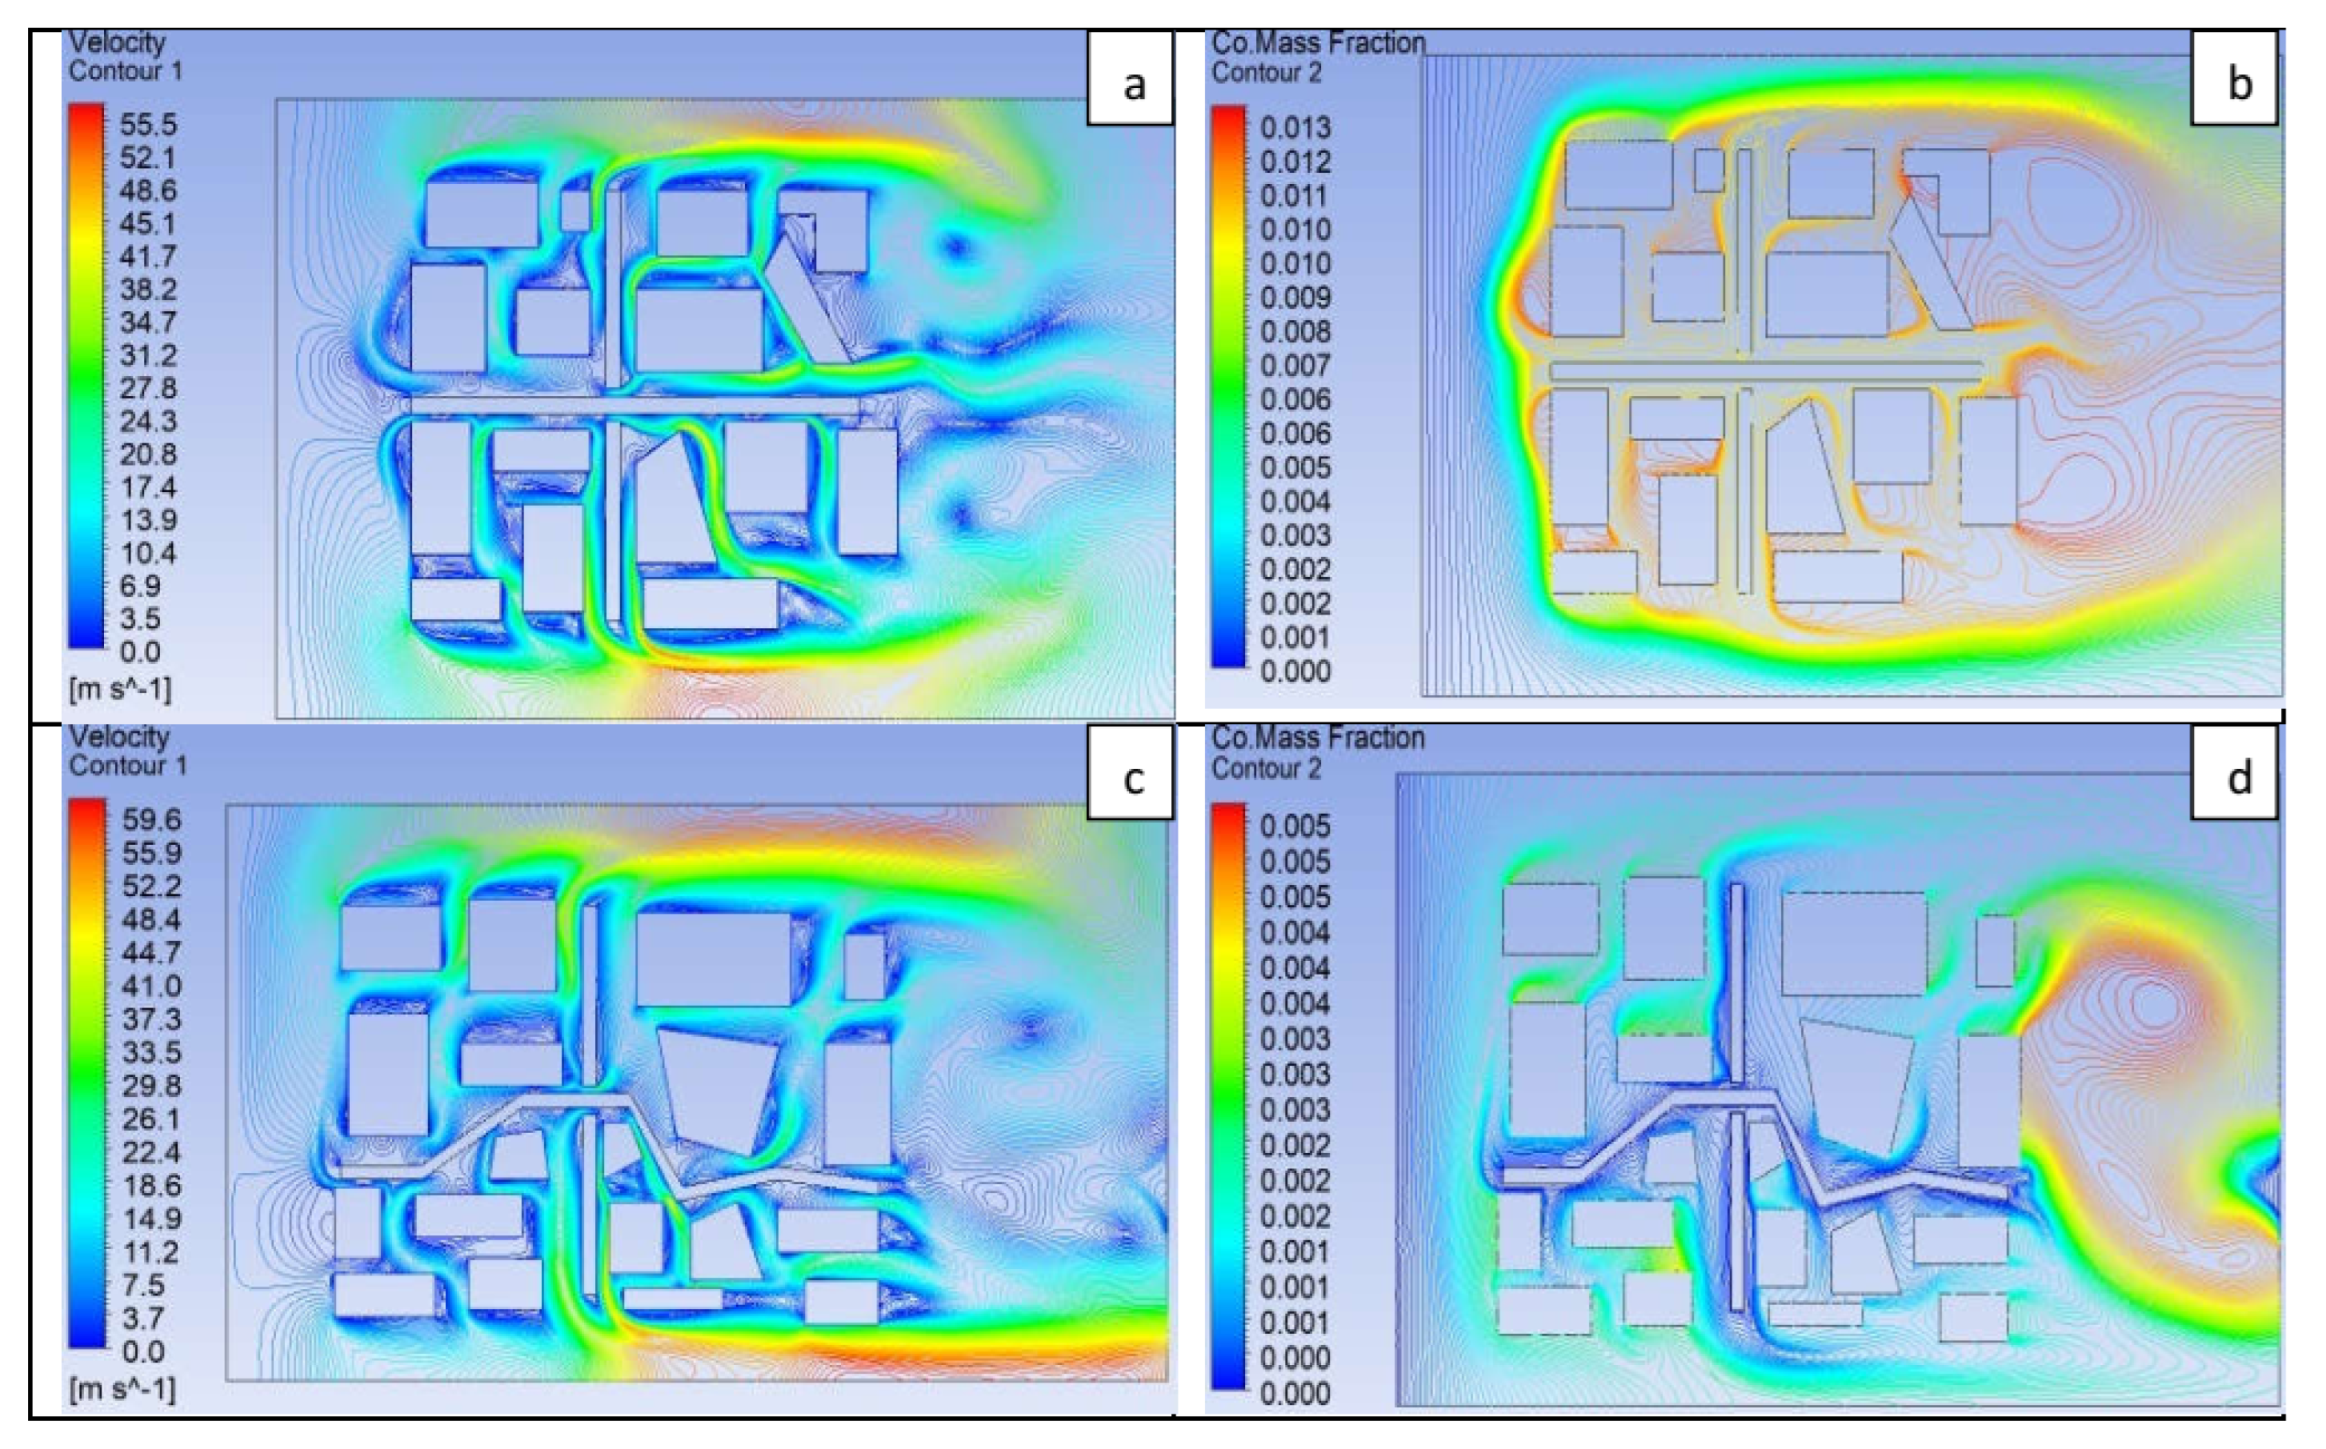
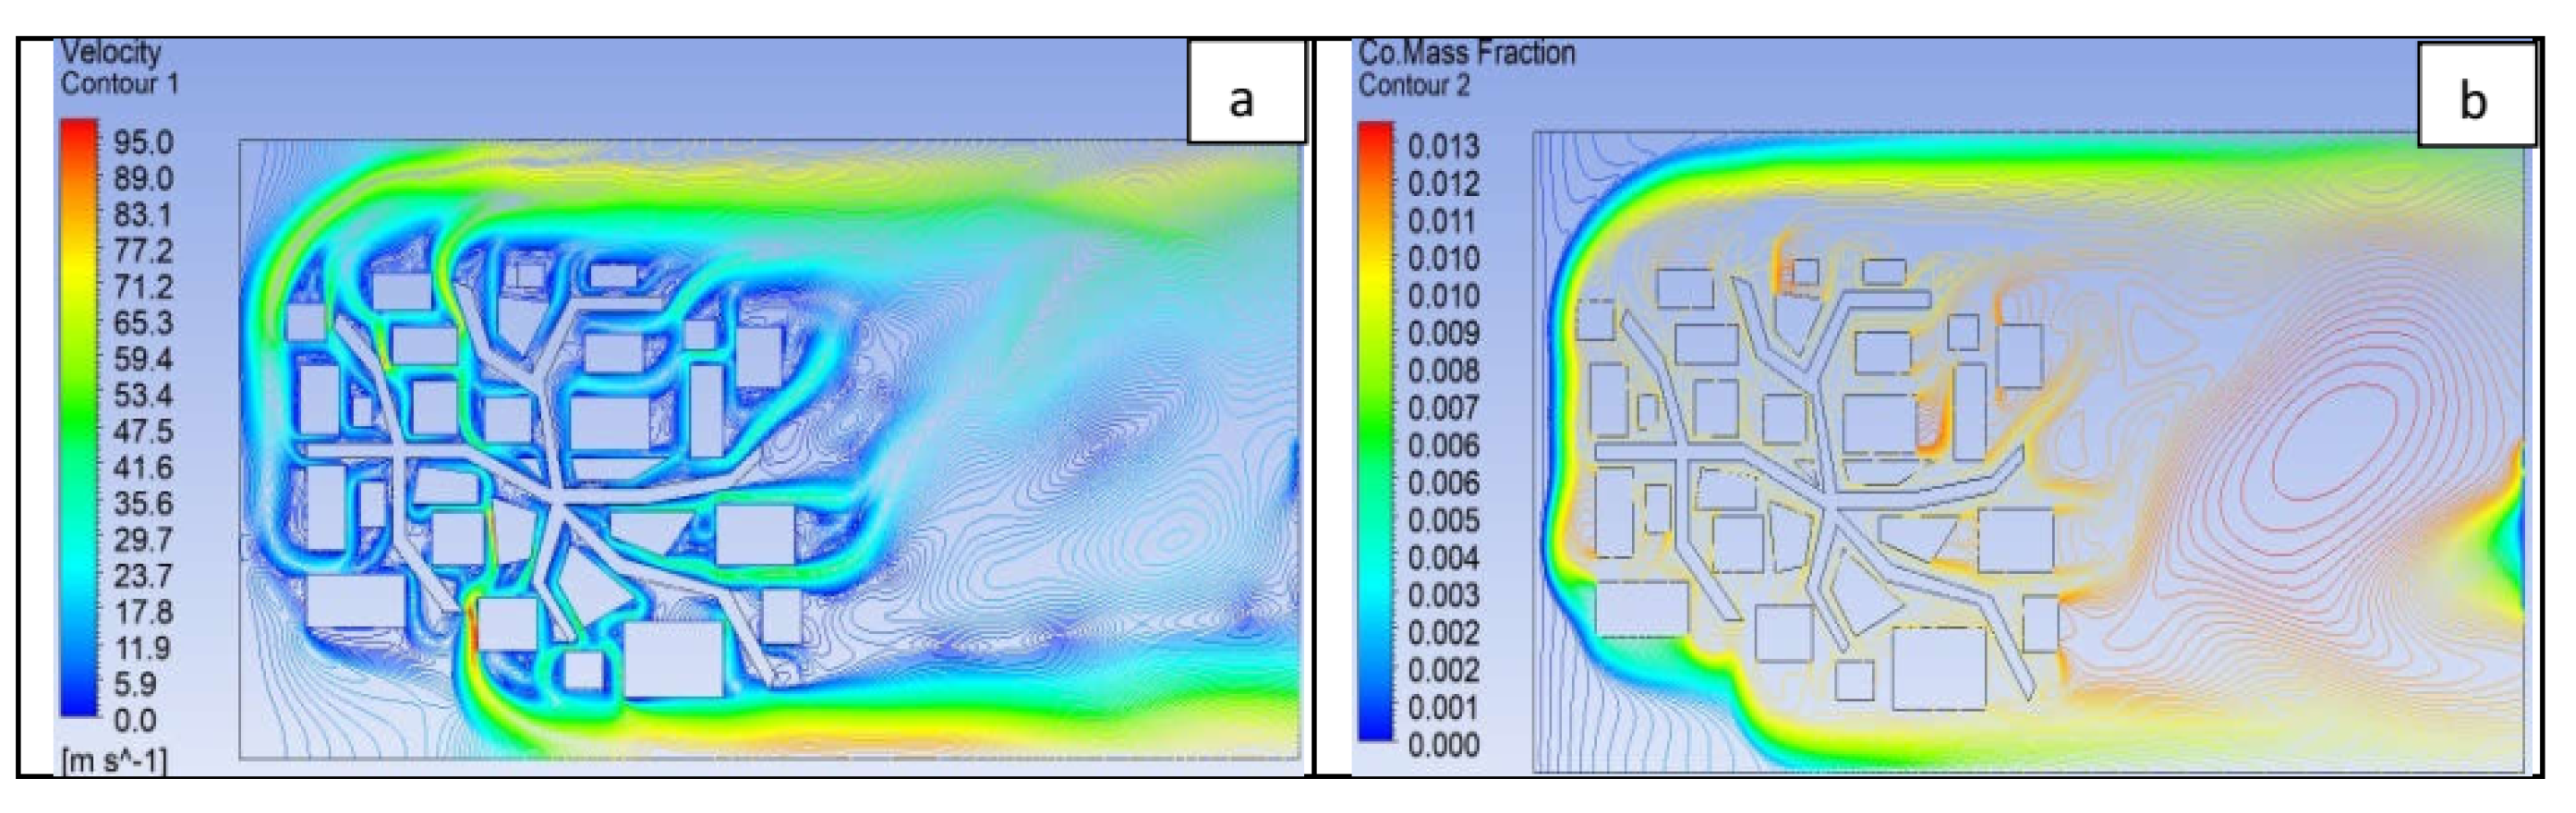
- Multi-irregular streets behave as traps of pollutants due to the frequent changing of the wind-flowing directions. The inhabitants near the irregular streets are in more danger—by about 11.25%—compared to that of the far inhabitants.
- Multi-irregular streets create the most obstacles for the wind, leading to approximately 30% more vorticities in the free space compared to a double irregular street.
Author Contributions
Funding
Institutional Review Board Statement
Informed Consent Statement
Data Availability Statement
Acknowledgments
Conflicts of Interest
References
- Lauriks, T.; Longo, R.; Baetens, D.; Derudi, M.; Parente, A.; Bellemans, A.; Van Beeck, J.; Denys, S. Application of improved CFD modeling for prediction and mitigation of traffic-related air pollution hotspots in a realistic urban street. Atmos. Environ. 2021, 246, 118127. [Google Scholar] [CrossRef]
- Huang, Y.; Lei, C.; Liu, C.H.; Perez, P.; Forehead, H.; Kong, S.; Zhou, J.L. A review of strategies for mitigating roadside air pollution in urban street canyons. Environ. Pollut. 2021, 280, 116971. [Google Scholar] [CrossRef] [PubMed]
- Zheng, X.; Montazeri, H.; Blocken, B. Large-eddy simulation of pollutant dispersion in generic urban street canyons: Guidelines for domain size. J. Wind Eng. Indust. Aerodyn. 2021, 211, 104527. [Google Scholar] [CrossRef]
- Nations, U. World Urbanization Prospects; United Nations: San Francisco, CA, USA, 2014. [Google Scholar]
- World Health Organization. WHO Global Air Quality Guidelines: Particulate Matter (PM2. 5 and PM10), Ozone, Nitrogen Dioxide, Sulfur Dioxide and Carbon Monoxide; World Health Organization: Geneva, Switzerland, 2021.
- Shami, S.; Ranjgar, B.; Bian, J.; Khoshlahjeh Azar, M.; Moghimi, A.; Amani, M.; Naboureh, A. Trends of CO and NO2 Pollutants in Iran during COVID-19 Pandemic Using Timeseries Sentinel-5 Images in Google Earth Engine. Pollutants 2022, 2, 156–171. [Google Scholar] [CrossRef]
- Karagulian, F.; Belis, C.A.; Dora, C.F.C.; Prüss-Ustün, A.M.; Bonjour, S.; Adair-Rohani, H.; Amann, M. Contributions to cities’ ambient particulate matter (PM): A systematic review of local source contributions at global level. Atmos. Environ. 2015, 120, 475–483. [Google Scholar] [CrossRef]
- Longo, R.; Nicastro, P.; Natalini, M.; Schito, P.; Mereu, R.; Parente, A. Impact of urban environment on Savonius wind turbine performance: A numerical perspective. Ren. Energy 2020, 156, 407–422. [Google Scholar] [CrossRef]
- Anenberg, S.C.; Achakulwisut, P.; Brauer, M.; Moran, D.; Apte, J.S.; Henze, D.K. Particulate matter-attributable mortality and relationships with carbon dioxide in 250 urban areas worldwide. Sci. Rep. 2019, 9, 11552. [Google Scholar] [CrossRef] [Green Version]
- Orellano, P.; Reynoso, J.; Quaranta, N.; Bardach, A.; Ciapponi, A. Short-term exposure to particulate matter (PM10 and PM2.5), nitrogen dioxide (NO2), and ozone (O3) and all-cause and cause-specific mortality: Systematic review and meta-analysis. Environ. Int. 2020, 142, 105876. [Google Scholar] [CrossRef]
- Hachem, M.; Saleh, N.; Bensefa-Colas, L.; Momas, I. Determinants of ultrafine particles, black carbon, nitrogen dioxide, and carbon monoxide concentrations inside vehicles in the Paris area: PUF-TAXI study. Indoor Air 2021, 31, 848–859. [Google Scholar] [CrossRef]
- Anwar, M.N.; Shabbir, M.; Tahir, E.; Iftikhar, M.; Saif, H.; Tahir, A.; Murtaza, M.A.; Khokhar, M.F.; Rehan, M.; Aghbashlo, M.; et al. Emerging challenges of air pollution and particulate matter in China, India, and Pakistan and mitigating solutions. J. Haz. Mat. 2021, 416, 125851. [Google Scholar] [CrossRef]
- Bodor, M.; Ceoromila, A.; Bașliu, V. Morphological and Chemical Characterization of Particulate Matter from an Indoor Measuring Campaign. Sustainability 2022, 14, 11621. [Google Scholar] [CrossRef]
- Sekula, P.; Ustrnul, Z.; Bokwa, A.; Bochenek, B.; Zimnoch, M. Random Forests Assessment of the Role of Atmospheric Circulation in PM10 in an Urban Area with Complex Topography. Sustainability 2022, 14, 3388. [Google Scholar] [CrossRef]
- Cui, P.; Dai, C.; Zhang, J.; Li, T. Assessing the Effects of Urban Morphology Parameters on PM2.5 Distribution in Northeast China Based on Gradient Boosted Regression Trees Method. Sustainability 2022, 14, 2618. [Google Scholar] [CrossRef]
- European Environment Agency. Air Quality in Europe—2019 Report; European Environment Agency: Biot, France, 2019.
- Akhter, M.N.; Ali, M.E.; Rahman, M.M.; Hossain, M.N.; Molla, M.M. Simulation of air pollution dispersion in Dhaka city street canyon. AIP Adv. 2021, 11, 065022. [Google Scholar] [CrossRef]
- Zheng, X.; Montazeri, H.; Blocken, B. Impact of building façade geometrical details on pollutant dispersion in street canyons. Build. Environ. 2022, 212, 108746. [Google Scholar] [CrossRef]
- Hassan, S.; Akter, U.H.; Nag, P.; Molla, M.M.; Khan, A.; Hasan, M.F. Large-Eddy Simulation of Airflow and Pollutant Dispersion in a Model Street Canyon Intersection of Dhaka City. Atmosphere 2022, 13, 1028. [Google Scholar] [CrossRef]
- Hassan, S.; Molla, M.M.; Nag, P.; Akhter, N.; Khan, A. Unsteady RANS simulation of wind flow around a building shape obstacle. Build. Simul. 2022, 15, 291–312. [Google Scholar] [CrossRef]
- Tajdaran, S.; Bonatesta, F.; Mason, B.; Morrey, D. Simulation of Traffic-Born Pollutant Dispersion and Personal Exposure Using High-Resolution Computational Fluid Dynamics. Environments 2022, 9, 67. [Google Scholar] [CrossRef]
- Suarez-Bertoa, R.; Selleri, T.; Gioria, R.; Melas, A.D.; Ferrarese, C.; Franzetti, J.; Arlitt, B.; Nagura, N.; Hanada, T.; Giechaskiel, B. Real-Time Measurements of Formaldehyde Emissions from Modern Vehicles. Energies 2022, 15, 7680. [Google Scholar] [CrossRef]
- Tiwari, A.; Kumar, P.; Baldauf, R.; Zhang, K.M.; Pilla, F.; Di Sabatino, S.; Brattich, E.; Pulvirenti, B. Considerations for evaluating green infrastructure impacts in microscale and macroscale air pollution dispersion models. Sci. Total Environ. 2019, 672, 410–426. [Google Scholar] [CrossRef]
- Forehead, H.; Huynh, N. Review of modelling air pollution from traffic at street-level-The state of the science. Environ. Pollut. 2018, 241, 775–786. [Google Scholar] [CrossRef] [PubMed]
- Karim, M.; Matsui, H.; Ohno, T.; Hoque, S. Current State of Traffic Pollution in Bangladesh and Metropolitan Dhaka; Technical Report; Air and Waste Management Association: Pittsburgh, PA, USA, 1997. [Google Scholar]
- Hadi, T. An analysis of water policies and strategies of Bangladesh in the context of climate change. Asia-Pac. J. Rur. Develop. 2019, 29, 111–123. [Google Scholar] [CrossRef]
- Xie, J.; Shah, J.; Brandon, C. Fighting urban transport air pollution for local and global good: The case of two-stroke engine three wheelers in Delhi. In Proceedings of the Workshop on Integrated Approach to Vehicular Pollution Control in Delhi, Subgroup V: International Experiences in Vehicular Pollution Control, Delhi, India, 16–18 April 1998; pp. 16–18. [Google Scholar]
- Labib, S.; Neema, M.N.; Rahaman, Z.; Patwary, S.H.; Shakil, S.H. Carbon dioxide emission and bio-capacity indexing for transportation activities: A methodological development in determining the sustainability of vehicular transportation systems. J. Environ. Mgt. 2018, 223, 57–73. [Google Scholar] [CrossRef] [PubMed] [Green Version]
- Rahman, M.M.; Mahamud, S.; Thurston, G.D. Recent spatial gradients and time trends in Dhaka, Bangladesh, air pollution and their human health implications. J. Air Waste Mgt. Assoc. 2019, 69, 478–501. [Google Scholar] [CrossRef] [PubMed]
- Salam, A.; Andersson, A.; Jeba, F.; Haque, M.I.; Hossain Khan, M.D.; Gustafsson, O. Wintertime air quality in megacity Dhaka, Bangladesh strongly affected by influx of black carbon aerosols from regional biomass burning. Environ. Sci. Technol. 2021, 55, 12243–12249. [Google Scholar] [CrossRef] [PubMed]
- Majumder, A.K.; Al Nayeem, A.; Islam, M.; Akter, M.M.; Carter, W.S. Critical review of lead pollution in Bangladesh. J. Health Pollut. 2021, 11, 210902. [Google Scholar] [CrossRef] [PubMed]
- Njati, S.Y.; Maguta, M.M. Lead-based paints and children’s PVC toys are potential sources of domestic lead poisoning—A review. Environ. Pollut. 2019, 249, 1091–1105. [Google Scholar] [CrossRef]
- Sullivan, T.J.; Driscoll, C.T.; Beier, C.M.; Burtraw, D.; Fernandez, I.J.; Galloway, J.N.; Gay, D.A.; Goodale, C.L.; Likens, G.E.; Lovett, G.M.; et al. Air pollution success stories in the United States: The value of long-term observations. Environ. Sci. Pol. 2018, 84, 69–73. [Google Scholar] [CrossRef]
- Yang, J.; Zhang, B. Air pollution and healthcare expenditure: Implication for the benefit of air pollution control in China. Environ. Int. 2018, 120, 443–455. [Google Scholar] [CrossRef]
- Monk, K.; Guérette, E.A.; Paton-Walsh, C.; Silver, J.D.; Emmerson, K.M.; Utembe, S.R.; Zhang, Y.; Griffiths, A.D.; Chang, L.T.C.; Duc, H.N.; et al. Evaluation of regional air quality models over Sydney and Australia: Part 1—Meteorological model comparison. Atmosphere 2019, 10, 374. [Google Scholar] [CrossRef]
- Feng, J.; Chan, E.; Vet, R. Air quality in the eastern United States and Eastern Canada for 1990–2015: 25 years of change in response to emission reductions of SO2 and NOx in the region. Atmos. Chem. Phys. 2020, 20, 3107–3134. [Google Scholar] [CrossRef] [Green Version]
- Menut, L.; Bessagnet, B.; Siour, G.; Mailler, S.; Pennel, R.; Cholakian, A. Impact of lockdown measures to combat COVID-19 on air quality over western Europe. Sci. Total Environ. 2020, 741, 140426. [Google Scholar] [CrossRef] [PubMed]
- El Ghazi, I.; Berni, I.; Menouni, A.; Amane, M.; Kestemont, M.P.; El Jaafari, S. Exposure to Air Pollution from Road Traffic and Incidence of Respiratory Diseases in the City of Meknes, Morocco. Pollutants 2022, 2, 306–327. [Google Scholar] [CrossRef]
- Hasan, M.F.; Himika, T.A.; Molla, M.M. Large-eddy simulation of airflow and heat transfer in a general ward of hospital. AIP Conf. Proc. 2016, 1754, 050022. [Google Scholar]
- Hasan, M.F.; Ahmed Himika, T.; Molla, M.M. Lattice Boltzmann simulation of airflow and heat transfer in a model ward of a hospital. J. Therm. Sci. Eng. Appl. 2017, 9, 011011. [Google Scholar] [CrossRef]
- Du, Y.; Blocken, B.; Pirker, S. A novel approach to simulate pollutant dispersion in the built environment: Transport-based recurrence CFD. Build. Environ. 2020, 170, 106604. [Google Scholar] [CrossRef]
- García-Sánchez, C.; Van Tendeloo, G.; Gorlé, C. Quantifying inflow uncertainties in RANS simulations of urban pollutant dispersion. Atmos. Environ. 2017, 161, 263–273. [Google Scholar] [CrossRef]
- Lin, C.; Ooka, R.; Kikumoto, H.; Jia, H. Eulerian RANS simulations of near-field pollutant dispersion around buildings using concentration diffusivity limiter with travel time. Build. Environ. 2021, 202, 108047. [Google Scholar] [CrossRef]
- Ben Ramoul, L.; Korichi, A.; Popa, C.; Zaidi, H.; Polidori, G. Numerical study of flow characteristics and pollutant dispersion using three RANS turbulence closure models. Environ. Fluid Mech. 2019, 19, 379–400. [Google Scholar] [CrossRef]
- Weerasuriya, A.U.; Zhang, X.; Tse, K.T.; Liu, C.H.; Kwok, K.C. RANS simulation of near-field dispersion of reactive air pollutants. Build. Environ. 2022, 207, 108553. [Google Scholar] [CrossRef]
- Kurppa, M.; Hellsten, A.; Auvinen, M.; Raasch, S.; Vesala, T.; Järvi, L. Ventilation and air Quality in city blocks using large-eddy simulation—urban planning perspective. Atmosphere 2018, 9, 65. [Google Scholar] [CrossRef]
- Chatzimichailidis, A.E.; Argyropoulos, C.D.; Assael, M.J.; Kakosimos, K.E. Qualitative and quantitative investigation of multiple large eddy simulation aspects for pollutant dispersion in street canyons using OpenFOAM. Atmosphere 2019, 10, 17. [Google Scholar] [CrossRef] [Green Version]
- Blocken, B. LES over RANS in building simulation for outdoor and indoor applications: A foregone conclusion? Build. Simul. 2018, 11, 821–870. [Google Scholar] [CrossRef] [Green Version]
- Gromke, C.; Buccolieri, R.; Di Sabatino, S.; Ruck, B. Dispersion study in a street canyon with tree planting by means of wind tunnel and numerical investigations–evaluation of CFD data with experimental data. Atmos. Environ. 2008, 42, 8640–8650. [Google Scholar] [CrossRef]
- Yuan, C.; Shan, R.; Zhang, Y.; Li, X.X.; Yin, T.; Hang, J.; Norford, L. Multilayer urban canopy modelling and mapping for traffic pollutant dispersion at high density urban areas. Sci. Total Environ. 2019, 647, 255–267. [Google Scholar] [CrossRef] [PubMed]
- Alberti, G.; Bianchini, S.; Crippa, G. A uniqueness result for the continuity equation in two dimensions. J. Eur. Math. Soc. 2014, 16, 201–234. [Google Scholar] [CrossRef] [Green Version]
- Kim, J.J.; Baik, J.J. Effects of inflow turbulence intensity on flow and pollutant dispersion in an urban street canyon. J. Wind Eng. Indust. Aerodyn. 2003, 91, 309–329. [Google Scholar] [CrossRef]
- Leelossy, Á.; Molnár, F.; Izsák, F.; Havasi, Á.; Lagzi, I.; Mészáros, R. Dispersion modeling of air pollutants in the atmosphere: A review. Open Geosci. 2014, 6, 257–278. [Google Scholar] [CrossRef]
- Rodi, W. Experience with two-layer models combining the k-epsilon model with a one-equation model near the wall. In Proceedings of the 29th Aerospace Sciences Meeting, Reno, NV, USA, 7–10 January 1991; p. 216. [Google Scholar]
- Van Ulden, A.; Holtslag, A. Estimation of atmospheric boundary layer parameters for diffusion applications. J. Appl. Meteorol. Climatol. 1985, 24, 1196–1207. [Google Scholar] [CrossRef]
- Holt, T.; Raman, S. A review and comparative evaluation of multilevel boundary layer parameterizations for first-order and turbulent kinetic energy closure schemes. Rev. Geophys. 1988, 26, 761–780. [Google Scholar] [CrossRef]
- Mukherjee, P.; Viswanathan, S. Carbon monoxide modeling from transportation sources. Chemosph. 2001, 45, 1071–1083. [Google Scholar] [CrossRef] [PubMed]
- Kovar-Panskus, A.; Louka, P.; Sini, J.F.; Savory, E.; Czech, M.; Abdelqari, A.; Mestayer, P.; Toy, N. Influence of geometry on the mean flow within urban street canyons–a comparison of wind tunnel experiments and numerical simulations. Water Air Soil Pollut. Focus 2002, 2, 365–380. [Google Scholar] [CrossRef]
- Gromke, C.; Ruck, B. Influence of trees on the dispersion of pollutants in an urban street canyon—Experimental investigation of the flow and concentration field. Atmos. Environ. 2007, 41, 3287–3302. [Google Scholar] [CrossRef] [Green Version]
- Gromke, C. CODASC: A database for the validation of street canyon dispersion models. In Proceedings of the 15th International Conference on Harmonisation within Atmospheric Dispersion Modelling for Regulatory Purposes (HARMO), Madrid, Spain, 6–9 May 2013. [Google Scholar]
- Lin, H.; Xu, B.; Chen, Y.; Li, W.; You, L.; He, J. VGEs as a New Platform for Urban Modeling and Simulation. Sustainability 2022, 14, 7980. [Google Scholar] [CrossRef]
- Islam, M.M.; Saha, N.; Rahman, M.S.; Ahmed, N.U. Congestion Pricing of Urban Street Segments along with MRT Route—The Case Study of Dhaka, Bangladesh. J. Transp. Technol. 2021, 11, 168–178. [Google Scholar] [CrossRef]
- Gallagher, R. Prioritising Dhaka’s Urban Transport System. J. Bus. Technol. 2016, 11, 141–144. [Google Scholar]
- Badach, J.; Szczepański, J.; Bonenberg, W.; Gębicki, J.; Nyka, L. Developing the Urban Blue-Green Infrastructure as a Tool for Urban Air Quality Management. Sustainability 2022, 14, 9688. [Google Scholar] [CrossRef]
- Jońca, J.; Pawnuk, M.; Bezyk, Y.; Arsen, A.; Sówka, I. Drone-Assisted Monitoring of Atmospheric Pollution—A Comprehensive Review. Sustainability 2022, 14, 11516. [Google Scholar] [CrossRef]


Disclaimer/Publisher’s Note: The statements, opinions and data contained in all publications are solely those of the individual author(s) and contributor(s) and not of MDPI and/or the editor(s). MDPI and/or the editor(s) disclaim responsibility for any injury to people or property resulting from any ideas, methods, instructions or products referred to in the content. |
© 2022 by the authors. Licensee MDPI, Basel, Switzerland. This article is an open access article distributed under the terms and conditions of the Creative Commons Attribution (CC BY) license (https://creativecommons.org/licenses/by/4.0/).
Share and Cite
Ali, M.E.; Hasan, M.F.; Siddiqa, S.; Molla, M.M.; Nasrin Akhter, M. FVM-RANS Modeling of Air Pollutants Dispersion and Traffic Emission in Dhaka City on a Suburb Scale. Sustainability 2023, 15, 673. https://doi.org/10.3390/su15010673
Ali ME, Hasan MF, Siddiqa S, Molla MM, Nasrin Akhter M. FVM-RANS Modeling of Air Pollutants Dispersion and Traffic Emission in Dhaka City on a Suburb Scale. Sustainability. 2023; 15(1):673. https://doi.org/10.3390/su15010673
Chicago/Turabian StyleAli, Md. Eabad, Md Farhad Hasan, Sadia Siddiqa, Md. Mamun Molla, and Most. Nasrin Akhter. 2023. "FVM-RANS Modeling of Air Pollutants Dispersion and Traffic Emission in Dhaka City on a Suburb Scale" Sustainability 15, no. 1: 673. https://doi.org/10.3390/su15010673