
Spatial Distribution Characteristics of Public Fitness Venues: An Urban Accessibility Perspective
 , and
, and
Abstract
:1. Introduction
2. Materials and Methods
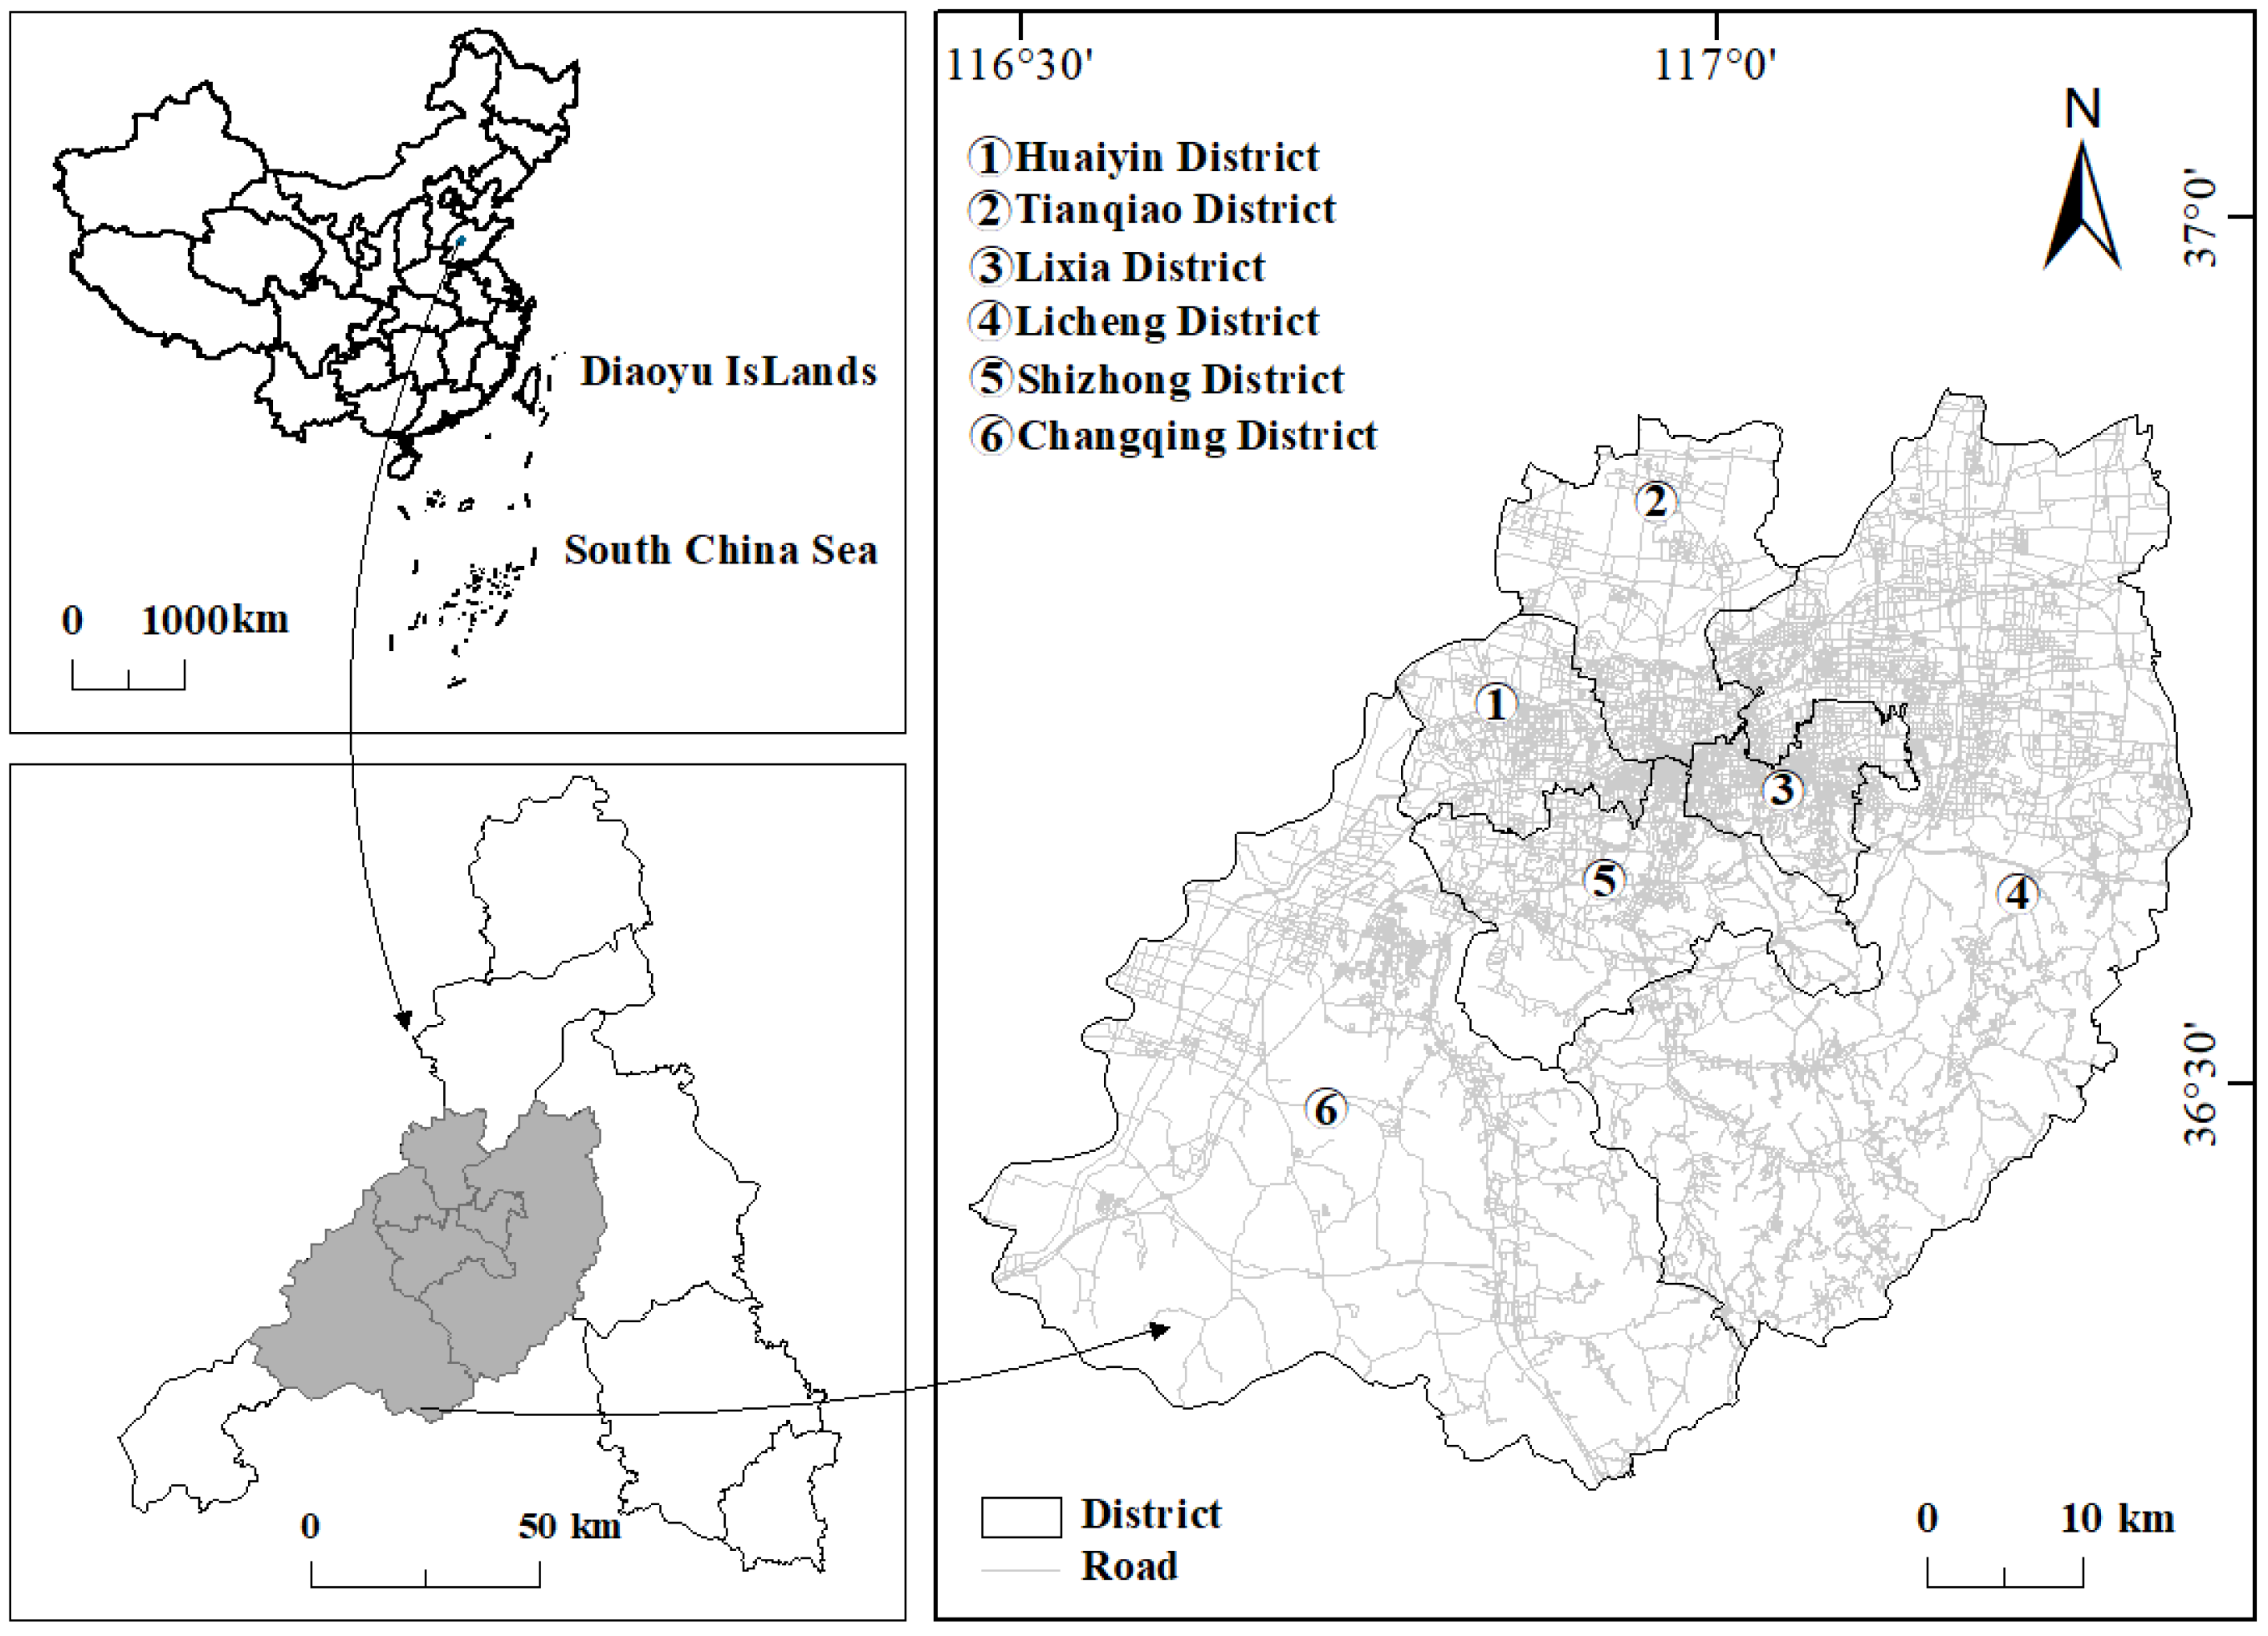
2.1. Study Area
2.2. Headings
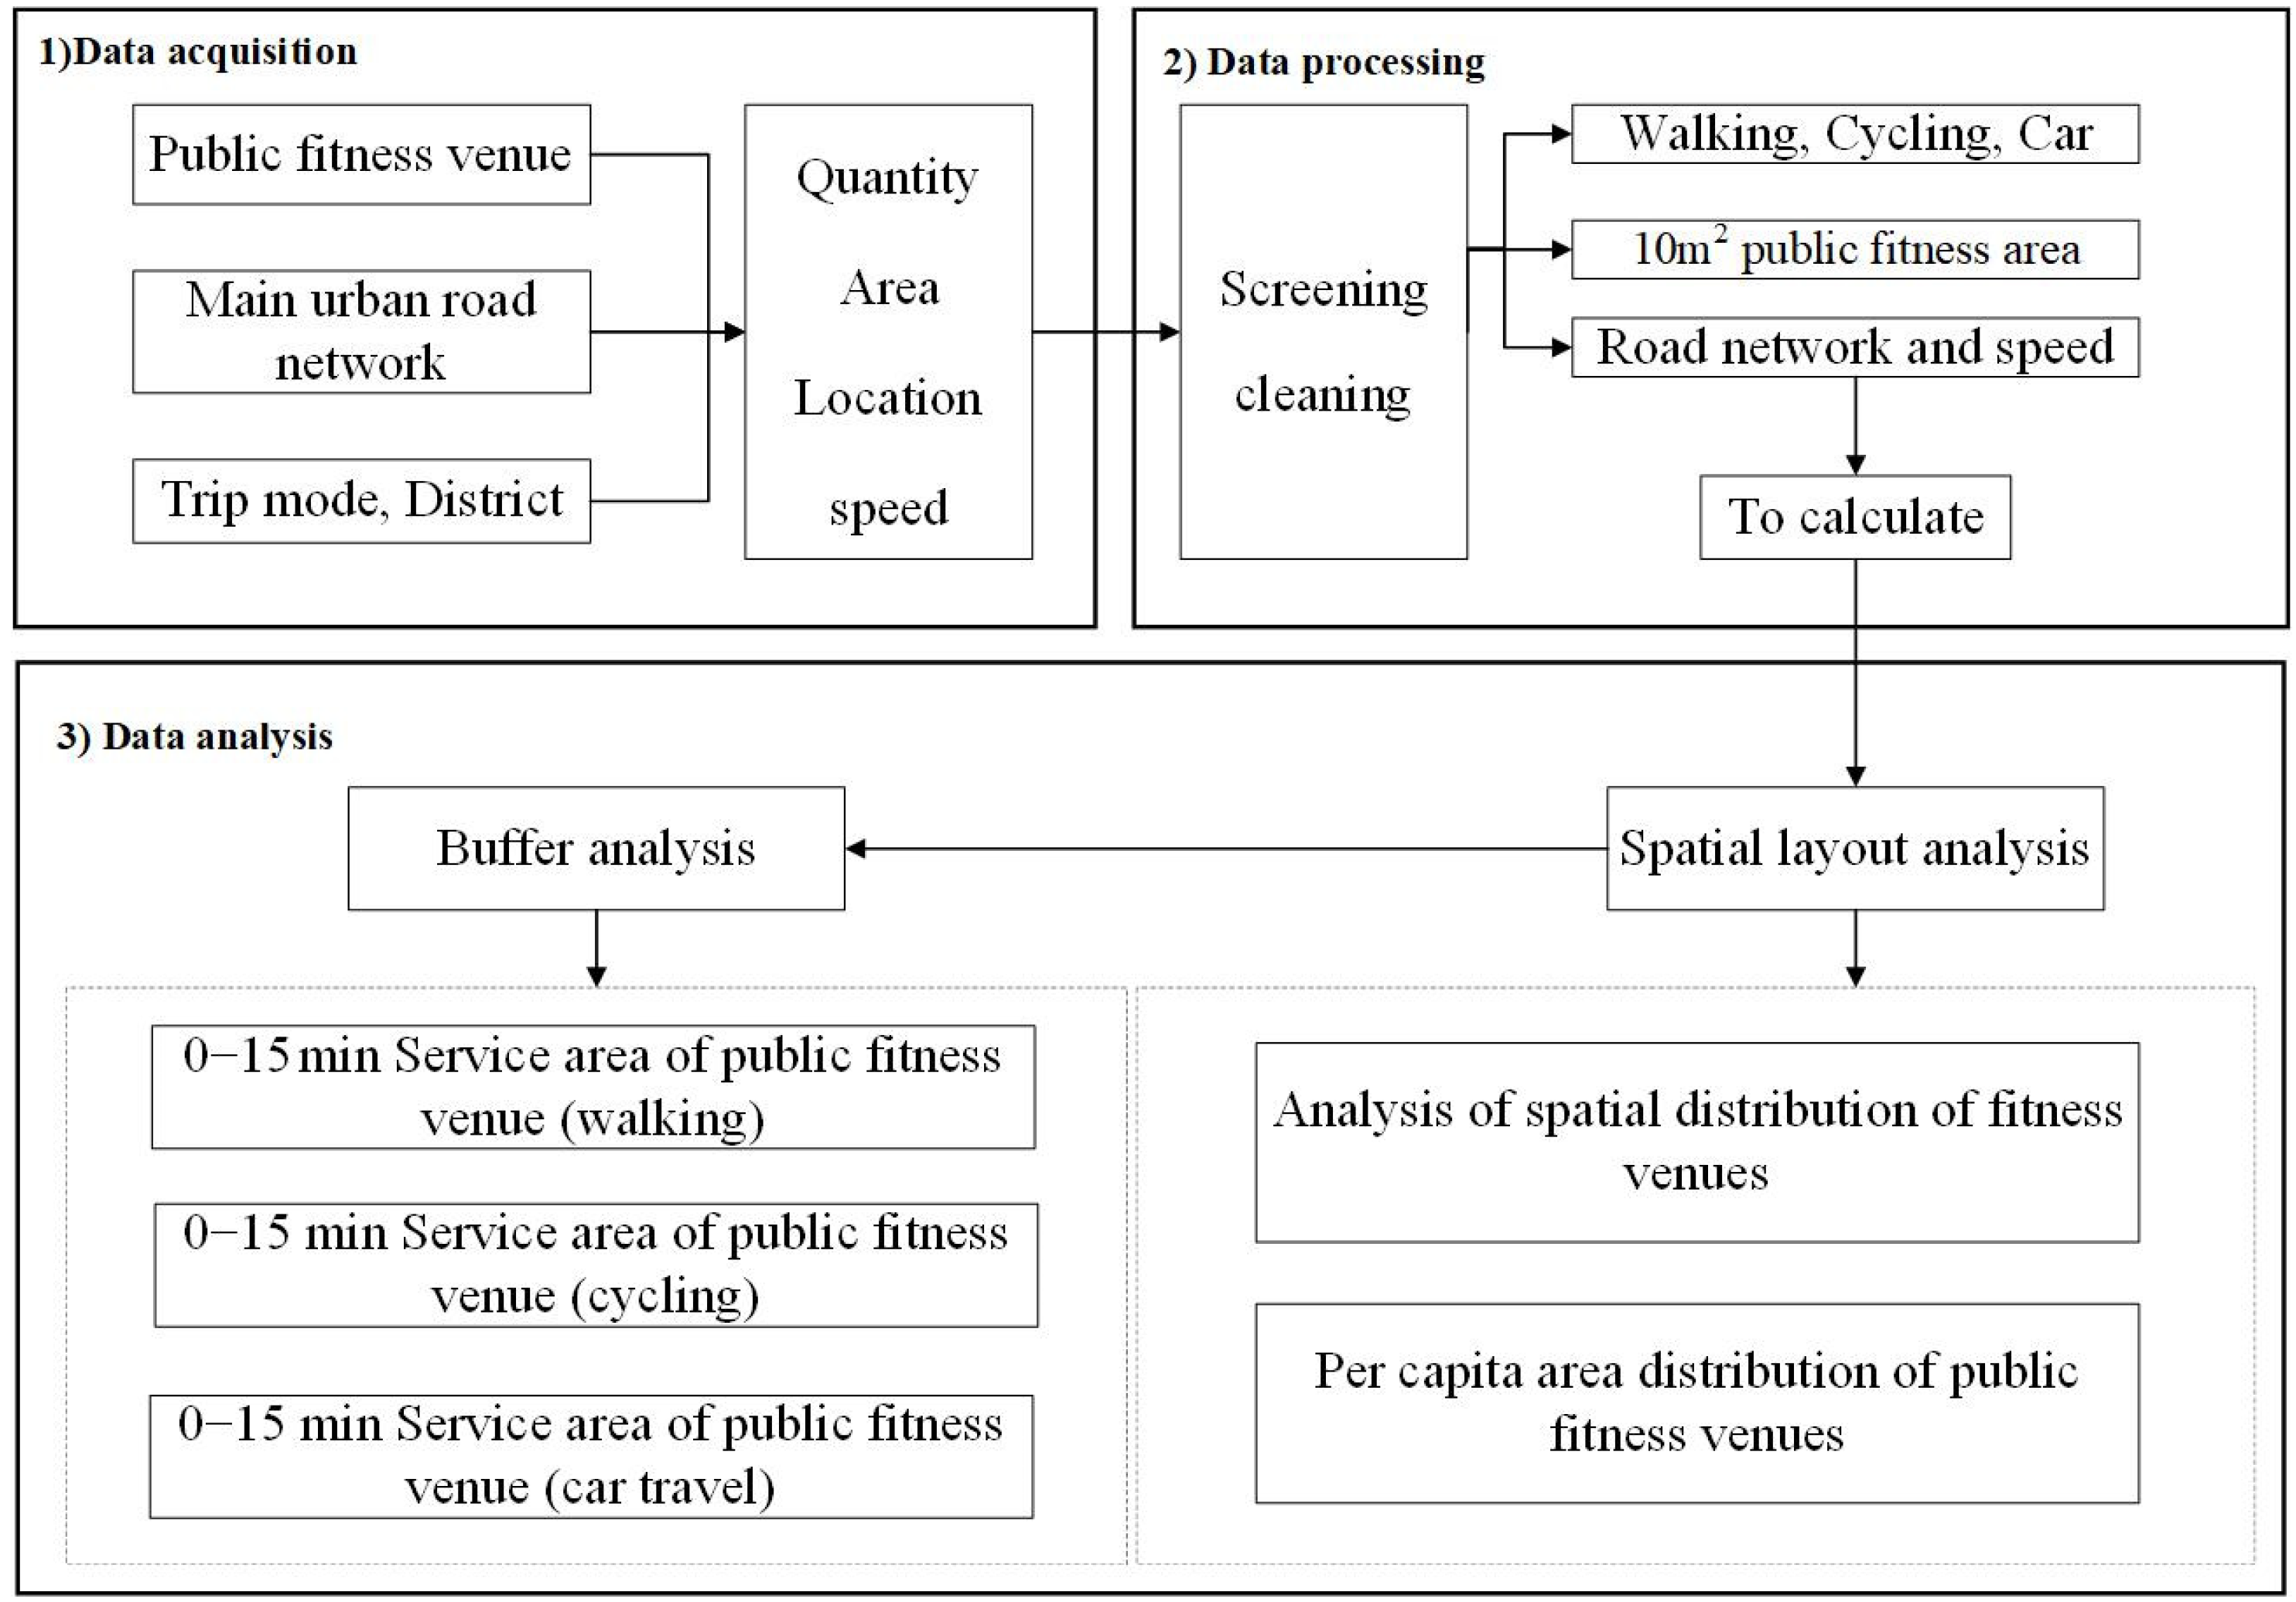
2.3. Methods
3. Results
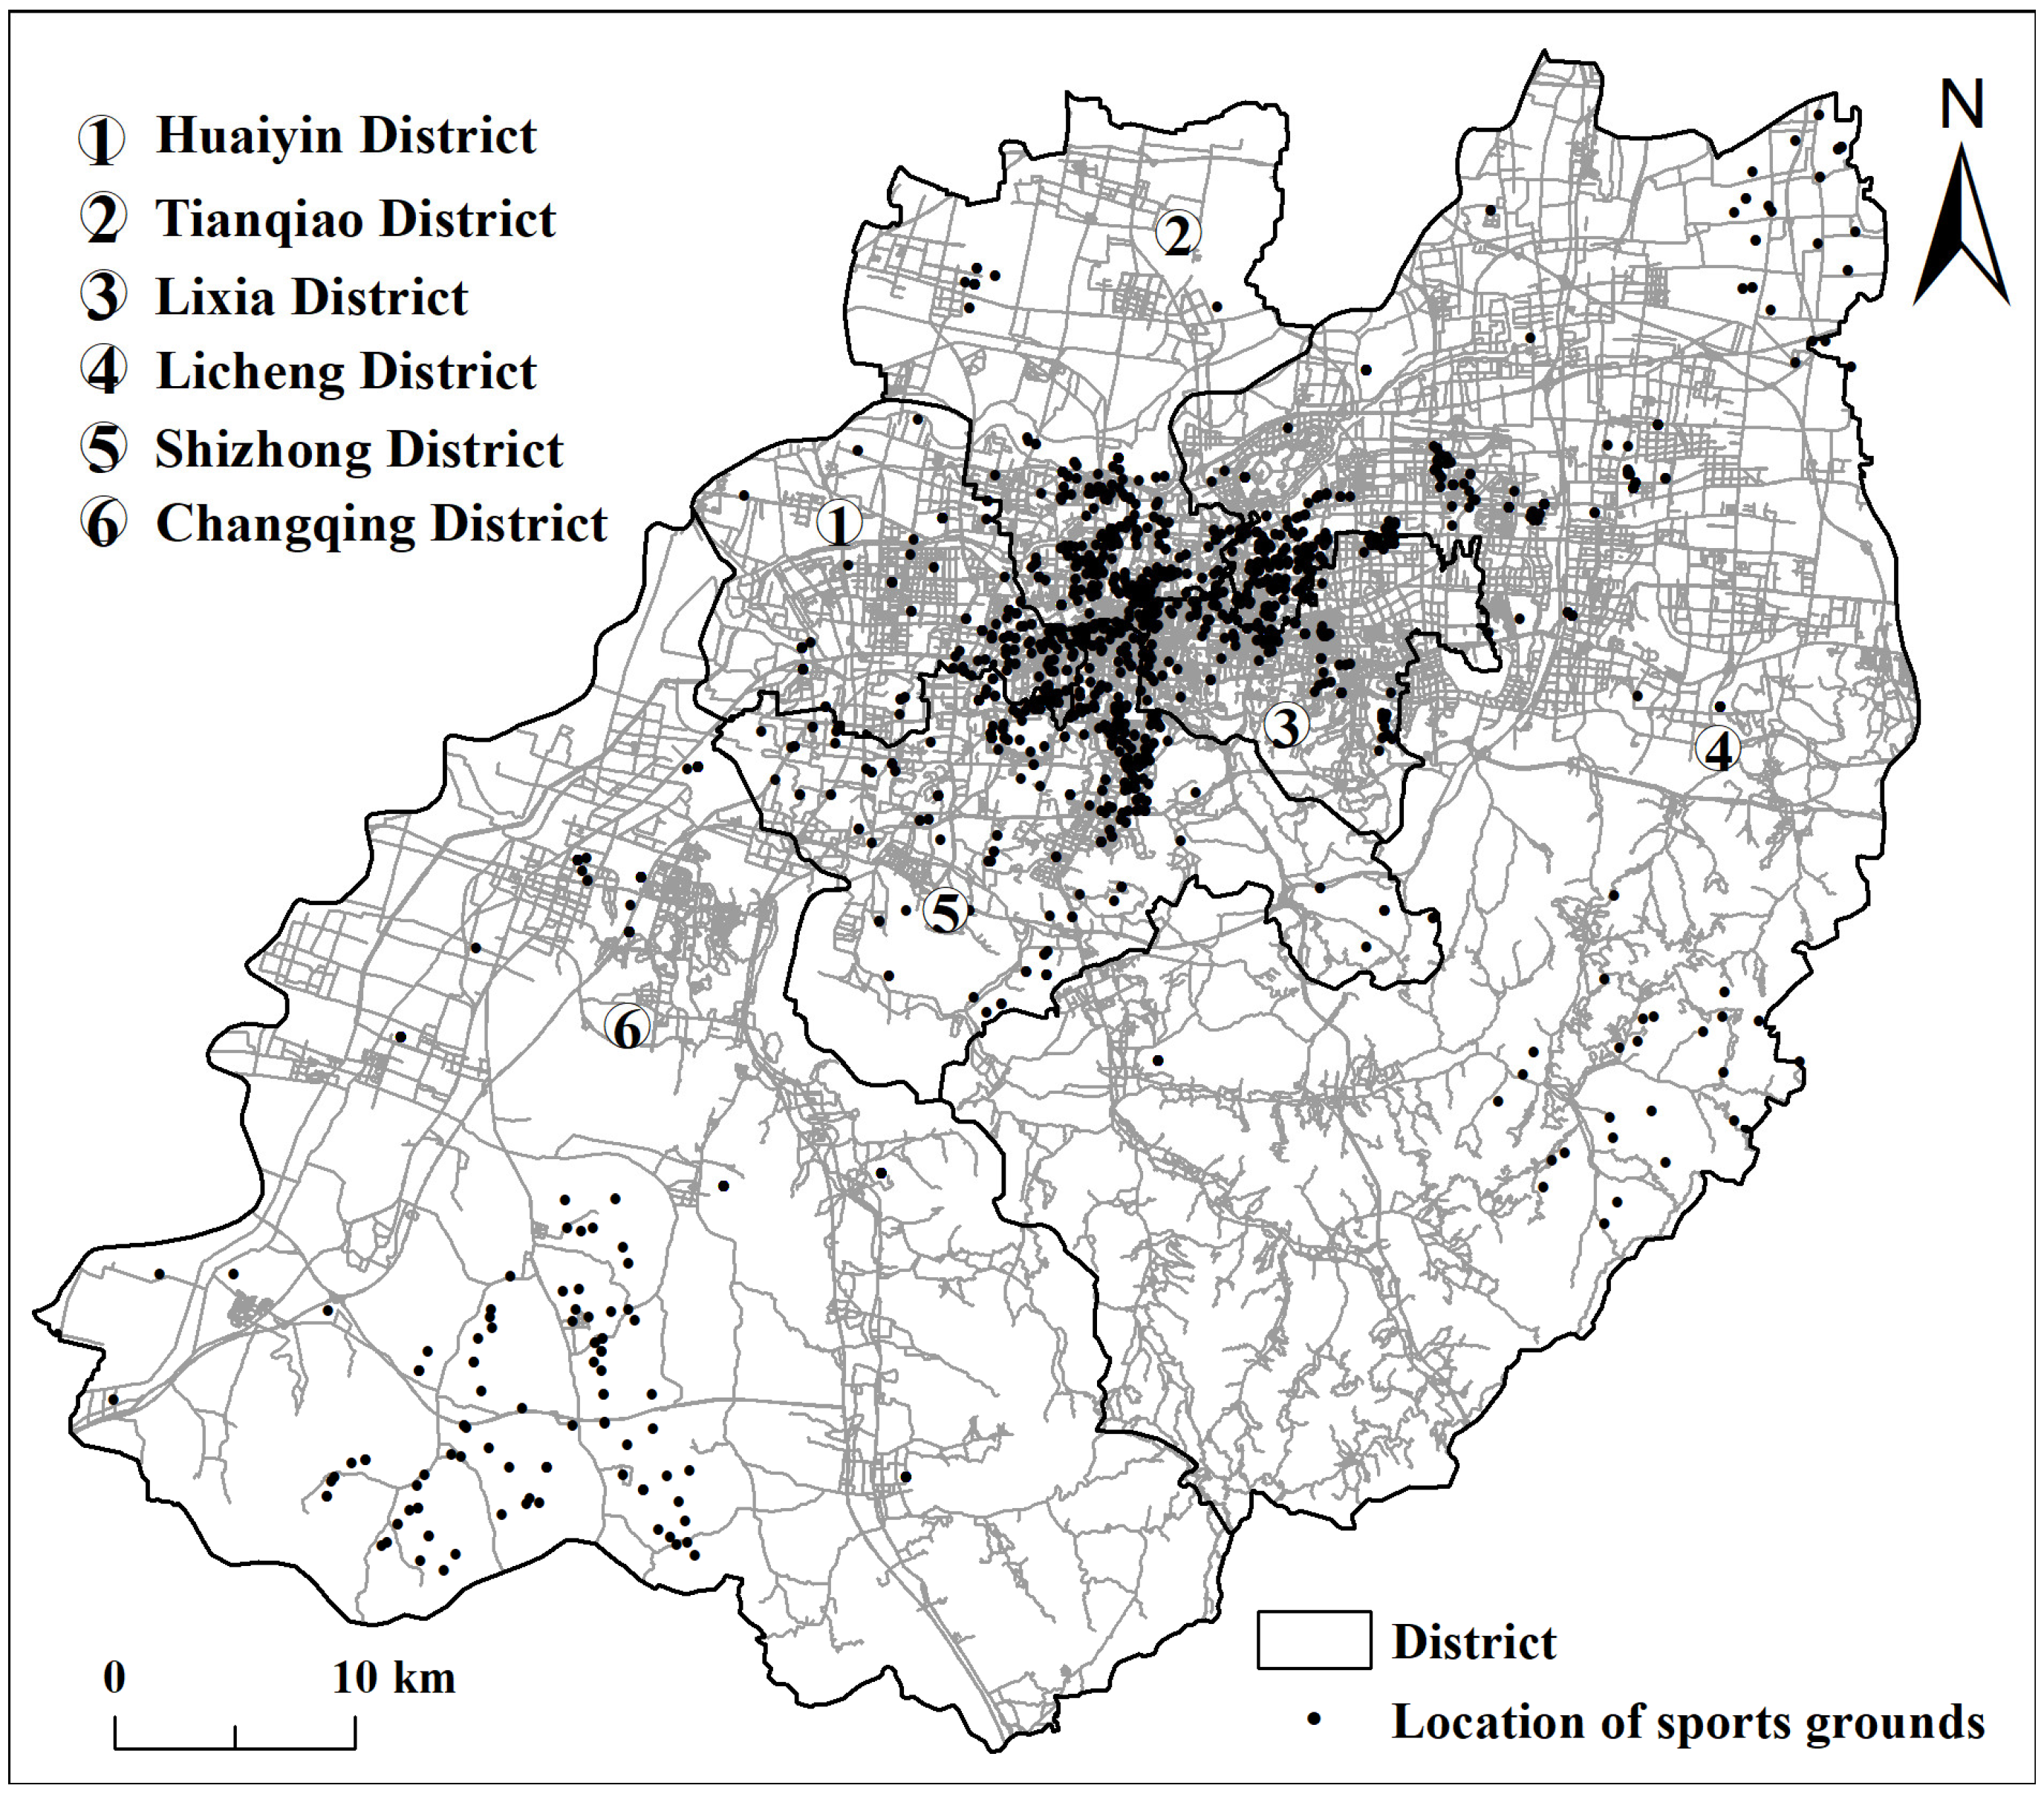
3.1. Public Fitness Venue Location Distribution Characteristics
3.2. Distribution Characteristics of per Capita Area of Public Fitness Venue
3.3. Accessibility Analysis of Public Fitness Venues
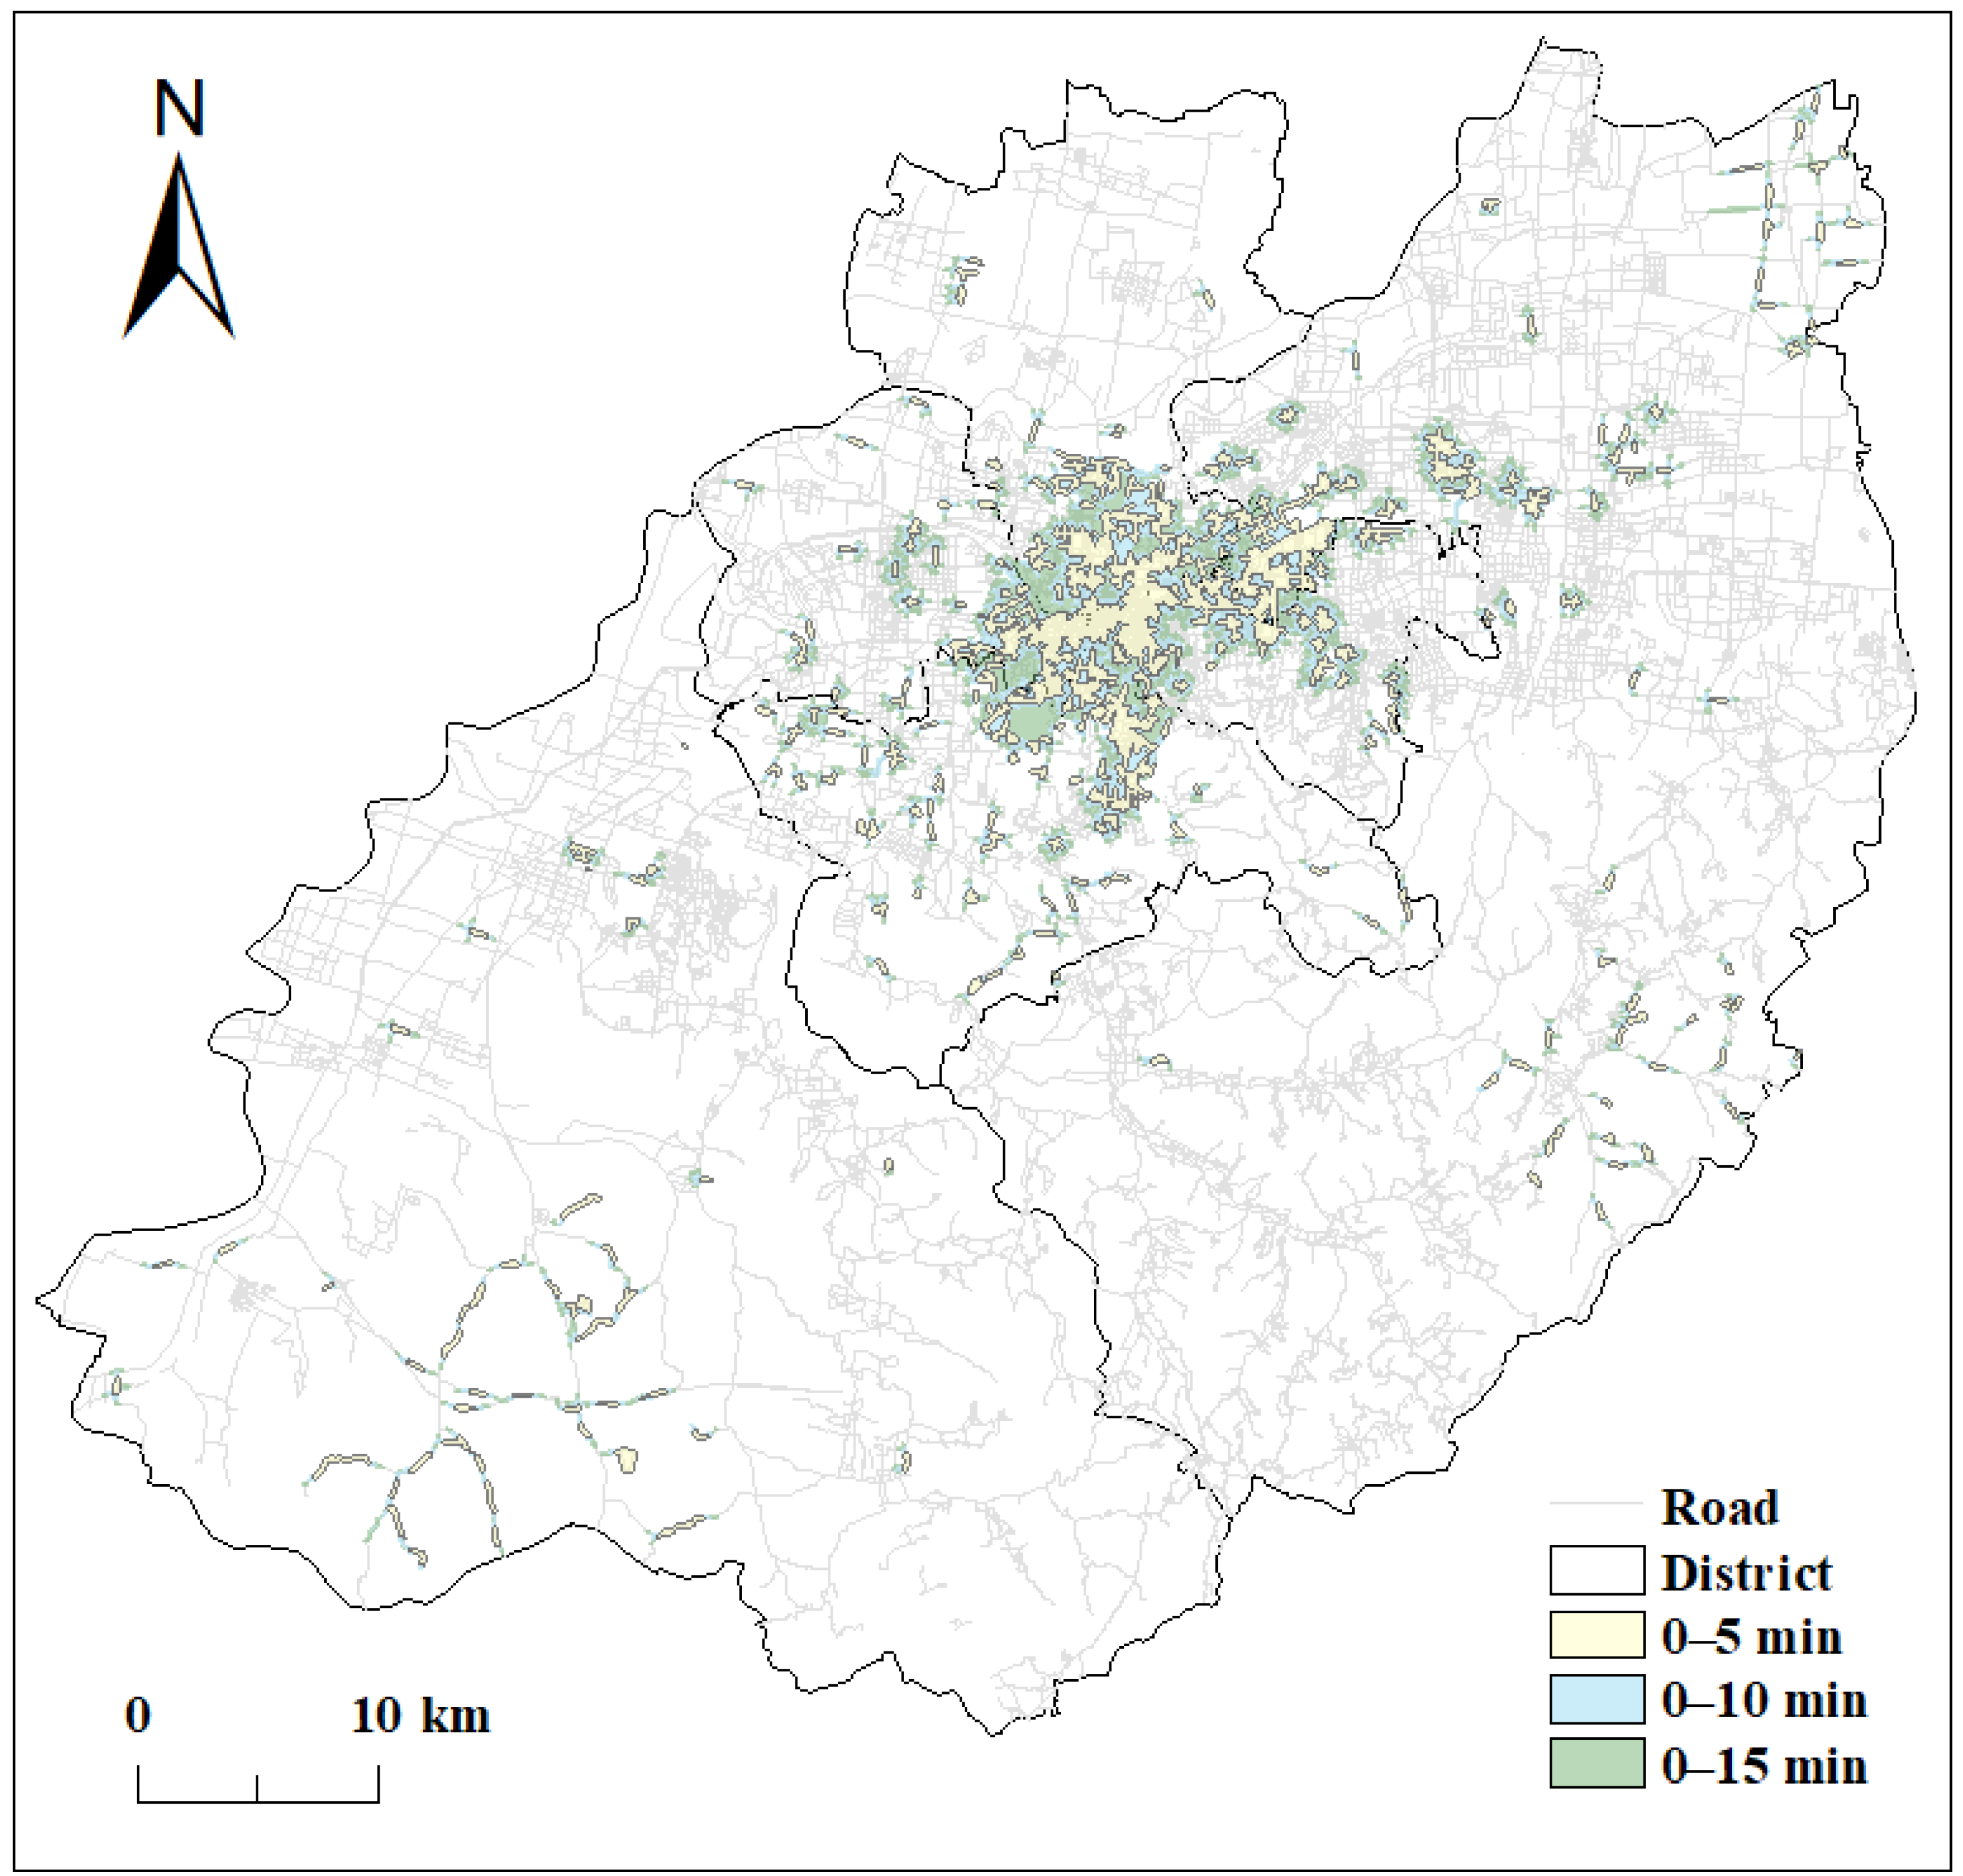
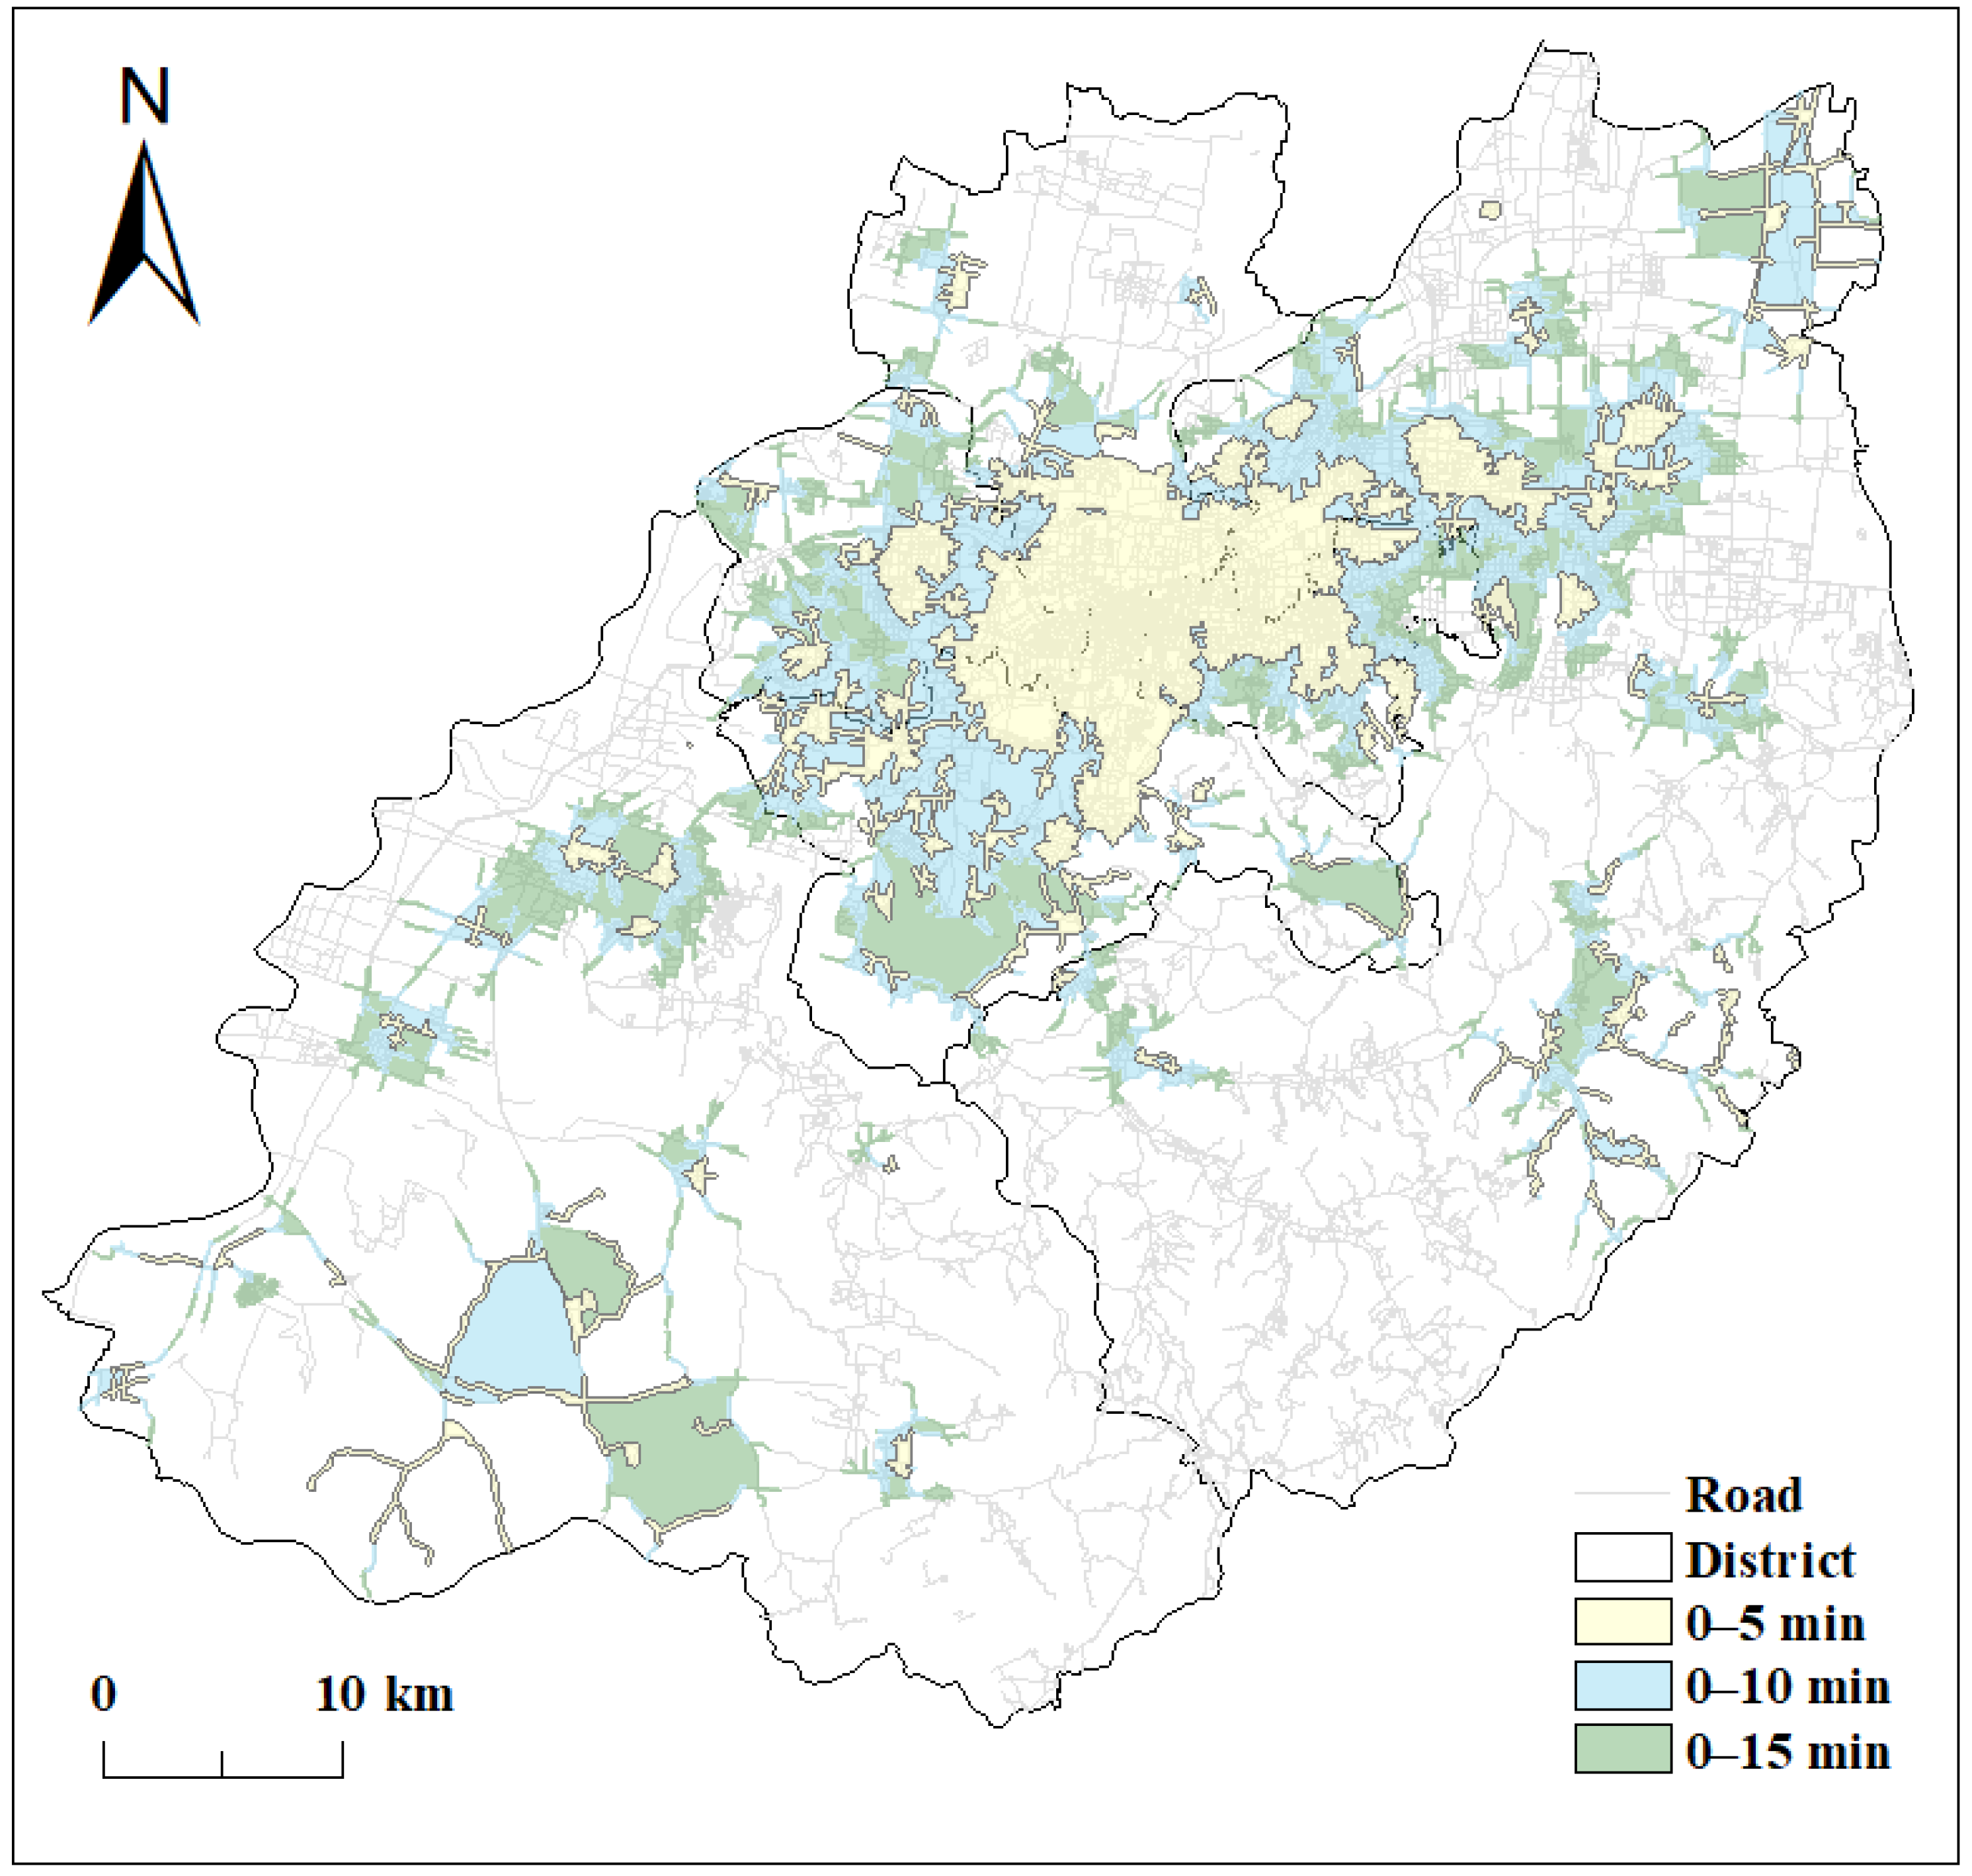
3.3.1. Transportation by Walking
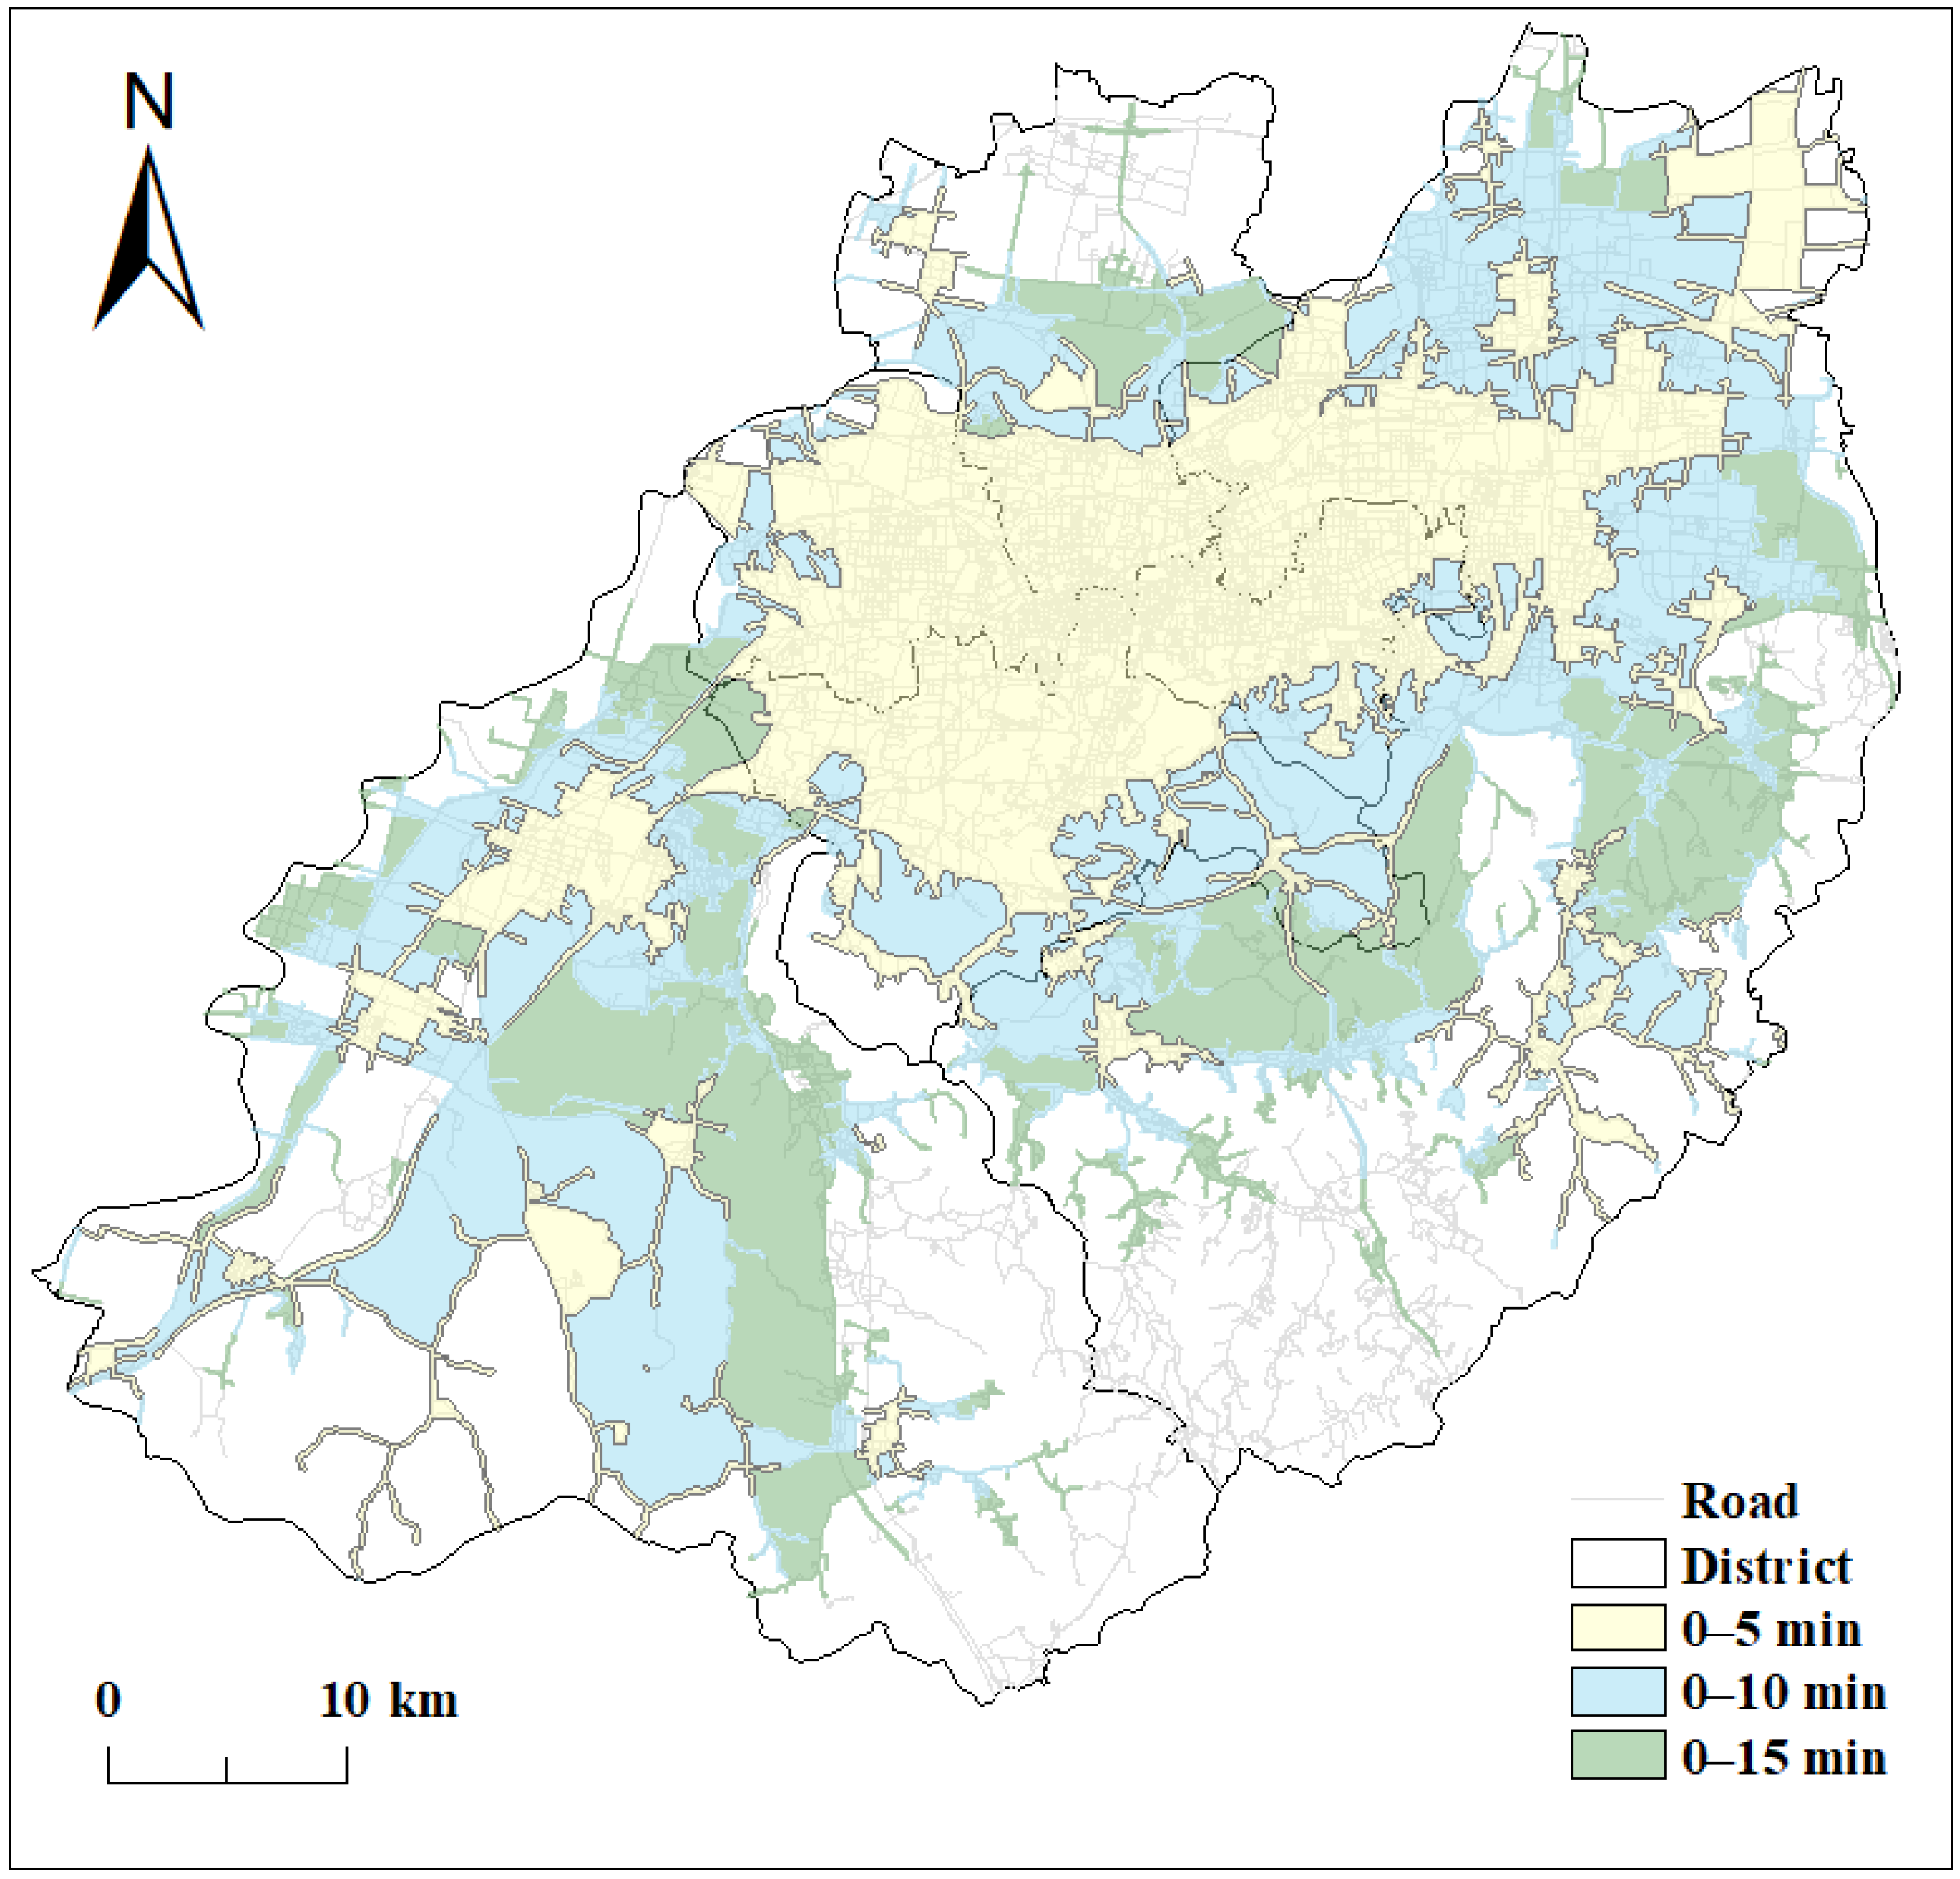
3.3.2. Transportation by Cycling
3.3.3. Transportation by Car Travel
4. Discussion
Limitations
5. Conclusions
6. Suggestions
Author Contributions
Funding
Institutional Review Board Statement
Informed Consent Statement
Data Availability Statement
Acknowledgments
Conflicts of Interest
References
- Hao, J.; Ma, H. Spatial Heterogeneity of Public Service Facilities in the Living Circle and Its Influence on Housing Prices: A Case Study of Central Urban Dalian, China. Land 2022, 11, 1095. [Google Scholar] [CrossRef]
- Warburton, D.E.R.; Charlesworth, S.; Ivey, A.; Nettlefold, L.; Bredin, S.S.D. A Systematic Review of the Evidence for Canada’s Physical Activity Guidelines for Adults. Int. J. Behav. Nutr. Phys. Act. 2010, 7, 39. [Google Scholar] [CrossRef] [PubMed] [Green Version]
- Guthold, R.; Stevens, G.A.; Riley, L.M.; Bull, F.C. Worldwide Trends in Insufficient Physical Activity from 2001 to 2016: A Pooled Analysis of 358 Population-Based Surveys with 1·9 Million Participants. Lancet Glob. Health 2018, 6, e1077–e1086. [Google Scholar] [CrossRef] [PubMed] [Green Version]
- Wang, K.; Wang, X. Providing Sports Venues on Mainland China: Implications for Promoting Leisure-Time Physical Activity and National Fitness Policies. Int. J. Environ. Res. Public Health 2020, 17, 45136. [Google Scholar] [CrossRef] [PubMed]
- Morrow, J., Jr. A One-Year Follow-up to Physical Activity and Health A Report of the Surgeon General. Am. J. Prev. Med. 1999, 17, 24–30. [Google Scholar] [CrossRef]
- Kostrzewska, M. Activating Public Space: How to Promote Physical Activity in Urban Environment. IOP Conf. Ser. Mater. Sci. Eng. 2017, 245, 052074. [Google Scholar] [CrossRef]
- Chen, X.; Hu, B.; Wang, L.; Tian, F. The Influencing Factors of Opening of College Sports Resources in the Background of National Public Fitness Services. Rev. Bras. Med. Esporte 2021, 27, 87–90. [Google Scholar] [CrossRef]
- Jakar, G.S.; Razin, E.; Rosentraub, M.S.; Rosen, G. Sport Facility Development: Municipal Capital and Shutting out the Private Sector. Eur. Plan. Stud. 2018, 26, 1222–1241. Available online: https://www.tandfonline.com/doi/abs/10.1080/09654313.2018.1451826 (accessed on 8 October 2022). [CrossRef]
- Morejon, S. The Design of Urban Public Space for the Promotion of Sports Practice. Rev. Esp. Sociol. 2019, 28, 445–460. [Google Scholar] [CrossRef]
- Nieuwenhuijsen, M.J. New Urban Models for More Sustainable, Liveable and Healthier Cities Post Covid19; Reducing Air Pollution, Noise and Heat Island Effects and Increasing Green Space and Physical Activity. Environ. Int. 2021, 157, 106850. [Google Scholar] [CrossRef]
- Puig, N.; Vilanova, A.; Camino, X.; Maza, G.; Pasarello, M.; Juan, D.; Tarrago, R. Public urban spaces and sport as a source of social networks. The case of Barcelona. Apunts Educ. Fis. Deportes 2006, 84, 76–87. [Google Scholar]
- Liu, Y.; Wang, H.; Sun, C.; Wu, H. Equity Measurement of Public Sports Space in Central Urban Areas Based on Residential Scale Data. Int. J. Environ. Res. Public Health 2022, 19, 53104. [Google Scholar] [CrossRef]
- Yi, J.; Horton, P. The Integration of Three Types of Lands: A New Approach to the Provision of Public Sport and Recreation Areas in China. Int. J. Hist. Sport 2015, 32, 1291–1307. [Google Scholar] [CrossRef]
- Magrinya, F.; Puig, N. Sporting Social Networks in Public Spaces of Barcelona: Statistics and Trenes. Apunts Educ. Fis. Deportes 2008, 91, 35–43. [Google Scholar]
- Che, Y.; Cao, Y.; Wu, R.; Liu, J.; Chen, L.; Wu, J. Spatio-Temporal Pattern of World Heritage and Its Accessibility Assessment in China. Sustainability 2022, 14, 53033. [Google Scholar] [CrossRef]
- Asefi, A.; Ghanbarpour Nosrati, A. The Spatial Justice in the Distribution of Built Outdoor Sports Facilities|Emerald Insight. J. Facil. Manag. 2020, 18, 159–178. Available online: https://www.emerald.com/insight/content/doi/10.1108/JFM-09-2019-0051/full/html (accessed on 8 October 2022). [CrossRef]
- Gao, S.; Li, C.; Rong, Y.; Yan, Q.; Liu, W.; Ma, Z. The Places-People Exercise: Understanding Spatial Patterns and the Formation Mechanism for Urban Commercial Fitness Space in Changchun City, China. Sustainability 2022, 14, 31358. [Google Scholar] [CrossRef]
- Wu, X.; Qin, X.; Zhou, H. Use of Community Spaces for Sports and Fitness—A Case Study of Urban Inhabitants in Shenzhen City, China. Int. Rev. Spat. Plan. Sustain. Dev. 2018, 6, 49–62. [Google Scholar] [CrossRef] [Green Version]
- Buekers, F.; Wibowo, J. Accessibility of sports halls Significance for participation in sports and an attempt at operationalization. Ger. J. Exerc. Sport Res. 2020, 50, 71–81. [Google Scholar] [CrossRef]
- Zong, Y.X.; Yu-Qi, L.U. Assessment of Fair Space of Opportunities for Regional Development Based on Accessibility—A Case of Jiangxi Province. Sci. Geogr. Sin. 2009, 29, 809–816. [Google Scholar] [CrossRef]
- Wang, L.; Liu, Y.; Mao, L.; Sun, C. Potential Impacts of China 2030 High-Speed Rail Network on Ground Transportation Accessibility. Sustainability 2018, 10, 41270. [Google Scholar] [CrossRef] [Green Version]
- Christodoulou, A.; Dijkstra, L.; Christidis, P.; Bolsi, P.; Poelman, H. A Fine Resolution Dataset of Accessibility under Different Traffic Conditions in European Cities. Sci. Data 2020, 7, 279. [Google Scholar] [CrossRef] [PubMed]
- Ge, F.; Chen, W.; Zeng, Y.; Li, J. The Nexus between Urbanization and Traffic Accessibility in the Middle Reaches of the Yangtze River Urban Agglomerations, China. Int. J. Environ. Res. Public Health 2021, 18, 73828. [Google Scholar] [CrossRef] [PubMed]
- Zuo, Y.; Liu, Z.; Fu, X. Measuring Accessibility of Bus System Based on Multi-Source Traffic Data. Geo-Spat. Inf. Sci. 2020, 23, 248–257. [Google Scholar] [CrossRef]
- Petras, M.; Kveton, V. Spatial Patterns of Transport Accessibility and Traffic Load in Czechia: Towards a Typology of the New Road Infrastructure Impacts. J. Maps 2022, 18, 33–42. [Google Scholar] [CrossRef]
- Monteiro, J.; Sousa, N.; Natividade-Jesus, E.; Coutinho-Rodrigues, J. Benchmarking City Layouts—A Methodological Approach and an Accessibility Comparison between a Real City and the Garden City. Sustainability 2022, 14, 95029. [Google Scholar] [CrossRef]
- Yin, L.; Patterson, K.; Silverman, R.; Wu, L.; Zhang, H. Neighbourhood Accessibility and Walkability of Subsidised Housing in Shrinking US Cities. Urban Stud. 2022, 59, 323–340. [Google Scholar] [CrossRef]
- Lee, S.A.; Ju, Y.J.; Lee, J.E.; Hyun, I.S.; Nam, J.Y.; Han, K.-T.; Park, E.-C. The Relationship between Sports Facility Accessibility and Physical Activity among Korean Adults. BMC Public Health 2016, 16, 893. [Google Scholar] [CrossRef] [Green Version]
- Xiao, T.; Ding, T.; Zhang, X.; Tao, Z.; Liu, Y. Spatial Accessibility to Sports Facilities in Dongguan, China: A Multi-Preference Gaussian Two-Step Floating Catchment Area Method. Appl. Spat. Anal. Policy 2022, 15, 1093–1114. [Google Scholar] [CrossRef]
- Higgs, G.; Langford, M.; Norman, P. Accessibility to Sport Facilities in Wales: A GIS-Based Analysis of Socioeconomic Variations in Provision. Geoforum 2015, 62, 105–120. [Google Scholar] [CrossRef] [Green Version]
- Pinto, L.V.; Santos Ferreira, C.S.; Inacio, M.; Pereira, P. Urban Green Spaces Accessibility in Two European Cities: Vilnius (Lithuania) and Coimbra (Portugal). Geogr. Sustain. 2022, 3, 74–84. [Google Scholar] [CrossRef]
- Liang, H.; Chen, D.; Zhang, Q. Walking Accessibility of Urban Parks in a Compact Megacity. Proc. Inst. Civ. Eng. Urban Des. Plan. 2017, 170, 59–71. Available online: https://www.icevirtuallibrary.com/doi/abs/10.1680/jurdp.16.00030 (accessed on 8 October 2022). [CrossRef]
- Fishman, E.; Cherry, C. E-Bikes in the Mainstream: Reviewing a Decade of Research. Transp. Rev. 2016, 36, 72–91. Available online: https://www.tandfonline.com/Fdoi/abs/10.1080/01441647.2015.1069907 (accessed on 8 October 2022). [CrossRef]
- Liu, Q.; Zhao, P.; Xiao, Y.; Zhou, X.; Yang, J. Walking Accessibility to the Bus Stop: Does It Affect Residential Rents? The Case of Jinan, China. Land 2022, 11, 860. [Google Scholar] [CrossRef]
- Yuan, Y.; Li, Z.; Liang, H. Selection and Spatial Layout of Urban Sports Facilities Guided by Residents’ Demand. Open House Int. 2019, 44, 9–12. [Google Scholar] [CrossRef]
- Jiang, Y.; Wang, C.; Zhao, H.; Sun, D.; Shi, Z.; Xia, J. Spatial Distribution Characteristics of Public Fitness Venues in the Main Urban Area of Dalian from the Perspective of Urban Accessibility. Sustainability 2022, 14, 12728. [Google Scholar] [CrossRef]


| Data Name | Data Description | Data Sources |
|---|---|---|
| Data of public fitness venues | name, area and location | Jinan Sports Burea (http://jnstyj.jinan.gov.cn/,accessed on 11 August 2022), Baidu map (https://www.baidu.com/, accessed on 20 August 2022) |
| Jinan Road network data | Road name, road distribution | Openstreet map (https://www.openstreetmap.org, accessed on 13 September 2022) |
| Data of Jinan main urban area | Main urban boundary | Resource and Environmental Sciences and Data Center (https://www.resdc.cn/, accessed on 11 September 2022) |
| Road | Speed (km/h) | Road | Speed (km/h) |
|---|---|---|---|
| Motorway | 100 | Primary_link | 40 |
| Motorway_link | 40 | Secondary | 50 |
| Trunk | 70 | Secondary_link | 40 |
| Trunk_link | 40 | Tertiary | 45 |
| Primary | 55 | Tertiary_link | 40 |
| District | Tianqiao | Lixia | Shizhong | Changqing | Licheng | Huaiyin |
|---|---|---|---|---|---|---|
| Quantity | 563 | 222 | 610 | 585 | 612 | 308 |
| Sports area (km2) | 0.08 | 0.03 | 0.09 | 0.08 | 0.09 | 0.15 |
| District | Huaiyin | Tianqiao | Shizhong | Changqing | Lixia | Licheng |
|---|---|---|---|---|---|---|
| The resident population | 675,048 | 718,024 | 903,714 | 595,549 | 819,139 | 1,112,022 |
| Public fitness area (m2) Per capita site area (m2) | 150,666 0.22 | 84,433 0.12 | 94,698 0.10 | 77,077 0.13 | 26,919 0.03 | 89,498 0.08 |
| The City Name | Urban Area/(km2) | Site Area (km2) | The Service Area/(km2) | Service Area Ratio/(%) | ||||
|---|---|---|---|---|---|---|---|---|
| 0–5 | 0–10 | 0–15 | 0–5 | 0–10 | 0–15 | |||
| Tianqiao District | 261.58 | 0.08 | 19.88 | 33.44 | 44.95 | 7.60 | 12.79 | 17.19 |
| Lixia District | 101.29 | 0.03 | 12.34 | 22.82 | 32.86 | 12.18 | 22.54 | 32.45 |
| Shizhong District | 290.01 | 0.09 | 24.03 | 41.15 | 58.45 | 8.29 | 14.19 | 20.16 |
| Changqing District | 1217.54 | 0.08 | 10.19 | 16.92 | 22.93 | 0.84 | 1.39 | 1.88 |
| Licheng District | 1312.41 | 0.09 | 24.66 | 44.23 | 65.77 | 1.88 | 3.37 | 5.01 |
| Huaiyin District | 151.72 | 0.15 | 11.35 | 20.38 | 30.55 | 7.49 | 13.45 | 20.16 |
| The City Name | Urban Area (km2) | Site Area (km2) | The Service Area/(km2) | Service Area Ratio/(%) | ||||
|---|---|---|---|---|---|---|---|---|
| 0–5 | 0–10 | 0–15 | 0–5 | 0–10 | 0–15 | |||
| Tianqiao District | 261.58 | 0.08 | 50.45 | 67.86 | 81.03 | 19.29 | 25.95 | 30.99 |
| Lixia District | 101.29 | 0.03 | 42.00 | 63.04 | 78.48 | 41.48 | 62.25 | 77.50 |
| Shizhong District | 290.01 | 0.09 | 73.69 | 141.76 | 183.22 | 25.42 | 48.90 | 63.20 |
| Changqing District | 1217.54 | 0.08 | 29.89 | 91.76 | 188 | 2.46 | 7.54 | 15.44 |
| Licheng District | 1312.41 | 0.09 | 92.82 | 213.2 | 312.2 | 7.07 | 16.25 | 23.79 |
| Huaiyin District | 151.72 | 0.15 | 41.44 | 82.84 | 112.73 | 27.34 | 54.66 | 74.38 |
| The City Name | Urban Area/(km2) | Site Area (km2) | The Service Area/(km2) | Service Area Ratio/(%) | ||||
|---|---|---|---|---|---|---|---|---|
| 0–5 | 0–10 | 0–15 | 0–5 | 0–10 | 0–15 | |||
| Tianqiao District | 261.58 | 0.08 | 72.55 | 112.22 | 148.01 | 27.74 | 42.92 | 56.60 |
| Lixia District | 101.29 | 0.03 | 77.60 | 101.29 | 101.29 | 76.63 | 100 | 100 |
| Shizhong District | 290.01 | 0.09 | 162.94 | 248.61 | 262.57 | 56.20 | 85.75 | 90.57 |
| Changqing District | 1217.54 | 0.08 | 122.66 | 398.14 | 611.69 | 10.07 | 32.70 | 50.24 |
| Licheng District | 1312.41 | 0.09 | 289.99 | 613.36 | 826.92 | 22.10 | 46.74 | 63.01 |
| Huaiyin District | 151.72 | 0.15 | 119.05 | 136.82 | 139.6 | 78.55 | 90.27 | 92.11 |
| 0–5 min | 0–10 min | 0–15 min | |
|---|---|---|---|
| Walking trips | 3.07 | 5.36 | 7.66 |
| Cycling trips | 9.91 | 19.80 | 28.67 |
| Car travel | 25.33 | 48.30 | 62.69 |
| Tianqiao | Lixia | Shizhong | Changqing | Licheng | Huaiyin | |
|---|---|---|---|---|---|---|
| Population | 718,024 | 819,139 | 903,714 | 595,549 | 1,112,022 | 675,048 |
| GDP (billion) | 64.256 | 191.04 | 116.17 | 37.19 | 116.6 | 70.11 |
Disclaimer/Publisher’s Note: The statements, opinions and data contained in all publications are solely those of the individual author(s) and contributor(s) and not of MDPI and/or the editor(s). MDPI and/or the editor(s) disclaim responsibility for any injury to people or property resulting from any ideas, methods, instructions or products referred to in the content. |
© 2022 by the authors. Licensee MDPI, Basel, Switzerland. This article is an open access article distributed under the terms and conditions of the Creative Commons Attribution (CC BY) license (https://creativecommons.org/licenses/by/4.0/).
Share and Cite
Jiang, Y.; Liu, Y.; Liu, Z.; Wang, C.; Shi, Z.; Zhao, H.; Sun, D.; Sun, W.; Wang, X. Spatial Distribution Characteristics of Public Fitness Venues: An Urban Accessibility Perspective. Sustainability 2023, 15, 601. https://doi.org/10.3390/su15010601
Jiang Y, Liu Y, Liu Z, Wang C, Shi Z, Zhao H, Sun D, Sun W, Wang X. Spatial Distribution Characteristics of Public Fitness Venues: An Urban Accessibility Perspective. Sustainability. 2023; 15(1):601. https://doi.org/10.3390/su15010601
Chicago/Turabian StyleJiang, Yong, Yangyang Liu, Zelei Liu, Chunwei Wang, Zhipeng Shi, Hongbo Zhao, Dongqi Sun, Wei Sun, and Xiangquan Wang. 2023. "Spatial Distribution Characteristics of Public Fitness Venues: An Urban Accessibility Perspective" Sustainability 15, no. 1: 601. https://doi.org/10.3390/su15010601