Article

Potential Efficiency of Wild Plant Species (Pluchea dioscoridis (L.) DC.) for Phytoremediation of Trace Elements on Contaminated Locations

1
Department of Botany and Microbiology, Faculty of Science, Sohag University, Sohag 82524, Egypt
2
Department of Agricultural Chemistry and Environmental Biogeochemistry, Poznan University of Life Sciences, ul. Wojska Polskiego 71F, 60-625 Poznan, Poland
*
Author to whom correspondence should be addressed.
Sustainability 2023, 15(1), 119; https://doi.org/10.3390/su15010119
Submission received: 9 October 2022 / Revised: 14 December 2022 / Accepted: 19 December 2022 / Published: 21 December 2022
(This article belongs to the Special Issue Sustainable Cities and Regions – Statistical Approaches)

Abstract

:
The current study outlines the potential of wild plant species (Pluchea dioscoridis (L.) DC.) for the phytoremediation of trace elements (TEs) such as Pb, Cd, Zn, Mn, and Cu at various contaminated locations: an industrial area (S1); a residential area with a high traffic load (S2); and a rural area (S3). Data showed that the photosynthetic pigments and flavonoids decreased significantly at S1, at which TEs accumulated with high concentrations. This drop in chlorophyll concentration reflects foliar damage caused by TE contamination. The carotenoids/chlorophyll index (Car/Chl) ratio showed non-significant variations for all studied spheres. High values of chlorophyll ratio (a/b) were also recorded in plant leaves which faced TE stress. The translocation factors (TF); enrichment coefficient for root (ECR); and shoot (ECS) varied clearly among the TEs as well as the studied sites, proving the ability of the plant to carry out phytoremediation of Pb, Cd, and Zn. The highest values of the metal accumulation index (MAI) were recorded at S1. Significant positive correlations for the pairs Cd and Pb in soil versus P. dioscoridis tissues indicated its usefulness as a phytoextraction strategy for these elements. The management of residential and rural areas should be exploiting the natural wild phytoremediation potential of this plant.

1. Introduction

Increased urbanization activities globally, together with a growing transport infrastructure and traffic volume, are the main sources of water, soil, and air pollution with toxic trace metals (TEs). The injuries from direct/indirect exposure to TEs are endless, and are mainly due to the excessive accumulation of TEs in the environment [1,2,3]. Phytoremediation is an eco-friendly green technology in which plants has the capability and capacity to accumulate pollutants effectively and, accordingly, can grow in contaminated regions successfully [4,5,6,7]. In recent decades, trace metals have been investigated, and a large amount of results have been published on this point. In addition, significant evidence indicates that TE phytoremediation has evolved as one of the most dynamic fields of development [8]. The phytoremediation of TE-polluted habitats has, lately, progressed from the identification of hyperaccumulator plants to the study of the internal growth and development mechanisms of plants [9,10]. For example, plant growth and different physiological activities within the plants’ cells differ significantly when exposed to harsh environmental stresses [11,12,13]. The exposure of some plants to TE stress may lead to inhibition in the photosynthetic capacity within the plant cells due to the deterioration of chloroplasts, which, in turn, negatively affects the metabolic pathways. The capacity of plants to adjust their photosynthesis systems under severe TE stress is considered a characteristic of TE stress tolerance [14,15]. Another tolerance characteristic of TE stress is the accumulation of alkaloids and flavonoids, which are represented by their ability to chelate metal ions transmission and inhibit the formation of reactive oxygen species (ROS), which helps to overcome oxidative stress [16,17].
P. dioscoridis (L.) DC. is an important wild evergreen shrub that grows to a height from one to three meters. It has hairy and glandular surfaces and is densely branching. It is common throughout the Middle East and neighboring African countries. In Egypt, it is abundant throughout the Nile area, western desert oasis, Mediterranean coastal strip, Eastern Desert, and Sinai Peninsula [18]. In general, wetland locations, damp settings, abandoned fields, demolished houses, depressions along highways and railways, and abandoned fields are all regions where it can be found [19]. It was recently recorded in urban areas in the Nile Delta, including residential areas, highways, and wastelands. P. dioscoridis is known as the “mosquito tree” in Egypt because of its insect-repelling properties [20]. Residential areas include a high rate of human activities that may negatively affect the ambient air quality, such as cutting and digging works. Using a phytoremediation strategy as an alternative solution in these circumstances can create a sustainable environment. Also, the use of phytoremediation as a solution will not corrupt the structure and texture of the polluted soil. Consequently, P. dioscoridis was selected for phytoremediation in this study.
The phytochemistry, ecology, and distribution of wild plants in metal-contaminated areas in Egypt have been previously studied [21]. Pluchea dioscoridis (L.) DC. belongs to the family Asteraceae [20]. It is a perennial invasive weed that has various important considerations at the medicinal and ecological levels. P. dioscoridis has been recorded as a weed in Egypt’s desert reclaimed lands and abandoned fields. Many studies have declared the ability of P. dioscoridis to stabilize TEs such as Cu, Pb, Cd, and Zn, and could be considered a biomonitor and bioindicator for Pb and Cd pollution [21]. Many allelopathic, herbicidal, and larvicidal effects of P. dioscoridis have been recorded [22,23]. Medicinally, it is commonly used to treat rheumatic pains, children’s epilepsy, colic, ulcers, and colds, as well as having carminative effects [24]. Its extract has anti-diarrheal, anti-inflammatory, antimicrobial, and anti-nociceptive properties [25,26,27].
The aim of this work was to test the phytoremediation efficiency of P. dioscoridis, one of the most common wild species in Sohag Governorate (Egypt). The TEs that were tested were Cd, Mn, Cu, Pb, and Zn, the most common pollutants in the studied area. The plant species were collected as they are naturally occurring in the studied area so that they may have been well-adapted species to deal with TE-induced stress.

2. Materials and Methods

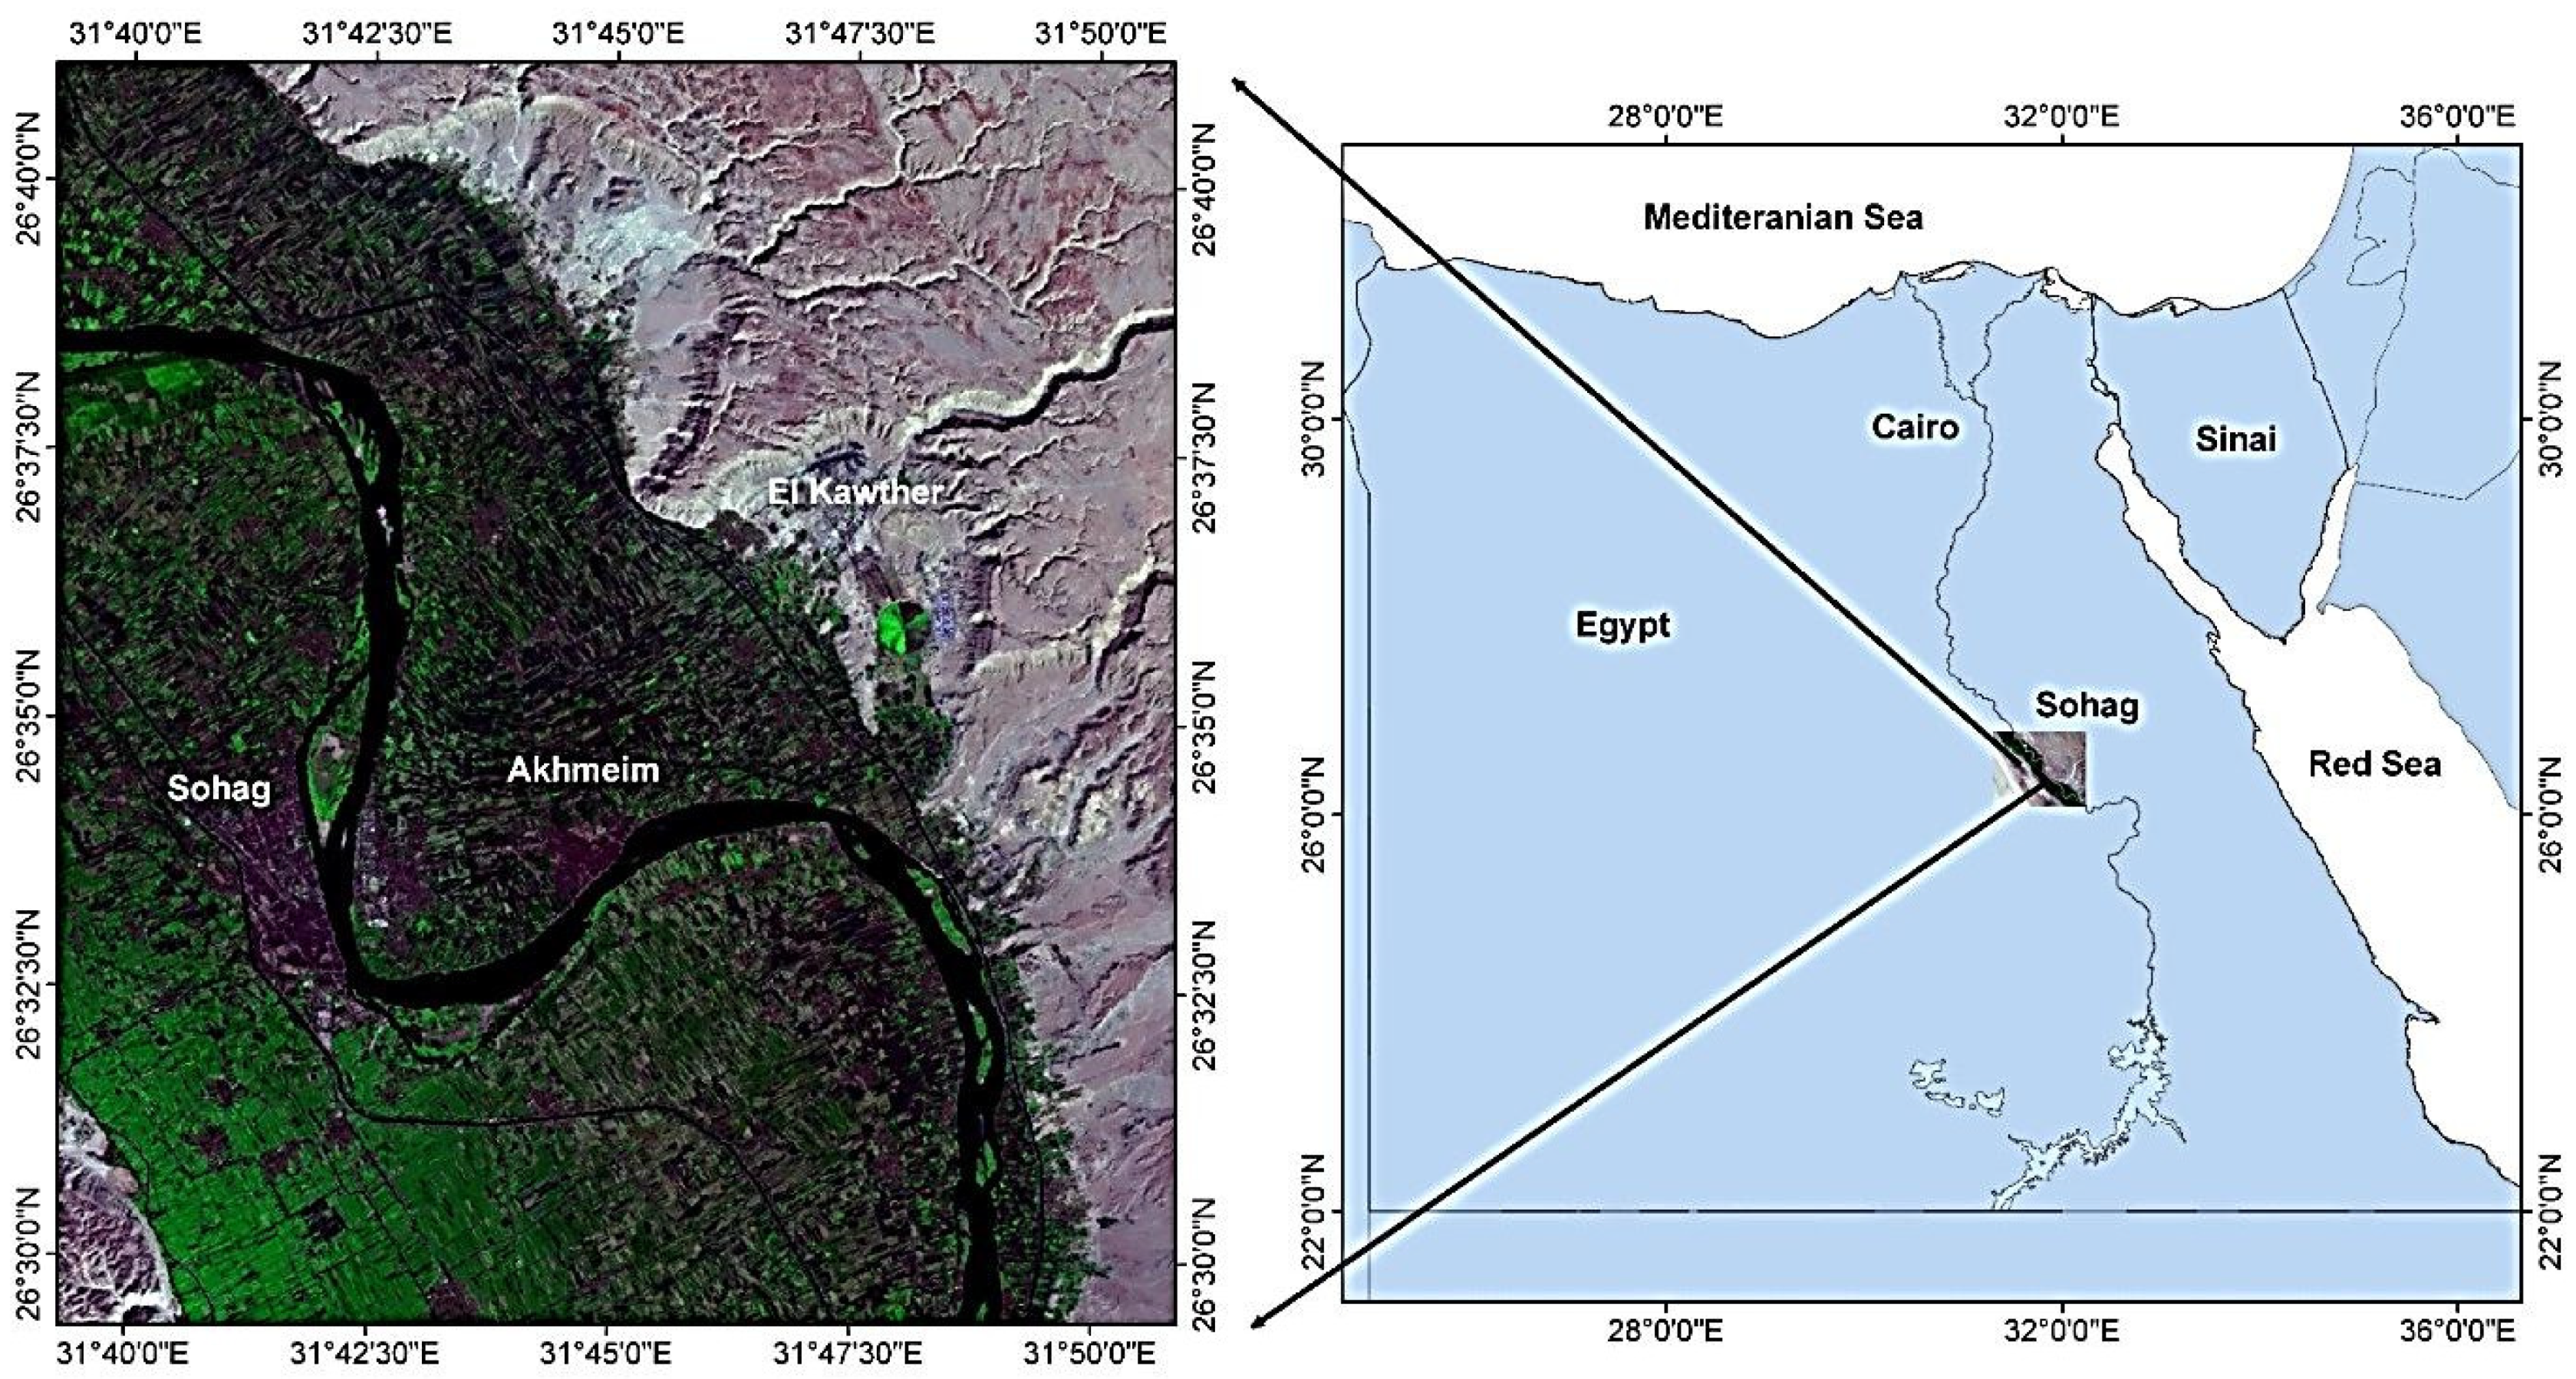
2.1. Description of the Study Area

The current research was conducted mainly in Sohag Governorate’s residential districts, in Egypt (from latitude 26°6′54″ to 27°9′26″ N and from longitude 31°13′18″ to 32°36′50″ E). In the Nile Valley, Sohag Governorate is located between Cairo and Aswan. The total area is 1574 km2. It stretches over 125 km along the River Nile’s banks, with widths ranging from 16 to 25 km. In the Sohag Governorate, seasonal rainfall ranges from 0 mm in the summer to 0.3 mm in the winter. In spite of such dry a desert climate, rainfall may occur suddenly at an extreme rate [28]. In general, the climate of Sohag is warm, with an average annual minimum temperature of 13.2 °C in January and a maximum temperature of 42 °C in June. Relative humidity ranges from 45% to 60% in winter and 25% to 35% in summer, with an annual average of about 40%. (https://globalweather.tamu.edu/database, 2016–2017).
The main anthropogenic activities in the study areas are urbanization, the use of automobiles, and the use of different industrial materials including paints, plastics, fertilizers, and untreated waste(industrial and agricultural). For the current study, three residential areas in Sohag Governorate were selected (Figure 1). The first site (S1) is an industrial zone of Sohag Governorate (El-Kawther district); the second site (S2) is a residential area with heavy traffic load (Akhmiem town); to the third site is a rural zone with low pollution level (University Garden, Sohag city, S3). The first site (S1) was 8.4 km from the second site (S2) and 15.2 km from the third site (S3), while the distance between the second and the third sites was 5.3 km. Each site is divided into 10 permanent quadrates (each 10 m × 10 m). All samples in the three locations were collected during the same period of the growing season of the plant.

2.2. Growth Parameters

For leaf area (LA), specific leaf area (SLA), and water content (WC) estimation, leaves of P. dioscoridis were cut off from each site at a height of 1.3–2.0 m above the ground, while wearing polyethylene gloves. Care was also taken to avoid defective leaves such as those with bird droppings, insect invasion, or pesticide treatment [29]. The collected leaves were stored in plastic bags and taken to the laboratory for further analysis. According to Ref. [30], leaf area was measured (LA, cm2) using a Leaf Area Meter (CI-202 Portable Laser Area Meter, USA). Specific leaf area (SLA, cm2/g) was calculated as leaf area ratio to leaf dry weight [31].
Relative water content (RWC) was determined according to the method described in Ref. [32]. Plant leaves were weighed as soon as they were sampled. The leaves were submerged in water overnight, then wiped dry and weighed again to determine turbid weight. To obtain the constant dry weight, the turbid leaves were dried in an oven at 95 °C for 24 h. The relative water content was calculated using the following formula:
Relative water content (RWC) (%) = (FW − DW)/(TW − DW) × 100
where FW expresses fresh weight; DW is dry weight, and TW is turbid weight.

2.3. Shoot Biomass Estimation

For shoot biomass estimation, 15 healthy individuals of P. dioscoridis were randomly chosen from each site. Each individual was cut on a root collar to estimate shoot biomass. Stems, leaves, and flowers were separated from the shoot sample. Control samples were prepared with the same steps. To make the weighing process easier, the stem was separated into smaller sections. For each individual, all shoot compartments were collected, and an electronic balance was used to determine the field fresh weight (FW). For DW estimation, each shoot compartment was oven-dried at 95 °C until it reached a consistent dry weight (DW). The fresh and dry weights of the shoot parts were determined according to Ref. [22].

2.4. Root Biomass Estimation

The roots of the 15 healthy individuals of P. dioscoridis in each site had a long taproot that grew vertically, as well as numerous thinner lateral roots that were likely exposed to the wind [33]. Therefore, the current work focused only on sampling coarse roots (diameter > 2 mm), while fine roots (diameter < 2 mm) have been excluded due to loss during excavation. All coarse roots were cut using a hand saw, were collected, and the field FW of each individual was measured using an electronic balance. The collected coarse root subsamples were transported to the laboratory and oven-dried (95 °C) until a constant DW was reached. The dry weight of coarse roots in all individuals and control samples was measured according to Ref. [21].

2.5. Estimation of Pigments, Alkaloids and Flavonoids

In each site, 10 quadrats (each 10 m × 10 m) were chosen. Six individuals were randomly selected in each quadrate. Three medium-sized leaves were collected from the six selected individuals. Photosynthetic pigments were evaluated by UV spectrophotometry (LAMBDA 850+ UV/Vis) at 645 nm and 663 nm [34]. A total of 0.2 g fresh leaf tissue was ground in acetone (80%) and then filtered through Whatman No. 1 filter paper. The different photosynthetic pigment concentrations (Chl a, Chl b, Chl a + b, and Car.) were estimated as milligrams per gram fresh weight (mg/g f.w) following the standard equations:
Chl a (mg/g) = [(12.7 × A663) − (2.6 × A645)] × ml acetone/mg leaf tissue
Chl b (mg/g) = [(22.9 × A645) − (4.68 × A663)] × ml acetone/mg leaf tissue
Total chlorophyll content (mg/g) = Chl a + Chl b
The ratios of Chl a/b and Car/Chl were also estimated.
Flavonoids were determined using the Bohm and Kocipai-Abyazan techniques [35]. At room temperature, 1.0 g of the plant material was extracted with 100 mL of aqueous methanol (80%) prepared v/v as 20% water and 80% methanol. The solution was filtered through Whatman filter paper No. 42. The filtrate was transferred to a crucible and evaporated into dryness over a water bath and weighed to a constant weight. For alkaloid determination, 5 g of dried plant tissue was weighed, followed by adding 200 mL aqueous solution (v/v), of 10% acetic acid in ethanol (100%), then left to stand for 4 h before filtration. The filtrate was concentrated to one-quarter of its original volume in a water bath. The final extract was treated with drops of concentrated ammonium hydroxide (NH4OH). The produced precipitate was allowed to settle, then was collected, washed with dilute ammonium hydroxide (NH4OH), and filtered. The residue was dried and weighed [36].

2.6. Proline and Soluble Carbohydrates Estimation

The acid ninhydrin assay was used for Proline content estimation [37]. A total of 0.1 gm of leaf tissue powder was mixed with 3% (w/v) 5-sulfosalicylic acid. For full extraction, it was vortexed for 5 min at 1 min intervals. After extraction, the samples were centrifuged at 13,000 rpm for 10 min, and then the supernatants were transferred to clean tubes and spun again. A total of 15 µL of 3.0 M Na-acetate and 200 µL ninhydrin solution 0.15% (w/v) ninhydrin in glacial acetic acid were added to the supernatants. The background absorbance of proline was detected at 352 nm.
The phenol-sulfuric acid method [38] used for total water-soluble carbohydrate determination involved adding 1 mL of 5% phenol solution and 5 mL of concentrated sulfuric acid to 200 µL of the samples. The absorbance was detected at 510 nm. Sucrose was used as standard.

2.7. Plant Analysis for NPK and TEs

For the determination of N, P, and K, plant shoots and roots were rinsed with tap water many times, followed by washing with distilled water and deionized water twice. They were then oven-dried to constant weights at 60 °C for 48 h. The dried samples were ground and passed through a sieve (2 mm mesh size). According to Refs. [39,40], a mixture of HClO4, HCl, and H2SO4 5:1:1 (v/v) was added to 0.50 g powdered sample for digestion in a metal digestion apparatus (HotBlock, VELP Scientifica, DK8s, Italy). After complete digestion, samples were left to cool at room temperature, filtered through filter paper (Whatman No. 42), and, finally, the sample volume was completed to 25 mL with distilled water. Total phosphorus (P) was quantified by following the method reported by Jackson (1958) based on the molybdenum blue technique. Total nitrogen (N) was detected by the micro-Kjeldahldahll technique, and total potassium (K) was determined by the methods described by Refs. [39,40], based on the flame photometer technique.
According to the method described in Ref. [41] and modified by Ref. [42], after drying and homogenization, plant samples were digested in an acid mixture of HCl and HNO3 (aqua regia (AQ) at a 3:1 ratio (v/v). In a 25 mL beaker, 0.50 g of tissue powder was weighed. A total of 1 mL HNO3 was added to 3 mL HCl, then an additional 1 mL HNO3 was added to the plant sample, which was heated for digestion for at least 3 h, or until brown fumes ceased emerging, indicating full digestion. After cooling, the sample was filtered into a 25 mL volumetric flask using an acid-resistant filter (Whatman filter No. 42), made to the mark with 2% HNO3, and stored at 4 °C until analysis. A blank sample was prepared with the same volumes of acids but without a plant sample. Inductive Coupled Plasma Optic Emission Spectroscopy (ICP-OES, Perkin Elmer 8000 Optima) was used to determine the absorptions of TEs (Cu, Pb, Cd, Zn, and Mn).

2.8. Soil Sampling and Analysis

Three representative soil samples were collected from each site for the 0–50 cm topsoil. pH value of the soil samples was measured using a pH meter and electrode (PHS-3B) according to the method used in Ref. [21] in a 1:1 (v/v) soil/water mixture (5 g NCR-13 soil scoop/5 mL DI water).
Total N, P, and K were determined using the method of Refs. [39,40] as illustrated previously in the plant analysis section. Soil samples were collected randomly from the studied sites, air-dried, and ground, then sieved through an 80-mesh sieve. The concentration of N was detected at 440 nm. The molybdenum blue phosphorus technique was used to determine the concentration of P at 660 nm. The turbidimetric technique with sodium tetraphenylboron, NaB(C6H5)4, was used to determine the concentration of K in soil samples by laboratory turbidimeter (LTC3000w).
For the detection of TEs in soil samples, the method described in Refs. [41,42] was used. After drying and grinding of soil samples, 10 mL of 65% nitric acid was added to 0.5 gm of soil sample. The solution was left at room temperature for 12 h, then at 100 °C for 4 h, and, finally, for 4 h at 140 °C until the color of the solution became clear. After cooling, the solution was then diluted to 50 mL with ultrapure deionized water and filtered through 0.42 L Whatman filter paper. Cu, Pb, Cd, Zn, and Mn were ermined using ICP-OES (Perkin Elmer 8000 Optima, PerkinElmer, Waltham, MA, USA). Each sample was digested three times.

2.9. BCF, TF, ECS, ECR, and MAI Calculation

Bioconcentration factors (BCF) were estimated by dividing the TE concentration into plant parts by those in soil from respective locations.
Bioconcentration Factors (BCF) = TEs plant/TEs soil
where TEs plant and TEs soil represent the TEs concentration in extracts of plants and soils, respectively, grown in the contaminated environment [43]. A value of BCF above 1 indicates a higher uptake of TEs in crop/plant than in soil, while a BCF of less than 1 means more TE concentration in soil than was taken up by plants.
The translocation factors (TF) were described as the proportion of TEs in the shoot to those in the root. TF was calculated according to Ref. [43]:
Translocation factors (TF) = TEs shoot/TEs root
where TEs shoot and TEs root are the trace metal concentrations in the plant shoot and root, respectively.
Metal enrichment coefficients (ECS) were utilized to investigate both metal accumulation and transport from the soil to plant organs. The enrichment coefficient of the root (ECR) and the enrichment coefficient of the shoot (ECS) are the main two types of enrichment coefficients [44].
The coefficients were calculated as follows:
ECS = TEs concentration in the shoot/TEs concentration in the soil
ECR = TEs concentration in the root/TEs concentration in the soil
Mohotti et al. [45] stated that plants with BCF value > 1.0 are fitted for phytoextraction, while Cheraghi et al. [46] reported that plants with ECR > 1 and TF < 1 have the potential for phytostabilization.
The method described in Ref. [3] was used to calculate the metal accumulation index (MAI). MAI was used to detect the TE accumulation efficiencies of the plants using the standard formula;
MAI = (1/N) ⋅ Σ ⋅ IJ; IJ = X/δ ⋅ X
where N shows the total number of trace elements studied, and IJ is the sub-index of J gained by dividing the metal concentration (X) by its standard deviation (δX).

2.10. Data Analysis

The recorded data were analyzed using One-way ANOVA with Post Hoc Tukey test (version 22.0) using SPSS (IBM Corp., Armonk, NY, USA). To assess the relationship between concentrations of TEs in soils, roots, and shoots, Pearson’s correlation relationship analysis (r values) was calculated.

3. Results

3.1. Growth Parameters

The results recorded in Table 1 show a drastic impact of the accumulation of trace elements on the SLA, LA, and RWC of P. Dioscorides. The SLA value in leaves collected from S1 was 51.76 cm2/g d.w., and was followed by values of leaf samples collected from S2 (high traffic site) with the value of 61.40 cm2/g d.w. The same trend of results was reported for LA. Accordingly, LA recorded the lowest measured value in the leaf samples collected from S1 with a value of 3.47 cm2, while the highest LA values were recorded in samples collected from S3 with a value of 6.42 cm2. For the results of relative water content (RWC), the highest value was recorded at 276.81% in the leaf samples collected from S3 (Table 1), while the lowest value was recorded in the leaf samples of S1 with a value of 122.76%.

3.2. Estimation of the Shoot and Root Biomass

The obtained results, shown in Table 2, revealed that a high accumulation of TEs has a significant impact (p ≤ 0.05) on both the fresh and dry weights of shoot and root. The trends of both shoot and root biomass were similar (Table 1), with lower values at S1 compared to the other two sites. It should be mentioned that, at S1, the accumulation of TEs was higher in shoots and roots than for other sites. The lowest FW values of shoot parts (leaf, stem, and flower) in addition to root were recorded as 6.18, 19.59, 2.32, and 11.04 g, respectively, compared to control samples (9.17, 27.45, 16.3, and 3.62 g). The same results were detected for Dw for the same organs, with values of 4.67, 17.83, 2.11, and 9.7 g, respectively, compared to control values (7.78, 25.75, 3.01, and 13.0 g).

3.3. Changes in Pigments, Alkaloids, and Flavonoids

The obtained results for Chl a, Chl b, Cars, total chlorophyll (a + b) and Chl a/b ratio, Car/Chl, alkaloids, and flavonoid contents in P. dioscoridis at all of the studied sites are summarized in Table 3. The results for all pigments showed a significant decrease at S1 compared to the two other sites. It should be noted that the TE accumulation was higher in P. dioscoridis shoots at S1 than in the two other sites. Chl b, similar to Chl a, showed a considerable reduction at S1 when compared to the rural site (S3). Carotenoids (Car) showed a considerable rise at S1, contrary to what was recorded for chl a and chl b. Car content was highest at 1.40 ± 0.04 mg/g f.w at S1 and lowest, with values of 1.28 ± 0.02 mg/g f.w, at S3.
In comparison to the control, the polluted sites showed a reduction in their total Chl content (a + b) (Table 3). The values of Chl (a + b) at S1 and S2 were 4.16 ± 0.81 and 3.85 ± 0.93 mg/g f.w, respectively, compared to the control value (4.86 ± 0.98 mg/g f.w). Meanwhile, the Chl a/b ratio showed a significant increase at S2 with a value of 2.70 ± 0.02, and at S1 for alkaloids with a value of 5 ± 0.24%. The differences in the results of the Car/Chl ratio at all three sites were non-significant (Table 3). S1 had the highest significant flavonoid value of 22.30 ± 2.438 mg/g f.w, indicating that the shoots had the highest TE accumulation at that site (Table 4).

3.4. Changes in Proline Content and Soluble Carbohydrate

The results shown in Table 3 indicate that the proline content of the P. dioscoridis sample at the contaminated site (S1 and S2) was increased compared to the control sample (S3). The highest proline content was observed (0.78 ± 0.11 mg/g d.w) at S2 compared to S3 (0.34 ± 0.013 mg/g d.w). Generally, the results indicated that Proline content showed a higher concentration at the site that was the most highly polluted with TEs. In contrast to the proline results, the data shown in Table 3 indicates that the levels of soluble carbohydrates in plants grown in contaminated areas under TE stress were significantly reduced compared to control samples. The lowest soluble carbohydrate content was recorded at S2 with a value of 82.43 ± 9.08 mg/g d.w.

3.5. Nutrients (NPK) and Trace Elements (TEs) Accumulation in Plant

Most nutrients and TEs in P. dioscoridis shoots and roots were significantly different between different plant organs rather than between sites (p > 0.05) (Table 4). The obtained results revealed that the concentrations of all examined nutrients (N, P, and K) were shown to be significantly higher in the shoots than in the roots of P. dioscoridis. The maximum concentrations of NPK in the shoots were detected at S1 with values of 3.24 ± 0.091 mg/kg for N, 0.444 ± 0.018 mg/kg for P, and 0.981 ± 0.061 mg/kg for K (Table 4). In the roots, N, P, and K concentrations were 2.241 ± 0.231, 0.669 ± 0.037, and 0.779 ± 0.053 mg/kg, respectively, at S1.
The obtained results, shown in Table 4, indicate that higher levels of TEs (Zn, Mn, and Cu) were accumulated in the roots of P. dioscoridis than in the shoots. In addition, the concentrations of Pb and Cd in the shoots were significantly higher than in the roots. In general, the largest accumulation of the TEs which were investigated was recorded at S1. The concentrations of Cd and Pb determined in shoots at the three sites were 329.0 ± 25.83, 211.0 ± 32.92, and 81.60 ± 11.76 mg/kg for Pb at S1, S2, and S3, respectively, and, for Cd 95.65 ± 9.90, 79.38 ± 11.36, and 46.09 ± 7.65 mg/kg, respectively, whereas results of Zn, Mn, and Cu showed the reverse trend. The mean values in the root and shoot ranged between 188.75 ± 16.3 and 174.0 ± 16.12 mg/kg for Cu; 125.85 ± 38.60 and 118.68 ± 28.54 mg/kg for Zn; and 295.0 ± 13.38 and 291.80 ± 17.75 mg/kg for Mn, respectively (Table 4).

3.6. Soil Analysis

The data shown in Table 5 indicate the values of pH, organic matter (OM), NPK, and TE concentrations in the soil samples. Most of the studied physicochemical parameters of the soil showed the highest values at S1, followed by S2. The pH values of soil samples from the three sites were slightly alkaline (7.23–8.43). The OM values were high at S1 (6.30 ± 0.35%) and decreased at S2 (2.60 ± 0.16%) and S3 (3.20 ± 0.25%). For sites, the Pb and Cd concentration values followed the sequence S2 > S1 > S3. For the values of Cu, Zn, and Mn, the sequence S1 > S2 > S3 was observed. The maximum TE concentrations at all P. dioscoridis sites followed the sequence Cu > Pb > Zn > Mn > Cd.

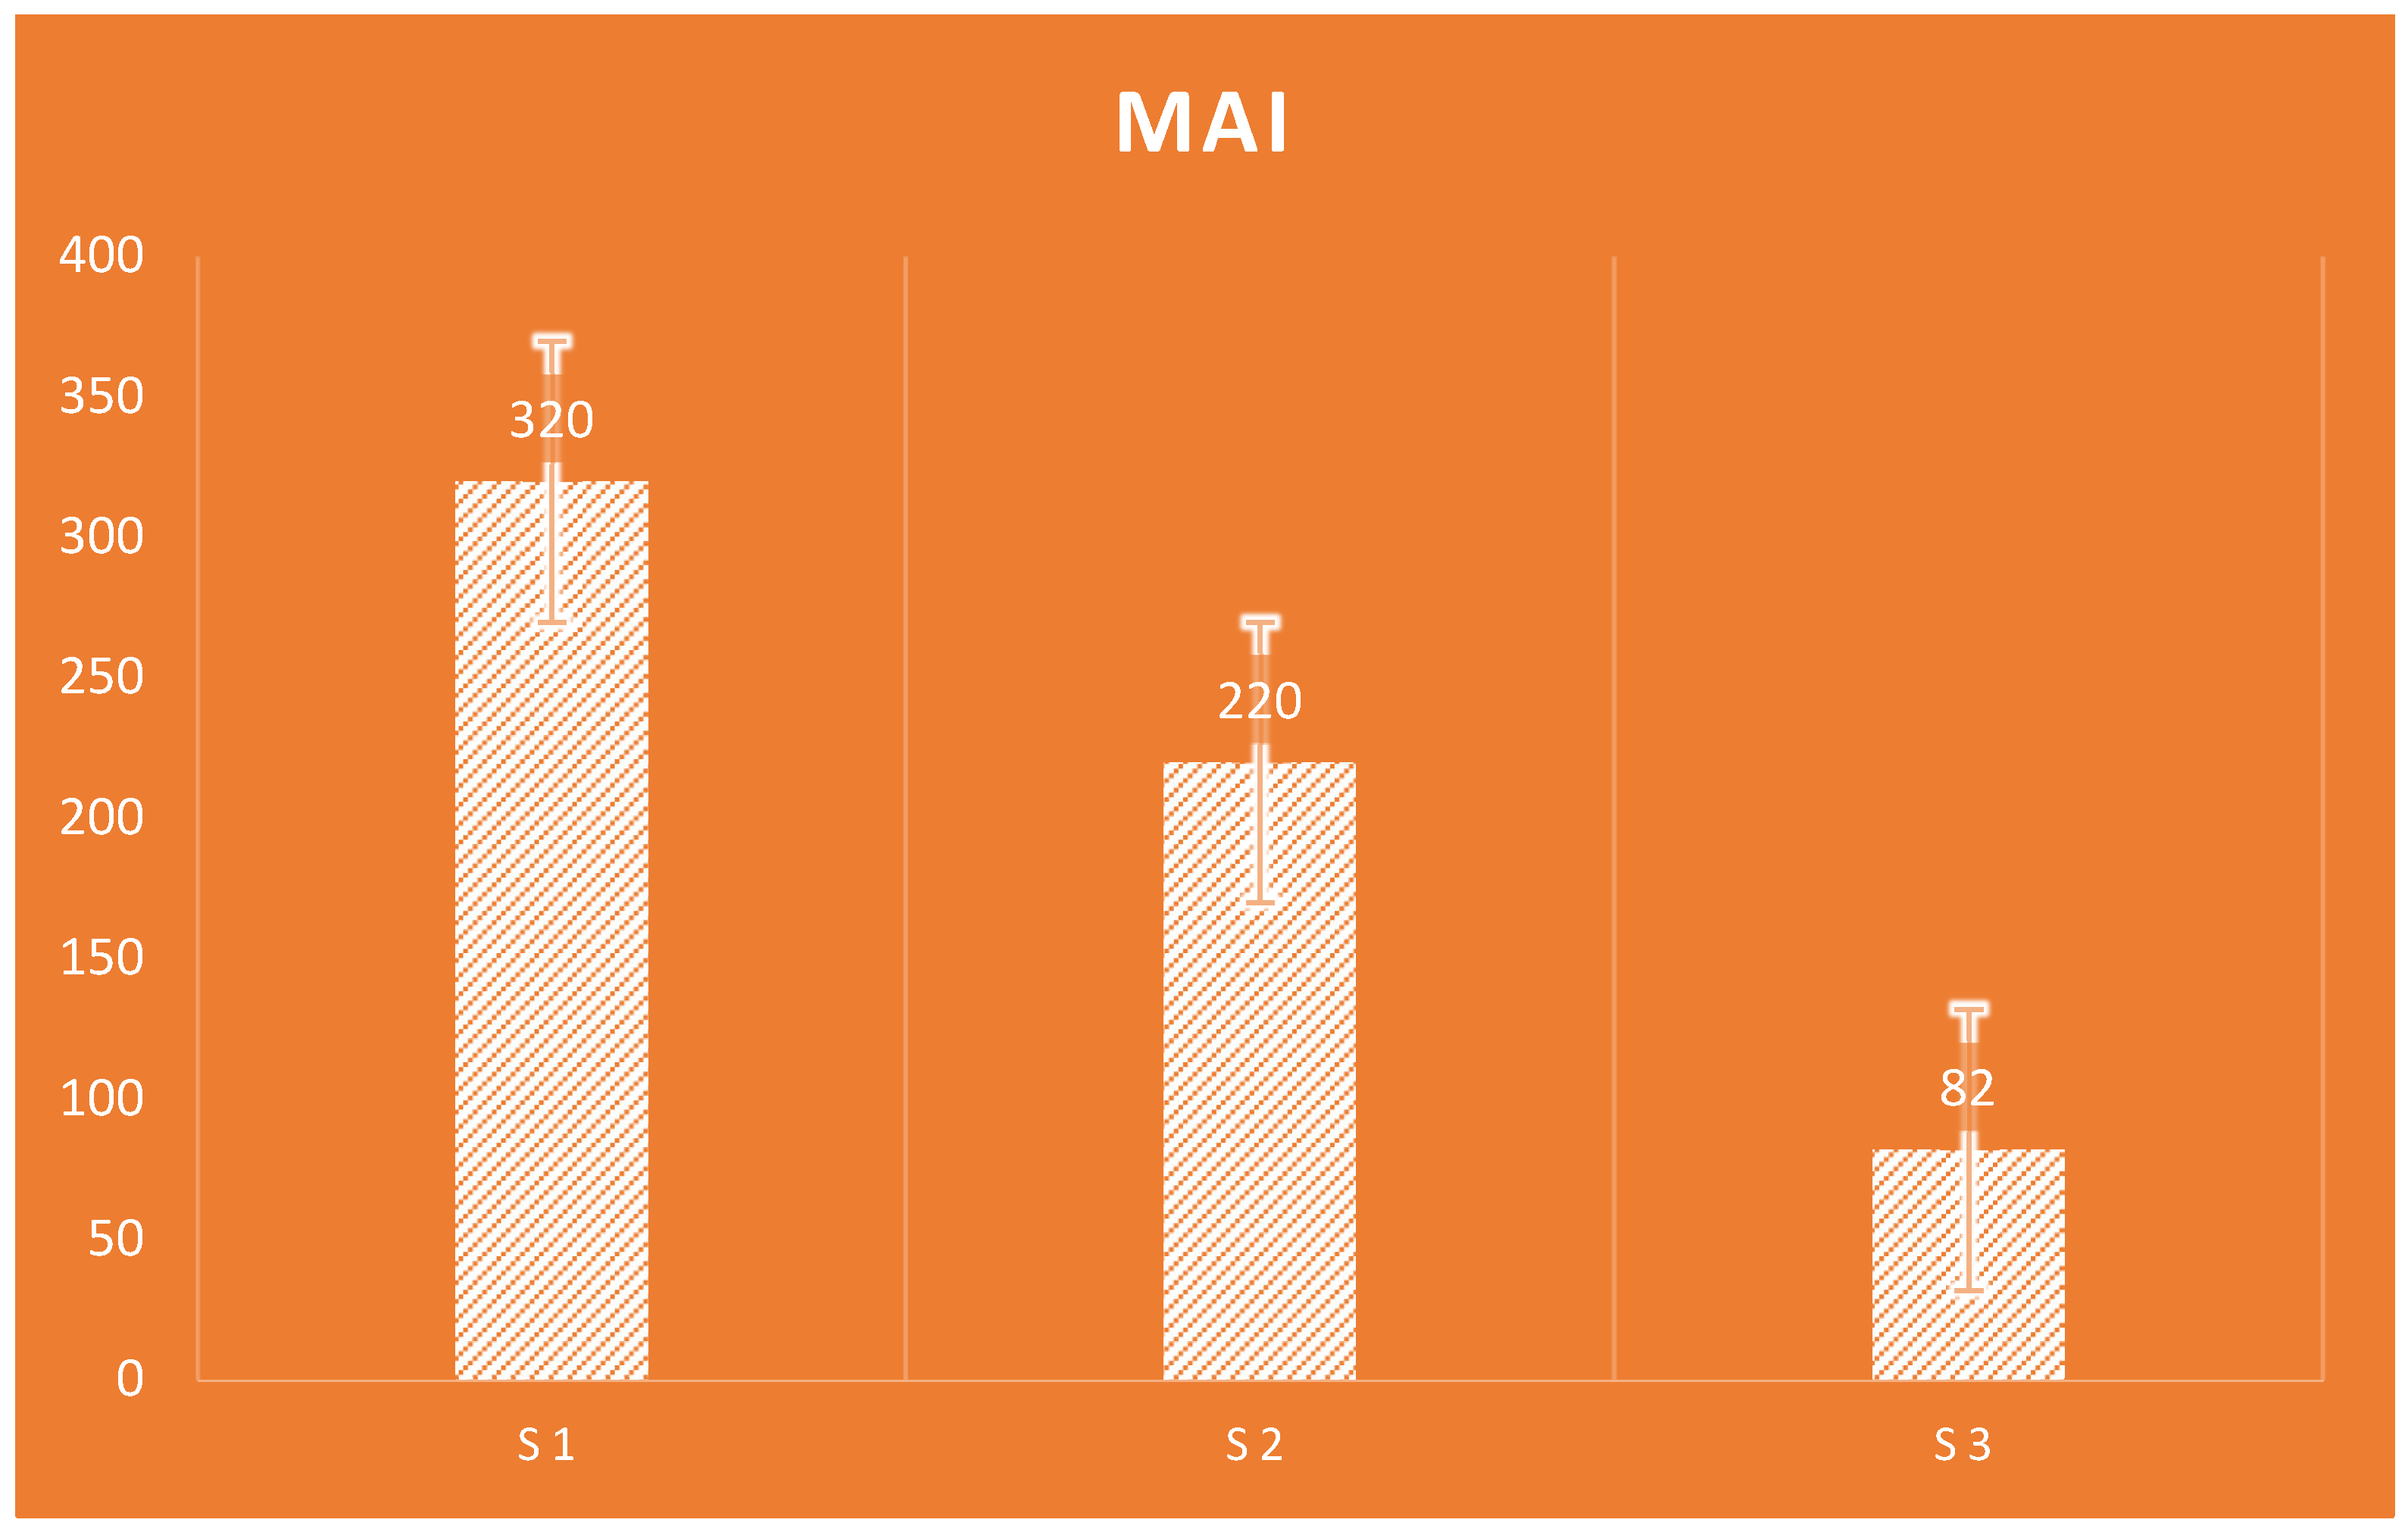
3.7. BCF, TF, ECS, ECR, MAI Indices

According to the obtained data. shown in Table 6, P. dioscoridis had a BCF > 1.0 for all of the examined TEs. P. dioscoridis had BCF values in the following order: Pb > Cd > Mn > Zn > Cu. In addition, Cu, Pb, Cd, Mn, and Zn had the opposite trend of BCF (values > 1), with TF< 1. The mean values of the TF for all of the examined TEs (except Pb and Cd at S3) were < 1 (Table 6). Cu > Cd > Zn > Pb > Mn was the order of TE translocation capability from the roots to the shoots of P. dioscoridis.
The maximum value of TF for Cu was observed at S1 (0.96 ± 0.08); for Pb at S3 (1.35 ± 0.35); for Cd at S3 (1.29 ± 0.04); for Zn at S2 (0.97 ± 0.093); and for Mn at S1 (0.98 ± 0.05). ECS was > 1 for Mn (S1, S2); Cd (S1, S3), and Pb (S1), while ECS values for Cu and Zn were less than one at all of the studied sites. The ECR values were >1, with the maximum values for Pb observed at S (1, 2); Cd (S1, S3); and Mn (S1, S2), while ECR values for Cu and Zn were <1 (Table 6). The highest recorded value for MAI was at S1, while the lowest was found at S3 (Figure 2).

3.8. Plant-Soil Correlations

For the analyzed P. dioscoridis tissues and soils, the Pearson correlation coefficients (r values) between the examined nutrients (NPK) and TEs are shown in Table 7. The findings revealed that various soil factors had a significant positive relationship with some nutrients and metals in the root, such as soil K (r = 0.71), soil Cu (r = 0.89), soil Cd (r = 0.83), and Cd and Zn (r = 0.77). Also, some soil variables had a significant positive correlation with some nutrients and metals in the shoot; for instance, soil N with shoot P (r = 0.59) and K (r = 0.68); soil P with shoot N (r = 0.71); and soil Cu with shoot Cd (r = 0.84) and Mn (r = 0.61).
Other soil factors, on the other hand, displayed a strong negative association with root nutrients and TEs, such as soil P with root Mn (r = −0.73); soil Cu with root K (r = −0.68); soil Cd with root Mn (r = −0.51); soil Mn with root Cu (r = −0.38); and soil Mn with root P (r = −0.71). Other soil factors demonstrated a significant negative connection with shoot nutrients and TEs, including soil P with shoot Cu (r = −0.58); soil K with shoot N and Mn (r = −0.45 and −0.56, respectively); soil Mn with shoot Pb (r = −0.91); and soil Cu with shoot K (r = −0.31). The findings revealed that soil pH and OM had a significant impact on TE concentrations in P. dioscoridis. As a result, all of the TEs in P. dioscoridis tissues displayed a strong negative correlation with soil pH. Soil pH was found to have a negative correlation with root Cu, Pb, Cd, Zn, and Mn (r = −0.58, −0.51, −0.77, −0.69, and −0.49), whereas OM had a positive correlation with all of the investigated inorganic nutrients (N, P, K) of the root (r = 0.88, 0.76, and 0.71, respectively) and shoot (r = 0.51, 0.68, and 0.69, respectively). Soil OM had a positive correlation with root Pb, Cd, Zn, and Mn (r = 0.86, 0.97, 0.88, and 0.53) and shoot Pb, Cd, Zn, and Mn (r = 0.95, 0.69, 0.75, and 0.61).

4. Discussion

A large amount of environmental and agricultural activities, such as photosynthesis, transpiration, and field energy balance, can significantly impact LA and SLA values. Metal bioaccumulation has a deleterious influence on leaf production [47]. These findings are consistent with those of Refs. [6,48], who found that metal accumulation can reduce plant development, resulting in a drop in LA. Also, SLA is influenced by leaf growth, structure, and photosynthesis [49]. Accordingly, the lowest recorded LA and SLA values at S1 and S2 had the smallest leaf lamina expansion, which was closely associated with the significant TE accumulation in these sites. The rise in TE accumulation level and dry climate of the studied area may have caused WC (%) values to fall at all polluted sites. The low WC values of contaminated leaves appear to confirm the idea of low production [47].
Several studies [15,50] have connected reduced chlorophyll content in a variety of plant species to TE exposure. Any alteration in chlorophyll content affects plants’ morphology, physiology, and biochemistry. Many researchers have discovered that metal accumulation accelerates the depletion of photosynthetic pigments [51,52]. The present findings revealed that values of Chl (a) and (b) in P. dioscoridis tissues were reduced in polluted areas. According to Refs. [53,54], this drop in chlorophyll concentration reflects foliar damage caused by TE contamination. These findings agree with those of Ref. [55], who found that metal pollution had a significant impact on chlorophyll levels. De Filippis and Pallaghy [56] also stated that TEs can impede the formation of chlorophyll pigments and enzymes.
The obtained results showed that, with increases in the TE concentration, there was a substantial drop in the total Chl (a + b) of P. dioscoridis. These results agree with many studies that revealed that TE toxicity can diminish the amount of photosynthetic pigment in many plant species [12]. The chlorophyll ratio (a/b) is a stress indicator. The ratio rose, in the current study, as the level of polluting metals increased [6]. Furthermore, numerous scientists have claimed that an increase in chlorophyll ratios was linked to increased environmental stress [57,58,59,60].
Carotenoids work as non-enzymatic antioxidants to protect plants from oxidative stress [61]. The current findings support those of [62,63], who found that increasing Cars content is an effective method to protect plants from free radical generation. P. dioscoridis can be a good option to recover TE-contaminated circumstances in phytoremediation because of the high content of Cars at polluted areas and its higher resilience to TE pollution.
Proline is a vital partner in structural proteins and enzymes, and it is engaged in the repair process. It is also known to have a function in the reconstruction of chlorophyll, the activation of the Krebs cycle, and the sequestering of free radicals; as well, it serves as an energy source. Proline content was found to be considerably high in P. dioscoridis as the TE accumulation rate rose, indicating pollution stress. Proline accumulation in plant leaves could serve as a suitable solute to maintain the osmotic balance between the vacuoles and the cytoplasm [64].
Soluble sugars, which are the plant’s source of energy, are one of the most significant ingredients in the cell structure. The decrease in soluble carbohydrate content under TE stress in the current results can be considered as a defense mechanism of the plant and help in osmotic protection to perform adaptation against the inappropriate environment [65,66]. The relationship between soluble carbohydrates and photosynthesis is mostly determined by changes in the carbohydrate concentration. The current decrease in soluble carbohydrate content under TE stress when compared to control values may be due to the inhibition of biosynthesis of chlorophyll or stimulation of the respiration rate, which leads, finally, to a reduction in carbohydrate contents [67].
Many studies have indicated that the effect of a high concentration of TEs has a significant impact on the fresh and dry weight of plants [68]. According to the present results, this drop in the fresh and dry weight of P. dioscoridis shoots and roots is most likely due to a decrease in photosynthetic processes, which reduces carbohydrate metabolism [69,70]. Disturbance in water availability [71], suppression of nutrient uptake [70,72], and protein degradation are some of the other causes of reductions in the fresh and dry weight of P. dioscoridis shoots and roots.
It has been reported that, as a result of the occurrence of high levels of nutrients in the soil, the ability of hyperaccumulation of plants can be improved; this may be due to the role of NPK in the soil in enhancing the availability of TEs for plants, shown in Ref. [73]. The current findings revealed that P. dioscoridis has a high NPK level in the shoots and roots at S1 (with high industrial activities, and agricultural and urban activities), indicating the plant’s capacity to adapt to the stress resulting from the accumulation of trace metals and pollutants through the regulation of some physiological and metabolic processes inside its cells and tissues [74].
Some plants have a remedial nature which helps plants to absorb high amounts of trace metals through the “chemical phytostabilization” mechanism. The plant roots are the main route for the transfer of elements and nutrients from the soil. Most agricultural practices, as well as their wild flora, take place within the polluted sites (S1 and S2). Large amounts of TEs have been collected in the topsoil as a result of industrial activity and intensive traffic [75]. The accumulation degree of trace metals in the soil is mainly influenced by factors such as pH, TEs level, OM % (organic carbon), and soil particle size. The findings of the current study recorded the alkaline pH values of the soil which, in turn, led to a decrease in the availability of some TEs for plant roots by enhancing the ability of colloids in the soil to absorb cations [76]. If a value of BCF above 1 indicates a higher uptake of TEs in crop/plant than in soil, then a BCF of less than 1 means a higher TE concentration in soil than in plants [43]. The highest recorded values of ECR of P. dioscoridis in the present study declared that this plant could be exploited for monitoring TEs (Cd, Pb, and Mn, not Cu and Zn). The significant positive correlations between Cd and Pb in soil with those in P. dioscoridis tissues suggest its potential use as a bioindicator and biomonitor for Cd and Pb pollution.

5. Conclusions

Through phytoremediation technology, wild metal hyperaccumulator plants flourishing in contaminated places could present an alternate solution for the treatment of soils enriched with TEs (trace elements), resulting from industrial and traffic activities.
Based on the current data, the photosynthetic pigments and flavonoids decreased significantly at S1, at which TEs were accumulated with high concentrations. This drop in chlorophyll concentration reflects foliar damage caused by TE accumulation. The carotenoids/chlorophyll index (Car/Chl) ratio showed non-significant variations for all studied spheres. High values of chlorophyll ratio (a/b) were also recorded in plant leaves which faced TE stress. According to the values of the bioconcentration and translocation factors (BCF > 1 and TF > 1), P. dioscoridis can accumulate high levels of TEs in its tissues. This suggests that P. dioscoridis could be a useful strategy for TEs phytostabilization. The highest recorded values of enrichment coefficient for the shoot (ECS) of P. dioscoridis indicated that this plant can be used as a phytoextraction strategy for Cd, Pb, and Mn, but not Cu and Zn, in contaminated areas. The concentrations of NPK in the shoot were significantly higher than in the root. However, the concentrations of most TEs were significantly higher in the roots than in the shoots. The significant positive correlations (r values) between Cd and Pb in soil with those in P. dioscoridis tissues suggest its potential use as a bioindicator and biomonitor for Cd and Pb pollution. Future studies are required to evaluate the potential of wild species, particularly P. dioscoridis, under man-made environmental stressors for phytoremediation purposes.

Author Contributions

Conceptualization, N.Y. and J.D.; methodology, N.Y; software, N.Y and J.D.; data curation, N.Y and J.D; investigation, N.A; resources, N.Y. and J.D; writing original draft preparation, N.Y; writing review and editing, N.Y. and J.D. All authors have read and agreed to the published version of the manuscript.

Funding

This research received no external funding.

Informed Consent Statement

Not applicable.

Data Availability Statement

Data is contained within the article.

Conflicts of Interest

The authors declare no conflict of interest.

Abbreviations

TEsTrace Elements
Car/ChlCarotenoids/Chlorophyll
TFTranslocation factors
ECREnrichment coefficient for root
ECSEnrichment coefficient for shoot
MAIMetal accumulation index
ROSReactive oxygen species
LALeaf area
SLASpecific leaf area
WCWater content
RWCRelative water content
FWFresh weight
DWDry weight
TWTurbid weight
NPKNitrogen, Phosphorus, Potassium
AQAqua regia
BCFBioconcentration factors
ECEnrichment coefficients

References

  1. Ng, J.C.; Juhasz, A.; Smith, E.; Naidu, R. Assessing the bioavailability and bioaccessibility of metals and metalloids. Environ. Sci. Pollut. Res. 2015, 22, 8802–8825. [Google Scholar] [CrossRef] [PubMed]
  2. Anwar, S.; Nawaz, M.F.; Gul, S.; Rizwan, M.; Ali, S.; Kareem, A. Uptake and distribution of minerals and heavy metals in commonly grown leafy vegetable species irrigated with sewage water. Environ. Monit. Assess. 2016, 188, 541. [Google Scholar] [CrossRef] [PubMed]
  3. Liu, L.; Zhang, Y.; Yun, Z.; He, B.; Jiang, G. Estimation of bioaccessibility and potential human health risk of mercury in Chinese patent medicines. J. Environ. Sci. 2016, 39, 37–44. [Google Scholar] [CrossRef] [PubMed]
  4. Sumiahadi, A.; Acar, R. A review of phytoremediation technology: Heavy metals uptake by plants. IOP Conf. Ser. Earth Environ. Sci. 2018, 142, 012023. [Google Scholar] [CrossRef]
  5. Zaheer, I.E.; Ali, S.; Rizwan, M.; Farid, M.; Shakoor, M.B.; Gill, R.A.; Najeeb, U.; Iqbal, N.; Ahmad, R. Citric acid assisted phytoremediation of copper by Brassica napus L. Ecotoxicol. Environ. Saf. 2015, 120, 310–317. [Google Scholar] [CrossRef]
  6. El-Khatib, A.A.; Youssef, N.A.; Barakat, N.A.; Samir, N.A. Responses of Eucalyptus globulus and Ficus nitida to different potential of heavy metal air pollution. Int. J. Phytoremediation 2020, 22, 986–999. [Google Scholar] [CrossRef]
  7. Naglaa, A.Y. Changes in the morphological traits and the essential oil content of sweet basil (Ocimum basilicum L.) as induced by cadmium and lead treatments. Int. J. Phytoremediation 2020, 23, 291–299. [Google Scholar]
  8. Qu, H.J.; Zhang, H.D.; Tan, Z.C.; Chen, G.C. The remediation potential of Quercus nuttallii and Quercus phellos to heavy metal polluted soil in lead-zinc miningarea: A field test. Acta Ecol. Sin. 2020, 40, 6969–6981. [Google Scholar]
  9. Asad, S.A.; Farooq, M.; Afzal, A.; West, H. Integrated phytobial heavy metal remediation strategies for a sustainable clean environment—A review. Chemosphere 2019, 217, 925–941. [Google Scholar] [CrossRef]
  10. Khan, M.I.R.; Chopra, P.; Chhillar, H.; Ahanger, M.A.; Hussain, S.J.; Maheshwari, C. Regulatory hubs and strategies for improving heavy metal tolerance in plants: Chemical messengers, omics and genetic engineering. Plant Physiol. Biochem. 2021, 164, 260–278. [Google Scholar] [CrossRef]
  11. Sharma, P.; Bhardwaj, R.; Arora, N.; Arora, H.K.; Kumar, A. Effects of 28-homobrassinolide on nickel uptake, protein content and antioxidative defense system in Brassica juncea. Biol. Plant 2008, 52, 767–770. [Google Scholar] [CrossRef]
  12. Rizwan, M.; Ali, S.; Rizvi, H.; Rinklebe, J.; Tsang, D.C.; Meers, E.; Ok, Y.S.; Ishaque, W. Phytomanagement of heavy metals in contaminated soils using sunflower: A review. Crit. Rev. Environ. Sci. Technol. 2016, 46, 1498–1528. [Google Scholar] [CrossRef]
  13. Tauqeer, H.M.; Ali, S.; Rizwan, M.; Ali, Q.; Saeed, R.; Iftikhar, U.; Ahmad, R.; Farid, M.; Abbasi, G.H. Phytoremediation of heavy metals by Alternanthera bettzickiana: Growth and physiological response. Ecotoxicol. Environ. Saf. 2016, 126, 138–146. [Google Scholar] [CrossRef]
  14. Parmar, P.; Patel, M.J.; Dave, B.; Subramanian, R.B. Nickel accumulation by Colocassia esculentum and its impact on plant growth and physiology. Afr. J. Agric. Res. 2012, 7, 3579–3587. [Google Scholar]
  15. Rizwan, M.; Ali, S.; Qayyum, M.F.; Ok, Y.S.; Rehman, M.Z.; Abbas, Z.; Hannan, F. Use of maize (Zea mays L.) for phytomanagement of Cd-contaminated soils: A critical review. Environ. Geochem. Health 2017, 39, 259–277. [Google Scholar] [CrossRef] [PubMed]
  16. Lavid, N.; Schwartz, A.; Yarden, O.; Tel-Or, E. The involvement of polyphenols and peroxidase activities in heavy metal accumulation by epidermal glands of the waterlily (Nymphaeaceae). Planta 2012, 212, 323–331. [Google Scholar] [CrossRef] [PubMed]
  17. Blokhina, O.; Virolainen, E.; Fagerstedt, K.V. Antioxidants, oxidative damage and oxygen deprivation stress: A review. Ann. Bot. 2003, 91, 179–194. [Google Scholar] [CrossRef] [Green Version]
  18. Boulos, L. Flora of Egypt: Checklist, Revised Annotated Edition; Al-Hadara Publishing: Cairo, Egypt, 2009; Volume 410. [Google Scholar]
  19. Shaltout, K.; El-Kady, H.F.; El-Sheikh, M.A. Species diversity of the ruderal habitats in the Nile Delta. Taekholmia 1999, 19, 203–225. [Google Scholar] [CrossRef]
  20. Shaltout, K.H.; Slima, D.F. The biology of Egyptian woody perennials. Assiut Univ. Ass. Uni. Bull. Environ. Res. 2007, 10, 85–103. [Google Scholar]
  21. Eltaher, G.T.; Ahmed, D.A.; EL-beheiry, M.; Sharaf El-Din, A. Biomass estimation and heavy metal accumulation by Pluchea dioscoridis (L.) DC. in the Middle Nile Delta, (Egypt): Perspectives for phytoremediation. S. Afr. J. Bot. 2019, 127, 153–166. [Google Scholar] [CrossRef]
  22. Nassar, M.; Elshamy, A.; El Gendy, A. Phenolics, essential oil and biological activity of Conyza dioscoridis growing in Egypt. Planta Med. 2014, 80, LP15. [Google Scholar] [CrossRef]
  23. El Shamy, A.; El Gendy, A.; Farrag, A.; Nassar, M. Antidiabetic and antioxidant activities of phenolic extracts of Conyza dioscoridis L. shoots. Int. J. Pharm. Pharm. Sci. 2015, 7, 65–72. [Google Scholar]
  24. El-Hefny, M.; Ashmawy, N.; Salem, M.; Salem, A. Antibacterial activities of the phytochemicals-characterized extracts of Callistemon viminalis, Eucalyptus camaldulensis and Conyza dioscoridis against the growth of some phytopathogenic bacteria. Microb. Pathog. 2017, 113, 348–356. [Google Scholar] [CrossRef] [PubMed]
  25. Atta, A.H.; Mouneir, S.M. Antidiarrhoeal activity of some Egyptian medicinal plant extracts. J. Ethnopharm. 2004, 92, 303–309. [Google Scholar] [CrossRef] [PubMed]
  26. Awaad, A.S.; EL-Meligy, R.M.; Qenawy, S.A.; Atta, A.H.; Soliman, G.A. Antiinflammatory, antinociceptive and antipyretic effects of some desert plants. J. Saudi Chem. Soc. 2011, 15, 367–373. [Google Scholar] [CrossRef]
  27. El-Ghorab, A.H.; Ramadan, M.M.; El-Moez, S.I.A.; Soliman, A.M.M. Essential oil, antioxidant, antimicrobial and anticancer activities of Egyptian Pluchea dioscoridis extract. Res. J. Pharmac. Bio. Chem. Sci. 2015, 6, 1255–1265. [Google Scholar]
  28. Kareim, M.S. Geomorphology of the east side of the River Nile. Bull. Egypt Geogr. Soc. 2001, 37, 295–358. (In Arabic) [Google Scholar]
  29. Sawidis, T.; Breuste, J.; Mitrovic, M.; Pavlovic, P.; Tsigaridas, K. Trees as bioindicators of heavy metal pollution in three European cities. Environ. Pollut. 2011, 159, 3560–3570. [Google Scholar] [CrossRef]
  30. Liu, L.; Guan, D.S.; Chen, Y.Q. Morphological structure of leaves and dust-retainingcapability of common street trees in Guangzhou Municipality. Acta Ecol. Sin. 2013, 33, 2604–2614. [Google Scholar] [CrossRef]
  31. Tremolieres, M.; Schnitzler, A.; Sanchez-Perez, J.M.; Schmitt, D. Changes in foliar nutrient content and resorption in Fraxinus excelsior L., Ulmus minor Mill. and Clematis vitalba L. after prevention of floods. Ann. Sci. 1999, 56, 641–650. [Google Scholar] [CrossRef] [Green Version]
  32. Singh, S.K. Practical Plant Physiology; Kalayani Publishers: New Delhi, India, 1977; p. 226. [Google Scholar]
  33. Boham, B.A.; Kocipai-Abyazan, R. Flavonoids and condensed tannins from leaves of Hawaiian Vaccinium and V. calycinium. Pacific Sci. 1974, 48, 458–463. [Google Scholar]
  34. Wellburn, A.R. The spectral determination of chlorophylls a and b, as well as total carotenoids, using various solvents with spectrophotometers of different resolution. J. Plant Physiol. 1994, 144, 307. [Google Scholar] [CrossRef]
  35. Harborne, J.B. Phytochemical Methods: A Guide to Modern Techniques of Plant Analysis; Chapman A & Hall: London, UK, 1973; p. 279. [Google Scholar]
  36. Williams, I.; Frank, L. Improved chemical synthesis and enzymatic assay of δ1-pyrroline-5-carboxylic acid. Anal. Biochem. 1975, 64, 85–97. [Google Scholar] [CrossRef] [PubMed]
  37. Dubois, M.; Gilles, K.A.; Hamilton, J.K.; Rebers, P.A.; Smith, F. Colorimetric method for determination of sugars and related substrates. Anal. Chem. 1956, 28, 350–356. [Google Scholar] [CrossRef]
  38. Jones, J. Laboratory Guide for Conducting Soil Tests and Plant Analysis; CRC Press; Taylor & Francis: Boca Raton, FL, USA, 2001. [Google Scholar]
  39. Allen, S.E. Chemical Analysis of Ecological Materials; Blackwell Scientific Publications: London, UK, 1989. [Google Scholar]
  40. U.S. EPA. National Ambient Air Quality Standards (NAAQS); U.S. EPA: Washington, DC, USA, 2016. Available online: http://www3.epa.gov/ttn/naaqs/ (accessed on 2 December 2016).
  41. Liang, J.; Fang, H.; Zhang, T.; Wang, X.; Liu, Y. Heavy metal in leaves of twelve plant species from seven different areas in Shanghai, China. Urban For. Urban Green. 2017, 27, 390–398. [Google Scholar] [CrossRef]
  42. Guarino, C.; Sciarrillo, R. Ecological and functional evaluation of species candidate for heavy metals phytoremediation in SIN porto torres (Sardinia, Italy). J. Environ. Anal. Toxicol. 2017, 7, 484. [Google Scholar] [CrossRef]
  43. Luo, Y.; Wu, Y.; Qiu, J.; Wang, H.; Yang, L. Suitability of four woody plant species for the phytostabilization of a zinc smelting slag site after 5 years of assisted revegetation. J. Soils Sediments 2019, 19, 702–715. [Google Scholar] [CrossRef]
  44. Mohotti, A.; Geeganage, K.; Mohotti, K.; Ariyarathne, M.; Karunaratne, C.; Chandrajith, R. Phytoremedial potentials of Ipomoea aquatica and Colocasia esculenta in soils contaminated with heavy metals through automobile painting, repairing and service centers. Sri Lankan J. Biol. 2016, 1, 27–37. [Google Scholar] [CrossRef]
  45. Cheraghi, M.; Lorestani, B.; Khorasani, N.; Yousefi, N.; Karami, M. Findings on the phytoextraction and phytostabilization of soils contaminated with heavy metals. Biol. Trace Elem. Res. 2011, 144, 1133–1141. [Google Scholar] [CrossRef]
  46. Tiwari, S.; Agrawal, M.; Marshall, F.M. Evaluation of ambient air pollution impact on carrot plants at a sub urban site using open top chambers. Environ. Monit. Assess. 2006, 119, 15–30. [Google Scholar] [CrossRef]
  47. Seyyednejad, S.M.; Niknejad, M.; Koochak, H. A review of some different effects of air pollution on plants. Res. J. Environ. Sci. 2011, 10, 302–309. [Google Scholar] [CrossRef] [Green Version]
  48. Barden, J.A. Apple tree growth, et photosynthesis, dark respiration and specific leaf weight as affected by continuous and intermittent shade. J. Am. Soc. Hortic. Sci. 1977, 102, 191–194. [Google Scholar]
  49. Rai, V.; Vajpayee, P.; Singh, S.N.; Mehrotra, S. Effect of chromium accumulation on photosynthetic pigments, oxidative stress defense system, nitrate reduction, proline level and eugenol content of Ocimum tenuiflorum L. Plant Sci. 2004, 167, 1159–1169. [Google Scholar] [CrossRef]
  50. Sandelius, A.; Naslund, K.; Carlsson, A.; Pleijel, H.; Sellden, G. Exposure of spring wheat (Triticum aestivum) to ozone in open-top chambers. Effects on acyl lipid composition and chlorophyll content of flag leaves. New Phytol. 1995, 131, 231–239. [Google Scholar] [CrossRef]
  51. Diatta, J.; Youssef, N.; Tylman, O.; Grzebisz, W.; Markert, B.; Drobek, L.; Wünschmann, S.; Bebek, M.; Mitko, K.; Lejwoda, P. Acid rain induced leakage of Ca, Mg, Zn, Fe from plant photosynthetic organs—Testing for deciduous and dicotyledons. Ecol. Indic. 2020, 121, 107210. [Google Scholar] [CrossRef]
  52. Yoon, Y.; Cao, X.; Zhou, Q.; Ma, L.Q. Accumulation of Pb, Cu, and Zn in native plants growing on a contaminated Florida site. Sci. Total Environ. 2006, 368, 456–464. [Google Scholar] [CrossRef]
  53. Mahar, A.; Wang, P.; Ali, A.; Awasthi, M.K.; Lahori, A.H.; Wang, Q.; Li, R.; Zhang, Z. Challenges and opportunities in the phytoremediation of heavy metals contaminated soils: A review. Ecotoxicol. Environ. Saf. 2016, 126, 111–121. [Google Scholar] [CrossRef]
  54. Rehman, M.Z.; Rizwan, M.; Hussain, A.; Saqib, M.; Ali, S.; Sohail, M.I.; Shafiq, M.; Hafeez, F. Alleviation of cadmium (Cd) toxicity and minimizing its uptake in wheat (Triticum aestivum) by using organic carbon sources in Cd-spiked soil. Environ. Pollut. 2018, 241, 557–565. [Google Scholar] [CrossRef]
  55. De Filippis, L.F.; Pallaghy, C.K. Heavy metals: Sources and biological effects. In Algae and Water Pollution: Advances in Limnology Series; Rai, L.C., Caur, J.P., Soeder, C.J., Eds.; Schweizerbart: Stuttgart, Germany, 1994; Volume 42, pp. 32–77. [Google Scholar]
  56. Delfine, S.; Alvino, A.; Villana, M.C.; Loreto, F. Restriction to carbon dioxide and photosynthesis in spinach leaves recovering from salt stress. Plant Physiol. 1999, 199, 1101–1106. [Google Scholar] [CrossRef]
  57. Monni, S.; Uhlig, C.; Hansen, E.; Magel, E. Ecophysiological responses of Empetrum nigrum to heavy metall pollution. Environ. Pollut. 2001, 112, 121–129. [Google Scholar] [CrossRef]
  58. Anderson, M.J.; Evans, P.K. The chlorophyll a/b-proteins of PS I and PS II are immunologically related. FEBS Lett. 1986, 199, 227–233. [Google Scholar] [CrossRef]
  59. Hamidi-Moghaddam, A.; Arouiee, H.; Moshtaghi, N.; Azizi, M.; Shoor, M.; Sefidkon, F. Visual quality and morphological responses of rosemary plants to UV-B radiation and salinity stress. J. Ecol. Eng. 2019, 20, 34–43. [Google Scholar] [CrossRef]
  60. McElroy, J.S.; Kopsell, D.A. Physiological role of carotenoids and other antioxidants in plants and application to turfgrass stress management. N. Z. J. Crop Hortic. Sci. 2009, 37, 327–333. [Google Scholar] [CrossRef] [Green Version]
  61. Polle, A.; Chakrabarti, K.; Chakrabarti, S.; Seifert, F.; Schramel, P.; Rennenberg, H. Antioxidants and manganese deficiency in needles of Norway Spruce (Picea abies L.) trees. Plant Physiol. 1992, 99, 1084–1089. [Google Scholar] [CrossRef] [Green Version]
  62. Foyer, C.H.; Harbinson, J. Oxygen metabolism and the regulation of photosynthetic electron transport CH Foyer. In Causes of Photooxidative Stress and Amelioration of Defense Systems in Plants; Mullineaux, P., Ed.; CRC Press Inc.: Boca Raton, FL, USA, 1994; pp. 1–42. [Google Scholar]
  63. Flowers, T.J.; Troke, P.F.; Yeo, A.R. The mechanism of salt tolerance in halophites. Annu. Rev. Plant Physiol. 1977, 28, 89–121. [Google Scholar] [CrossRef]
  64. Shvaleva, A.L.; Costa, F.; Silva, E.; Breia, E.; Jouve, L.; Hausman, J.F.; Almeida, M.H.; Maroco, J.P.; Rodrigues, M.L.; Pereira, J.S.; et al. Metabolic responses to water deficit in two Eucalyptus globules clones with contrasting drought sensitivity. Tree Physiol. 2006, 26, 239–248. [Google Scholar] [CrossRef] [PubMed] [Green Version]
  65. Naya, D.E.; Lardies, M.A.; Bozinovik, F. The effect of diet quality on physiological and life-history traits in the harvestman Pachylus paessleri. New Phytol. 2007, 131, 231–239. [Google Scholar] [CrossRef]
  66. Kupper, H.; Kupper, F.; Spiller, M. In situ detection of heavy metals substituted chlorophylls in water plants. Photosynth. Res. 1998, 58, 123–133. [Google Scholar] [CrossRef]
  67. Zheljazkov, V.D.; Craker, L.E.; Xing, B. Effects of Cd, Pb, and Cu on growth and essential oil contents in dill, peppermint, and basil. Environ. Exp. Bot. 2006, 58, 9–16. [Google Scholar] [CrossRef]
  68. Shahid, M. Biogeochemical Behavior of Heavy Metals in Soil-Plant System, 1st ed.; 1. Soil and Environmental Science; Higher Education Commission: Islamabad, Pakistan, 2017; 577.14–dc23; ISBN 978-969-417-195-1. [Google Scholar]
  69. Hatamian, M.; Nejad, A.R.; Kafi, M.; Souri, M.K.; Shahbazi, K. Growth characteristics of ornamental Judas tree (Cercis siliquastrum L.) seedling under different concentrations of lead and cadmium in irrigation water. Acta Sci. Polonorum Hort Cultus 2019, 18, 87–96. [Google Scholar] [CrossRef]
  70. Patra, M.; Bhowmik, N.; Bandopadhyay, B.; Sharma, A. Comparison of mercury, lead and arsenic with respect to genotoxic effects on plant systems and the development of genetic tolerance. Environ. Exp. Bot. 2004, 52, 199–223. [Google Scholar] [CrossRef]
  71. Khan, A.H.A.; Nawaz, I.; Qu, Z.; Butt, T.A.; Yousaf, S.; Iqbal, M. Reduced growth response of ornamental plant Nicotiana alata L. uponselected heavy metals uptake, with co-application of ethylenediaminetetraacetic acid. Chemosphere 2020, 241, 125006. [Google Scholar] [CrossRef]
  72. Sinha, S.; Pandey, K.; Gupta, A.K.; Bhatt, K. Accumulation of metals in vegetables and crops grown in the area irrigated with river water. Bull. Environ. Contam. Toxicol. 2005, 74, 210–218. [Google Scholar] [CrossRef] [PubMed]
  73. Sivaci, A.; Elmas, E. The combined effects of cadmium and salinity on some pigments and total phenolic compounds of Myriophyllum heterophyllum Michx. and Potamogeton crispus L. Afr. J. Agric. Res. 2012, 7, 3813–3818. [Google Scholar]
  74. Park, J.H.; Lamb, D.; Paneerselvam, P.; Choppala, G.; Bolan, N. Role of organic amendments on enhanced bioremediation of heavy metal (loid) contaminated soils. J. Hazard. Mater. 2011, 185, 549–574. [Google Scholar] [CrossRef] [PubMed]
  75. Rizwan, M.; Ali, S.; Rehman, M.Z.; Maqbool, A. A critical review on the effects of zinc at toxic levels of cadmium in plants. Environ. Sci. Pollut. Res. 2019, 26, 6279–6280. [Google Scholar] [CrossRef]
  76. Rosselli, W.; Keller, C.; Boschi, K. Phytoextraction capacity of trees growing on metal contaminated soil. Plant Soil 2003, 256, 265–272. [Google Scholar] [CrossRef]
Figure 1. Location map of Egypt showing the Sohag Governorate and distribution of the studied sites.
Sustainability 15 00119 g001
Figure 2. Metal accumulation index (MAI) of P. dioscoridis at the studied sites.
Sustainability 15 00119 g002
Table 1. Values of Specific leaf area (SLA); relative water content (RWC); leaf area (LA); fresh weight (FW); dry weight (DW) of shoot parts (leaf, stem, and flower) and root of P. dioscoridis at the different studied sites.
SiteInd. NoGrowth ParametersBiomass Estimation
LeafStemFlowerRoot
SLA (cm2/g d.w.)RWC (%)LA (cm2)Fw (g)Dw (g)Fw (g)Dw (g)Fw (g)Dw (g)Fw (g)Dw (g)
S1175.91149.034.517.566.7121.6118.812.322.1113.912.1
251.76156.243.57.035.9121.7319.973.652.5212.411.8
367.93135.323.556.315.3620.6618.882.771.3111.910.0
471.35130.664.597.845.421.2018.933.932.4213.711.82
578.34122.763.476.184.6719.5917.833.852.8911.049.7
S2674.18190.13.518.967.0223.6820.513.982.4712.910.1
789.54160.874.427.916.3923.7220.173.992.2313.411.7
867.09154.873.37.946.1027.8825.393.922.8912.610.9
975.81140.644.68.667.7921.4119.093.672.2914.112.5
1061.40180.543.327.906.8222.7920.194.873.4315.814.13
S31186.16206.816.1110.089.727.6725.753.623.0119.116.0
12101.14276.815.449.178.0830.3628.594.683.1717.315.1
1384.83200.615.189.967.7828.5726.195.454.4519.316.4
1497.97249.916.4210.929.1627.4525.774.123.6116.913.0
1583.98211.015.529.888.4428.8625.984.493.6116.314.9
Table 2. Variance analysis of the impact of the studied TE accumulation on fresh weight and dry weight of shoot parts (leaf, stem, and flower), root, leaf area (LA), specific leaf area (SLA), and leaf water content (WC) of P. dioscoridis.
AccumulationDegree of FreedomFW. of Leaf (g)DW. of Leaf (g)FW. of Stem (g)DW. of Stem (g)FW. of Root (g)DW. of Root (g)FW. of Flower (g)DW. of Flower (g)Leaf Area (LA) (cm2)SLA (cm2/g d.w)Leaf WC (%)
Replication3119.21667.614195.68122.298171.8395.71983.4757.614219.027152.671221.79
Accumulation 935. 4528.01523.04652.15420.21115.47417.29818.01556.28426.81930.02
Correlation (r-values)209.123 **7.512 **5.285 **0.363 *7.131 **7.561 **6.65 *6.702 **10.695 **9.8715.022 **
Coefficient variation (%)9.839.739.097.147.3811.559.936.679.399.895.646.31
*, **: Significant at 5 and 1% probability levels, respectively.
Table 3. The concentration of photosynthetic pigments (mg/g f.w), alkaloids (%), flavonoids, proline, and soluble carbohydrates (mg/g d.w) of P. dioscoridis samples collected from the studied sites. Data are the means of three replicates ± standard error. In each column, means with different letters are significantly different from each other (p < 0.05) according to Post Hoc. Tukey test.
Biochemical Parameters
Chl a
mg/g f.w
Chl b
mg/g f.w
Car.
mg/g f.w
Chl. a + b
mg/g f.w
Chl. a/b RatioCar/Chl
mg/g f.w
Alkaloides
%
Flavonoids
mg/g f.w
Proline
(mg/g d.w)
Soluble Carbohydrates
(mg/g d.w)
S11.38 ± 0.01 b1.55 ± 0.02 b1.41 ± 0.03 b2.93 ± 0.51 a0.89 ± 0.01 a0.48 ± 0.03 a,b5 ± 0.24 b22.30 ± 2.438 d0.52 ± 0.16 a90.35 ± 6.9 d
S21.99 ± 0.13 b1.78 ± 0.02 b1.30 ± 0.04 a3.77 ± 0.93 a1.11 ± 0.02 a0.34 ± 0.02 b4.84 ± 0.95 b15.39 ± 1.40 c0.78 ± 0.11 b82.43 ± 9.08 c
S32.87 ± 0.03 a2.81 ± 0.02 c1.28 ± 0.02 a5.68 ± 0.98 b1.02 ± 0.03 b0.22 ± 0.01 a1.84 ± 0.67 a18.98 ± 2.322 a0.34 ± 0.013 b113.10 ± 9.1 b
F-value11.4145.8935.0148.9765.10313.9902.0155.9116.1939.414
Table 4. The concentration of TEs (Cu, Pb, Cd, Zn, and Mn) and NPK (mg/kg) in shoots and roots samples of P. dioscoridis were collected from the studied sites. One-way ANOVA was used. Data are the means of three replicates ± standard error. In each column, means with different letters are significantly different from each other (p < 0.05) according to Post Hoc. Tukey test.
SitePlant OrganNPK and TEs (mg/kg) in Plant
NPKCuPbCdZnMn
S1Root2.241 ± 0.231 b,c0.669 ± 0.037 a0.779 ± 0.053 a160.2 ± 29.27 b303.20 ± 51.79 b86.74 ± 8.48 a125.85 ± 38.60 d295.0 ± 13.38 b
Shoot3.24 ± 0.091 b0.914 ± 0.061 a0.981 ± 0.061 a154.87 ± 18.14 b329.0 ± 25.83 b,c95.65 ± 9.90 a118.68 ± 28.54 d291.80 ± 17.75 d
S2Root2.000 ± 0.067 a0.206 ± 0.032 a0.467 ± 0.036 a188.75 ± 16.3 b,c201.90 ± 22.94 a,b65.56 ± 16.27 b111.43 ± 31.56 b127.596 ± 11.79 b
Shoot2.50 ± 0.088 a,b0.444 ± 0.018 a0.378 ± 0.040 b174.0 ± 16.12 a211.0 ± 32.92 b79.38 ± 11.36 a,b113.85 ± 14.32 a120.015 ± 12.02 b
S3Root1.850 ± 0.307 c0.367 ± 0.035 b0.529 ± 0.069 a72.5 ± 12.16 a,b60.4 ± 14.06 a,b35.60 ± 18.36 c,d91.30 ± 15.23 a31.367 ± 11.81 b,c
Shoot2.65 ± 0.095 b,c0.438 ± 0.044 d0.494 ± 0.027 b,c60.7 ± 12.08 b,c81.60 ± 11.76 b,c46.09 ± 7.65 b,c87.70 ± 6.41 a21.558 ± 1.06 b
Table 5. The concentration of TEs (Cu, Pb, Cd, Zn, and Mn), NPK (mg/kg), pH, and OM (%) in soil samples of P. dioscoridis collected from the studied sites. One-way ANOVA was used. Data are the means of three replicates ± standard error. In each column, means with different letters are significantly different from each other (p < 0.05) according to Post Hoc. Tukey test.
SiteNPKCuPbCdZnMnpHOM (%)
S10.213 ± 0.006 a0.0413 ± 0.0035 c0.173 ± 0.0069 a227.29 ± 21.57 d223.0 ± 32.07 c81.67 ± 12.05 c184.56 ± 9.16 d94.24 ± 14.49 c8.29 ± 0.22 a6.30 ± 0.35 c
S20.190 ± 0.005 b0.0353 ± 0.0019 b0.314 ± 0.0086 d225.11 ± 33.73 d222.3 ± 21.08 a96.54 ± 11.03 b163.02 ± 11.09 c89.04 ± 9.31 b7.69 ± 0.28 b2.60 ± 0.16 a
S30.089 ± 0.004 a0.0277 ± 0.0029 a0.070 ± 0.0089 b97.80 ± 32.18 c82.0 ± 11.07 a21.35 ± 5.05 a133.00 ± 7.05 c38.74 ± 6.30 a7.28 ± 0.18 a3.20 ± 0.25 a
Table 6. Concentration factors (CF); translocation factors (TF); enrichment coefficients for root (ECR), and shoot (ECS) of P. dioscoridis. Data are the means of three replicates ± standard error. In each column, means with different letters are significantly different from each other (p < 0.05) according to Post Hoc. Tukey test.
TEsParametersSiteF-Value
S1S2S3
CuCF1.38 ± 0.15 a1.60 ± 0.45 a1.36 ± 0.55 a142.123
TF0.96 ± 0.08 a0.92 ± 0.091 a0.83 ± 0.048 a237.387
ECR0.70 ± 0.043 a0.83 ± 0.093 a0.74 ± 0.074b c167.284
ECS0.68 ± 0.056 b,c0.77 ± 0.081 a0.62 ± 0.056 a132.211
PbCF2.83 ± 0.85 a,b2.26 ± 0.95b c1.73 ± 0.65b c45.46
TF0.92 ± 0.105 b0.67 ± 0.046 a1.35 ± 0.35 c10.34
ECR1.47 ± 0.65 a,b1.35 ± 0.351 a,b0.73 ± 0.09 a22.13
ECS1.35 ± 0.35 a,b0.90 ± 0.054 a0.99 ± 0.084 b,c31.10
CdCF2.23 ± 0.975 b1.50 ± 0.75 b3.82 ± 1.05 b42.52
TF0.90 ± 0.077 a,b0.82 ± 0.087 a1.29 ± 0.04 a,b6.77
ECR1.17 ± 0.095 c0.82 ± 0.15 b,c1.66 ± 0.066 c38.16
ECS1.06 ± 0.097 b0.67 ± 0.051 b2.15 ± 0.65 b32.87
ZnCF1.32 ± 0.099 a1.43 ± 0.068 a1.34 ± 0.35 b378.94
TF0.94 ± 0.106 a0.97 ± 0.093 a0.96 ± 0.15 a,b150.77
ECR0.68 ± 0.021 a0.73 ± 0.059 a,b0.68 ± 0.07 b371.46
ECS0.64 ± 0.053 a0.69 ± 0.057 a0.65 ± 0.043 b184.33
MnCF6.22 ± 1.85 d2.78 ± 0.965 b1.36 ± 0.145 a386.59
TF0.98 ± 0.05 b0.94 ± 0.081 a,b0.68 ± 0.07 a32.76
ECR3.13 ± 0.98 c1.43 ± 0.094 c,d0.80 ± 0.105 a99.91
ECS3.09 ± 0.97 c1.34 ± 0.079 b0.55 ± 0.008 b,c363.10
Table 7. Pearson correlation coefficient (r values) between the investigated nutrients (NPK) and TEs in tissues and soils of P. dioscoridis.
Plant NPK and TEsSoil NPK and TEsSoil pHSoil OM
NPKCuPbCdZnMn
Root0.310.520.450.050.010.11−0.730.030.51 * 0.88 ***
N0.05−0.230.110.190.590.720.62−0.710.32 0.76 **
P0.300.51−0.65−0.66 **0.010.310.410.550.79 0.71 **
K0.260.77 **−0.81 **0.49−0.71 *−0.23−0.41−0.240.22 0.60 **
Cu0.48−0.420.720.71−0.190.83 *0.52 *−0.38 *−0.58 ** 0.51 *
Pb−0.110.220.34−0.710.290.21−0.310.41−0.51 * 0.86 ***
Cd−0.620.51−0.420.13−0.590.77 **0.010.76 **−0.77 ** 0.97 ***
Zn−0.490.53−0.380.89 ***0.380.65 *0.230.71 *−0.69 *** 0.88 ***
Mn−0.23−0.73 **0.71 *−0.590.58−0.51 *−0.030.91 ***−0.49 ** 0.53 *
Shoot
N0.03 0.71 **−0.45 *−0.43−0.410.620.32−0.31 *0.33 0.51 *
P0.59 *0.020.33−0.49−0.290.320.610.41 *0.66 * 0.68 **
K0.68 *0.500.73−0.31 *0.05−0.41−0.61−0.220.21 0.69 **
Cu−0.31−0.58 *0.710.360.720.630.49−0.030.07 0.91 ***
Pb−0.070.430.290.500.610.110.71−0.91−0.72 * 0.95 ***
Cd0.430.01−0.410.840.350.87 **0.88−0.22 *−0.51 * 0.69 **
Zn−0.410.420.240.610.500.410.070.62−0.71 * 0.75 **
Mn−0.03−0.03−0.65 *−0.60−0.210.61 *0.010.86 ***−0.64 ** 0.61 *
OM: Organic matter. * p < 0.05. ** p < 0.01. *** p < 0.001
Disclaimer/Publisher’s Note: The statements, opinions and data contained in all publications are solely those of the individual author(s) and contributor(s) and not of MDPI and/or the editor(s). MDPI and/or the editor(s) disclaim responsibility for any injury to people or property resulting from any ideas, methods, instructions or products referred to in the content.

