
Research of Surrounding Rock Control of Gob-Side Entry Retaining Based on Deviatoric Stress Distribution Characteristics


Abstract
:1. Introduction
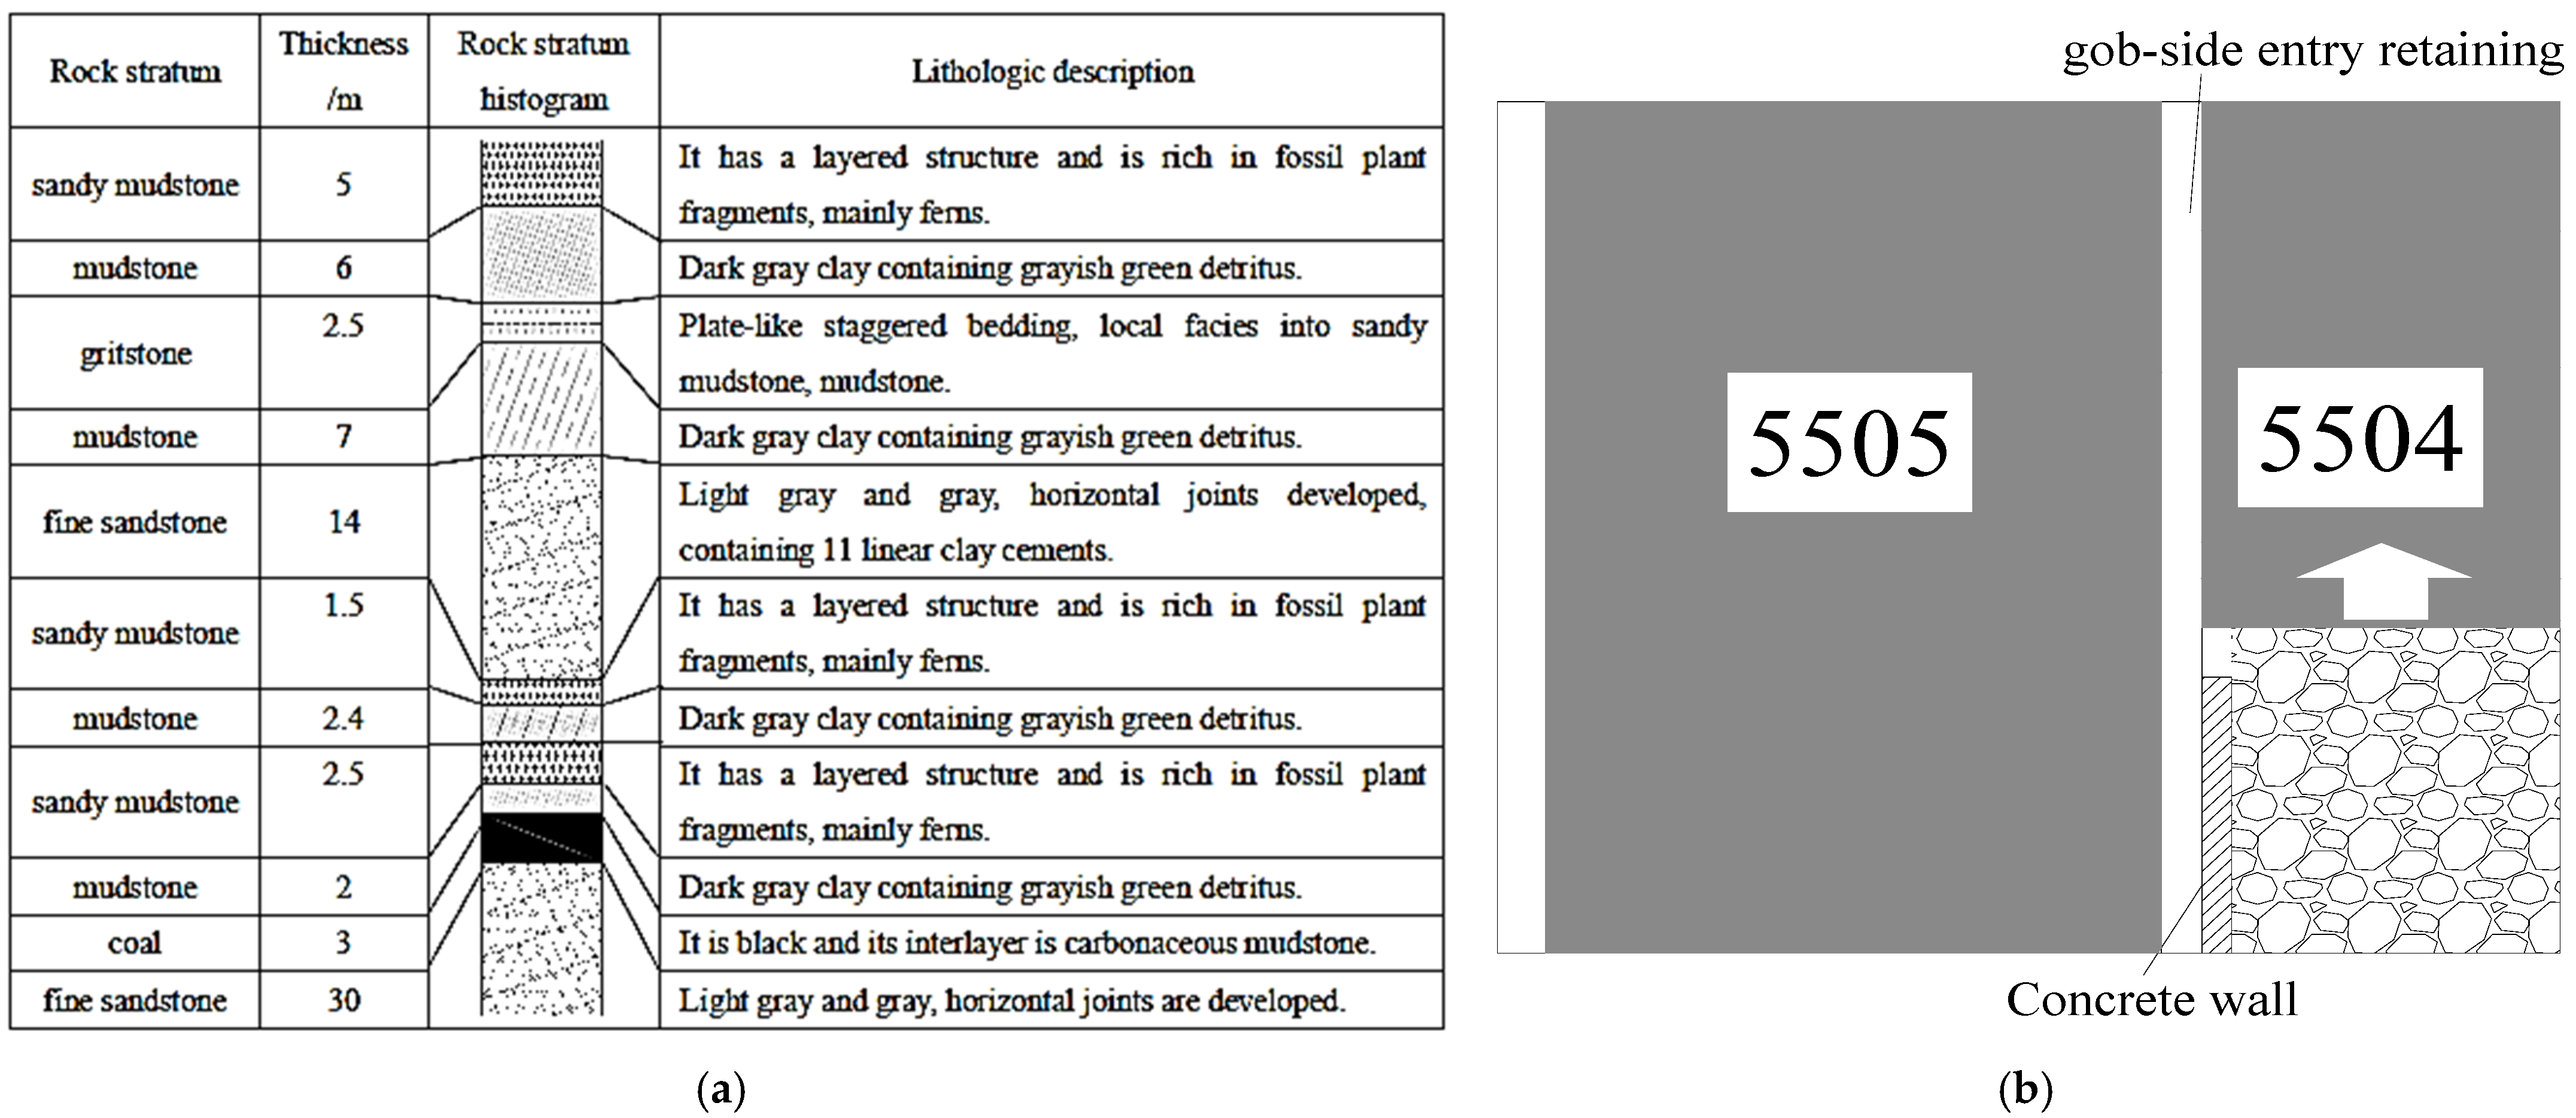
2. Engineering Context
3. Strength Analysis of Concrete Materials
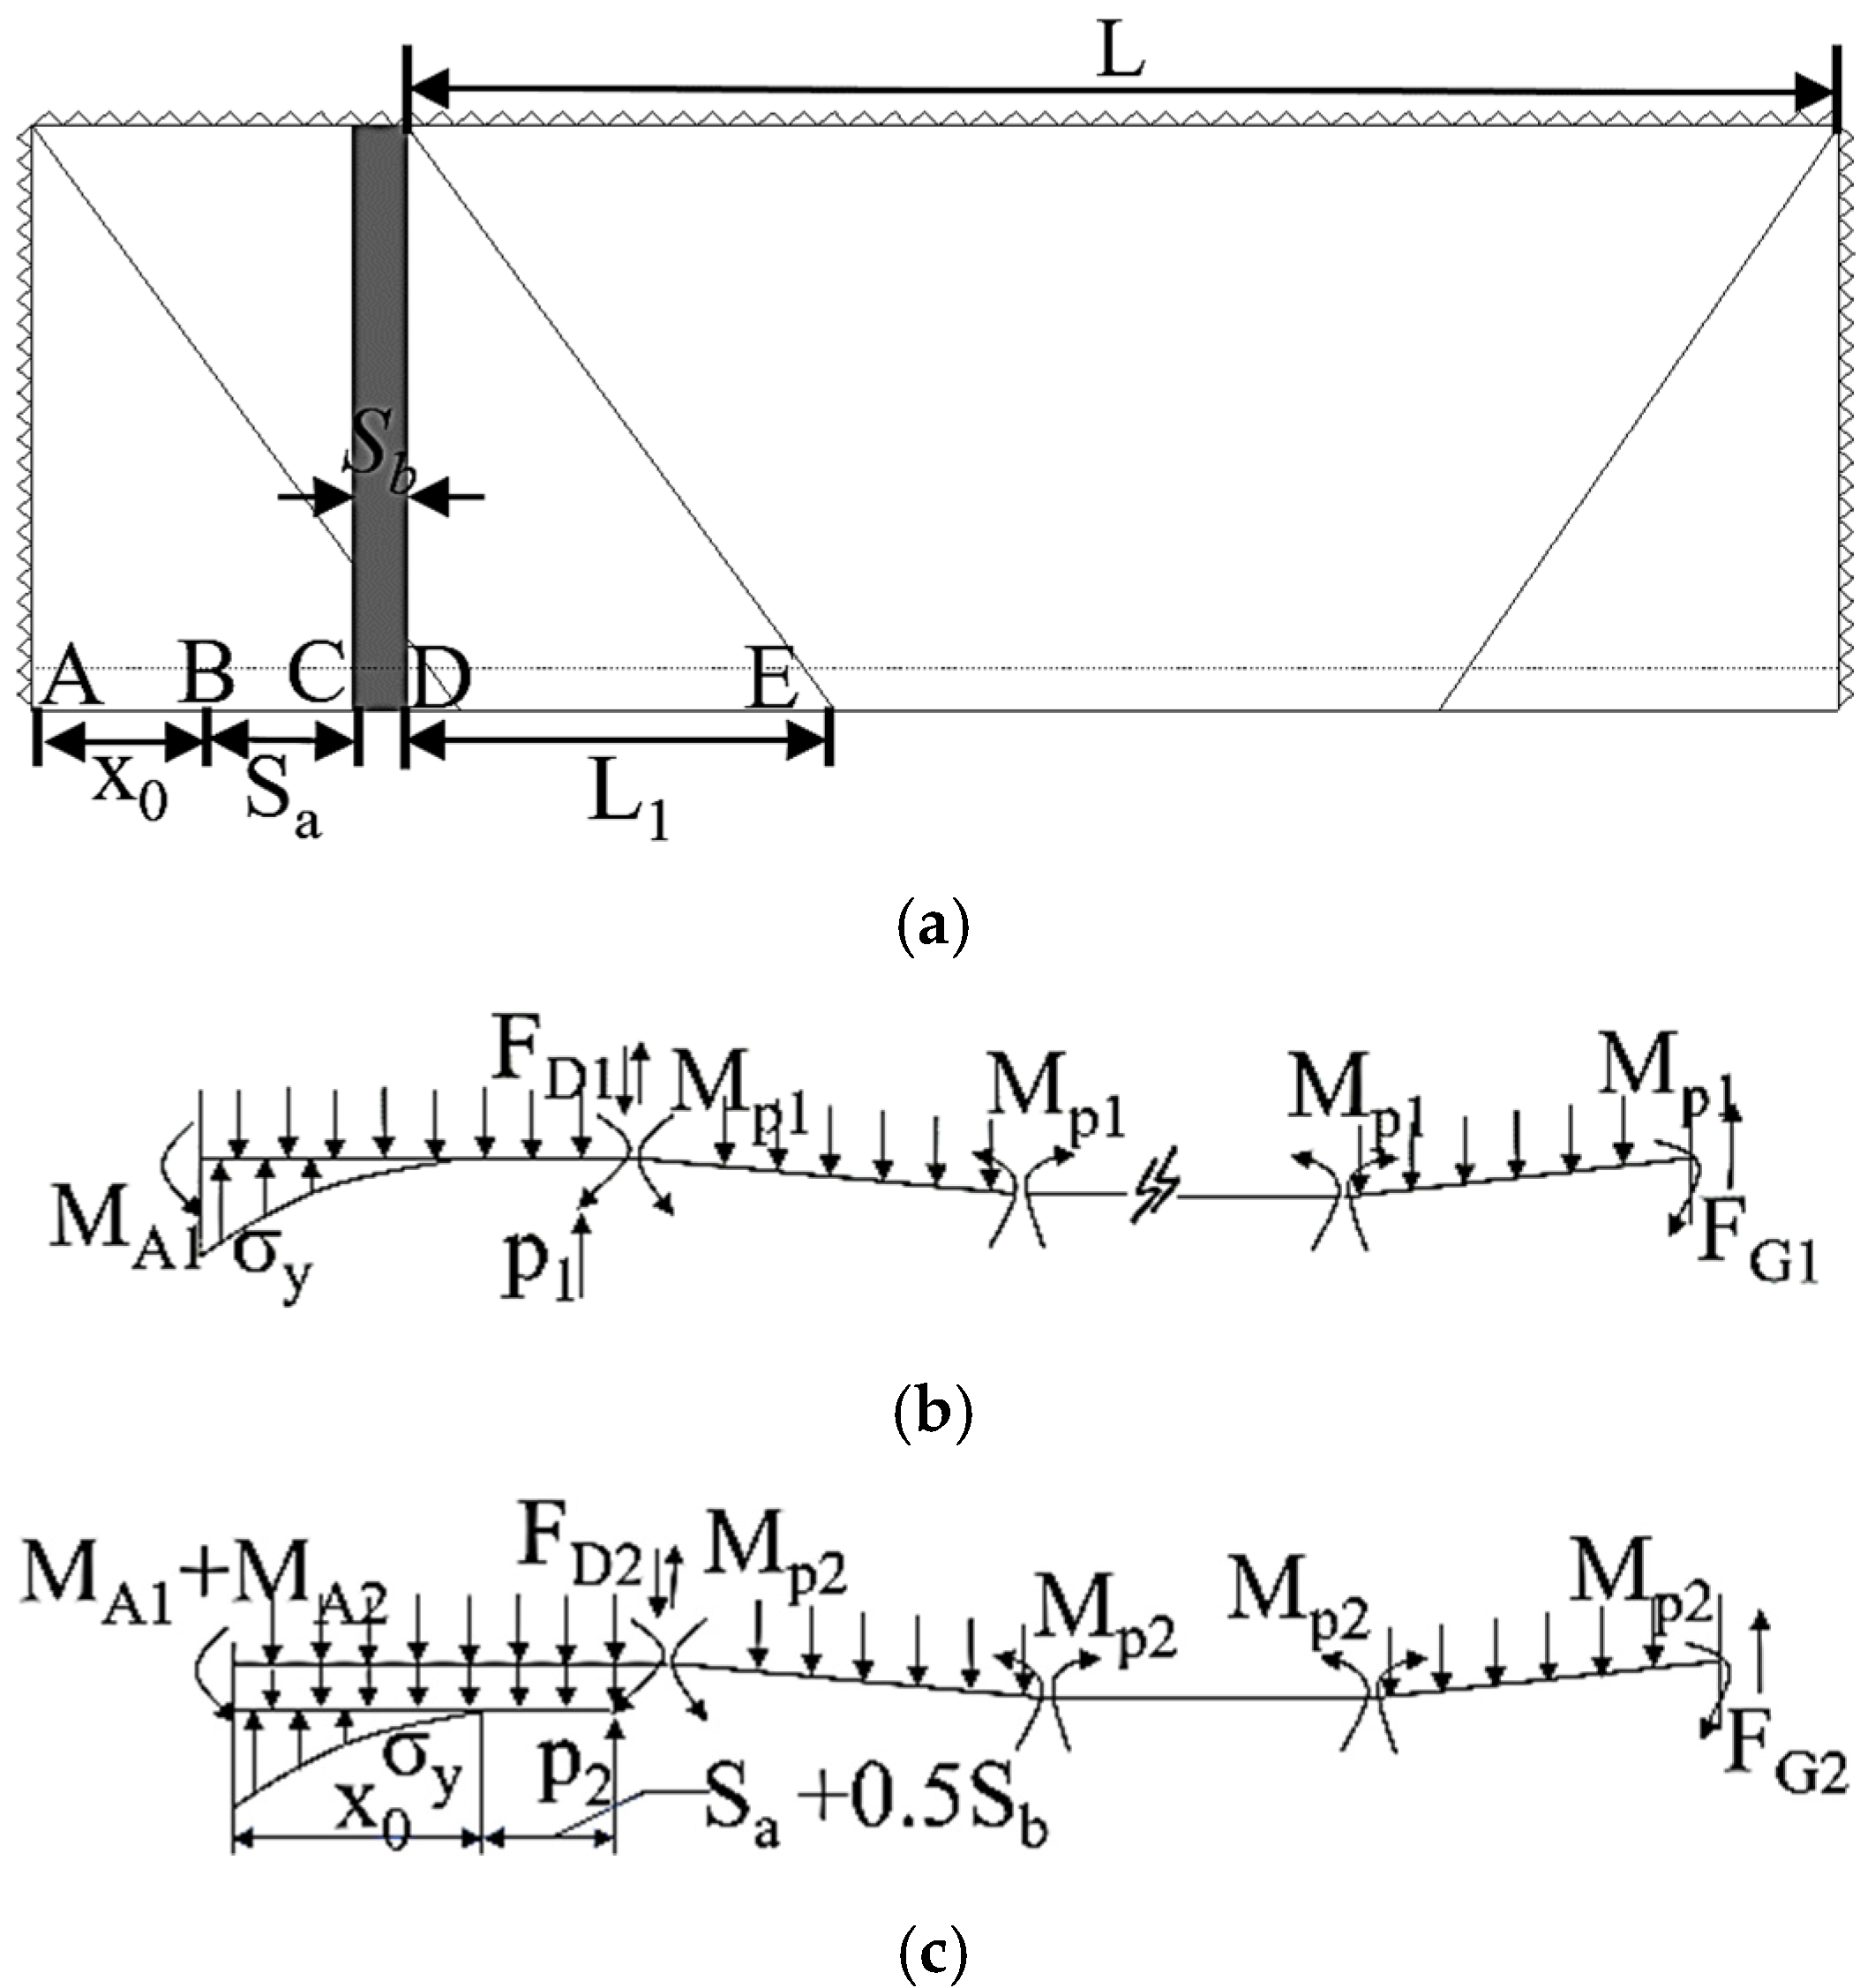
3.1. Analysis of Retained Roadway Support Strength
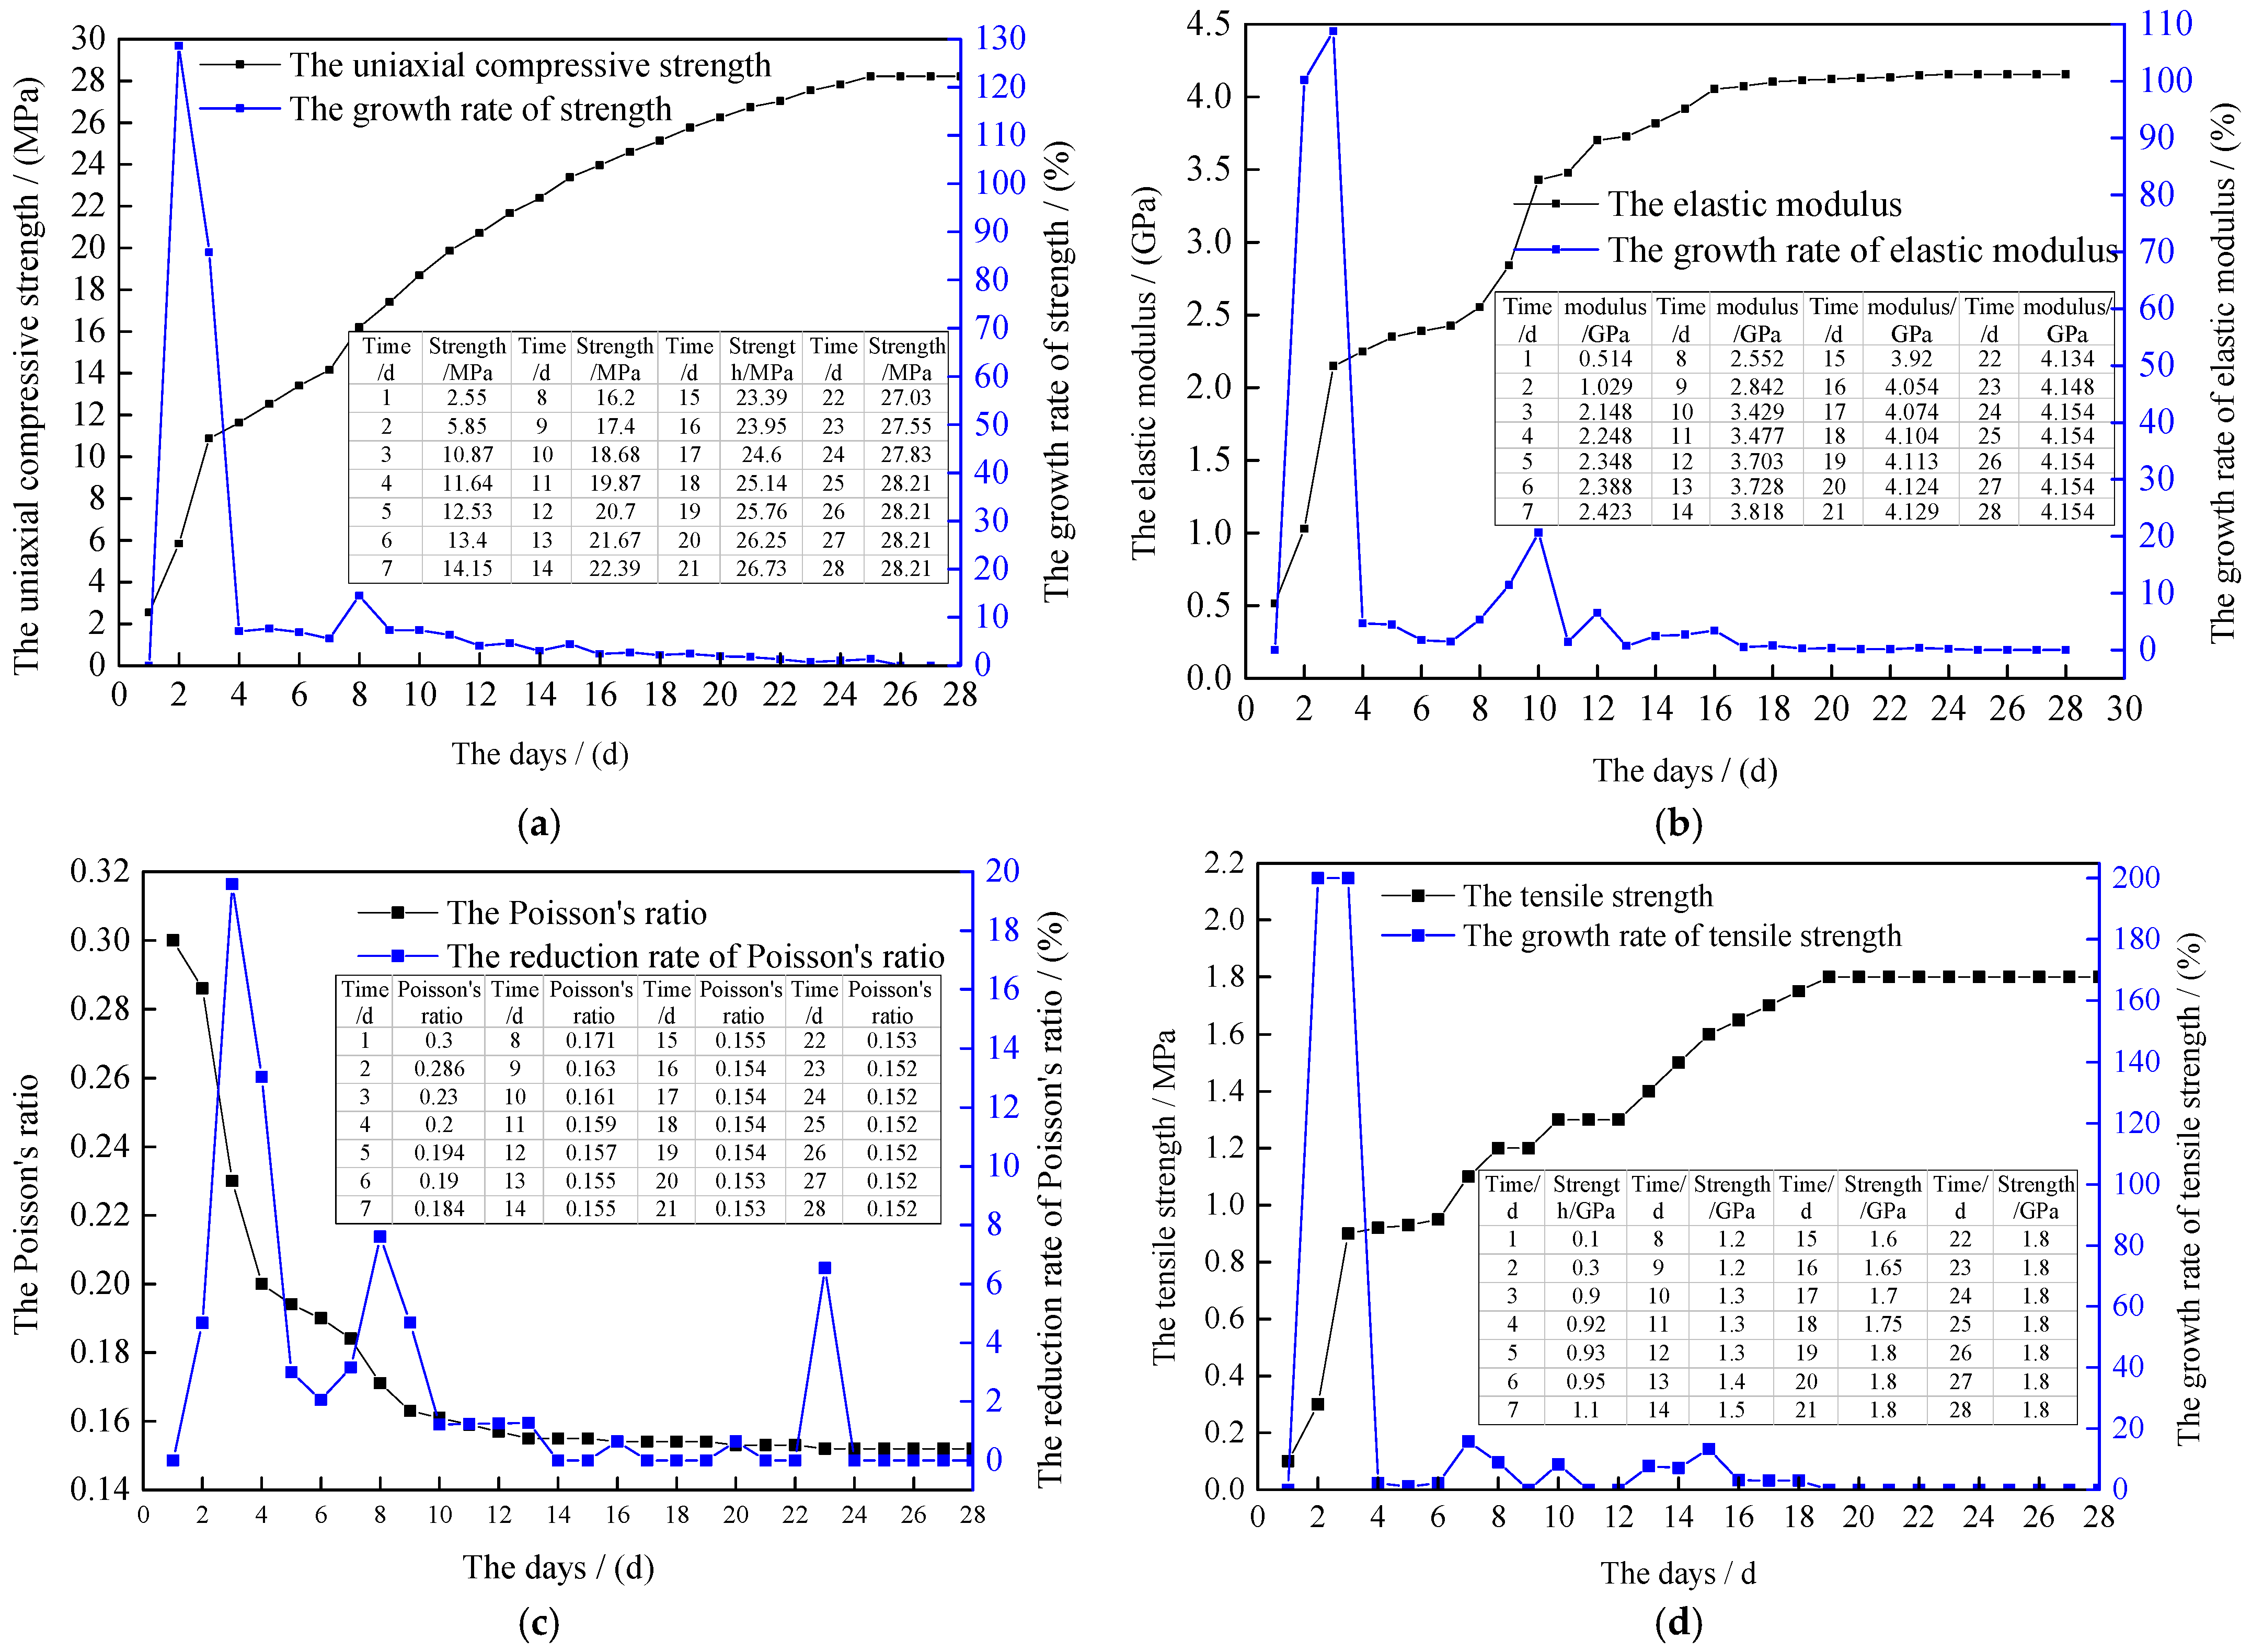
3.2. Compressive Strength Test of Concrete Specimens
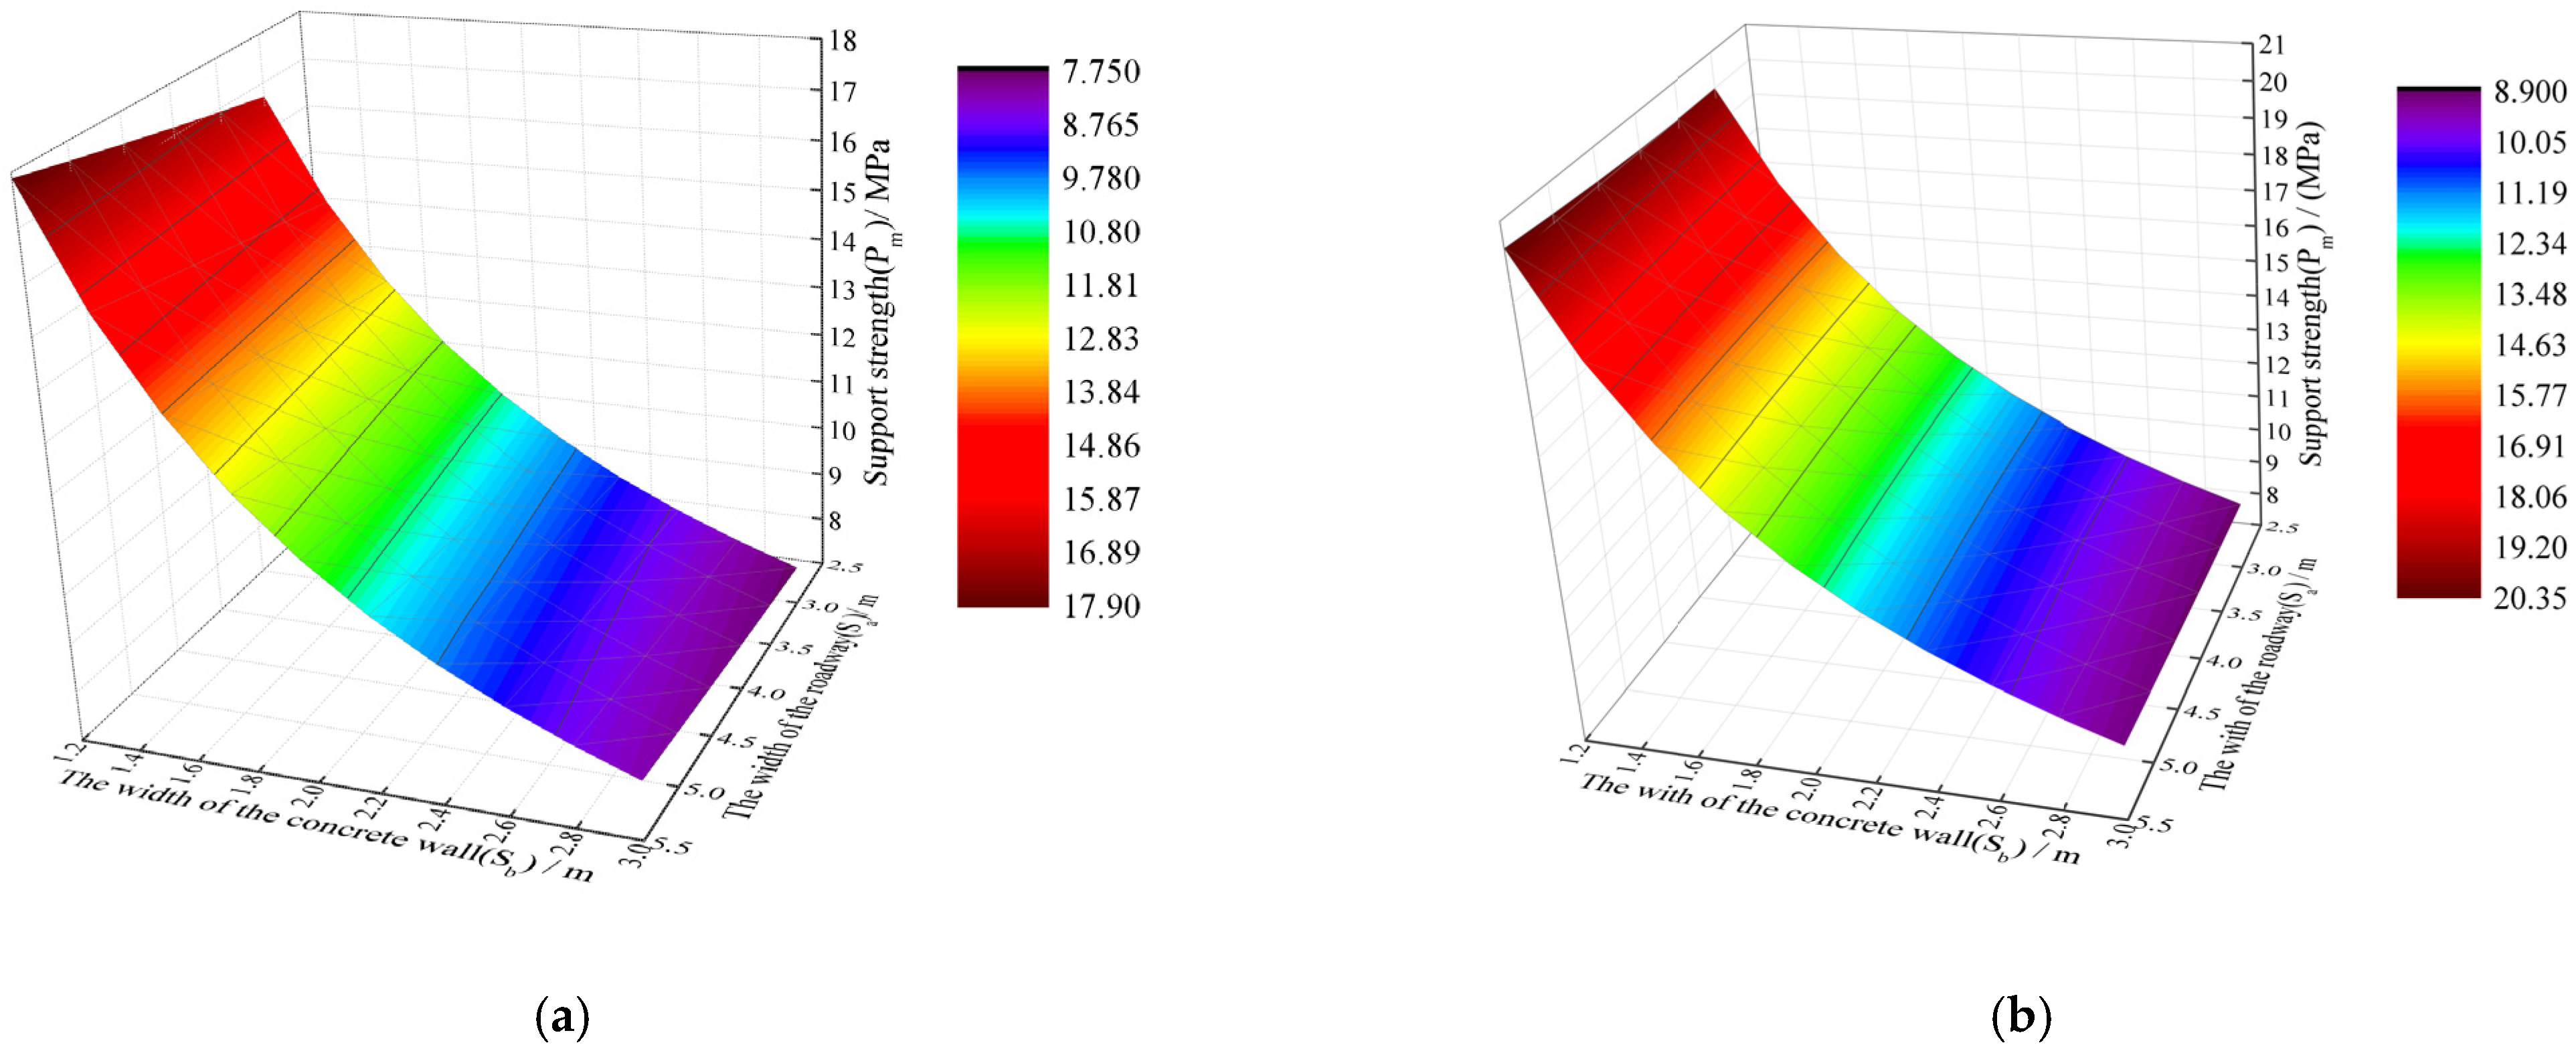
3.3. Width and Support Strength of Concrete Wall
4. Numerical Simulation
4.1. Simulation of Concrete Material
4.2. Overview of Indicators of Deviatoric Stress
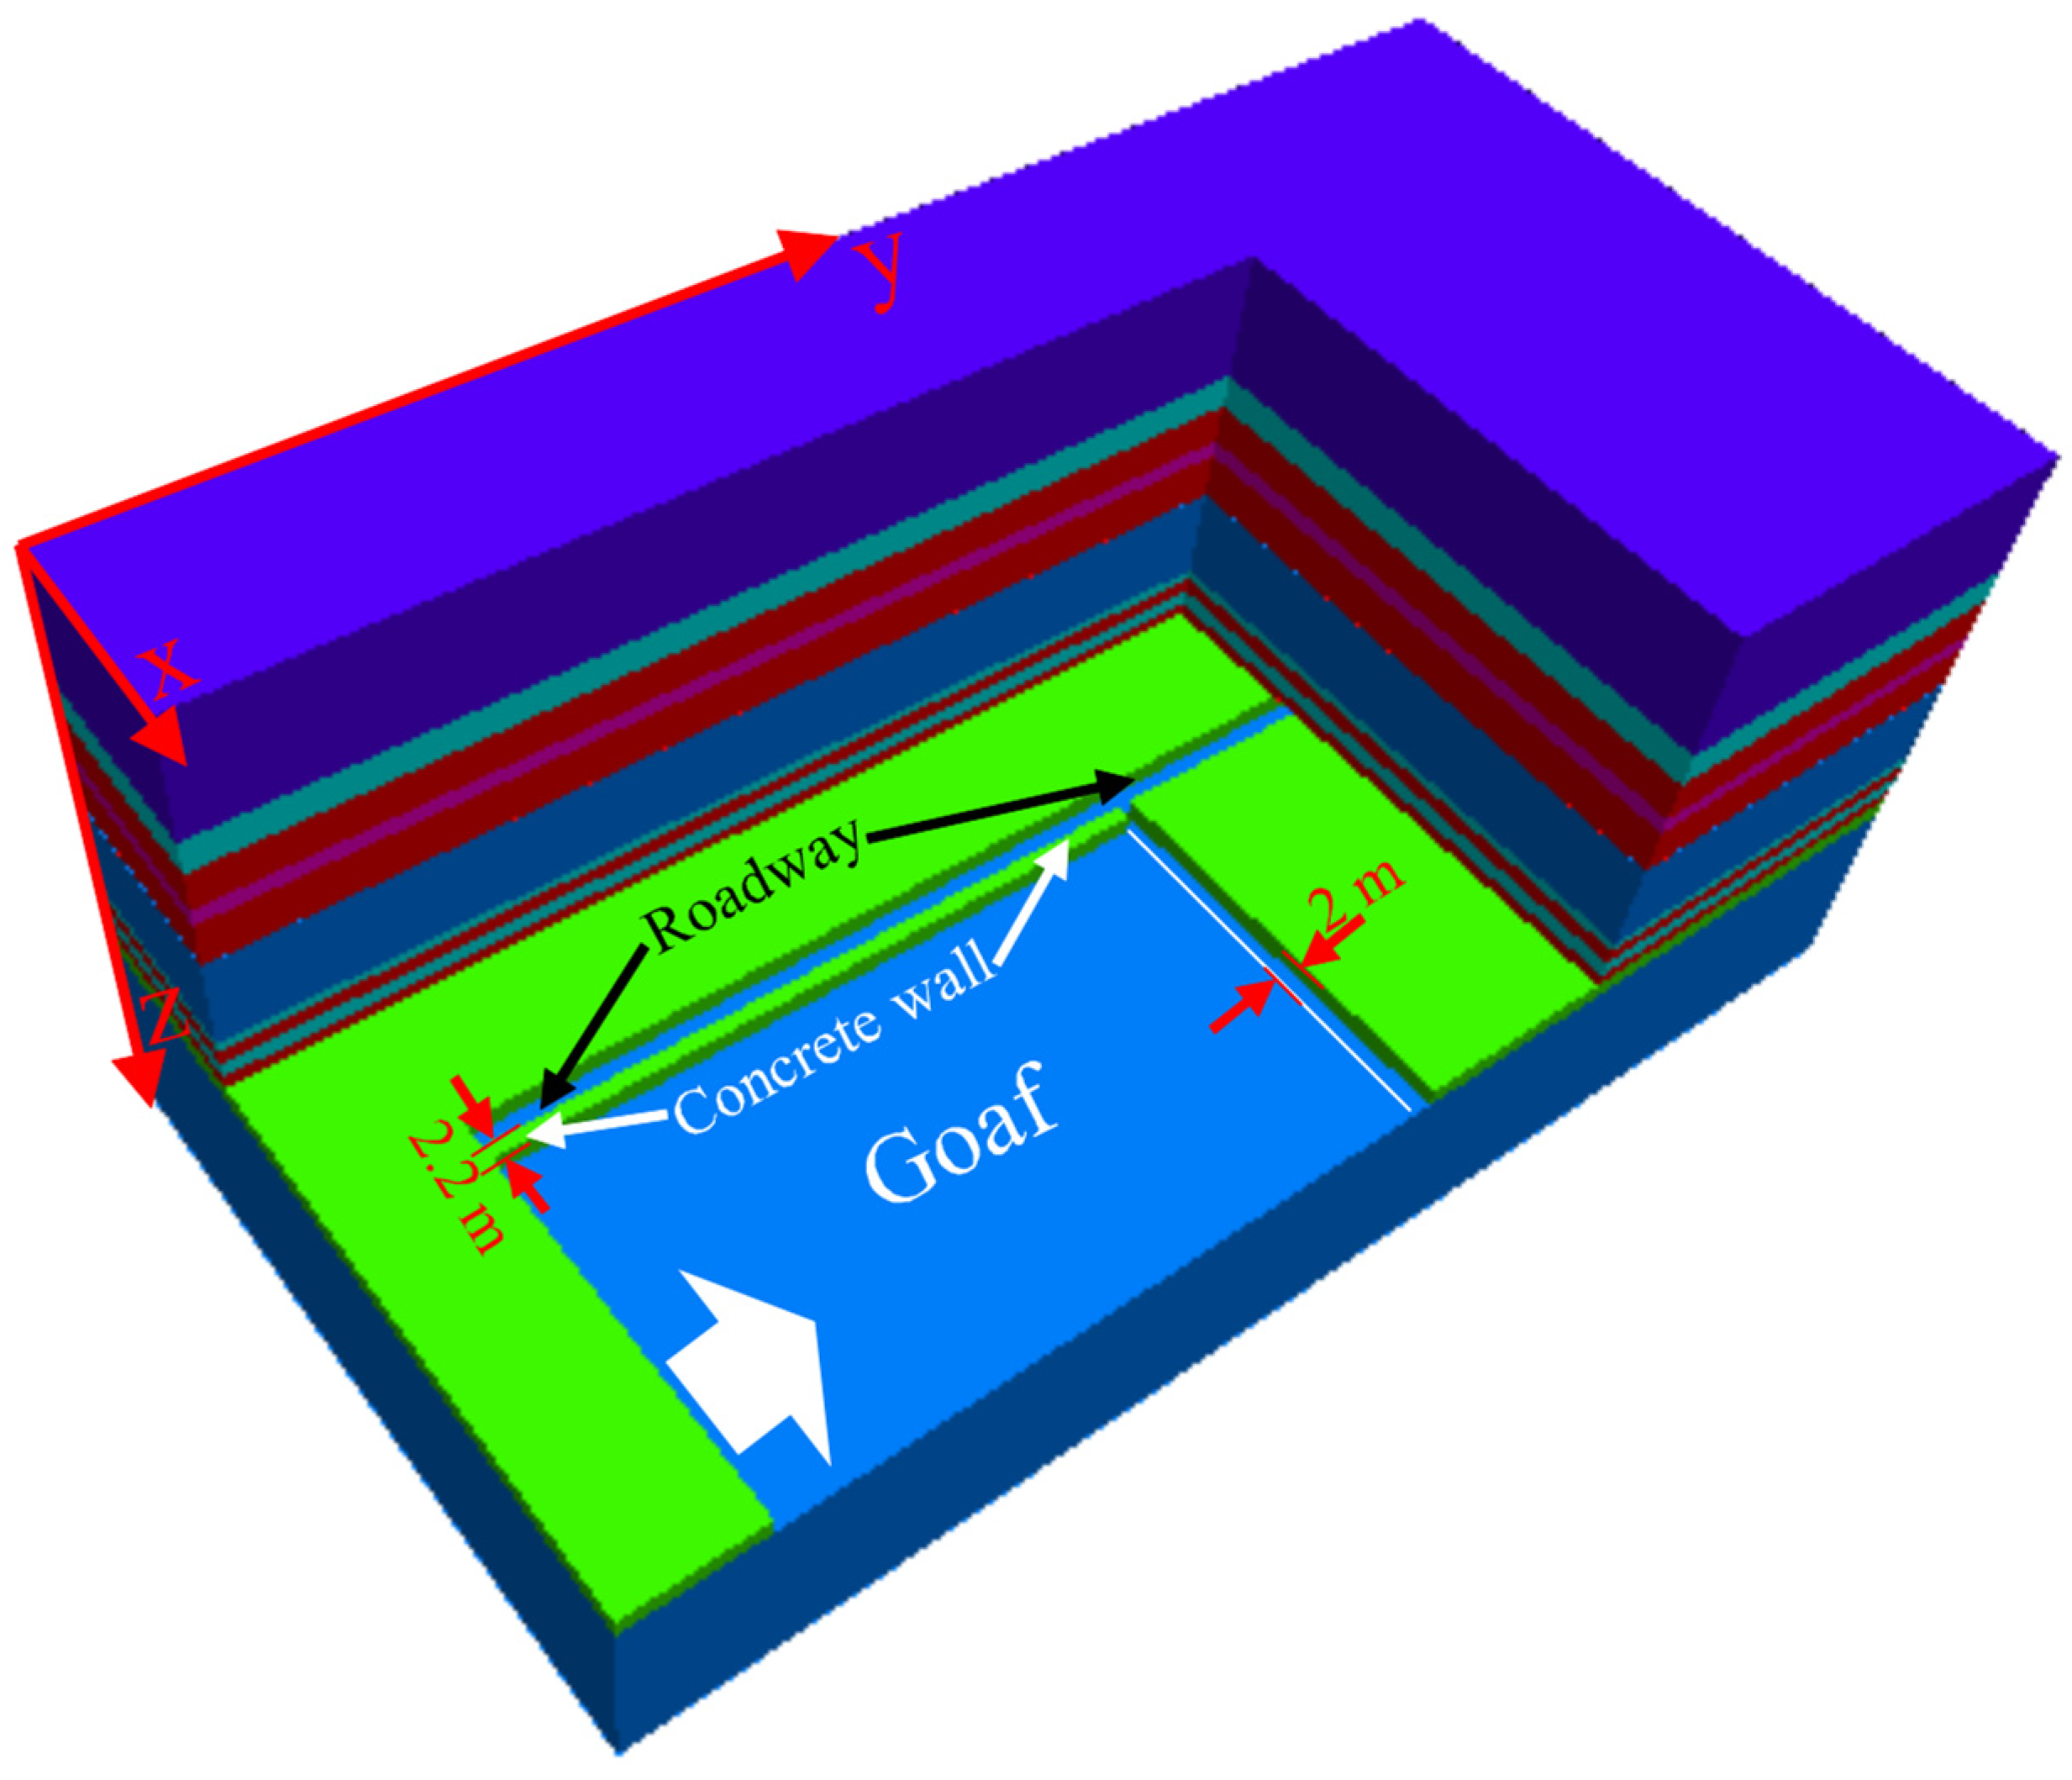
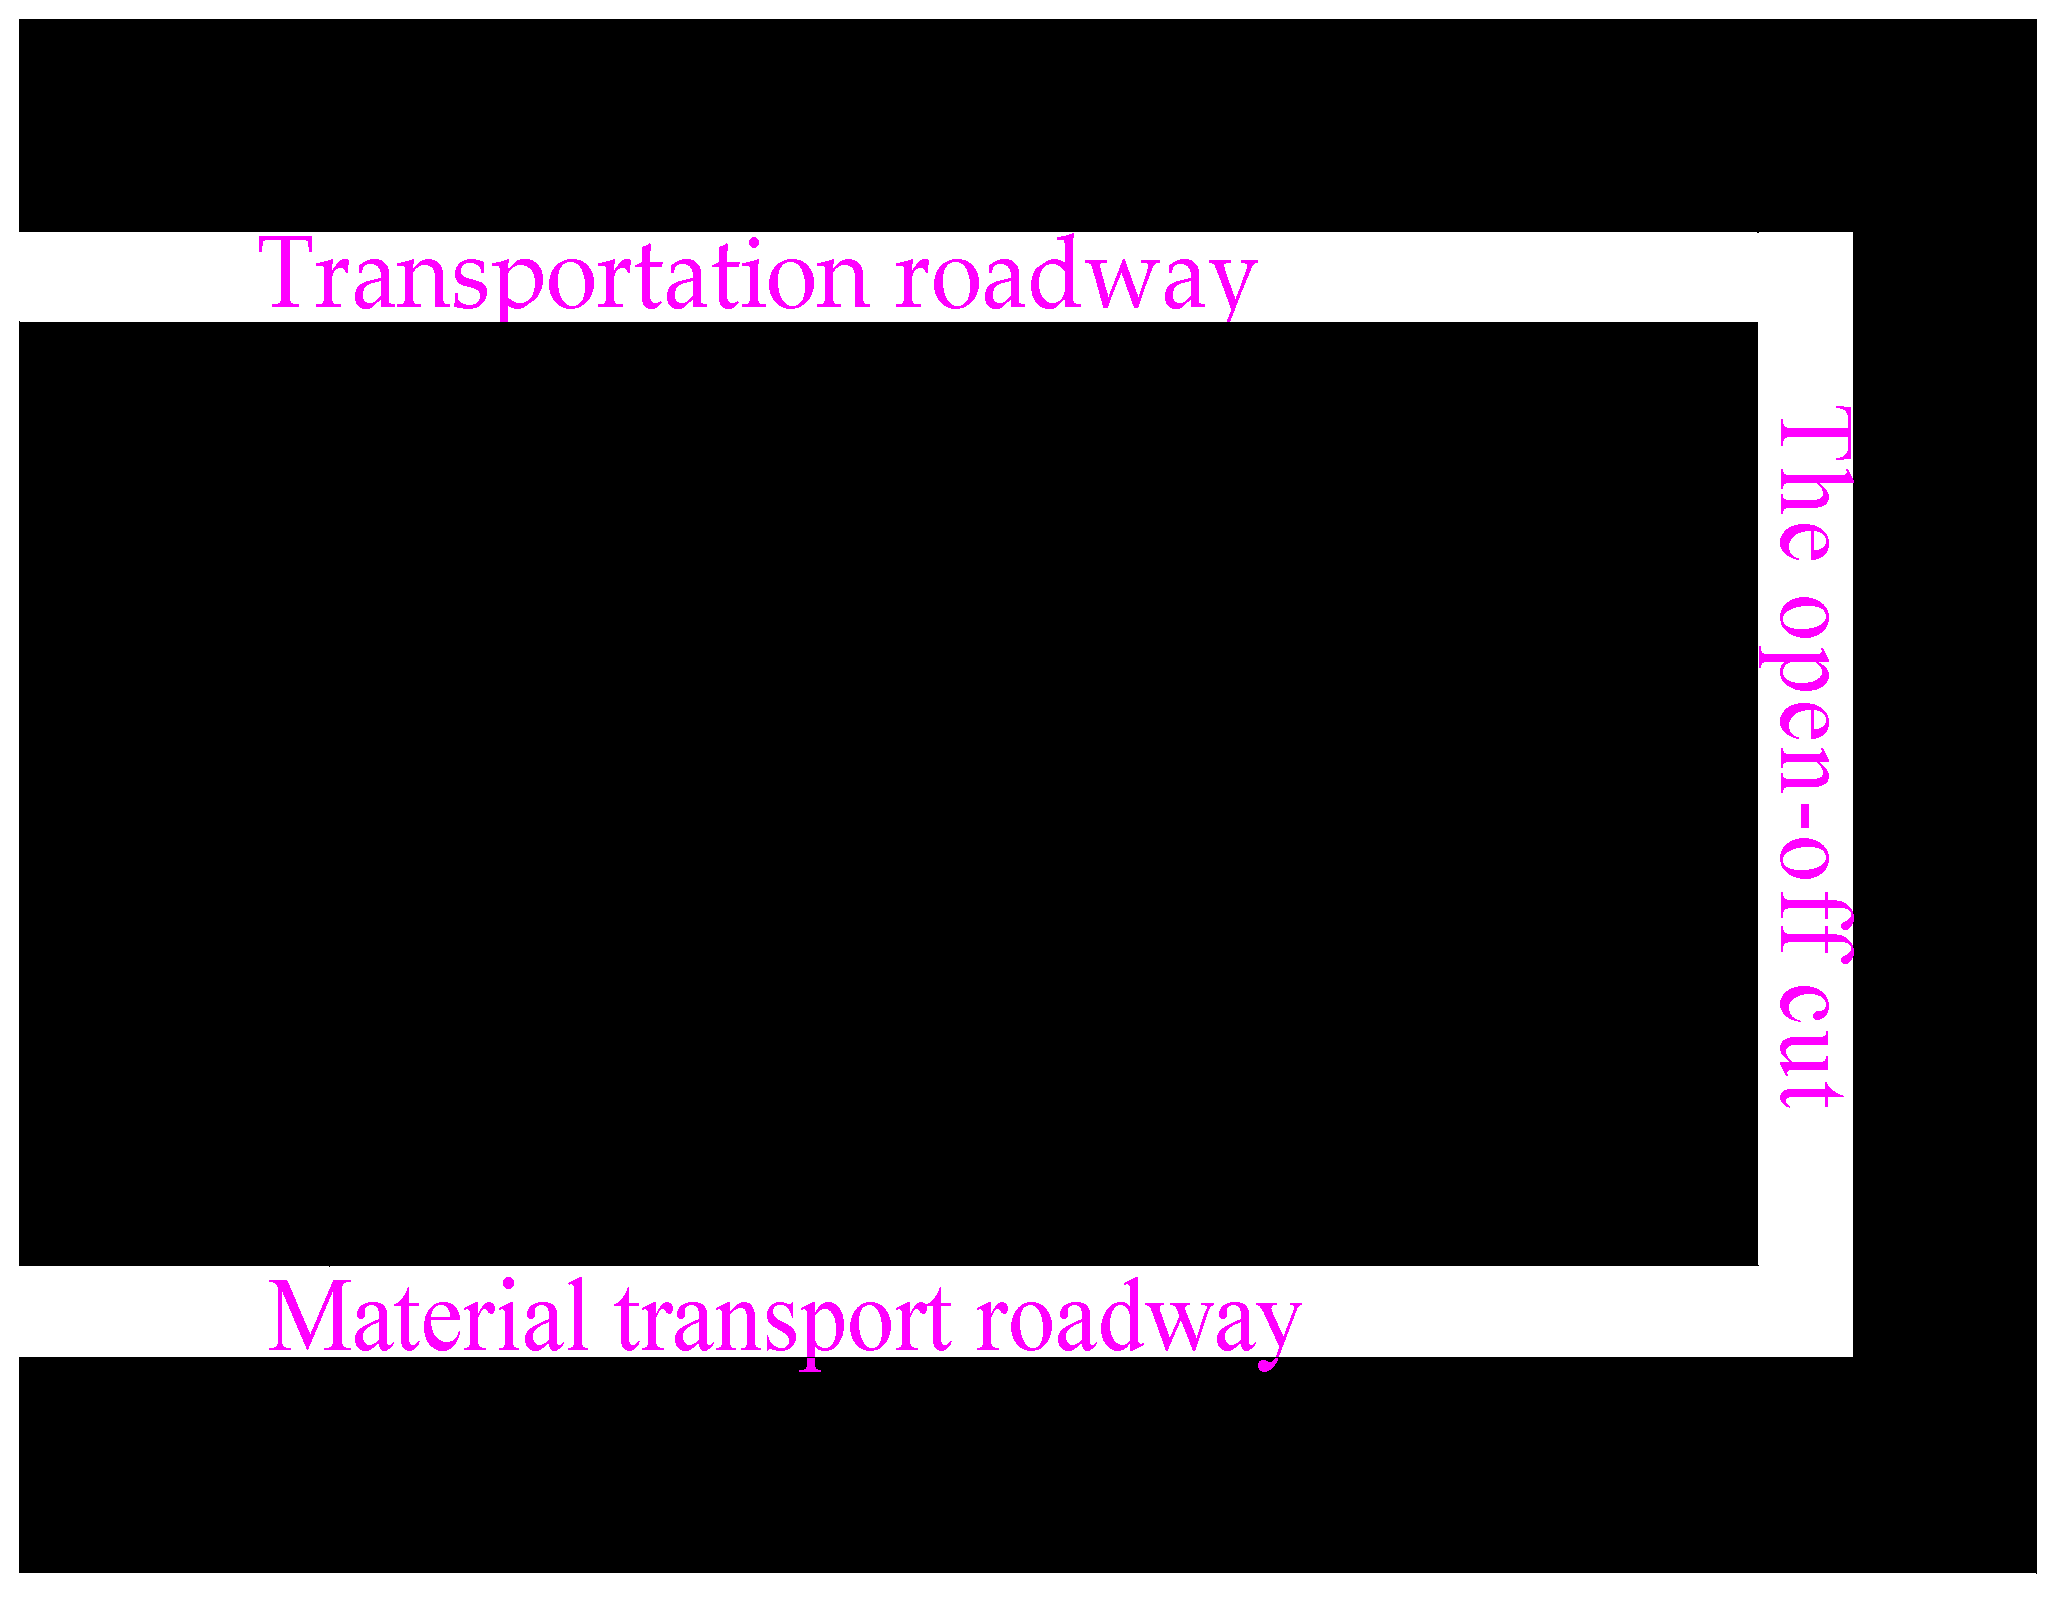
4.3. Establishment of Working Face Model
- At 40 m, 40 m and 50 m from the edge of the model, the haulage roadway, the auxiliary haulage roadway and the open-off cut of the working face are excavated to form the working face, as shown in Figure 7.
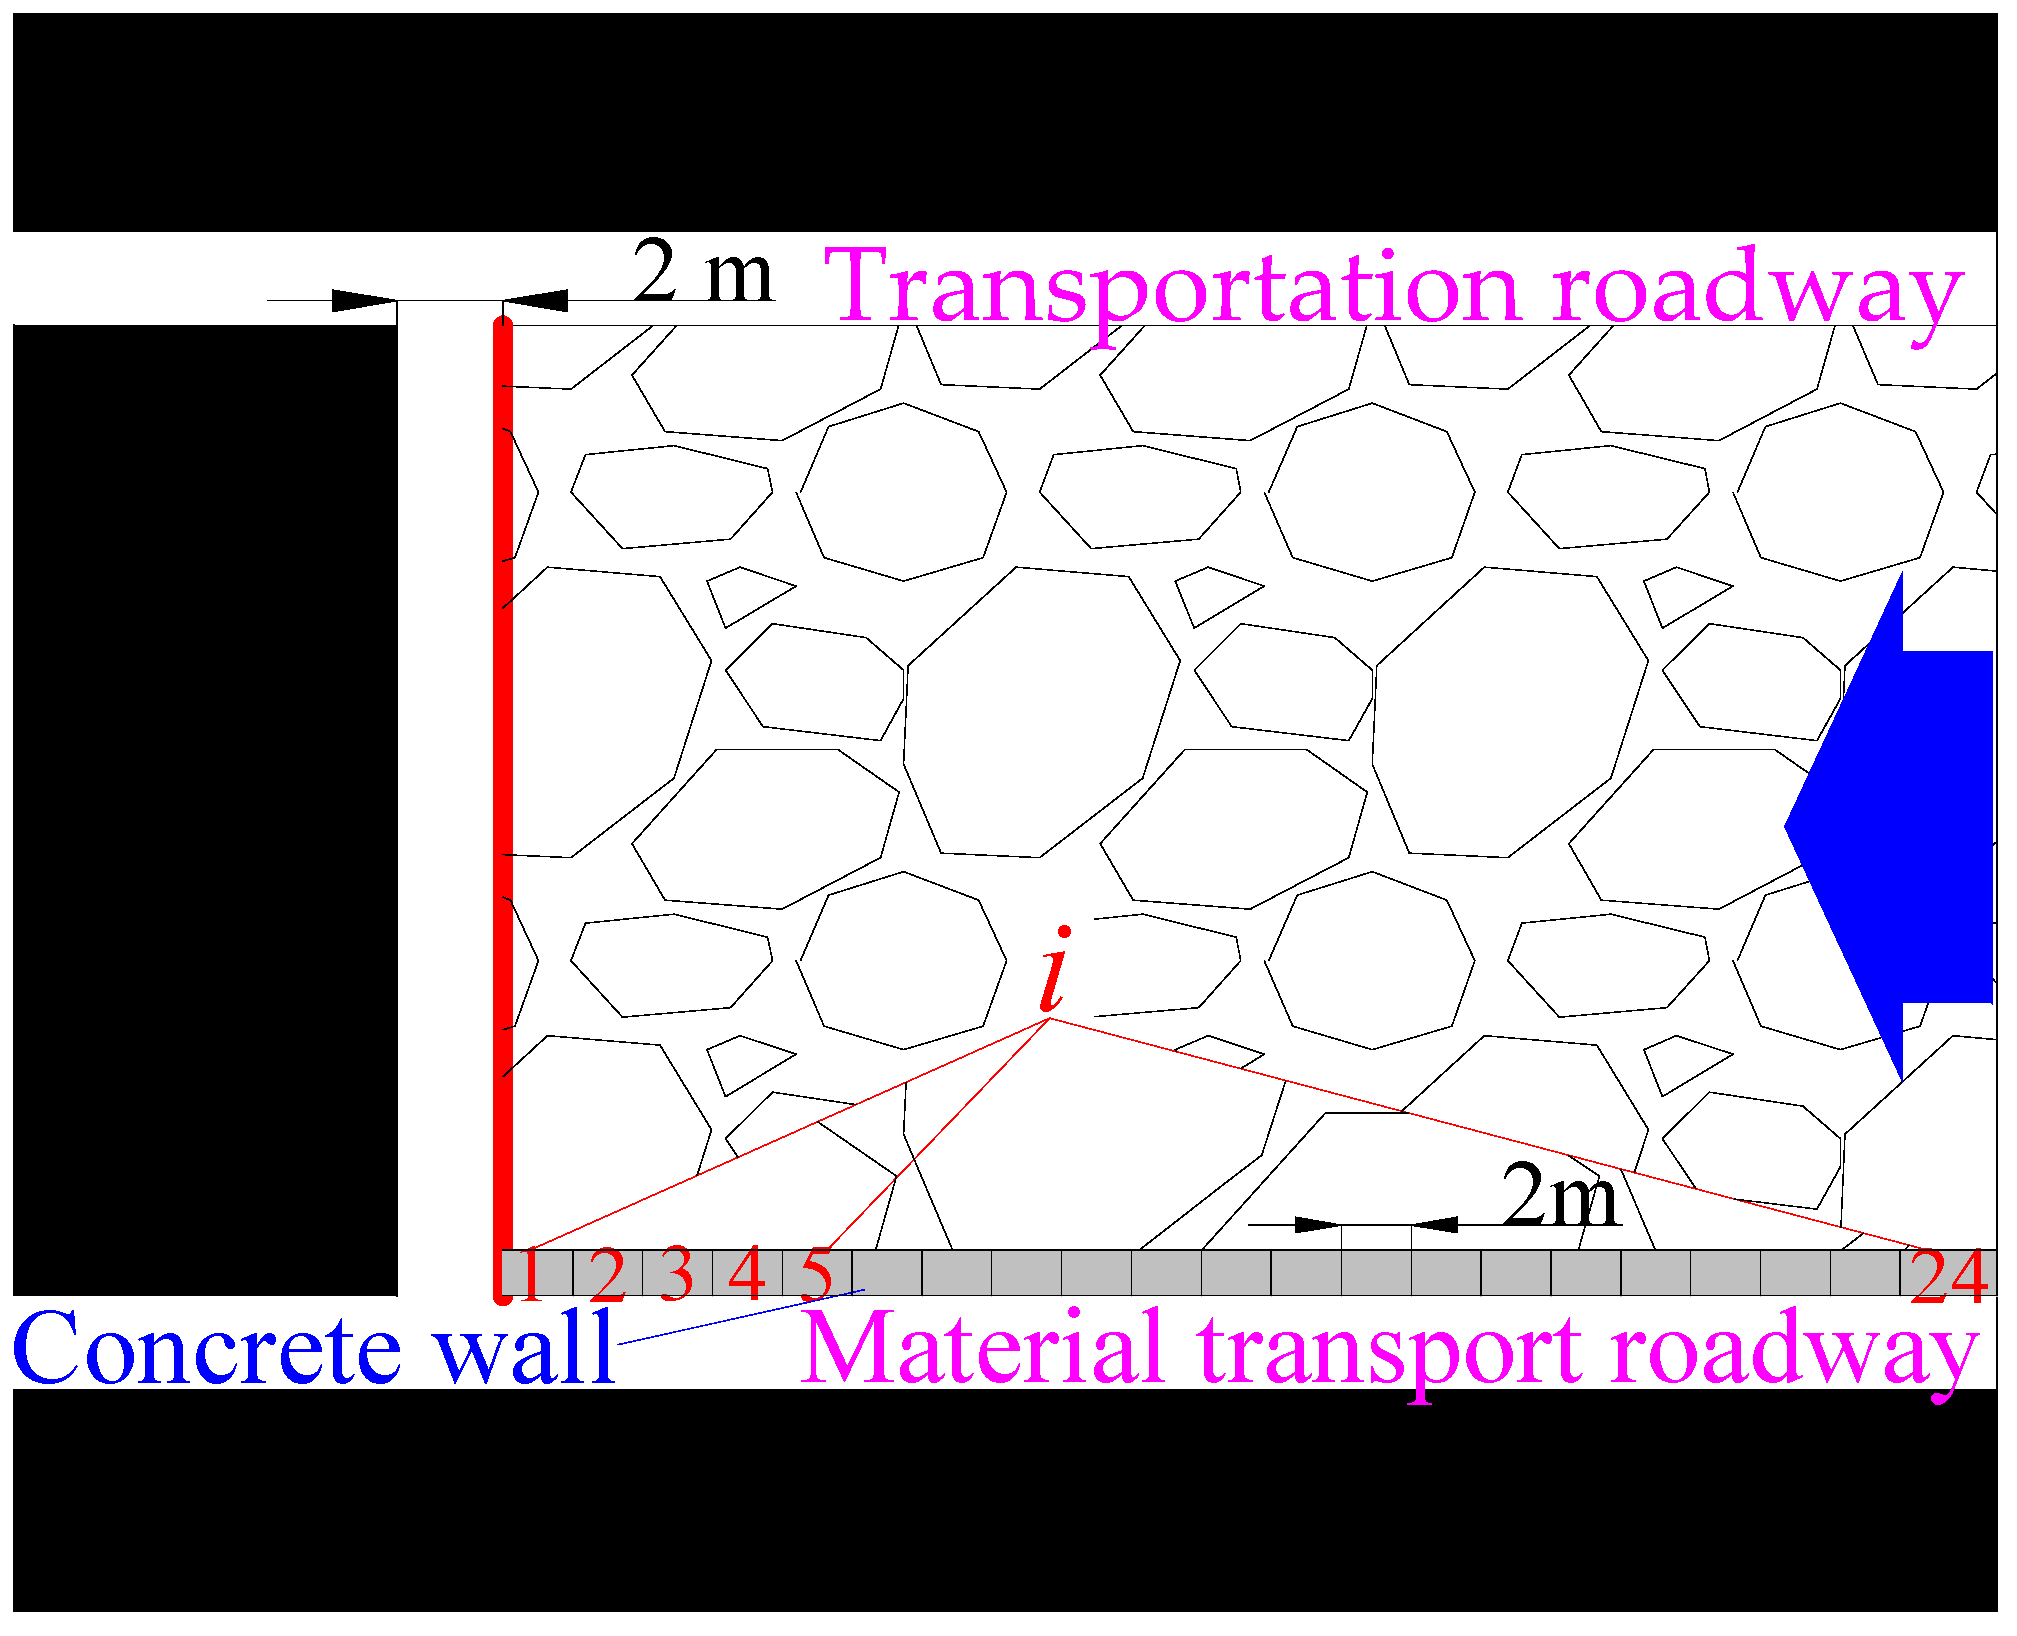
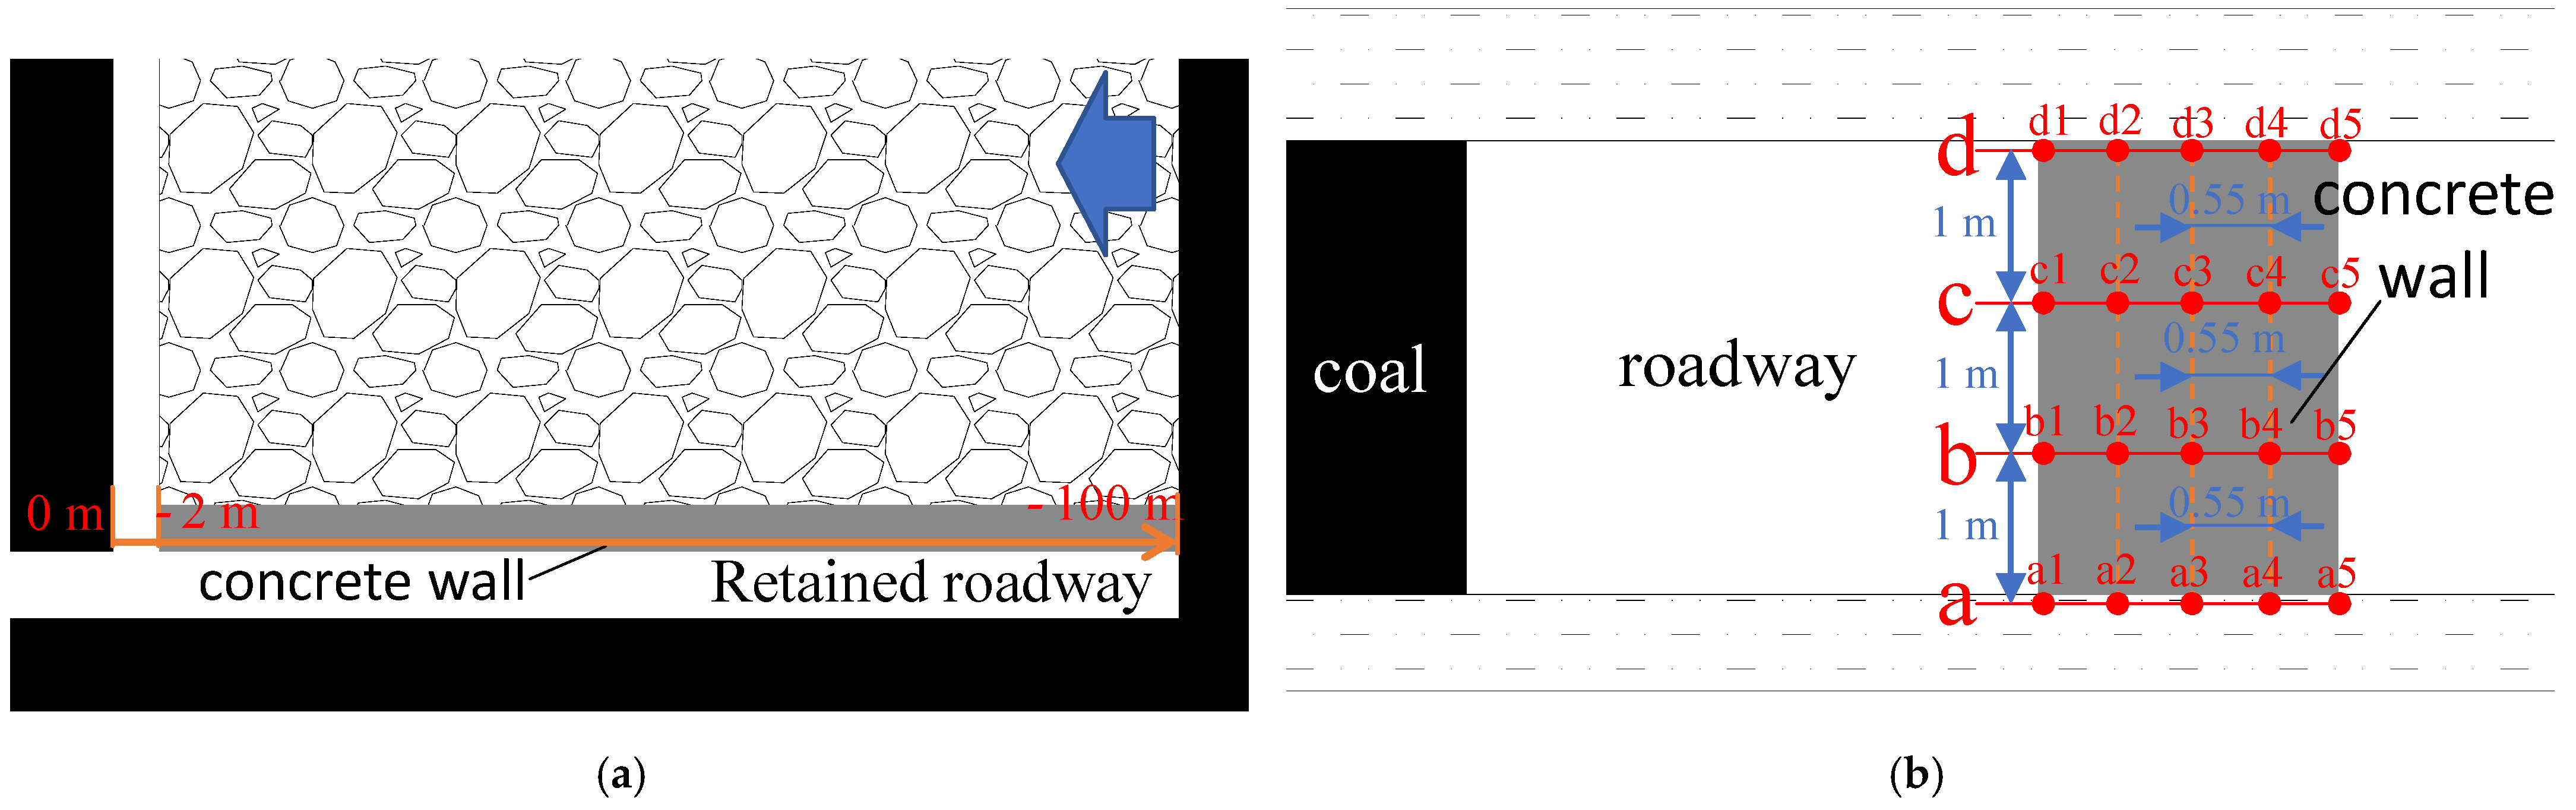
- In the 5504 working face, the advancing distance of each mine is 2 m. The filling length of the concrete wall is 2 m each time. The distance between the end of the concrete wall and the 5504 working face is 2 m.
- The concrete walls at different positions and at different times are given different strength values, that is, the strength of the concrete wall near the working face is lower and the strength of the concrete wall far away from the working face is higher. As in Figure 8, “i” represents the serial number of the concrete wall from the mining working face to the open-off cut of working face. When “i = 1” is the mechanical parameter of concrete curing for 1 day, “i = 2” is the mechanical parameter of concrete curing for 2 days and “i = 3” is the mechanical parameter of concrete curing for 3 days; until “i = 24” or above, the mechanical parameter will not be re-assigned.
4.4. Deviatoric Stress Distribution Law
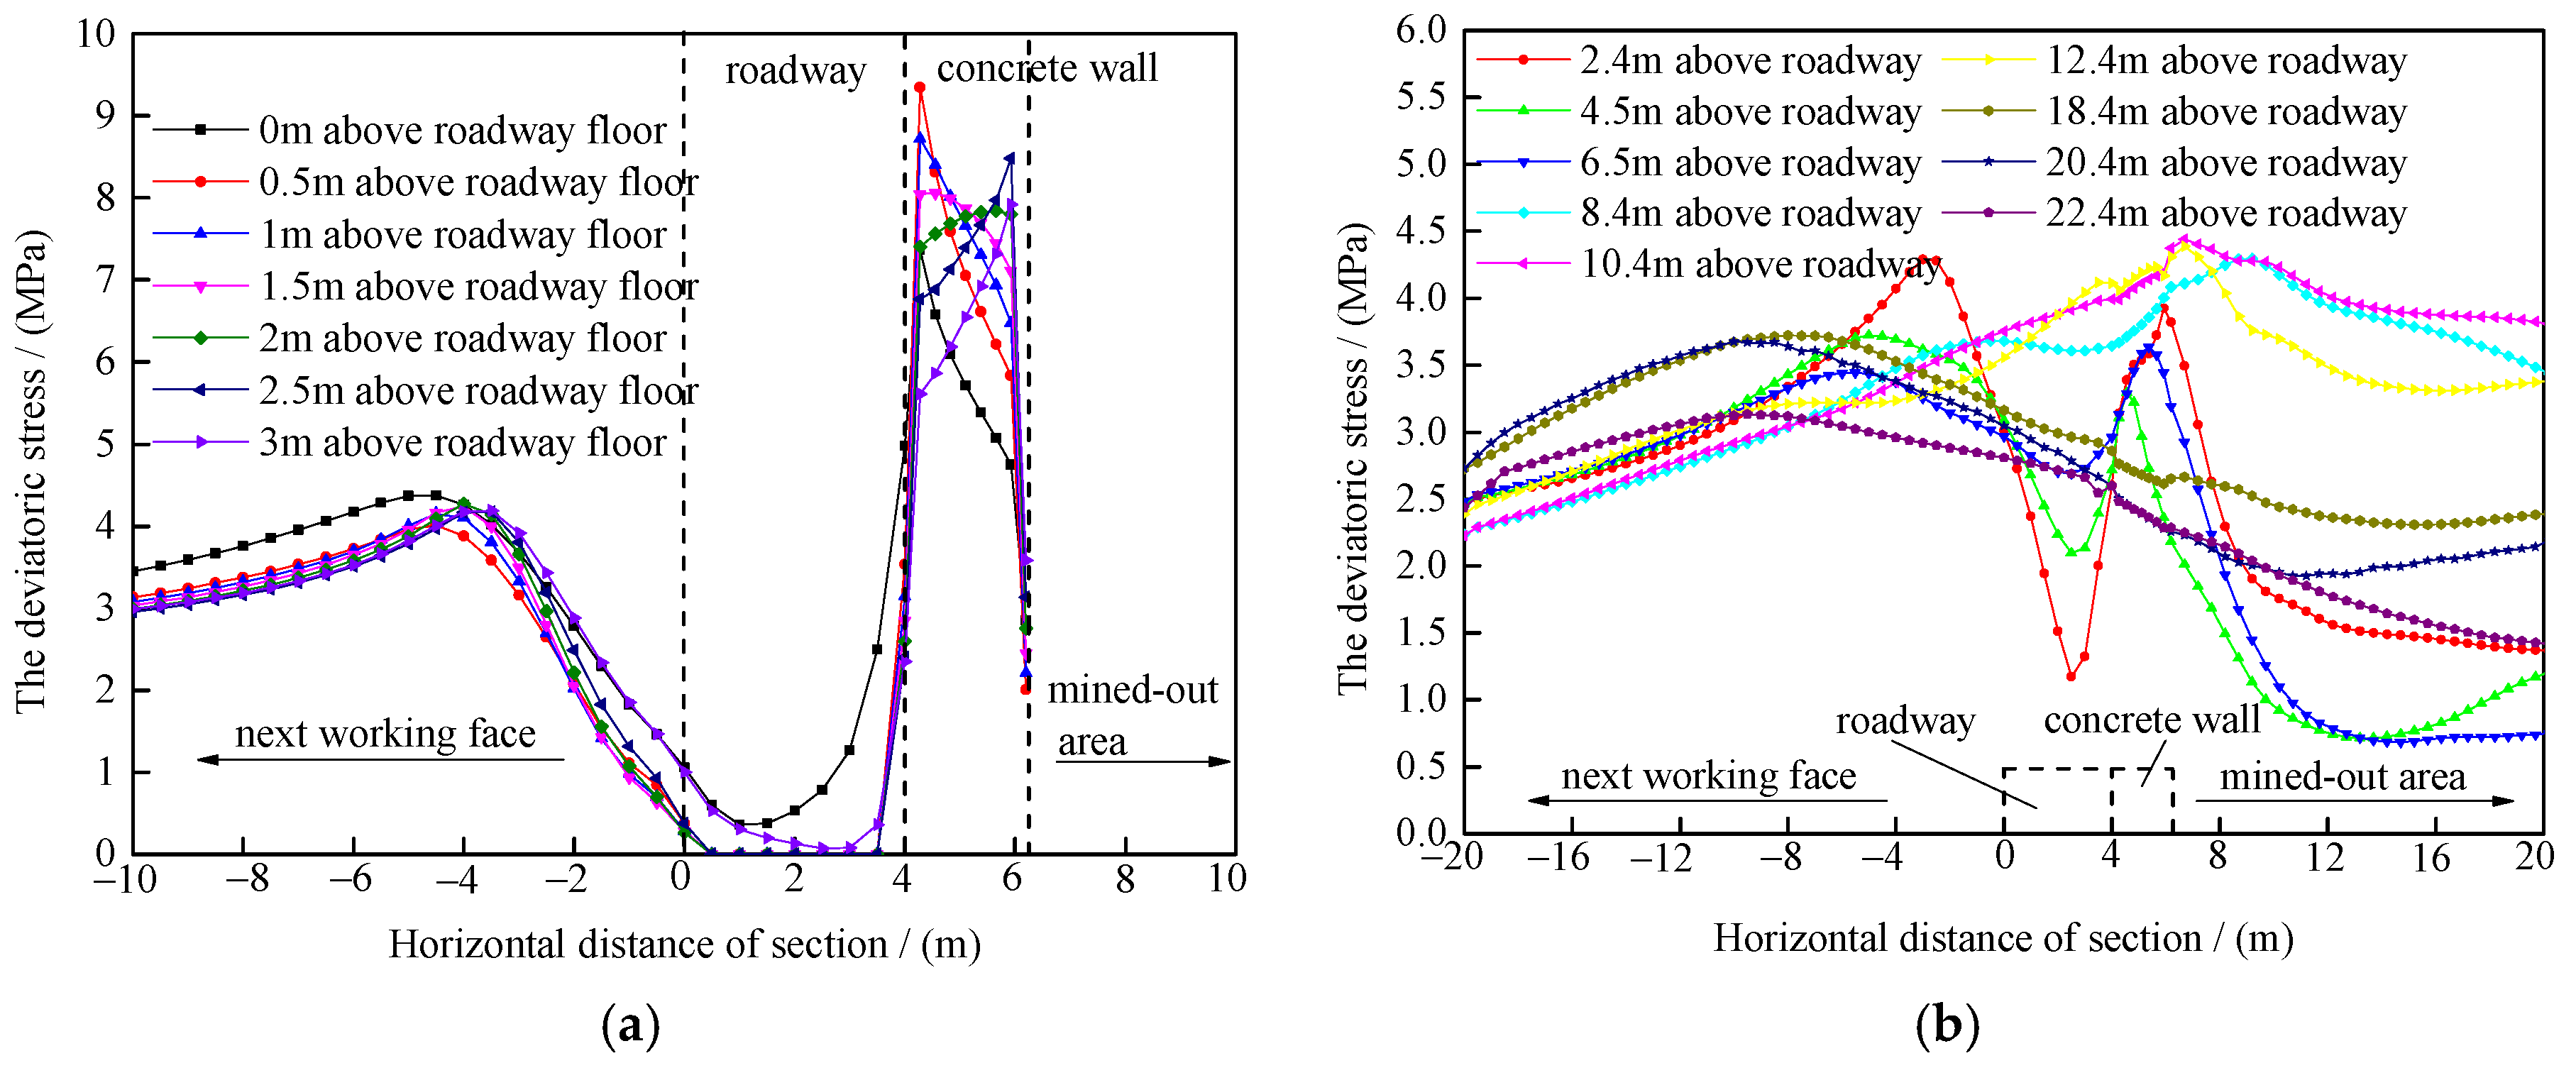
4.4.1. Deviatoric Stress Distribution Law at Different Section Positions
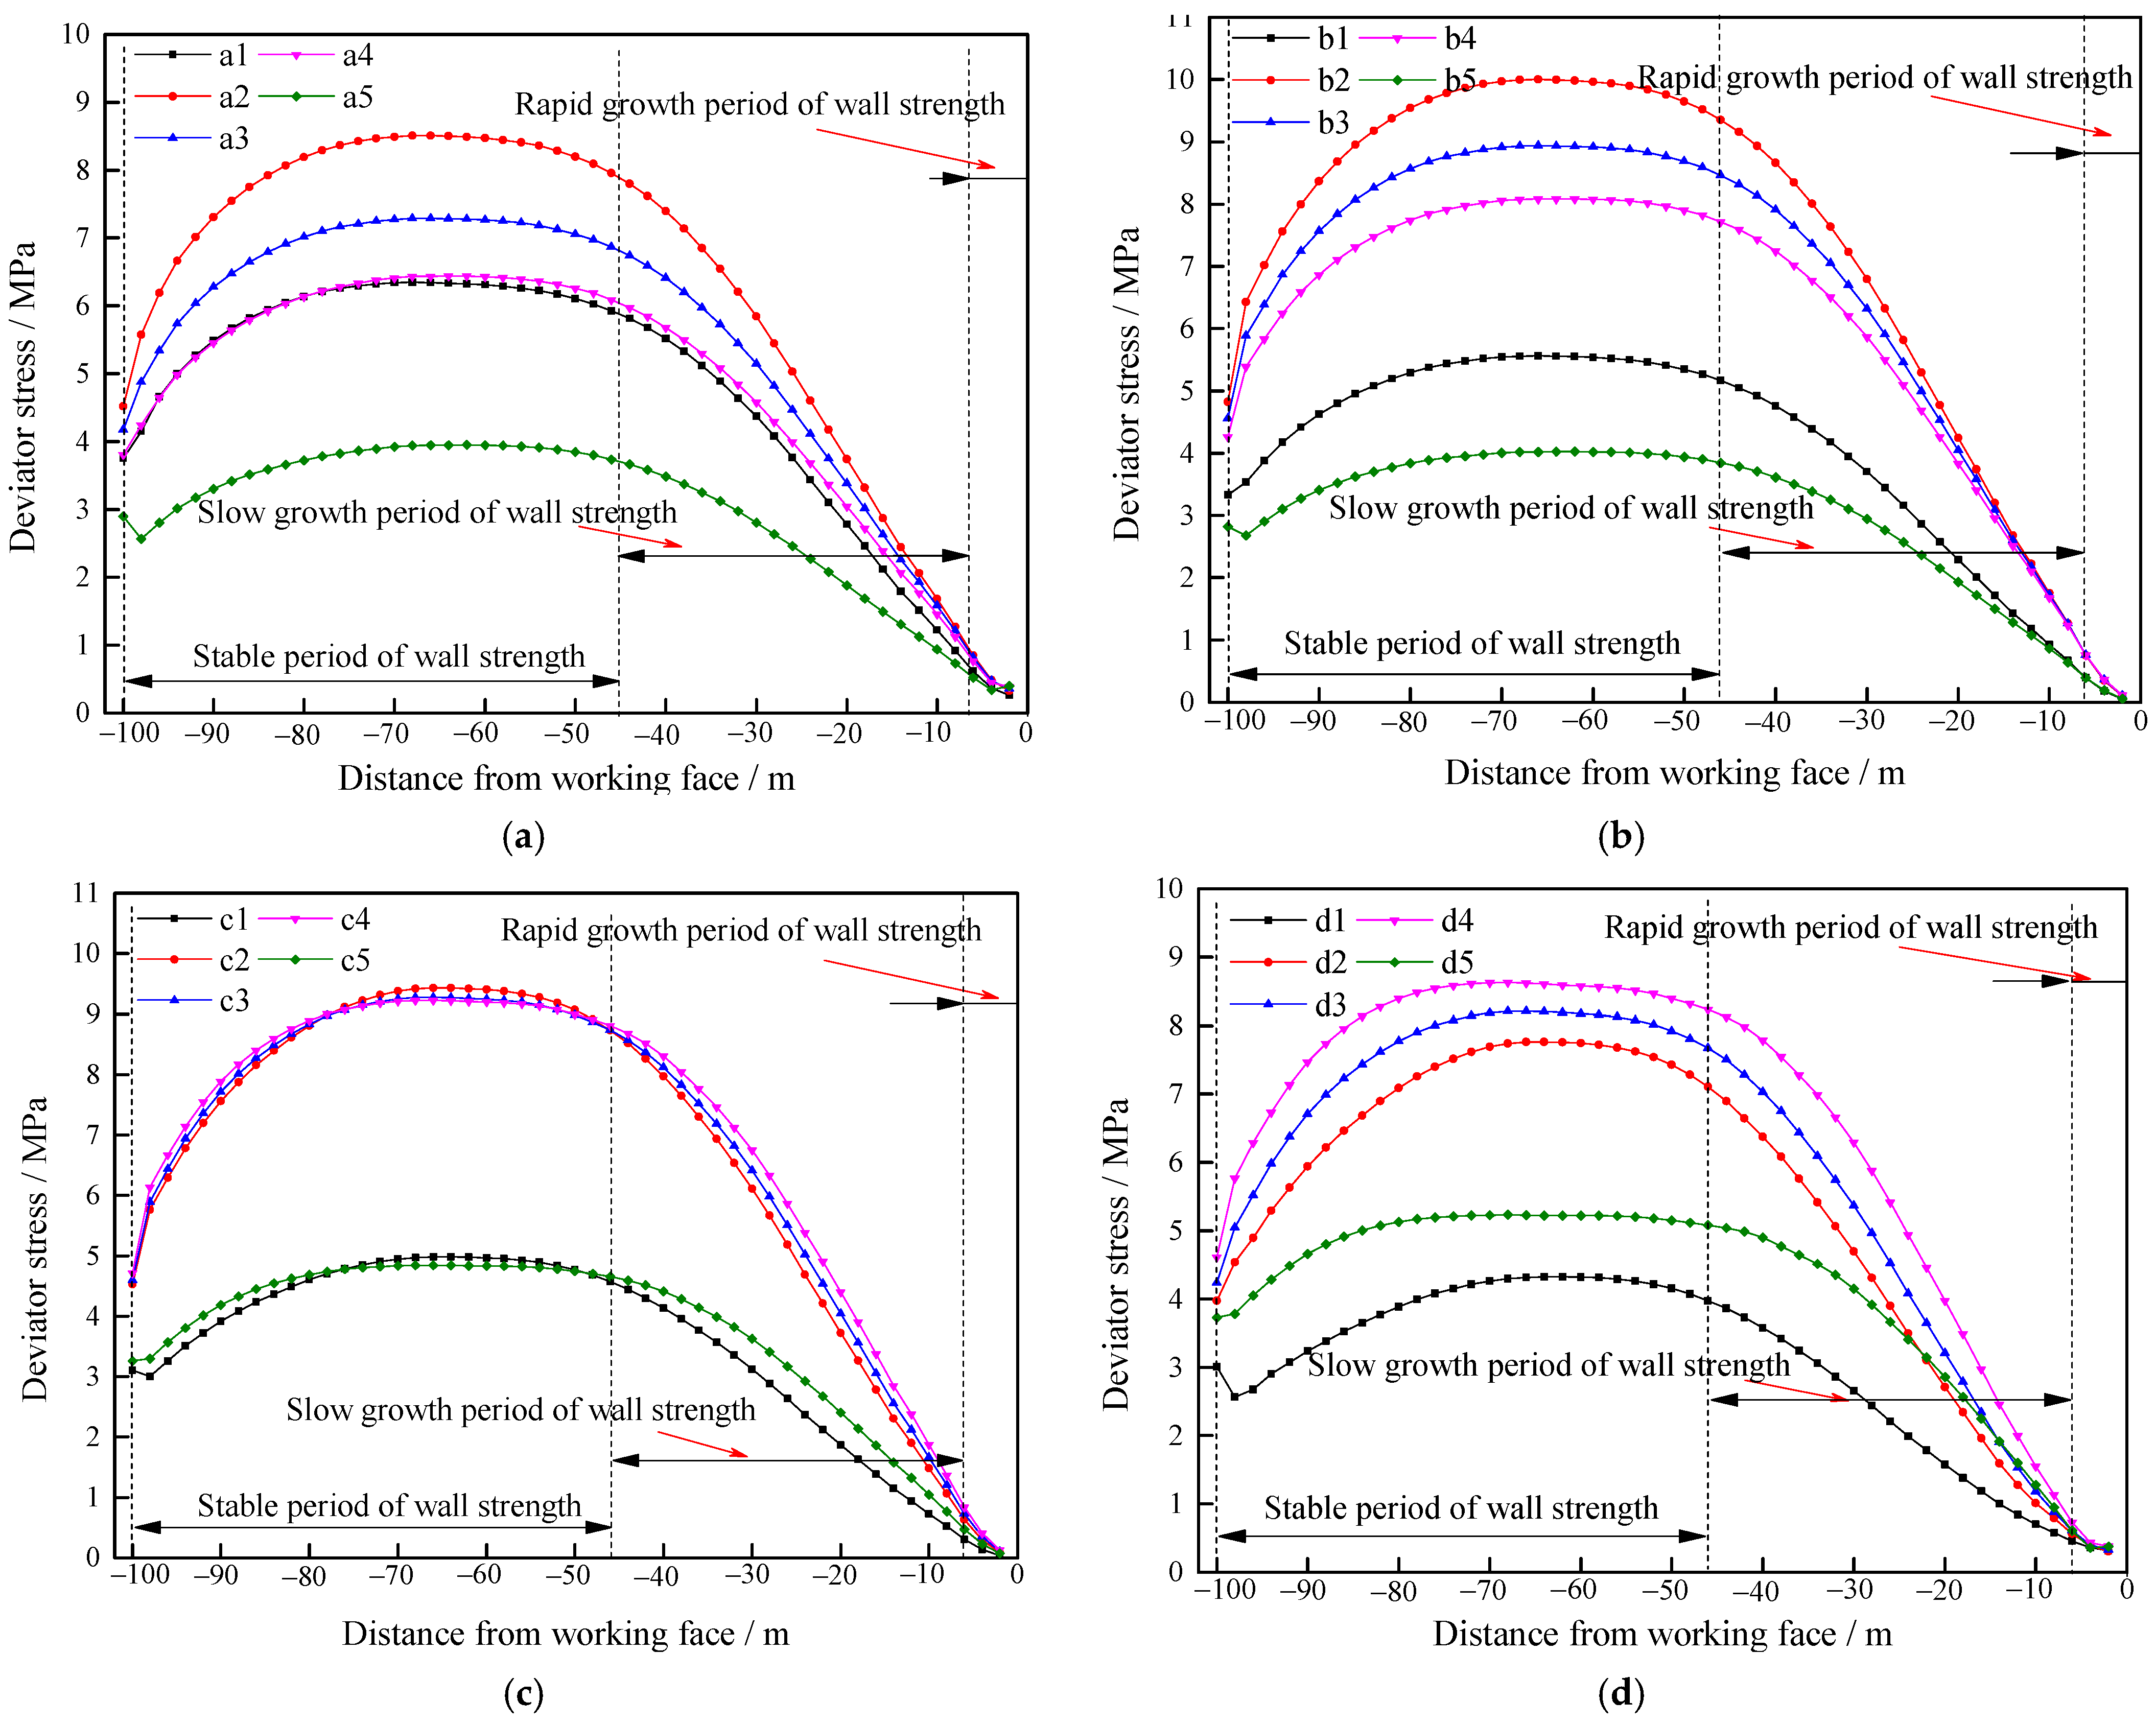
4.4.2. The Curve of Deviatoric Stress Distribution in Concrete Wall
4.4.3. Deviatoric Stress Distribution of Surrounding Rock of Retained Roadway
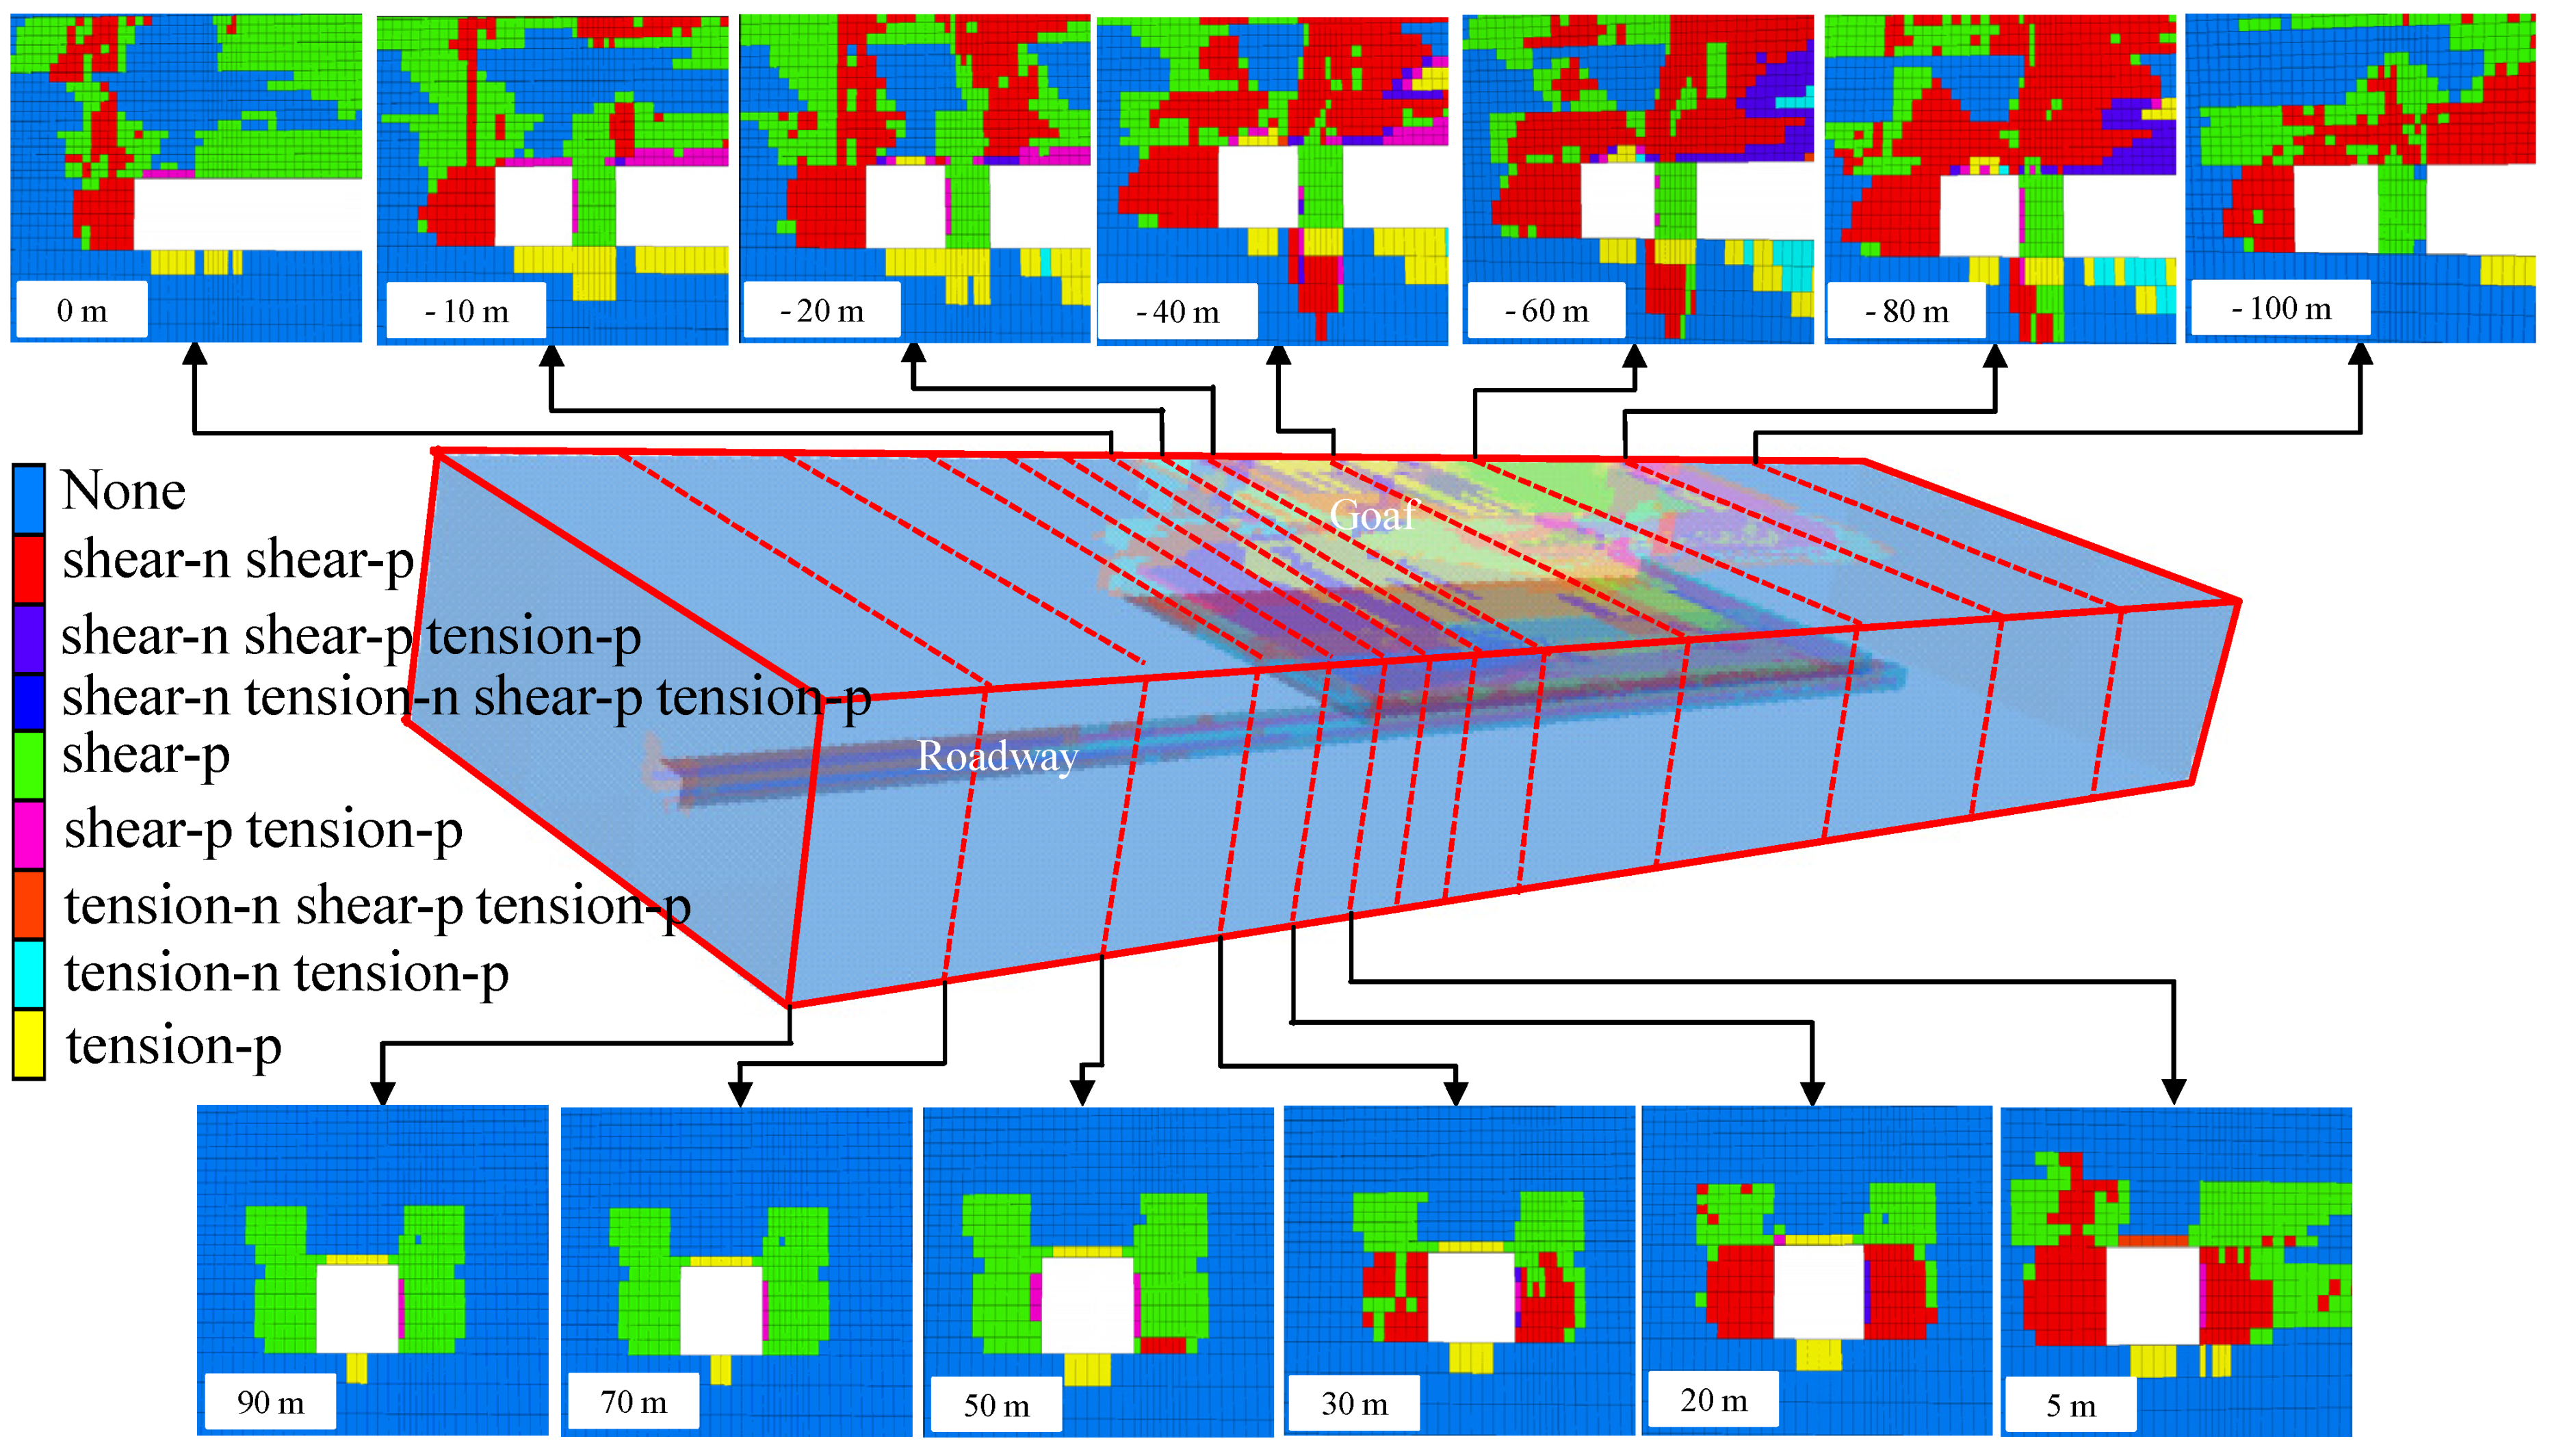
4.5. Damage of Surrounding Rock of Roadway
5. The Control Mechanism and Technology of Roadway Surrounding Rock
5.1. The Supporting Mechanism of the Surrounding Rock
- (1)
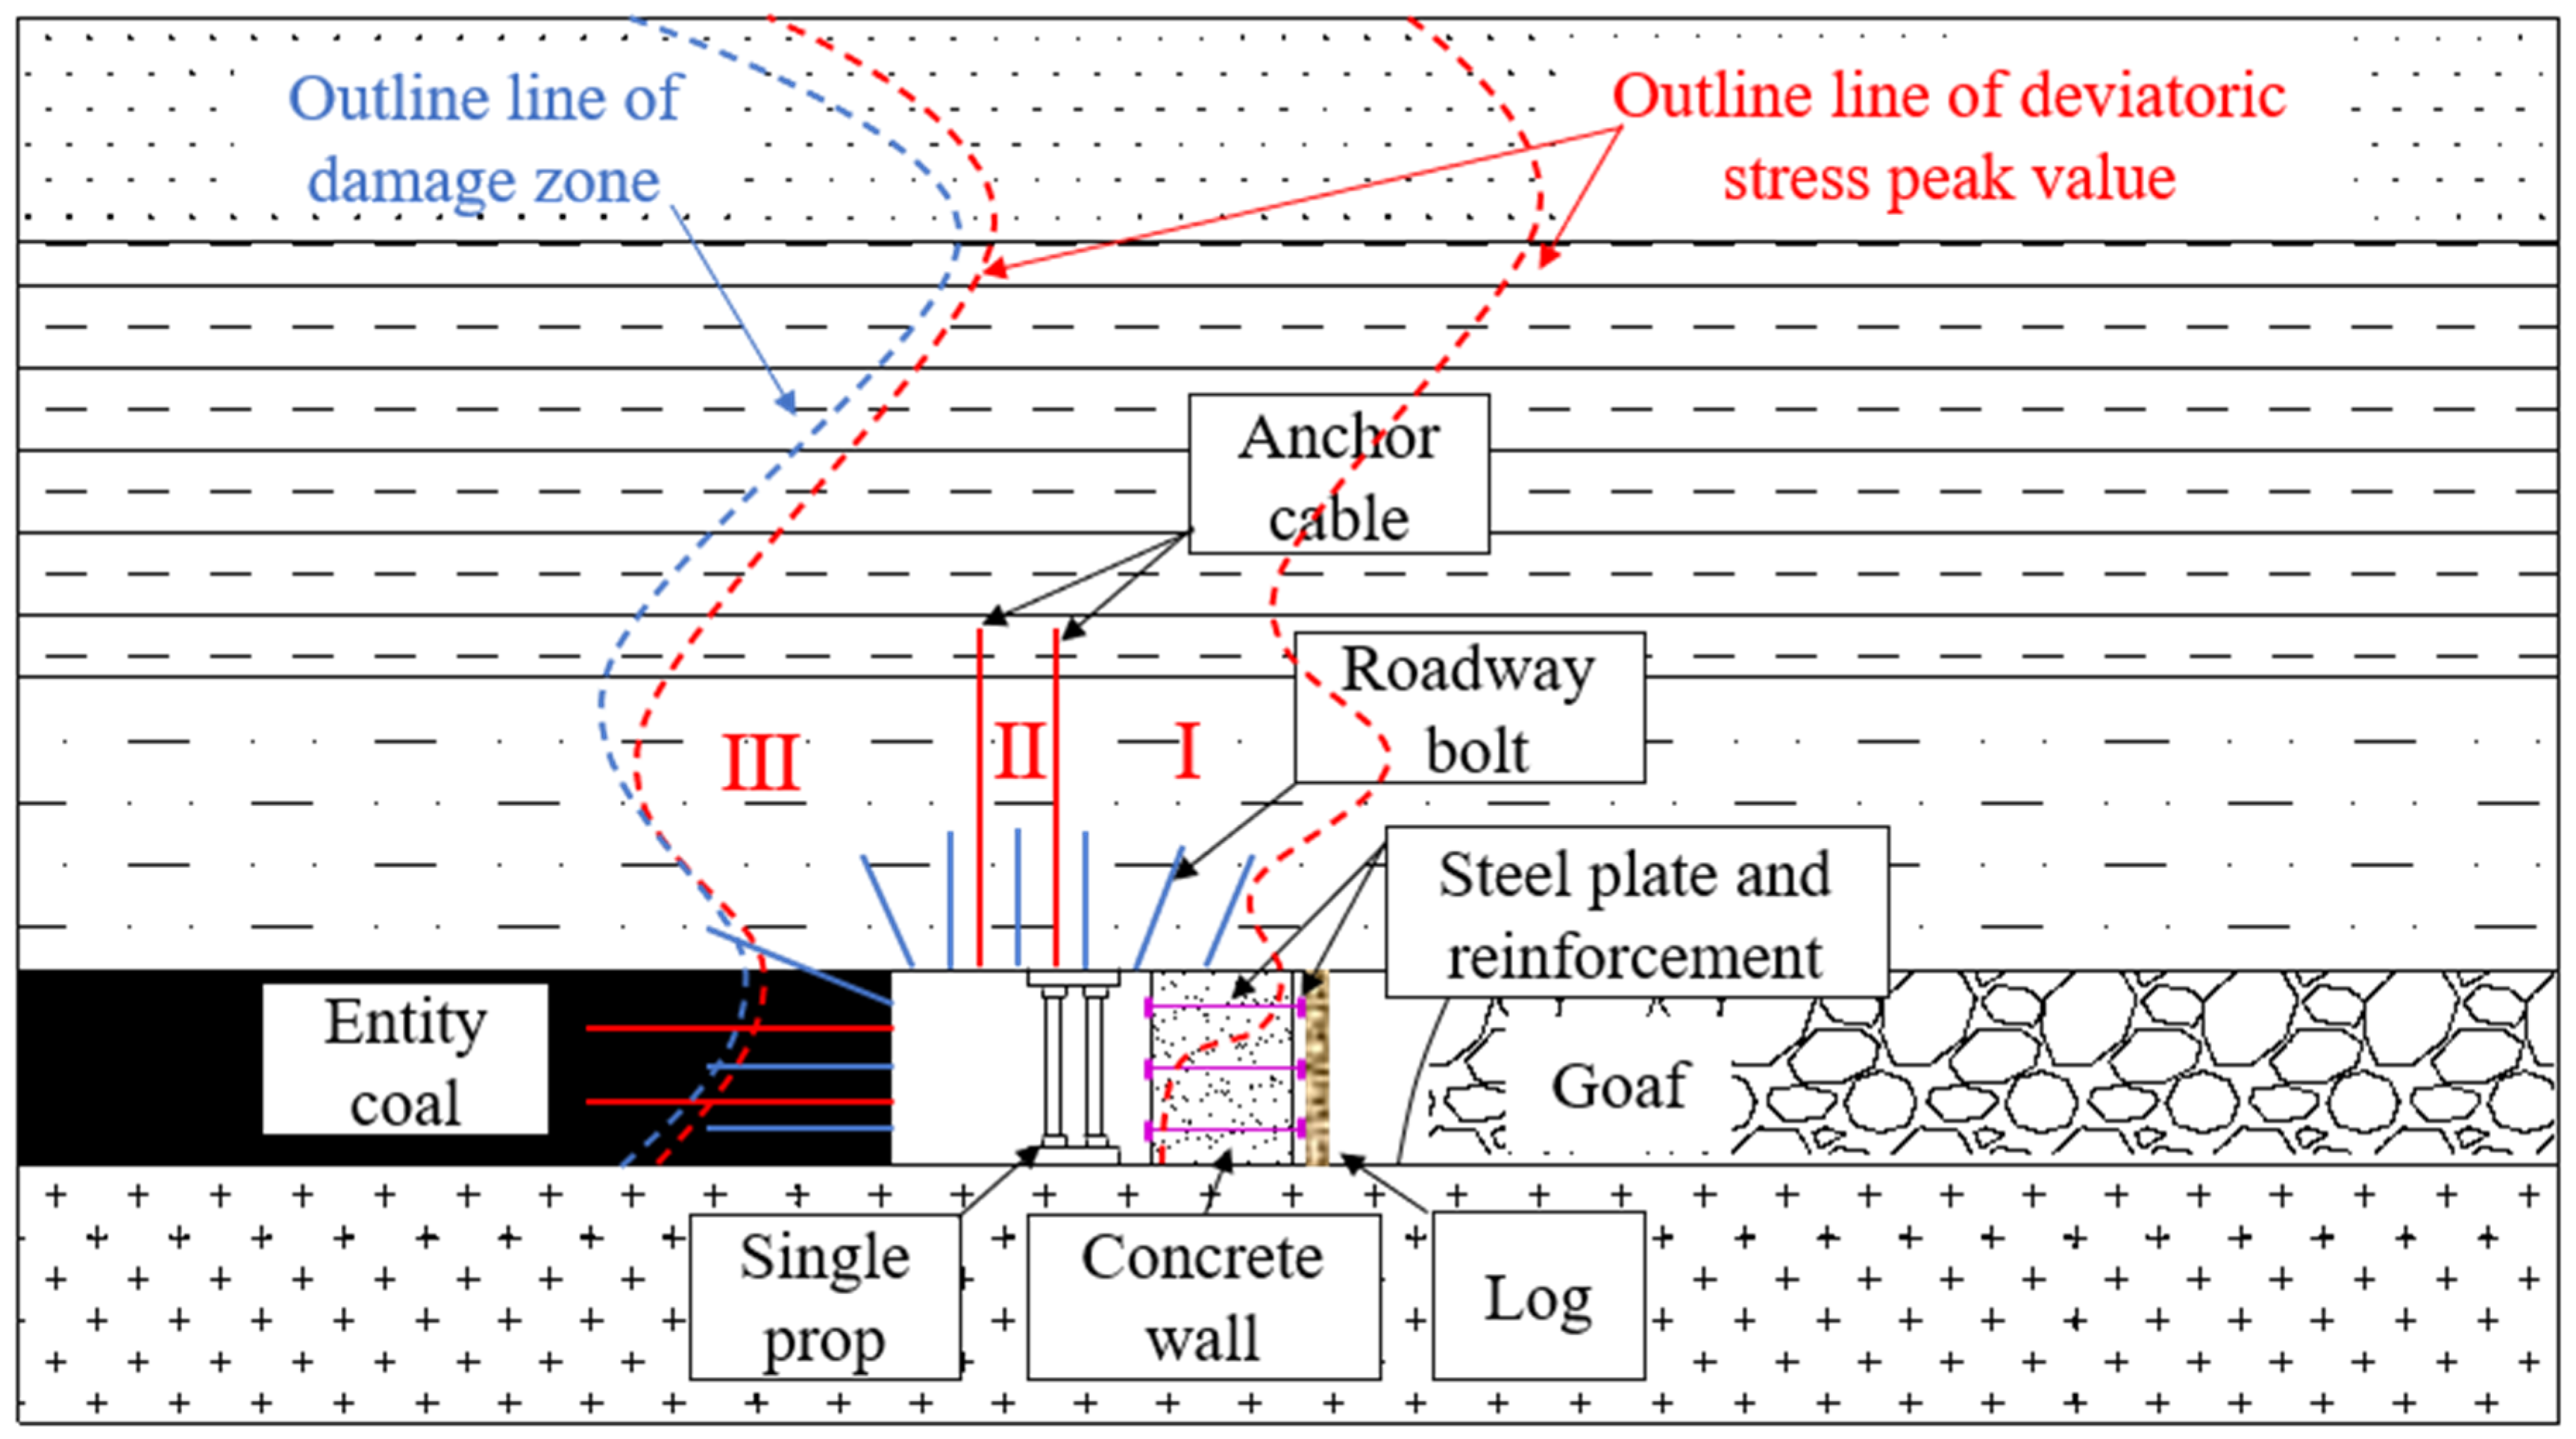
- Research shows [24] that it is necessary to control the stability of the rock mass in the area surrounded by outline line of peak deviatoric stress. The anchor cable passes through the outline line of deviatoric stress peak value, which can control the unstable rock mass between the outline line of the deviatoric stress peak value and the roadway edge. Therefore, in zone III, the anchor cable passing through the outline line of the deviatoric stress peak and the outline line of the damage zone can combine the shallow bearing structure with the deep bearing structure to form a composite bearing structure. The formation of the composite structure can effectively change the stress state of the surrounding rock, restrain the deformation and tension-shear failure of the surrounding rock and, finally, maintain the integrity of the surrounding rock [10].
- (2)
- In zone I, the anchor rod is added to the roof strata to enhance the integrity of the overlying rock of the filling area. The compressive strength of the concrete wall reaches 10.87 MPa after being filled for 3 days, so the single hydraulic support is arranged in the gob-side entry as temporary reinforcement support. Before the strength of the concrete wall reaches the required strength, the single hydraulic support can provide larger support resistance, bear the roof load, control the separation of the roof strata, control the rotation rate of the roof, but also can transfer the pressure of the overburden to the floor, and exert reverse binding force on the floor and play a role in controlling floor-heave. Reinforcement with steel bars and iron plates should be adopted for the wall, because the concrete wall can form a strong bearing structure under the reinforcement of steel bars and plates, which not only inherits the stiffness of concrete but, also, under the three-dimensional compression under the action of a lateral binding force, and its own bearing capacity, structural integrity and stability are significantly improved, and greatly limit the lateral deformation of concrete and prevent its excessive large deformation [25,26].
- (3)
- In zone II, the form of combined support of anchor cable and anchor rod is implemented. Combined support can connect the shallow bearing structure with the deep bearing structure to form a composite bearing structure and inhibit the separation of roof strata [27].
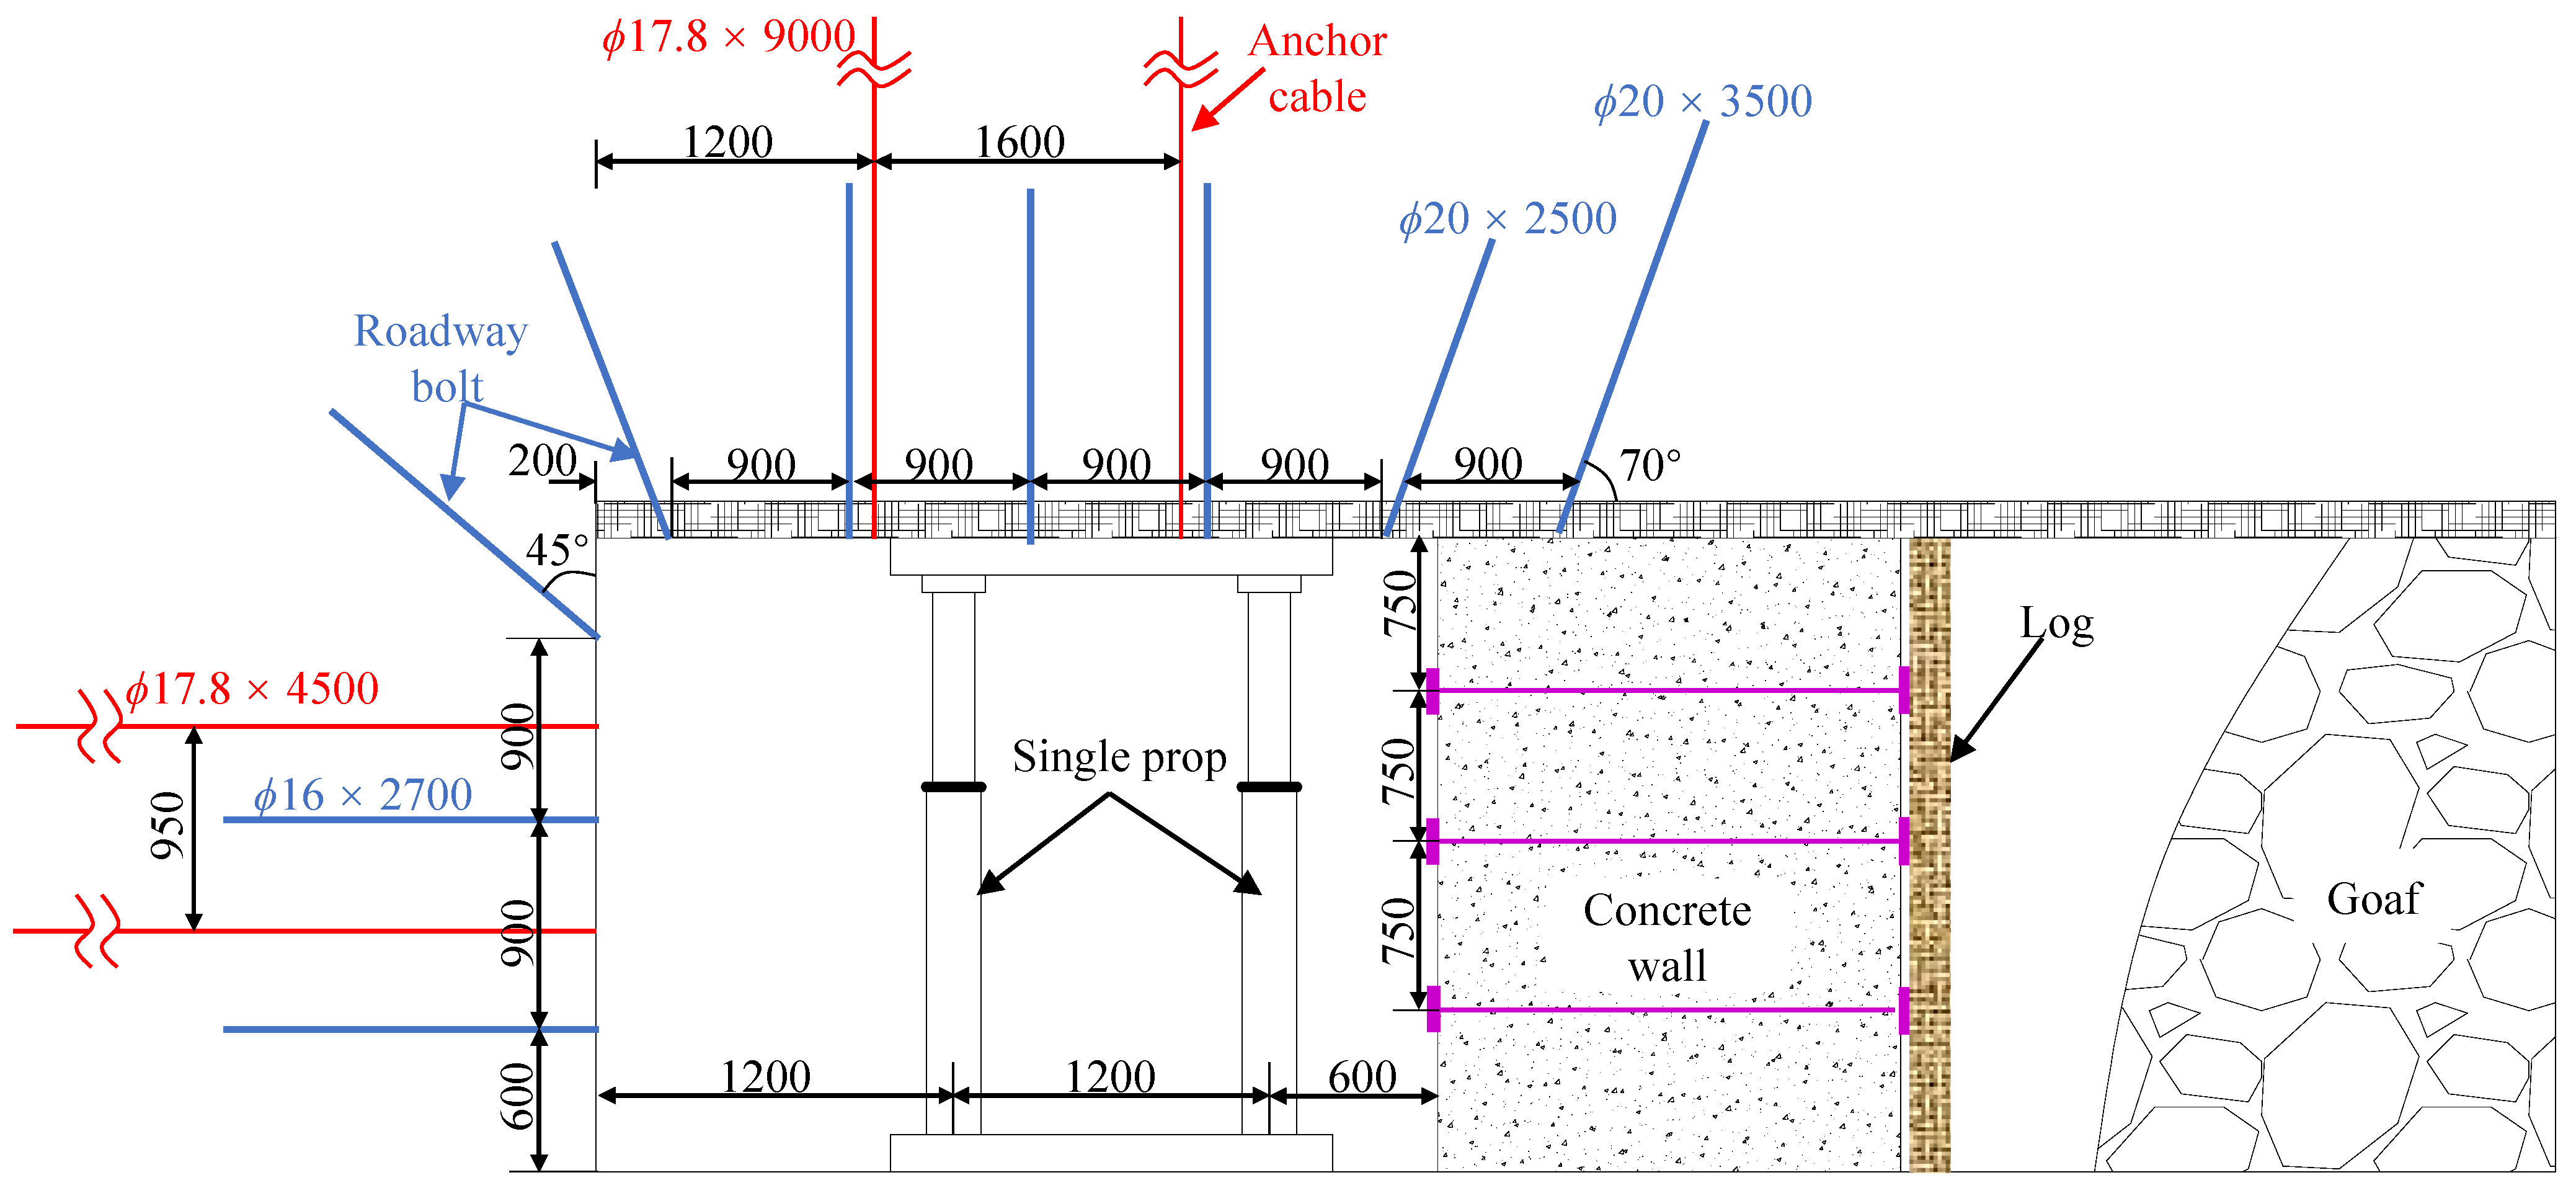
5.2. Parameters of Support
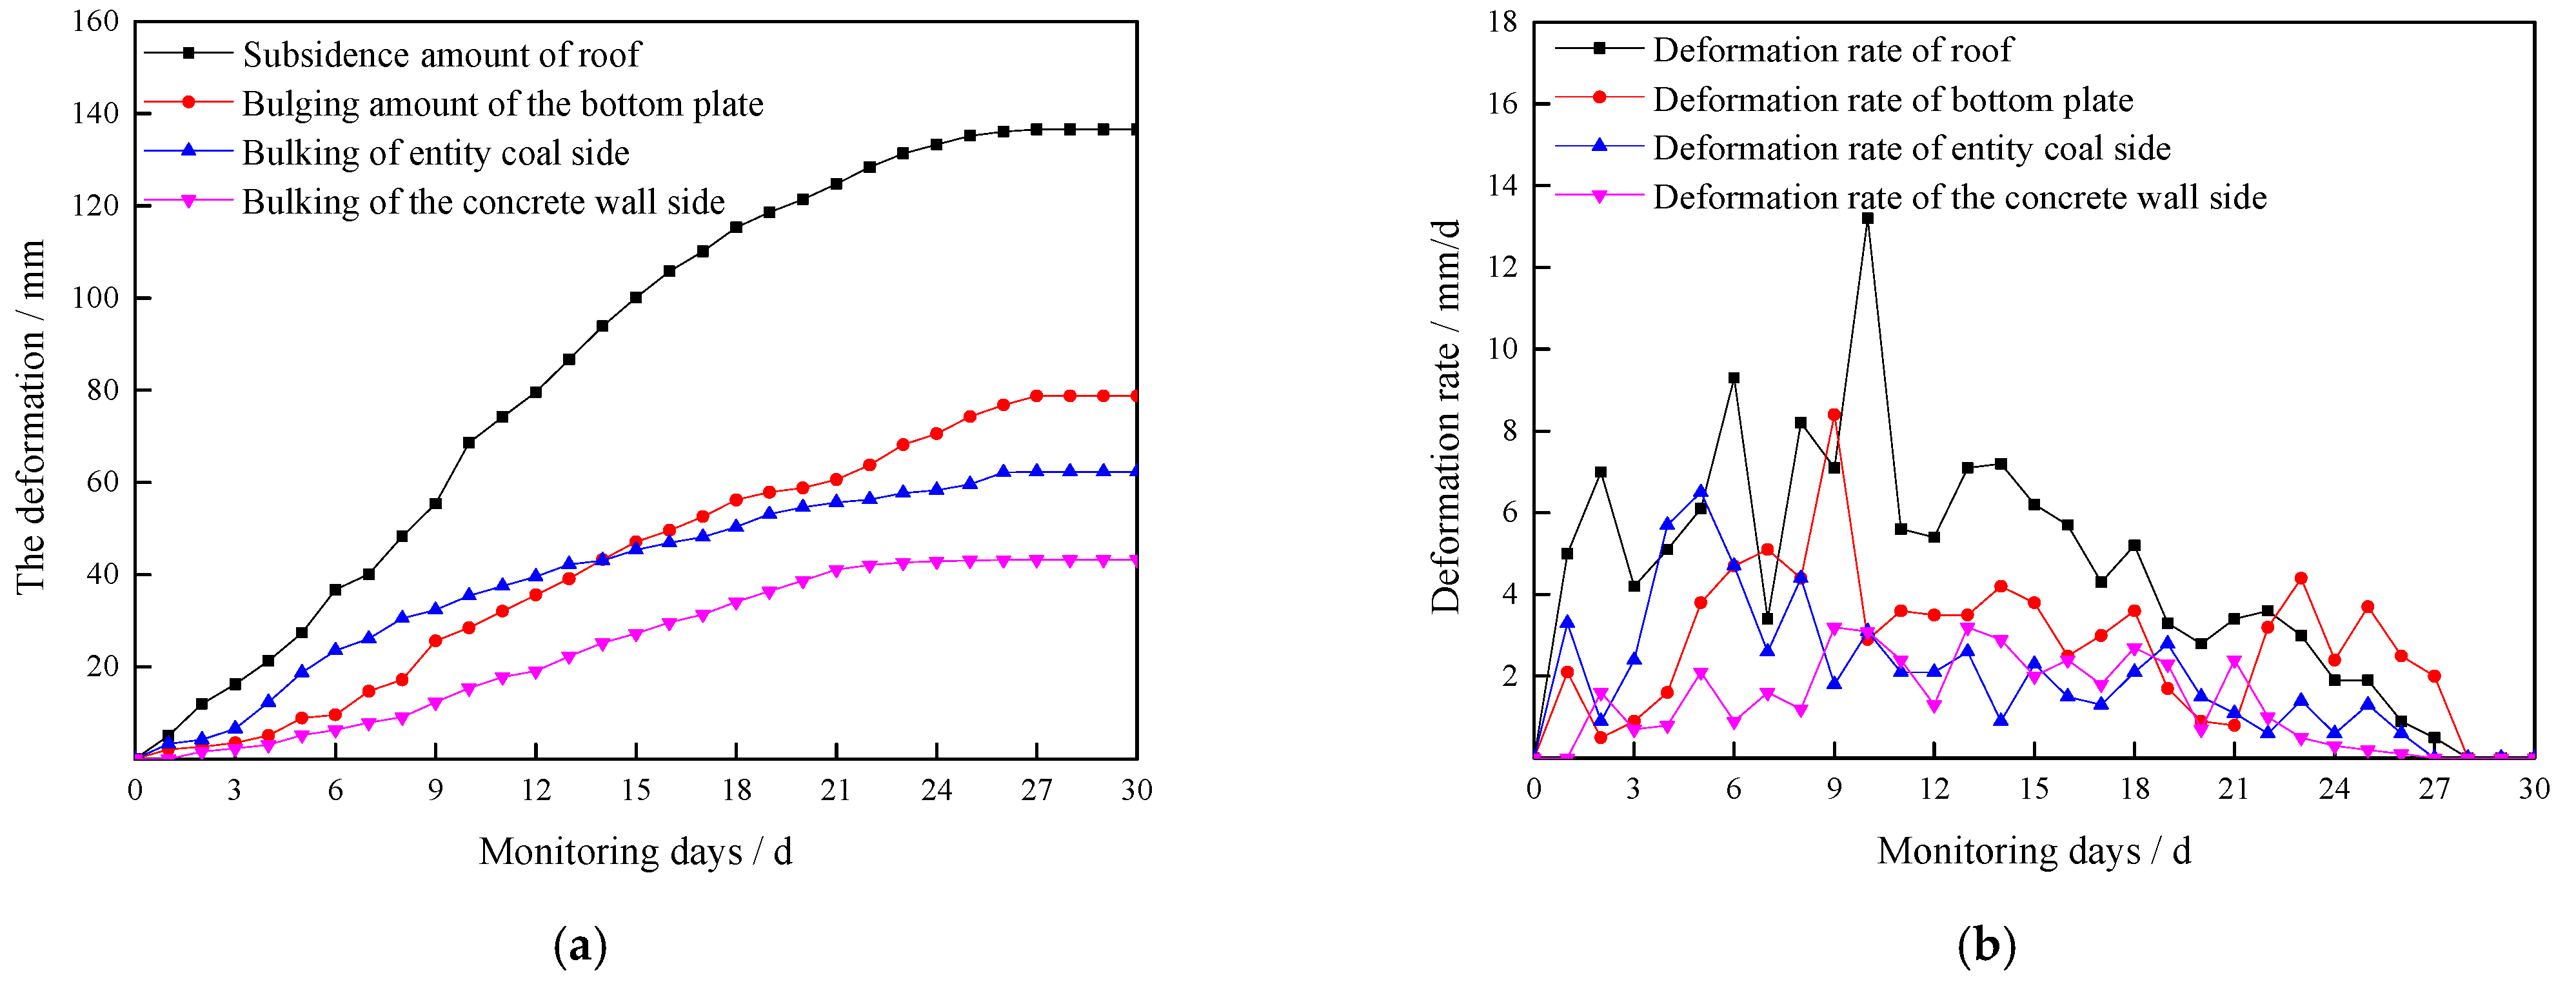
5.3. Deformation of Retained Roadway
6. Conclusions
- (1)
- The periodic pressure frequency of the working face is 3 to 4 days. In order to retain the roadway, the strength of the filled wall in the roadway should be at least between 10.16 MPa and 11.64 MPa. When the width of the concrete wall is 2.2 m, the strength of the concrete wall can reach 10.87 MPa~11.64 MPa in 3 to 4 days, so the width of the concrete wall in the retained roadway is 2.2 m.
- (2)
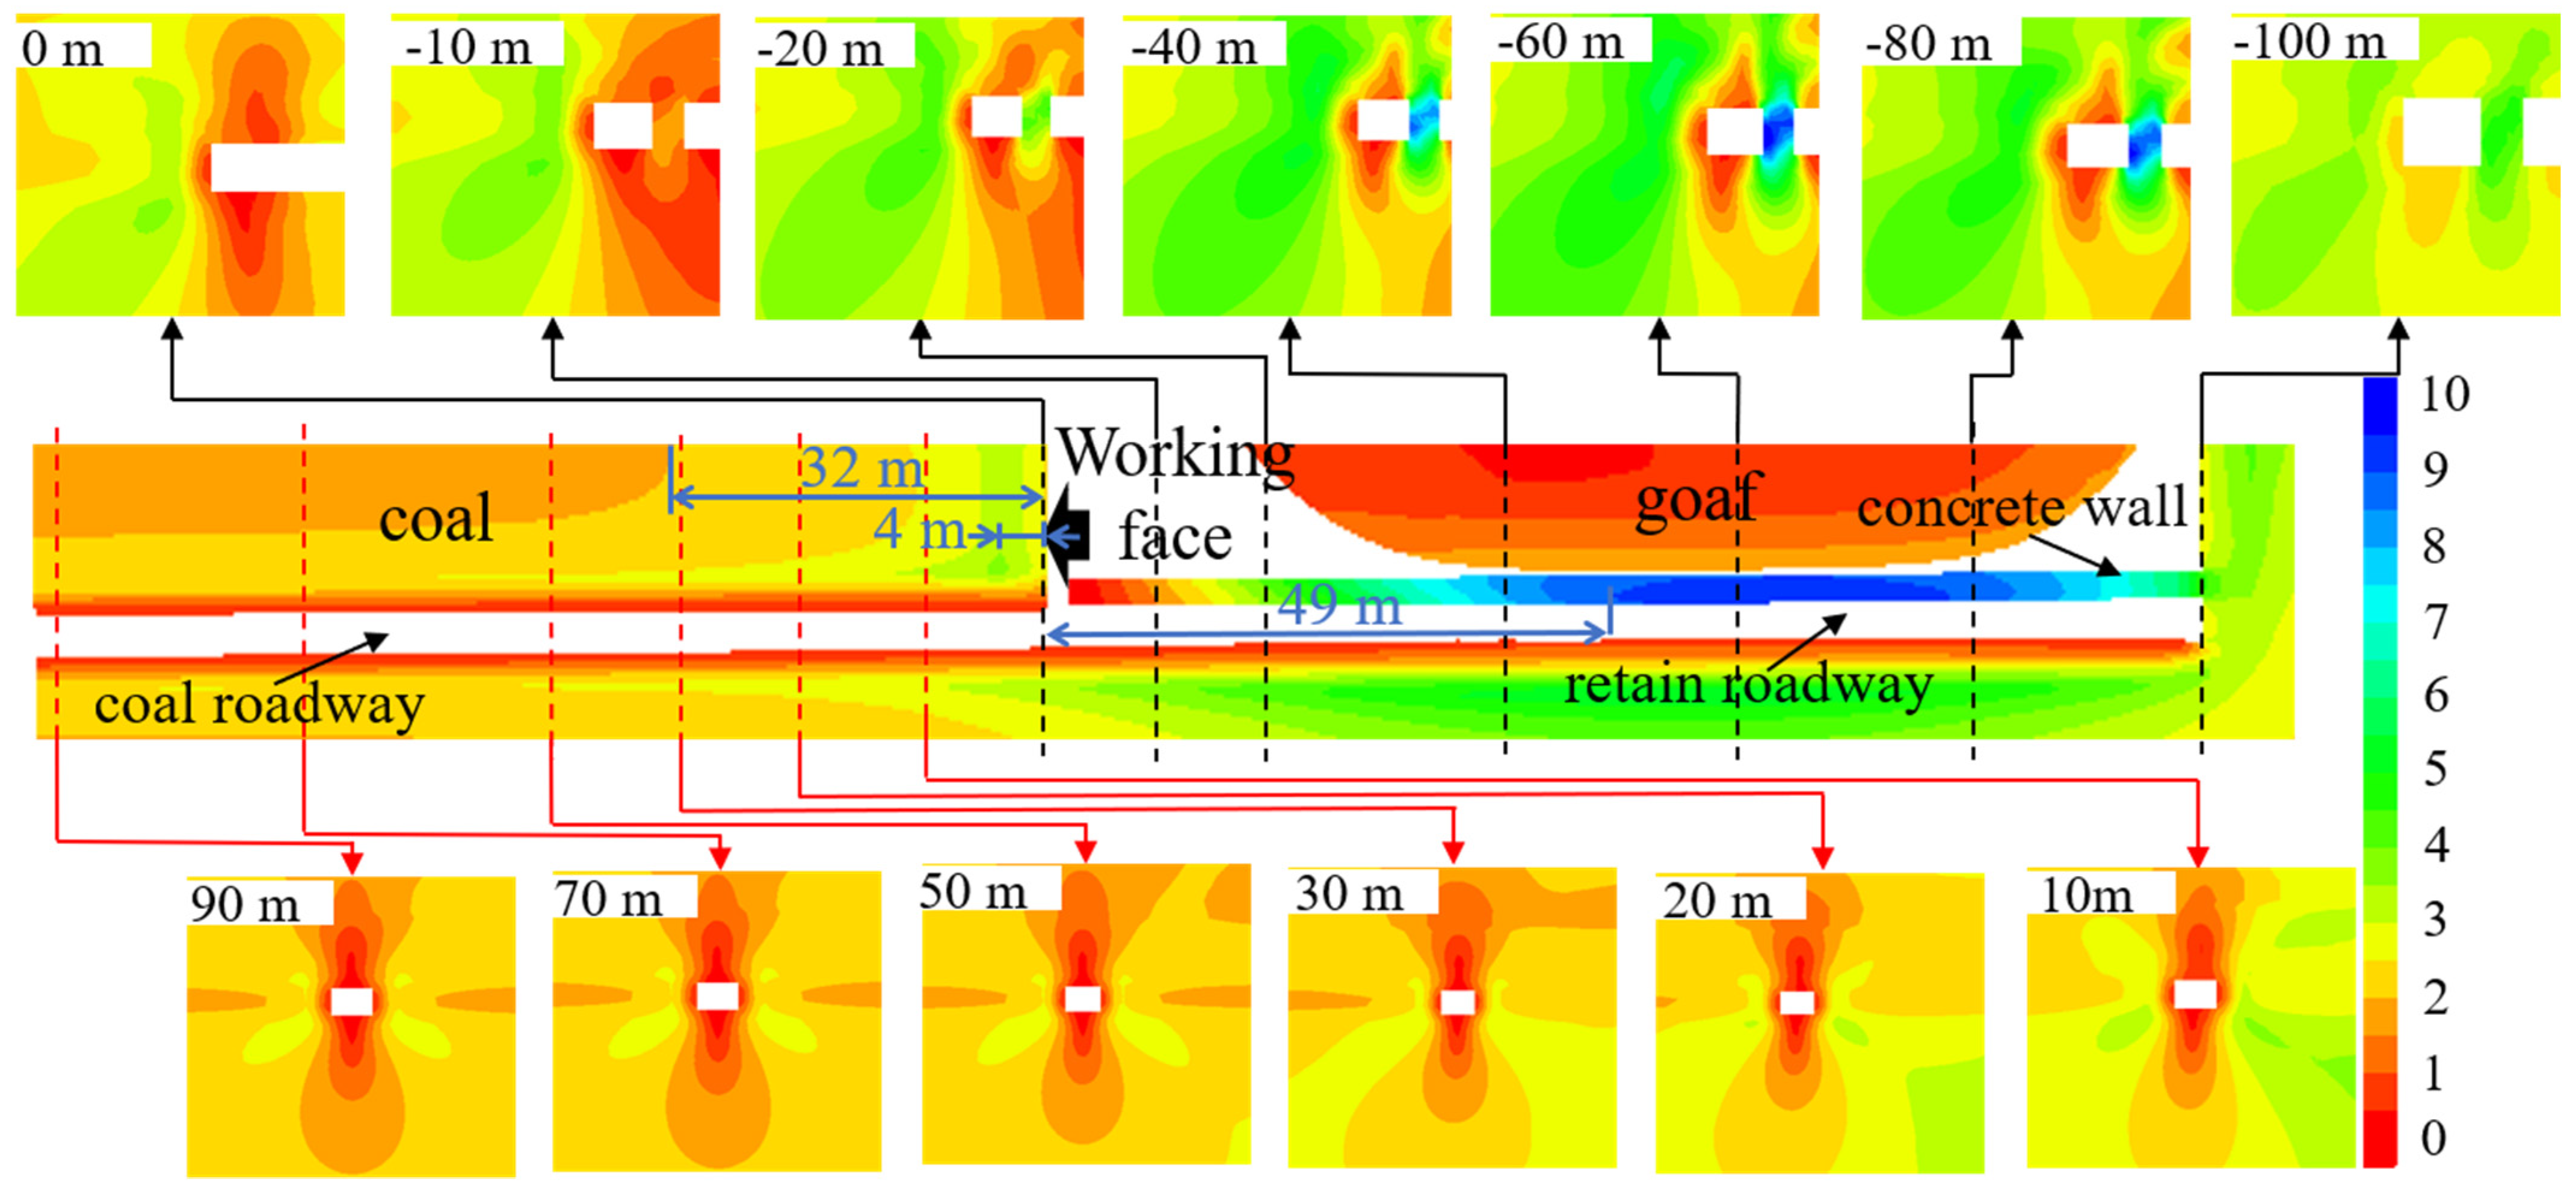
- The influence range of deviatoric stress in front of the working face is 32 m, and the distance between peak deviatoric stress and the working face is 4 m. When the distance of the lagging working face is 49 m, the retained roadway tends to be stable.
- (3)
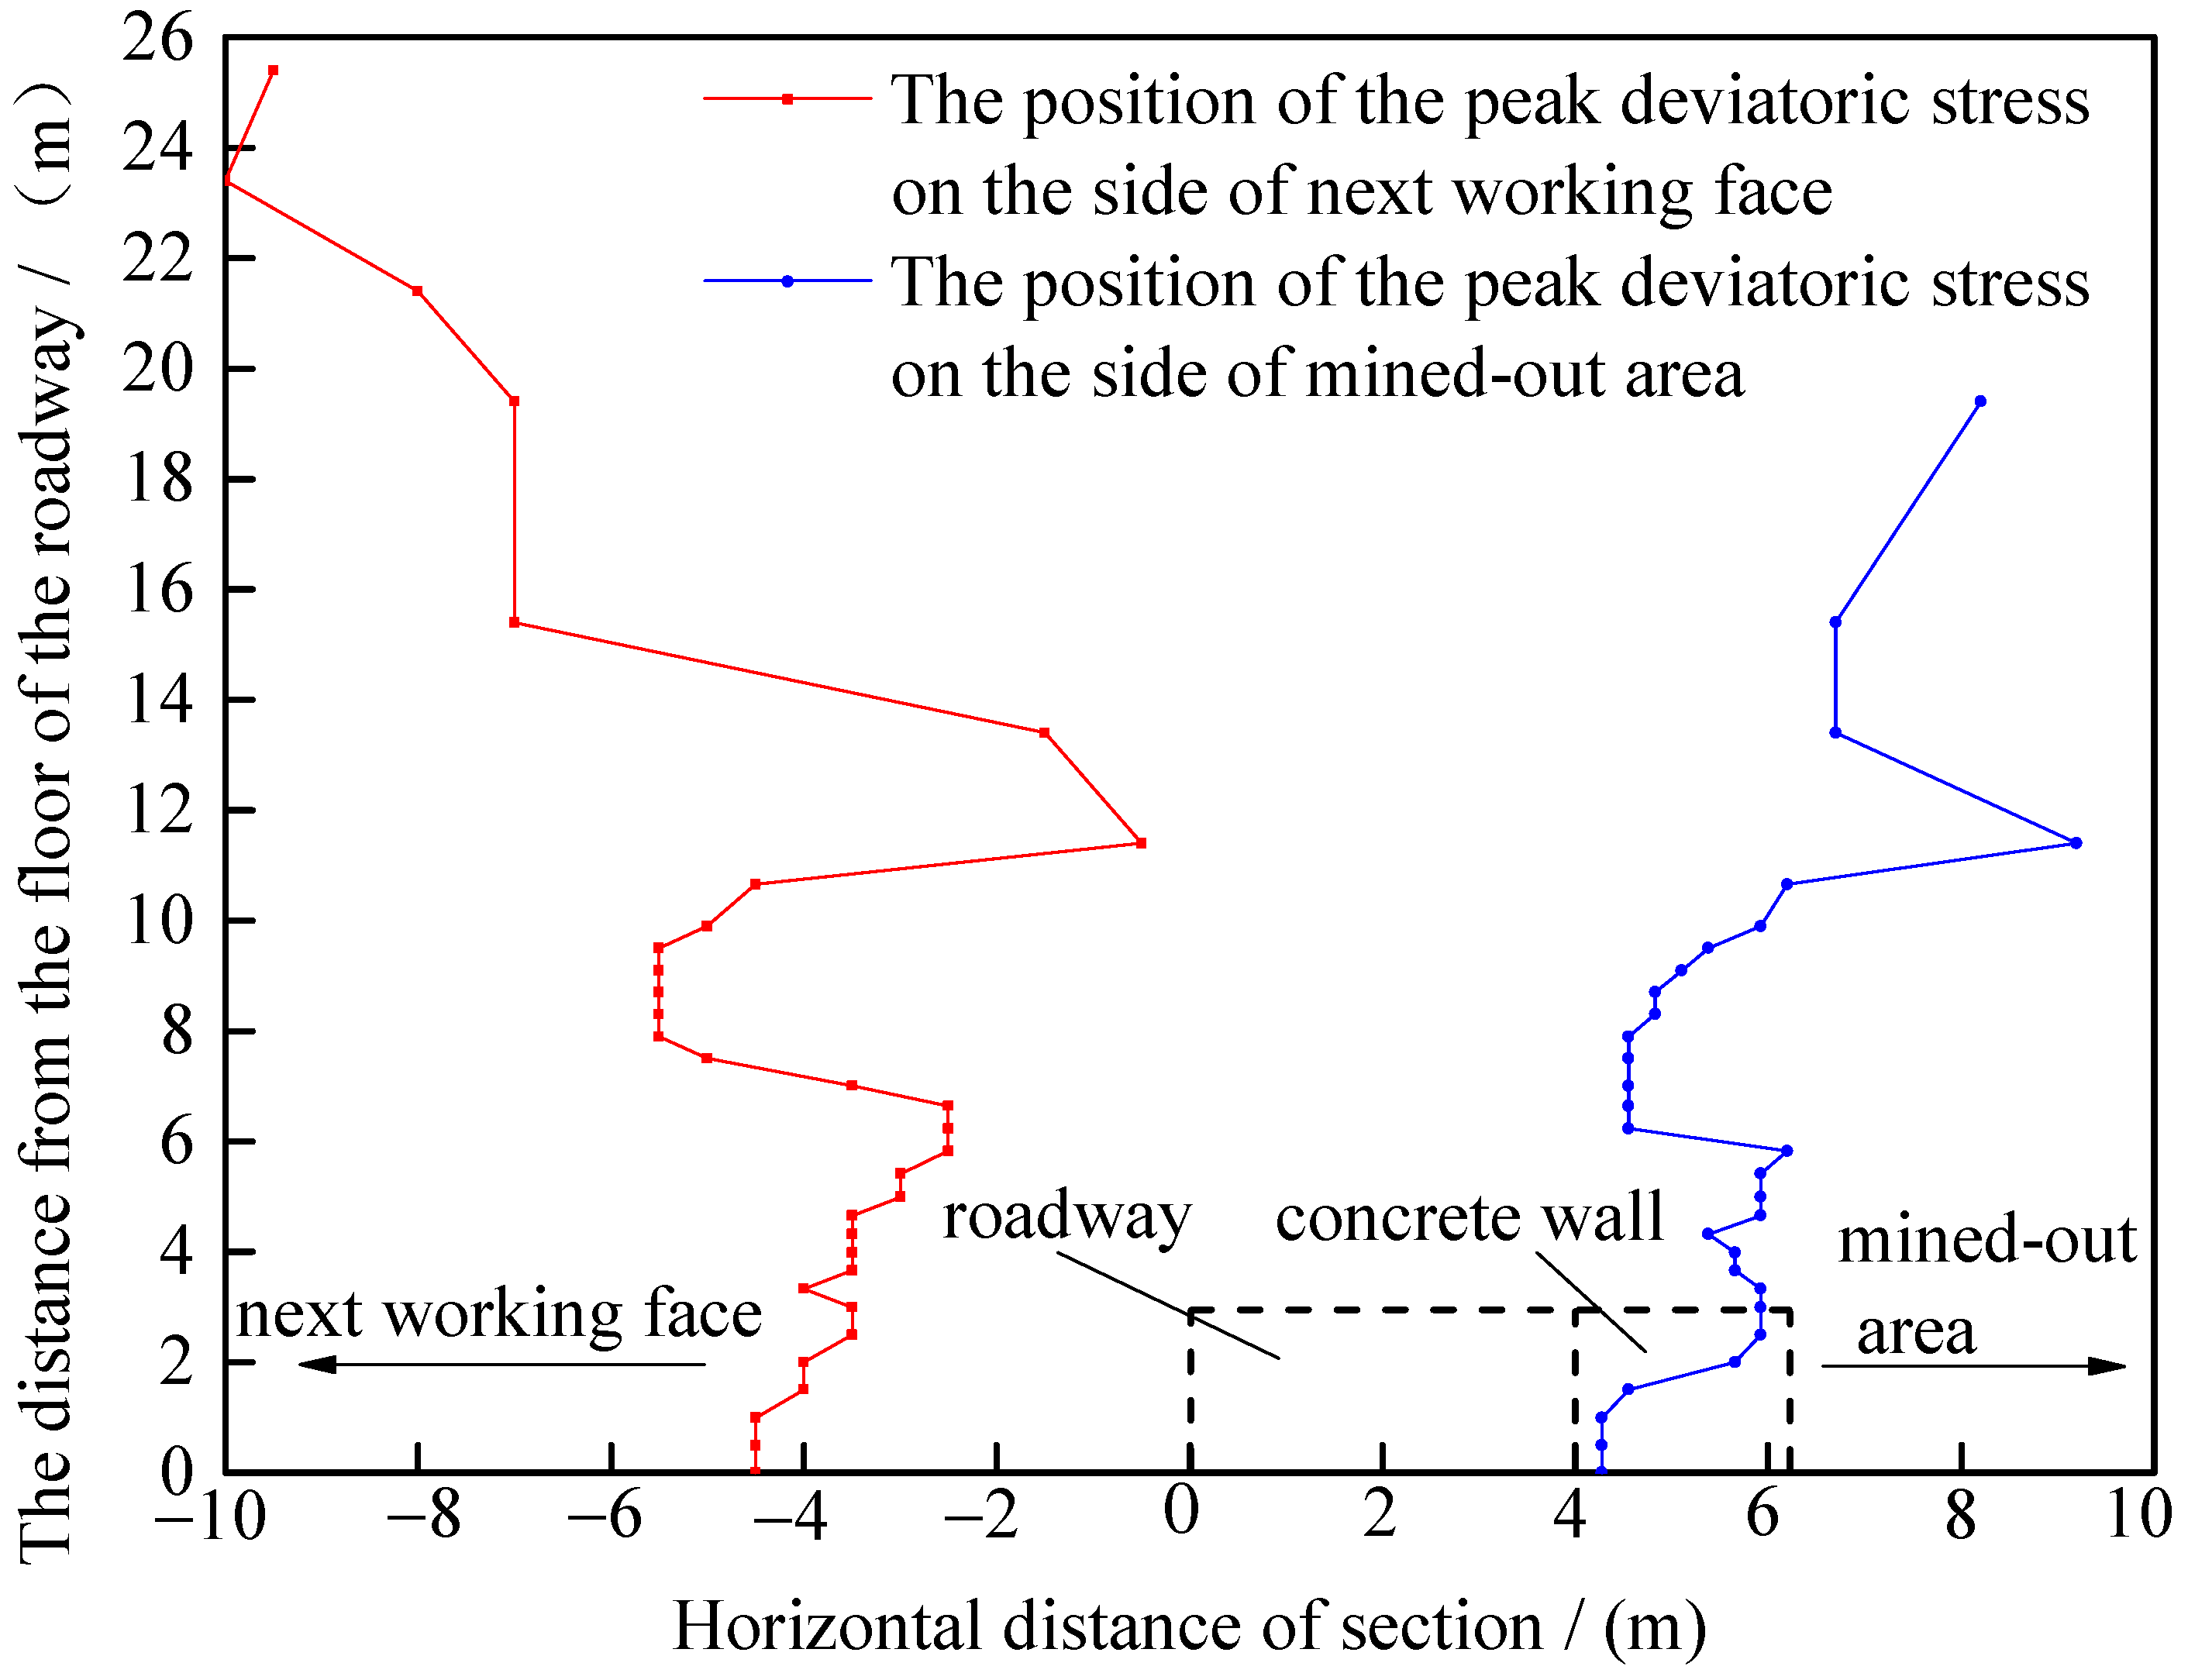
- From the position of 90 m in front of the working face to the position of 100 m behind the working face, the distribution form of the roadway surrounding rock deviatoric stress is: symmetrical butterfly shape → single butterfly shape → narrow oblique strip → oblique 8 shape → wide oblique strip shape.
- (4)
- Based on the distribution characteristics of the deviatoric stress and damage zone in the surrounding rock of retained roadway, the surrounding rock of retained roadway is divided into three regions with the boundary of the peak deviatoric stress outline line and the damage zone outline line, and different supporting forms are adopted in three regions.
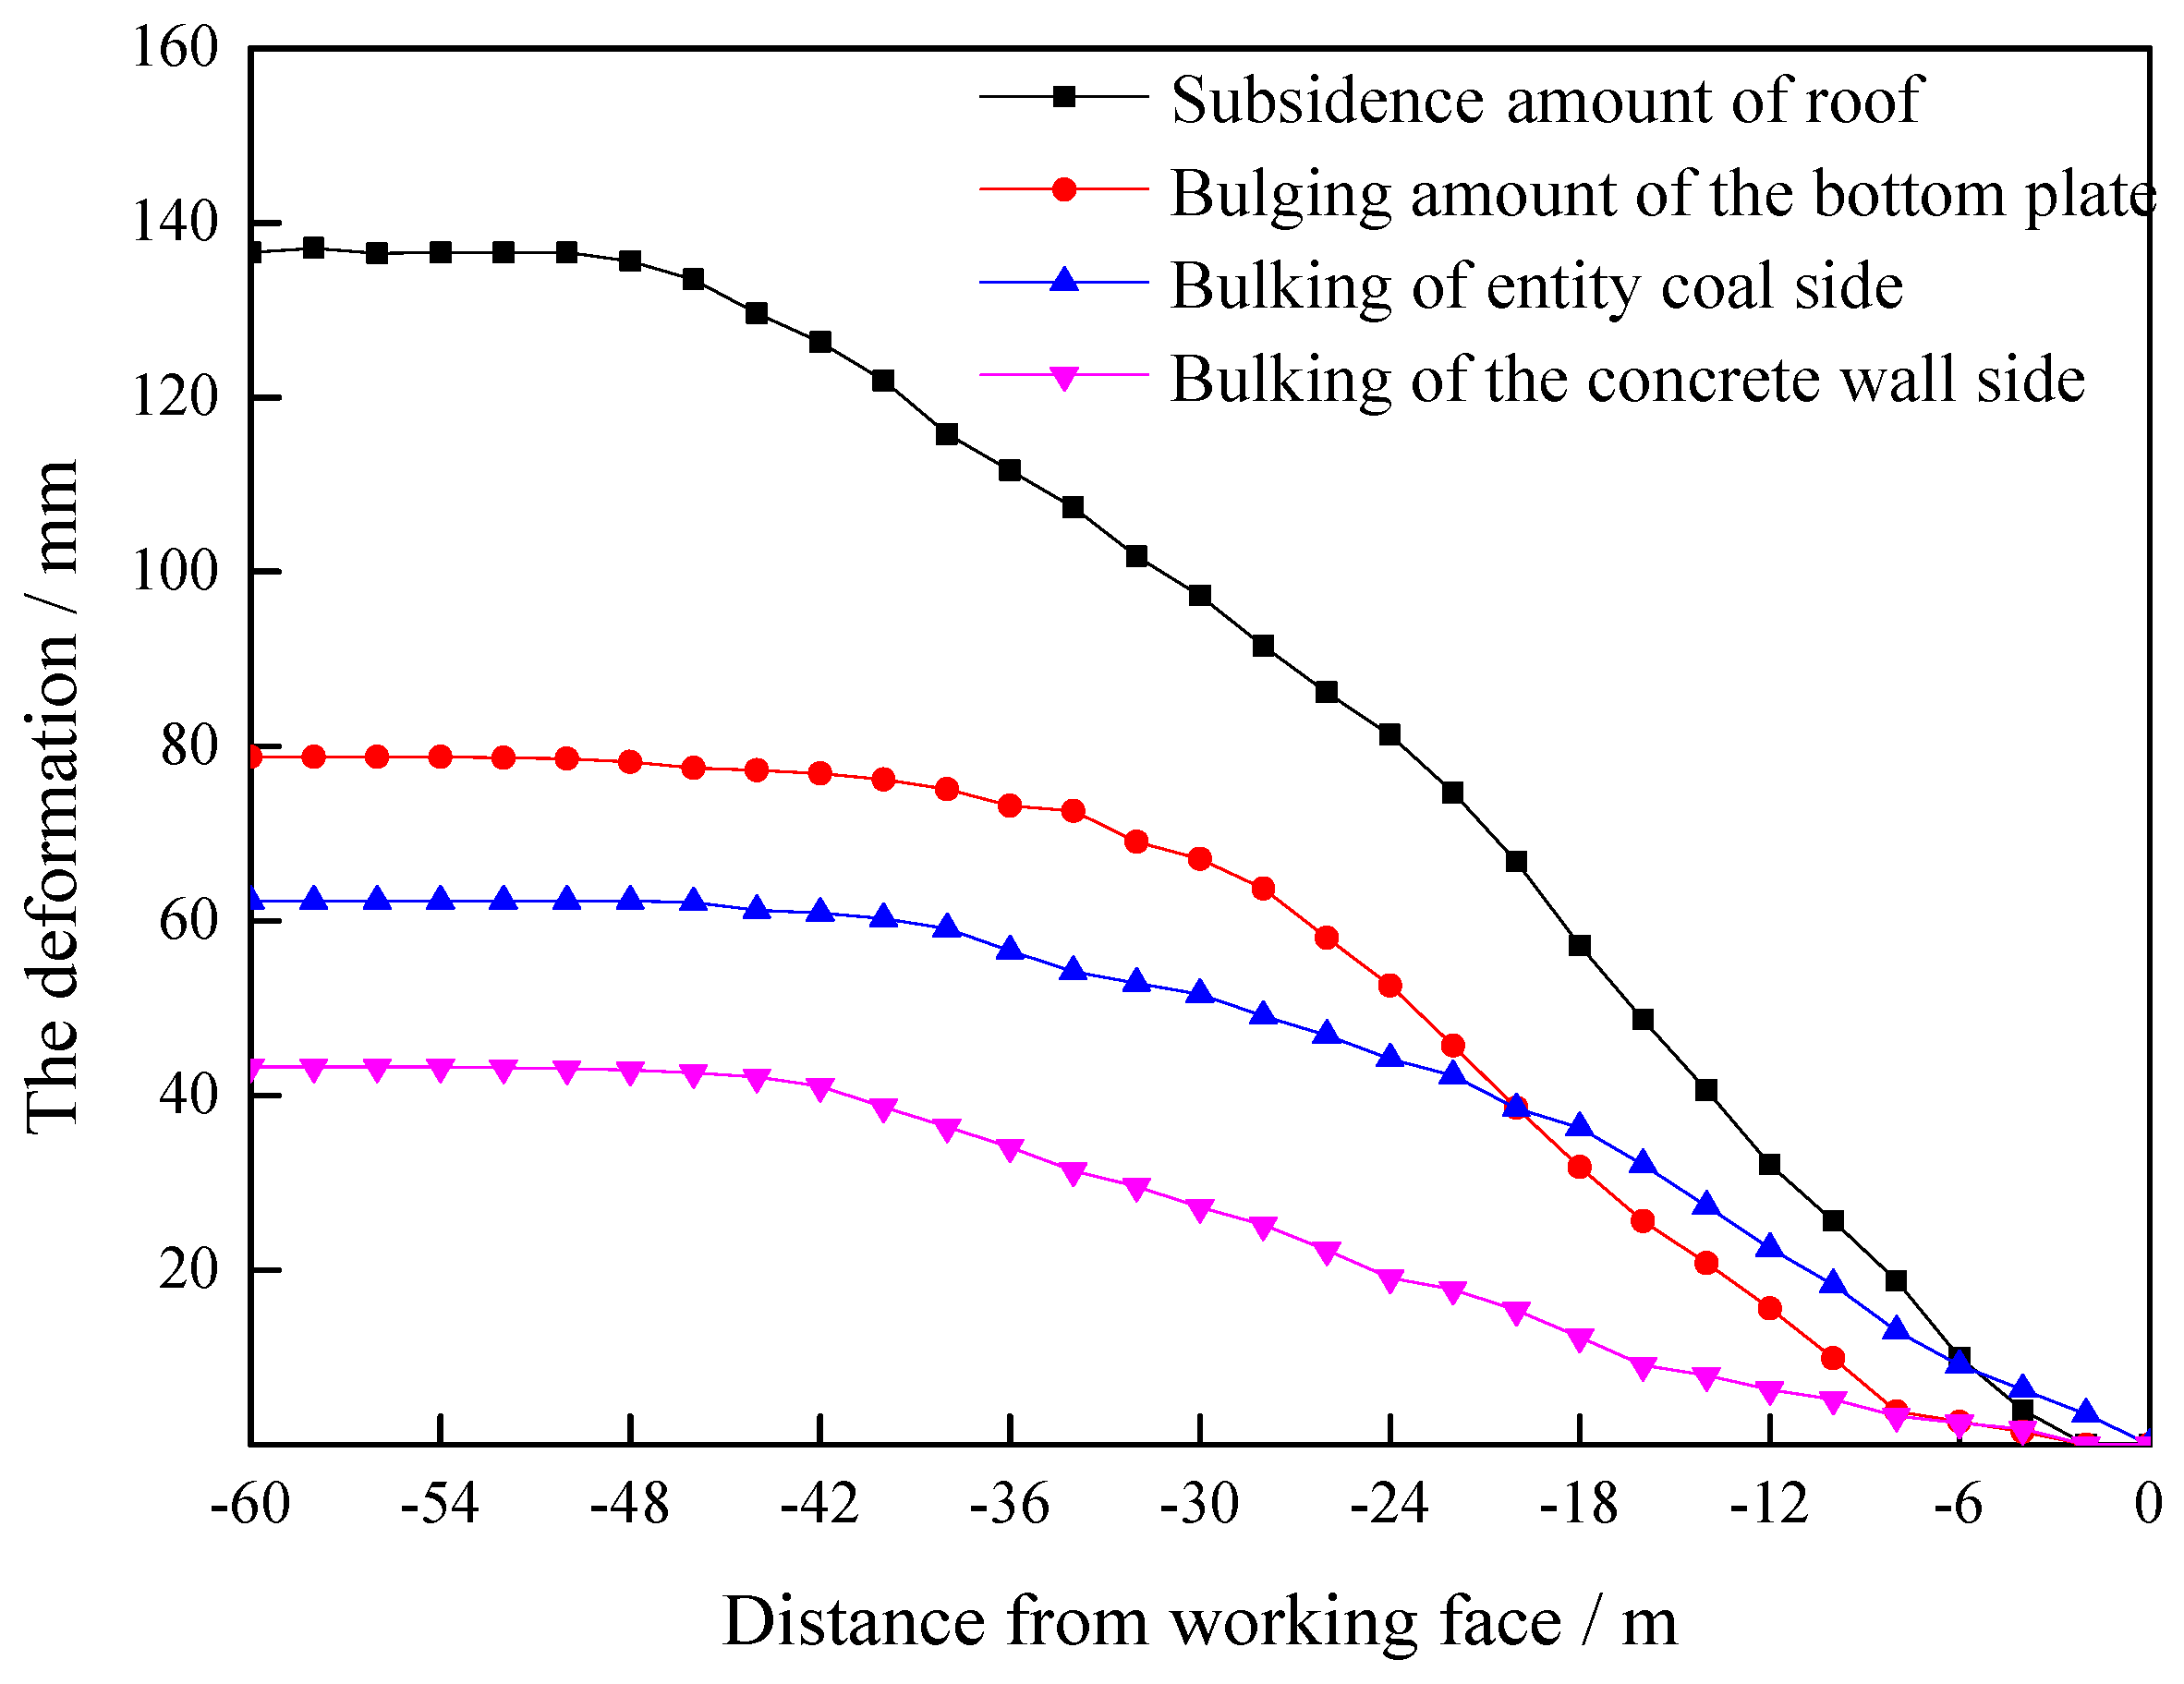
- (5)
- After field application and measurement, the surrounding rock deformation of the retained roadway is effectively controlled, and the maximum deformation of roof, floor, solid coal side and concrete wall side is 136.6 mm, 78.8 mm, 62.3 mm and 43.3 m, respectively.
Author Contributions
Funding
Informed Consent Statement
Conflicts of Interest
References
- Yang, Y.; Bai, J.B.; Wang, X.Y.; Zhang, L.Y. Control of the Surrounding Rock of a Goaf-Side Entry Driving Heading Mining Face. Sustainability 2020, 12, 2623. [Google Scholar]
- Yang, H.Q.; Han, C.L.; Zhang, N. Stability Control of a Goaf-Side Roadway under the Mining Disturbance of an Adjacent Coal Working Face in an Underground Mine. Sustainability 2019, 11, 6398. [Google Scholar] [CrossRef] [Green Version]
- Thorntin, C.; Zhang, L. On the evolution of stress and micro-structure during general 3D deviatoric straining of granular media. Geotechnique 2010, 60, 333–341. [Google Scholar] [CrossRef]
- Tian, M.L.; Han, L.J.; Meng, Q.B. Physical Model Experiment of Surrounding Rock Failure Mechanism for the Roadway under Deviatoric Pressure form Mining Disturbance. KSCE J. Civ. Eng. 2020, 24, 1103–1115. [Google Scholar] [CrossRef]
- Xue, D.J.; Yang, J.X.; Wu, F.F. Analysis of fracture mechanism for surrounding rock hole based on water-filled blasting. Int. J. Coal Sci. Technol. 2020, 7, 704–713. [Google Scholar]
- Zhang, C.; Zhao, Y.X.; Bai, Q.S. 3D DEM method for compaction and breakage characteristics simulation of broken rock mass in goaf. Acta Geotech. 2021. [Google Scholar] [CrossRef]
- Tan, Y.L.; Fan, D.Y.; Liu, X.S. Numerical investigation of failure evolution for the surrounding rock of a super-large section chamber group in a deep coal mine. Energy Sci. Eng. 2019, 7, 3124–3146. [Google Scholar] [CrossRef] [Green Version]
- Tan, Y.L.; Ma, Q.; Zhao, Z.H. Cooperative bearing behaviors of roadside support and surrounding rocks along gob-side. Geomech. Eng. 2019, 18, 439–448. [Google Scholar]
- Ma, Q.; Tan, Y.L.; Zhao, Z.H. Roadside support schemes numerical simulation and field monitoring of gob-side entry retaining in soft floor and hard roof. Arab. J. Geosci. 2018, 11, 563–569. [Google Scholar] [CrossRef]
- Du, Z.W.; Chen, S.J.; Ma, J.B. Gob-Side Entry Retaining Involving Bag Filling Material for Support Wall Construction. Sustainability 2020, 12, 6353. [Google Scholar] [CrossRef]
- Tian, Z.J.; Zhang, Z.Z.; Deng, M. Gob-Side Entry Retained with Soft Roof, Floor, and Seam in Thin Coal Seams: A Case Study. Sustainability 2020, 12, 1197. [Google Scholar] [CrossRef] [Green Version]
- Luan, H.J.; Jiang, Y.J.; Lin, H.L. Development of a New Gob-Side Entry-Retaining Approach and Its Application. Sustainability 2018, 10, 470. [Google Scholar] [CrossRef] [Green Version]
- Zhang, N.; Han, C.L.; Kan, J.G. Theory and practice of surrounding rock control for pillarless gob-side entry retaining. J. China Coal Soc. 2014, 39, 1635–1641. [Google Scholar]
- Xie, E.B. Influence factors on stability of surrounding rocks of gob-side entry retaining in top-coal caving mining face. Chin. J. Rock Mech. Eng. 2004, 23, 3059–3065. [Google Scholar]
- Yu, W.J.; Wu, G.S.; Yuan, C. Failure characteristic sand engineering stability control of roadway. J. China Coal Soc. 2017, 42, 1408–1419. [Google Scholar]
- Wang, J.F.; Wang, E.; Chen, D.D. Evolution of deviatoric stress and control of surrounding rock at gob-side entry retaining with narrow flexible-formwork wall. J. China Coal Soc. 2021, 46, 1220–1231. [Google Scholar]
- Ma, N.J.; Li, J.; Zhao, Z.P. Distribution of the deviatoric stress field and plastic zone in circular roadway surrounding rock. J. China Univ. Min. Technol. 2015, 44, 206–213. [Google Scholar]
- Xu, L.; Wei, H.X.; Xiao, Z.Y. Engineering cases and characteristics of deviatoric stress under coal pillar in regional floor. Chin. J. Geotech. Eng. 2015, 36, 561–568. [Google Scholar]
- Li, J.Z.; Zhang, M.; Li, Y.; Hu, H. Surrounding rock control mechanism in the gob-side retaining entry in thin coal seams, and its application. J. S. Afr. Inst. Min. Metall. 2018, 118, 471–480. [Google Scholar] [CrossRef]
- Kan, J.G.; Zhang, N.; Li, B.Y. Analysis of supporting resistance of backfilling wall for gob-side entry retaining under typical roof conditions. Rock Soil Mech. 2011, 32, 2778–2784. [Google Scholar]
- Ning, J.G.; Ma, P.F.; Liu, X.S. Supporting mechanism of “yielding-supporting” beside roadway maintained along the goaf under hard rocks. J. Min. Saf. Eng. 2013, 30, 369–374. [Google Scholar]
- Ma, L.Q.; Zhang, D.S.; Chen, T. Study on packing body supporting resistance of enter-in packing for in-situ gob-side entry retaining in fully-mechanized top-coal caving mining face. Chin. J. Rock Mech. Eng. 2007, 26, 544–550. [Google Scholar]
- Hua, X.Z. Study on gob-side entry retaining technique with road-side packing in longwall top-coal caving technology. J. Coal Sci. Eng. (China) 2004, 10, 9–12. [Google Scholar]
- Xie, S.R.; Yue, S.S.; Chen, D.D. Deviatoric stress evolution laws and control of surrounding rock at gob-side entry retaining in deep backfilling mining. J. China Coal Soc. 2018, 43, 1837–1846. [Google Scholar]
- Girgin, Z.C.; Arioglu, N.; Arioglu, E. Evaluation of strength criteria for very-high-strength concretes under triaxial compression. ACI Struct. J. 2007, 104, 278–284. [Google Scholar]
- Deng, Z.H.; Wang, Y.M.; Sheng, J. Strength and deformation of recycled aggregate concrete under triaxial compression. Constr. Build. Mater. 2017, 156, 1043–1052. [Google Scholar] [CrossRef]
- Feng, G.R.; Wang, P.F.; Chugh, Y.P. Stability of gate roads next to an irregular yield pillar: A case study. Rock Mech. Rock Eng. 2019, 52, 2741–2760. [Google Scholar] [CrossRef]


| Raw Material | Cement | Sand | Rubble | Water | FDN-3 | EHD | P0102 |
|---|---|---|---|---|---|---|---|
| Mass (kg) | 500 | 820 | 850 | 226 | 1.2 | 4 | 0.3 |
| Proportion of mass (%) | 20.82 | 34.14 | 35.39 | 9.41 | 0.05 | 0.2 | 0.01 |
| Symbol of the Parameter | Sb/(m) | L1/(m) | A | Px | K | H/(m) | C0/(MPa) | φ/(°) | q1/(KPa) |
| Parameters | 1.2~3 | 8.7 | 0.5 | 0 | 2 | 134.5 | 0.3 | 25 | 49 |
| Symbol of the parameter | Sa/(m) | q2/(KPa) | q3/(KPa) | q4/(KPa) | q5/(KPa) | q6/(KPa) | q7/(KPa) | q8/(KPa) | q9/(KPa) |
| Parameters | 3~5.5 | 63 | 58 | 37 | 818 | 242 | 117 | 164 | 126 |
| Rock Strata | Density (kg/m3) | Tensile Strength (MPa) | Cohesion (MPa) | Friction Angle (°) | Bulk Modulus (GPa) | Shear Modulus (GPa) |
|---|---|---|---|---|---|---|
| Overlying rock | 2580 | 0.85 | 1.9 | 37 | 3.3 | 2.5 |
| Sandy mudstone | 2520 | 0.71 | 1.18 | 35 | 4.9 | 3.2 |
| Mudstone | 2437 | 0.53 | 0.7 | 30 | 4.3 | 2.8 |
| Gritstone | 2660 | 1.1 | 1.4 | 35 | 5.7 | 3.4 |
| Mudstone | 2437 | 0.53 | 0.7 | 30 | 4.3 | 2.8 |
| Fine sandstone | 2597 | 0.95 | 2.1 | 42 | 15.28 | 11.2 |
| Sandy mudstone | 2520 | 0.71 | 1.18 | 35 | 4.9 | 3.2 |
| Mudstone | 2437 | 0.53 | 0.7 | 30 | 4.3 | 2.8 |
| Sandy mudstone | 2520 | 0.71 | 1.18 | 35 | 4.9 | 3.2 |
| Mudstone | 2437 | 0.53 | 0.7 | 30 | 4.3 | 2.8 |
| Coal | 1460 | 0.3 | 0.3 | 25 | 1.3 | 0.63 |
| Fine sandstone | 2597 | 0.95 | 2.1 | 42 | 15.28 | 11.2 |
| Concrete | 2456 | 1.8 | 3.4 | 45 | 1.99 | 1.8 |
Publisher’s Note: MDPI stays neutral with regard to jurisdictional claims in published maps and institutional affiliations. |
© 2022 by the authors. Licensee MDPI, Basel, Switzerland. This article is an open access article distributed under the terms and conditions of the Creative Commons Attribution (CC BY) license (https://creativecommons.org/licenses/by/4.0/).
Share and Cite
Wang, Z.; Zhang, J.; Li, J.; Wang, P.; Wu, C.; Shi, L. Research of Surrounding Rock Control of Gob-Side Entry Retaining Based on Deviatoric Stress Distribution Characteristics. Sustainability 2022, 14, 5660. https://doi.org/10.3390/su14095660
Wang Z, Zhang J, Li J, Wang P, Wu C, Shi L. Research of Surrounding Rock Control of Gob-Side Entry Retaining Based on Deviatoric Stress Distribution Characteristics. Sustainability. 2022; 14(9):5660. https://doi.org/10.3390/su14095660
Chicago/Turabian StyleWang, Zhiqiang, Jiao Zhang, Jingkai Li, Peng Wang, Chao Wu, and Lei Shi. 2022. "Research of Surrounding Rock Control of Gob-Side Entry Retaining Based on Deviatoric Stress Distribution Characteristics" Sustainability 14, no. 9: 5660. https://doi.org/10.3390/su14095660