Article

Transformation for Feature Upgrades or Higher Property Prices: Evidence from Industrial Land Regeneration in Shanghai

1
Department of Urban Planning, College of Architecture and Urban Planning, Tongji University, Shanghai 200092, China
2
Department of Urban & Regional Planning, Faculty of the Built Environment, University of Malaya, Kuala Lumpur 50603, Malaysia
*
Author to whom correspondence should be addressed.
Sustainability 2022, 14(9), 5280; https://doi.org/10.3390/su14095280
Submission received: 24 March 2022 / Revised: 23 April 2022 / Accepted: 25 April 2022 / Published: 27 April 2022

Abstract

:
In recent years, an increasing amount of industrial land has been left idle in China. This gave rise to a wide range of urban issues hindering sustainable urban development. To solve this problem, industrial land transformation has been promoted. However, factors affecting industrial land transformation have not been adequately explored. To fill this gap, this study employs the bivariate K-function to analyze the spatial association between agglomeration patterns of industrial land parcels and living quarters. Moreover, a series of discrete choice models (i.e., the LOGIT, PROBIT, and IVPROBIT model) are adopted to examine empirically complicated relationships between industrial land transformation and its influencing factors. This study argues that the land price and its rising expectations are major determinants of industrial land transformation. The results revealed that transformation-oriented industrial land tended to be located next to accessible living quarters with higher prices. A higher-level industrial park typically had less possibilities for industrial land transformation. The findings also indicated that production efficiency served as a moderator variable to regulate the transformation process. Implications are formulated for policymakers to guide industrial land transformation in an appropriate manner.

1. Introduction

The industry, as one of the most critical urban economic foundations, is a long-term tax source for local governments [1,2]. The increase in industrial land-leasing scales can produce a greater potential to create fiscal income for local governments because China’s urban construction land is state-owned [3]. However, industrial development has not kept up with what is expected by governments, so a large amount of industrial land either stays idle or ceases production. The inefficient occupation of industrial land by enterprises creates the illusion that industrial land is in short supply [4]. Thus, local governments tend to lease new industrial land rather than consolidate inefficient industrial land for further industrial production. Even worse, the corresponding planning control to prevent low-efficiency industrial land use is not in place [5,6]. As a result, the capital density [7,8], land input–output efficiency [9,10], and industrial land productivity [11] of industrial land in China are relatively low, which fails to meet governments’ expectations of gaining revenue from industrial development. Local governments cannot help adopting necessary measurements to promote the transformation of low-efficiency industrial land, and thus avoid an economic loss. Financial benefits (e.g., conveyance fees) are generated from the transformation process, which further stimulates governments’ industrial land transformation motivation.
In addition to interventions from governments to carry forward industrial land transformation, the intrinsic driving force is the expectation from industrial land developers that land prices will rise. Harvey [12] argued that land value-added pursuit reshaped urban space and produced various urban renewal projects. Land users often expect a high return from land redevelopment because urban housing prices and land prices are generally considered to be continually rising [13]. Huge profits in real estate investments can discourage developers from engaging in manufacturing on industrial land [14]. Some developers even tend to leave industrial land idle and await future gains from land transformation [13]. Moreover, in recent years, industrial enterprises have been gradually migrating to peripheral urban areas in China. This is partly because commercial developers can afford higher land rents compared to industrial developers. This movement constantly and repetitively takes place with urban sprawl [15]. However, this iterative pattern may familiarize industrial developers, and thus raise their expectations of industrial land redevelopment so as to speculate in the industrial land market. To solve the aforementioned problems, many previous studies empirically analyzed relationships between industrial land and local economic development at the regional level using various econometric models [2,16]. Some of them also explored industrial land or enterprises’ features using city- or subdistrict-level data with case studies [1] or from the perspective of industrial efficiency [8,9,10]. There is still a lack of empirical research to identify the motivation (i.e., land prices rising expectations) for promoting industrial land transformation at the parcel level [15,17,18]. Meanwhile, existing studies have verified that many links in the industrial land use cycle (e.g., land conveyance, enterprise production, and operation) have contributed to local fiscal revenue. Governments and enterprises’ behaviors in the process of industrial land-leasing and production have also been fully studied. However, the reason why a large amount of industrial land is not used for manufacturing but transformed into the commercial and residential use is still under-explored. There is a range of questions that need answering. For instance, is this phenomenon driven by the pursuit of land and property price appreciation? Has the contribution of this market process to local fiscal revenue prompted the support of local governments? To fill this knowledge gap, this study aims to empirically examine what affects industrial land transformation in the Minhang District of Shanghai from the perspective of expectations of rising land prices. Specifically, this study is expected to verify the following four hypotheses:
Hypothesis 1 (H1).
There are significant differences in characteristics and locations between transformation-oriented and continued-production land;
Hypothesis 2 (H2).
The higher land price around industrial land contributes to its transformation;
Hypothesis 3 (H3).
The administrative grade of industrial parks and land-leasing policies can influence industrial land transformation;
Hypothesis 4 (H4).
The production efficiency of industrial enterprises has a mediate effect on industrial land transformation.

2. Materials and Methods

2.1. Study Area

Shanghai is a world city, which has the highest degree of industrialization and fastest urbanization process in China (Figure 1a). Minhang District of Shanghai was selected as the study area (Figure 1b). It is located in the southwest of Shanghai’s central area, with a total area of 372 km2, covering nearly 6% of the Shanghai territory. As is shown in Figure 1c, in 2014, the construction land in Minhang District covered 285 km2, nearly 76.6% of the total area of Minhang District. Noticeably, industrial land accounted for 25.8% of entire construction land in Minhang District, Shanghai in 2014.
In past decades, continuous factory relocation occurred in the suburb of Shanghai due to the functional mix. To maintain a certain proportion of industrial space (Shanghai Municipal Commission of Economy and Informatization, 2016), the Shanghai Municipal Government guided industrial enterprises moving into designated industrial parks according to the “104,195,198 Industrial Land Policy”. It can promote the redevelopment of idle industrial land in a centralized construction area (CCA), an area for urban development and centralized construction within a certain period. Minhang District is one of the traditional industrial agglomeration areas in Shanghai in different urbanization periods. It is the nearest industrial zone to downtown Shanghai. The above information shows that Minhang District of Shanghai is exceptionally suitable for this study.

2.2. Data and Pre-Processing

2.2.1. Industrial Land and Enterprises

The industrial land parcel data (n = 5610) come from the land rights data set of Minhang District in 2014. It contains the area, location, year assigned, and stakeholder name of each industrial land parcel. From February to October in 2019, this study conducted a series of detailed on-site investigations to collect the manufacturing condition data of each industrial land parcel. All industrial land in the study area was classified into four types: (1) transformed land, (2) under-construction land, (3) idle land, (4) continued-production land (Table 1).
The output data of industrial enterprises in Minhang District were derived from the 2013 Annual Survey of Industrial Companies. Each industrial land parcel’s gross output value was computed by summing all output values of industrial enterprises in the identical land parcel. However, some enterprises are not involved in the above survey because their annual output is below CNY 20 million. To solve this problem, this study estimated their outputs by subtracting the known industrial output value from the total gross value of industrial production in Minhang District, Shanghai.

2.2.2. Land Prices and Distribution

This study employed an appropriate interpolation method (i.e., ordinary Kriging) in ArcGIS to estimate the land price condition at the parcel level using the housing price data, considering the strong correlation between land prices and housing prices [19,20]. Kriging is one of the interpolation methods that can be used to predict the distribution of housing prices [21]. Based on the housing price data and its known locations, Kriging provides absolute housing prices at unobserved locations [22]. The housing price data were collected from the Lianjia website (https://sh.lianjia.com/chengjiao/, accessed on 27 April 2020), including all second-hand housing transaction records published on the website in 2015 and 2019 in Shanghai. Previous studies have proved that this kind of open data is reliable to represent housing price levels [23,24]. It is worth noting that the land price estimated in this paper is a comprehensive replacement of location, facilities, road network level, greening, and other elements in the built environment. Thus, the transformation driven by the land price also reflects the complex driving mechanism of spatial elements.
The following steps show the specific procedure to obtain the spatial distribution of the land price and its growth rate (Figure 2). First, the latitude and longitude coordinates of each living quarter were obtained through the Map Location website (https://maplocation.sjfkai.com/, accessed on 27 April 2020). Second, the average housing prices in 2015 and 2019 were assigned to the corresponding living quarter, respectively. Third, the spatial distribution of the average housing price in 2015 and its growth rate from 2015 to 2019 were acquired, respectively, using the ordinary Kriging interpolation method with a patch size of 25 m × 25 m (Figure 2). To strengthen the interpolation’s validity in the study area, this study took the housing prices data of all living quarters in Shanghai except Chongming District into the mean value calculation. This is because the spatial segmentation of the Yangtze River has a significant influence on interpolation results.

2.2.3. Classification of Industrial Land and Living Quarters

This study conducted a detailed classification of industrial land and living quarters to facilitate the analysis of land prices’ effect on industrial land transformation (Table 2).

2.3. Methods

Based on the aforementioned data, this study manifested differences in location and characteristics between L1 and L2 according to a Student’s t-test. Then, the aggregation level between industrial land (L1 and L2) and living quarters (P1 and P2) was examined using the bivariate K-function method. This study also employed an econometric method to explore the influence of several important factors (i.e., land prices, industrial parks’ administrative grades, land-leasing policies, and industrial enterprises’ production efficiency) on industrial land transformation. The framework of the methodology is shown in Figure 3.

2.3.1. Method of Bivariate K-Function

This study employed the bivariate K-function to compare spatial distribution characteristics of L1 and L2. Ripley’s K-function, coined by Byth and Ripley [25], is typically utilized to analyze the spatial pattern based on Euclidean distance [26]. The bivariate K-function is described as the anticipated point amount of pattern 2 within a given radius of an arbitrary position of pattern 1, divided by the point intensity of pattern 2 [27]. Essentially, the bivariate K-function aims to examine the mutual influence between two spatial distribution patterns. It is widely employed to measure the agglomeration of urban land use and the proximity to urban facilities [28,29]. This study adopted this method measuring the aggregation distance between industrial land parcels and living quarters in 2015 and 2019 within a 1000 m buffer of Minhang District using R programming, as adopted by [30].

2.3.2. Method of Discrete Choice Model

This study introduced econometric methods to estimate causal relationships between land prices rising expectations and industrial land transformation. To be specific, a series of discrete choice models (i.e., the LOGIT, PROBIT, and IVPROBIT models) were employed to estimate the influence of various factors on the binary decision-making for industrial land transformation [8,31]. The formula is shown in Equation (1):
Transformi = a1Pricei + a2Xi0
where Transform is a binary dependent variable representing whether an industrial land parcel is transformed (this study supposes that industrial land renewal is faced with only two choices: transformation and non-transformation); Price (land prices or its growth rate) is the independent variable; X refers to control variables; and ε0 stands for the error.
It was noted that the LOGIT and PROBIT models inadequately addressed the endogeneity of land prices in industrial land transformation and may fail to yield convincing results. Extant literature suggested the externality of regeneration in the built environment, including industrial heritage and raised real estate values within a certain distance [32,33,34,35]. Accordingly, this study employed the IVPROBIT model to enhance the reliability of the results [36]. The distance from industrial land parcels to high schools or primary schools is selected as the instrumental variable because it is widely recognized that compulsory schools contribute to the rising value of surrounding real estate in China [37,38].
All in all, a total of sixteen discrete choice models were built in this study. Models (1), (3) and (5) were employed to examine the effect of land prices on industrial land transformation, while Models (2), (4) and (6) were employed to examine the effect of the expected land price growth rate on industrial land transformation. Models (7) to (10) were employed to investigate the impact of land-leasing policies on industrial land transformation by dividing the independent variable Price into two categories (i.e., before and after 2007). This is because the year 2007 is considered as a time watershed for the land-leasing policy change in China [8]. Models (11) and (12), using three dummy variables (i.e., dummy_district, dummy_city, and dummy_state) as substitutions for the control variable (i.e., Indpark), were used to explore the industrial park administrative levels’ effect on industrial land transformation. Models (13) to (16) were used to examine the industrial land output’s moderation effect on transformation by introducing a series of interaction variables (i.e., Area × Efficiency, Price × Efficiency, Price × Area, and Price × Efficiency × Area). All relevant variables are shown in Table 3.

3. Results

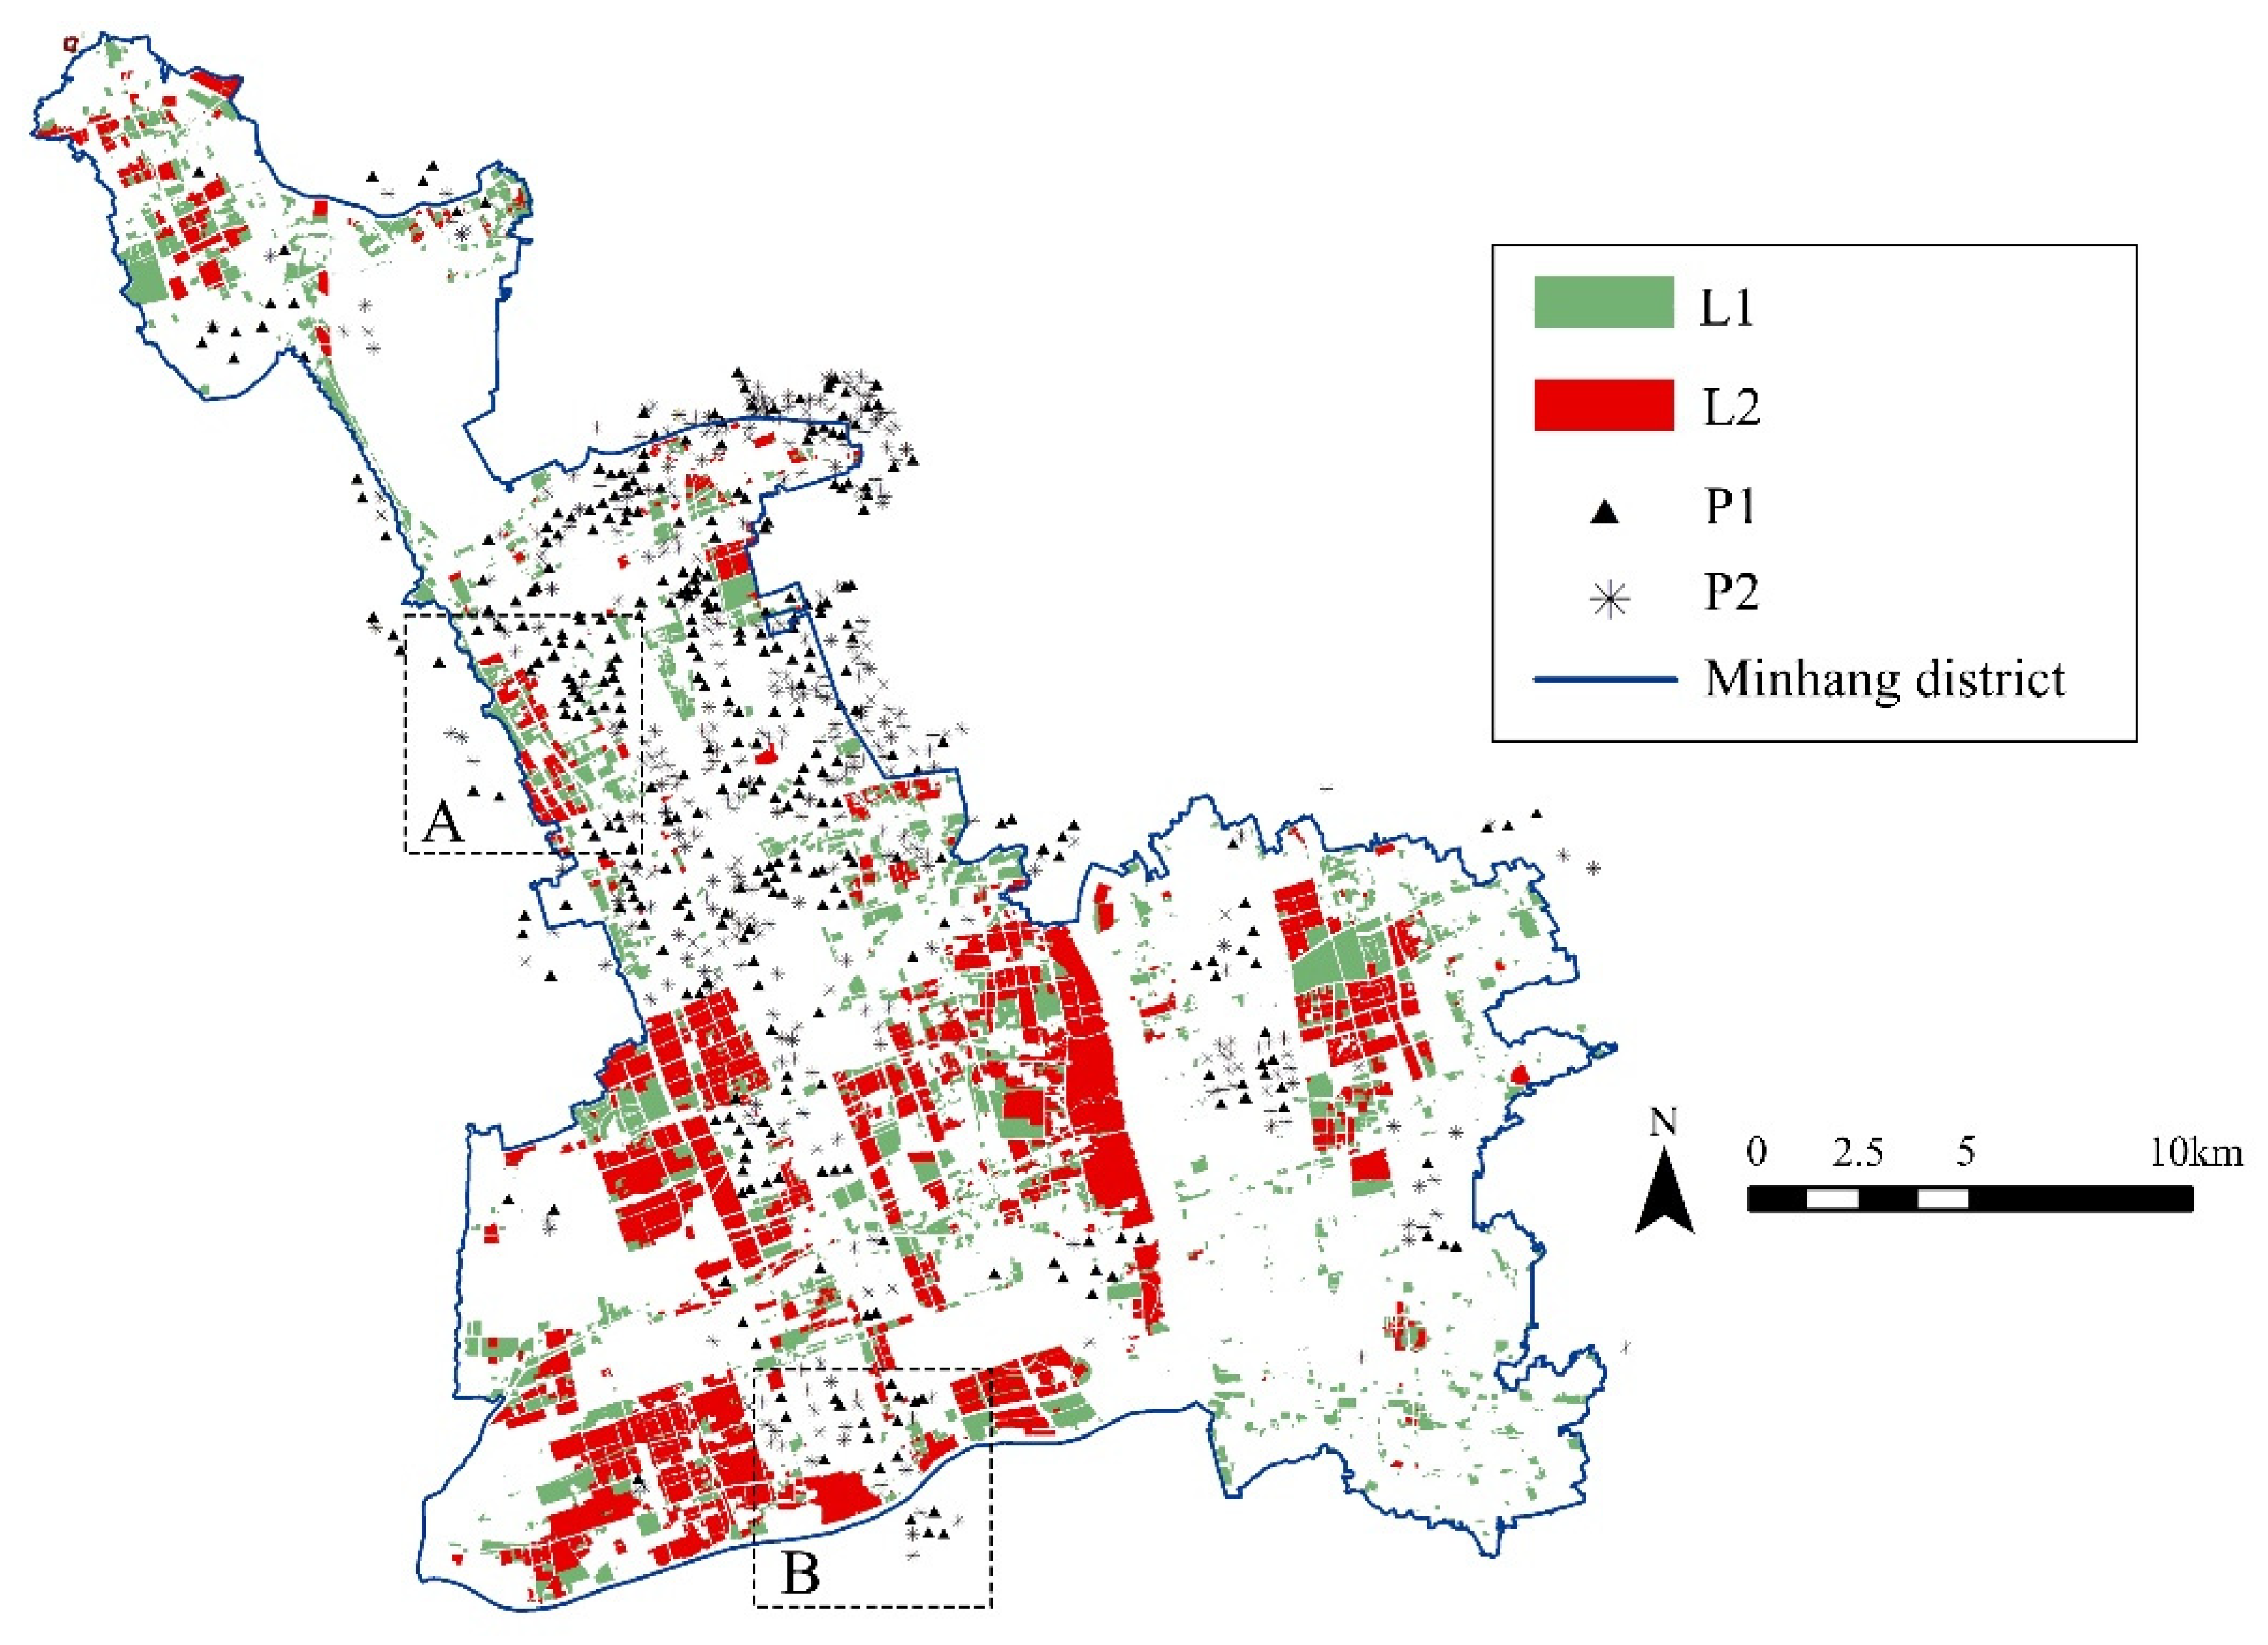
3.1. Differences in Characteristics and Locations for Industrial Land Transformation

3.1.1. Differences in Characteristics between L1 and L2

Table 4 compares characteristic indicators between L1 and L2. There was a larger amount of L1 than L2 in Minhang District, Shanghai. The mean area and the surrounding industrial land area of L2 were slightly larger than those of L1. The land acquisition time of L1 was earlier than its counterpart. This is to say, the early conveyed land was more likely to have been in transformation at present. A lower efficiency in L1 indicated that the enterprises on L1 might be facing failure in manufacturing, or their original intention was to wait for real-estate-oriented redevelopment. This was similar between L1 and L2 in terms of the distance to a subway station and Xujiahui. There was a higher percentage of L2 locating in the CCA and industrial parks.

3.1.2. Spatial Distribution of Industrial Land and Living Quarters

Figure 4 presents the spatial distribution of industrial land (L1 and L2) and living quarters (P1 and P2). L1 was mostly distributed separately and located on the junction area between industrial clusters and other land-use functions. P1 was mainly located near L1 (Zone A in Figure 4) but relatively away from L2 (Zone B in Figure 4).
Figure 5 describes the clustering of industrial land and living quarters within a certain distance. Industrial land and living quarters appeared slightly discrete within a certain calculation radius. However, when the value of the K-function fell above the upper bound of the 95% confidence interval under the null hypothesis (grey zone in Figure 5), their agglomeration pattern reversed as the calculation radius increased.
There were evident differences in the clustering radius from industrial land (L1 and L2) to living quarters (P1 and P2). The minimum clustering radius from industrial land parcels to surrounding living quarters roughly fell by around 400 m (Figure 5a). The minimum clustering radius to surrounding living quarters from L1 (about 350 m) was shorter than that from L2 (about 600 m), as suggested in Figure 5b,c. The minimum clustering distance between L1 and P1 was as the shortest as approximately 350 m (Figure 5d), while the aggregation of L1 and P2 emerged from a radius of around 450 m (Figure 5e). The minimum clustering radius from L2 to P1 was over 600 m, which was significantly larger than the radius from L1 to P1, as suggested in Figure 5d,f. In a word, L1 was located nearer to living quarters, especially to P1.
To conclude, the results from Section 3.1.1 and Section 3.1.2 presented significant differences in characteristics and locations between L1 and L2, verifying Hypothesis 1.

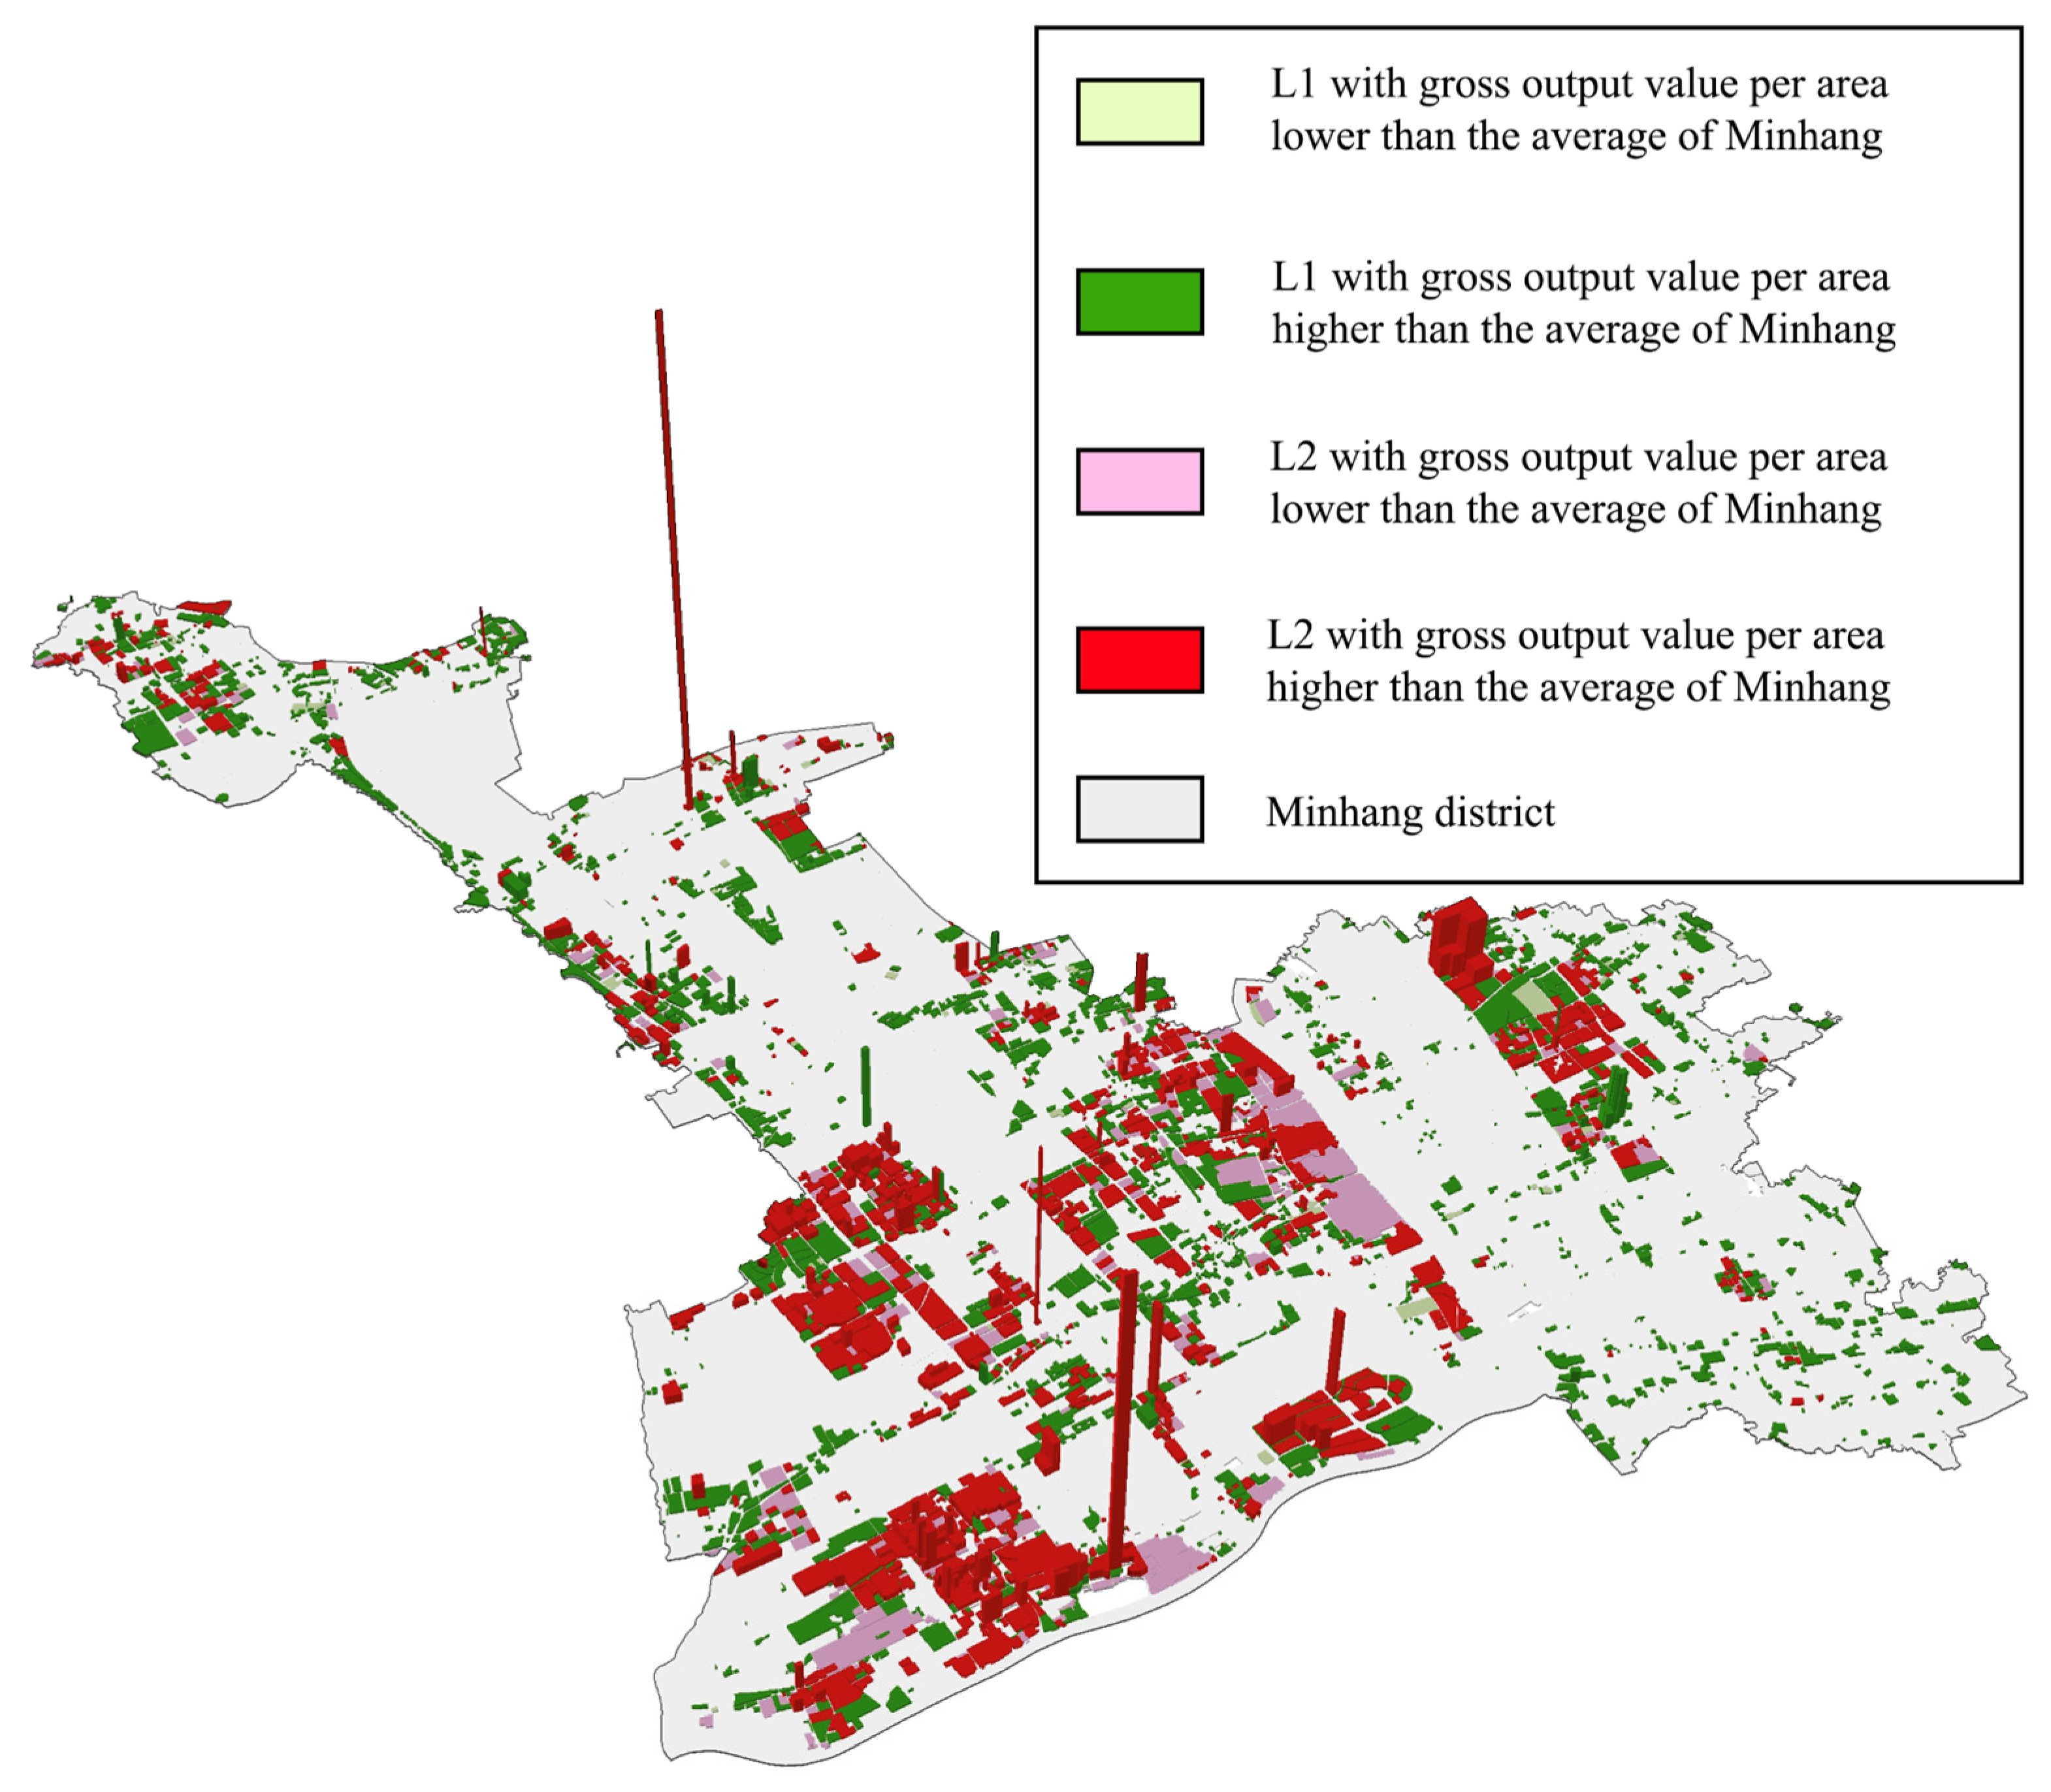
3.2. Positive Impact of Land Price on Industrial Land Transformation

Table 5 shows the effect of a range of factors on industrial land transformation. The results of the LOGIT and PROBIT model are similar in the significance of the coefficients, and the IVPROBIT model strengthens the results. It is noticeable that both the land price and its growth rate yielded a significantly positive coefficient in Models (1) to (6), verifying Hypothesis 2.
Additionally, as shown in Table 5, the production efficiency, mean area, and locational factors (e.g., located in the CCA or industrial parks) played a significantly negative role in industrial land transformation. However, a range of factors significantly contributed to industrial land transformation, e.g., the earlier acquisition time and the higher proportion of surrounding L1. Moreover, it is interesting to find that the coefficient of lnAgg500 displayed great significance in models except for Model (5), while the coefficient of lnMetrodist only demonstrated great significance in Model (5).

3.3. Influence of Policy Factors and Industrial Parks on Industrial Land Transformation

Table 6 shows the effect of industrial park administration levels and land-leasing policies on industrial land transformation. According to results of Models (7) to (10), industrial land parcels acquired after 2007 had a lower coefficient of the land price and its growth rate than before 2007. Generally, industrial parks’ higher administrative level discouraged industrial land parcels from transformation according to results of Models (11) and (12). However, the effect of the dummy variable for state-level industrial parks was not significant in Model (12).
To conclude, the above results have shown that administrative grades of industrial parks and policy factors can significantly affect industrial land regeneration, thus verifying Hypothesis 3.

3.4. Moderation Effects of Output on Industrial Land Transformation

Figure 6 presents the spatial distribution of industrial land output in Minhang District. The industrial land with the highest output still kept manufacturing, although a large amount of industrial land with a comparatively higher output has been transformed. It was also found that large-scale and centrally distributed industrial land with low outputs was under transformation.
Table 7 shows the moderation effect of the industrial land output on its transformation based on a series of interaction variables. The coefficient of Area×Efficiency was significantly negative in Models (13) to (15). Considering the negative coefficients of lnArea and lnEfficiency, the land area and land use efficiency could co-function to prevent industrial regeneration. The significantly negative coefficients of Price × Efficiency×Area in Model (14) and Price × Efficiency in Model (16) revealed that the marginal effect of industrial land prices could be undermined when industrial land was efficient and productive.
To conclude, output factors directly affect the choice of transformation model and moderate the influence of land price on transformation, thus verifying Hypothesis 4.

4. Discussion

4.1. The Game Framework for Industrial Land Transformation

China’s urbanization brings with it the rapid expansion of the urban population and built-up areas. In urban growth areas, various forces to enlarge industrial land-leasing scales form a sophisticated situation, representing the total amount of development demands from different stakeholders. The conflict of interest in urbanization is caused by the divergence in the goals of governments at various administrative levels, the differential interests of involved groups, and multiple urban functions, etc. The goal determines transformation options because the scale and location entropy are different among industrial, commercial, and residential land. The objectives also influence the decision-making process because land occupants intend to fully obtain land values reflected in the different land use nature [39]. However, it is manifest and observable that the intervention from various stakeholders could lead to the multi-dimensional spatial fragmentation of urban areas [40].
The residential and commercial redevelopment of industrial land can cause a potential return from land value appreciation. The added value of real estate from industrial transformation attracts various participants to promote urban renewal [15], further pushing up prices of the surrounding land and housing [35]. This makes relevant stakeholders more willing to become involved in the transformation processes. Faced with this option, enterprises have to decide whether to keep on manufacturing. This study revealed that the commercial real estate redevelopment of industrial land was largely affected by residential property price rising, comparing the profit from manufacturing products. From this perspective, industrial land transformation is the process of land resources allocation under the land market economy mechanism. This process can cause a higher input–output efficiency and significantly contribute to GDP growth as well as local finance. Local governments can thus distribute more financial resources for public affairs. However, given that the income from real estate development is higher than that from industry and commerce, industrial land developers may be distracted from their intended purpose to restrain manufacturing and innovation research [14]. Therefore, this could lead to excessive commercial real estate development, a decline in the real economy, and social inequity, although industrial land transformation in commercial functions is economically rational.
At last, industrial enterprises’ producing and profiting conditions affect revenue expectations from the industrial transformation, adding to the cost of redevelopment; that is to say, the output factors can be involved in the game process. According to Section 3.4, the industrial land efficiency was suggested as a mediator to regulate industrial land transformation. However, the driving force from land prices rising expectations is so intensive that some efficient industrial land has been transformed, even the redevelopment of this land calls for a higher rate of return to cover the loss from transformation.

4.2. The Role of Industrial Land Leasing for Local Governments

Industrial land leasing has become not only an essential part of the “land finance game” [41] but also a competitive weight of the “attracting investment” policy [3]. First, industrial land transformation driven by the land price increment is a process of urban reconstruction somewhat driven by anticipated financial revenue. The government dominates the primary land market by controlling the development region, transaction prices, and industrial land planning [42]. The existing fiscal and taxation system’s constraints in China allow the local government to obtain financial revenue by controlling the land supply, leasing, and conveyance [43,44]. Industrial land is often allocated in the peri-urban area or suburb area with the attractive promise of low or even zero land prices when the local government attempts to attract external investment [45]. By simultaneously leasing a large amount of industrial land at a low price and pushing up the price of residential land, the local government makes full use of land composition balance theories [46]. Much of local governments’ extrabudgetary income increase comes from land transactions, leading to an expanding metropolitan area [47]. The over-speed land urbanization strengthens the opinion that urban sprawl is promoted for economic growth in cities [48]. The massive industrial land allocated in this process generates fiscal revenue through both budget and extrabudgetary channels [1,2], which raises an overall fixed asset price. However, this land-centered development model [49,50] can only bring economic growth in the short run. It does not create much new social value or provide more opportunities for wealth accumulation.
Second, industrial land leasing has become a vital competition tool for regional and local governments after establishing a system of tax distribution in China [51]. The existing finance and taxation management system in China requires local governments to allocate industrial land within their administrative jurisdiction. Each jurisdiction has its own industrial park at different administrative grades. This will bring about competitive relationships among local governments because a higher-level industrial park can provide more attractive incentives for industrial enterprises. Local governments often use differentiated supply strategies to make full use of the economic and financial value of industrial and other functional land use [52,53]. This can be found more commonly in these areas (e.g., Shanghai) where long-term economic growth pressure exists [54,55].

4.3. The Regeneration Behavior of Industrial Enterprises

The diversity of enterprise types and industrial land ownerships results in different industrial land development patterns. On the one hand, the diversity of industrial enterprise identities may add to the complexity of regeneration approaches. Industrial land can be used by private companies, collective groups, state-owned enterprises, and various joint ventures in the peri-urbanization area. The differences in industrial enterprise identities lead to differential land-leasing prices, location choices, and priority in facility supports when industrial land is allocated. Considering the differences in property right structures of state-owned, private-owned, and joint-venture enterprises, the motive force and path of their transformation could be also different [56,57]. On the other hand, the land used by industrial enterprises is either state-owned or collectively owned. The state-owned industrial land is mostly in industrial parks, while collective land is located in rural areas, such as inner and outer suburbs, etc. Therefore, collective industrial land transformation involves the land expropriation process and the inevitable negotiation between governments and villagers, adding to the transition cost and uncertainty [13,39]. Moreover, according to Section 3.1.1, the coefficients of lnAgg500 and Tran500 indicated that the peer effect of industrial transformation existed and promoted the overall regeneration of industrial zones [58].
The relocation of industrial enterprises address also affects regeneration. Some enterprises are faced with the relocation of production workshops in urban regeneration. In most cases, industrial parks provide enterprises with tax compensation and other incentive policies to encourage them to move in their manufacturing base. However, industrial parks have a selection process for prospective enterprises based on productivity and industrial categories [11,59]. The entry criteria may exclude inefficient enterprises.
Additionally, the land prices rising expectations from industrial land developers can encourage industrial land redevelopment. To seek potential profit margins from land transactions, industrial enterprises intend to capture more industrial land than they need in manufacturing [60]. If these enterprises are unfortunately shut down due to the enterprise life cycle rule, they are willing to turn into real estate development instead of exploring new manufacturing opportunities in the industrial field. Thus, the 50-year term for industrial land tenure in China seems too long [61,62]. Some enterprises have even found such institutional loopholes. They tend to introduce nominal investment to stimulate the land price increase and wait for governments to Shouchu the land (repurchase and reserve of land resources by authorities), rather than manufacturing after obtaining industrial land. The withdrawal system of inefficient land to some extent mitigates issues of the idle land and restricts the speculation behavior of industrial enterprises [60].

4.4. Targeted Guidance to Regulate Industrial Land Transformation

The positive effect of land price appreciation on regeneration exposes the risk of industrial land management. Industrial land transformation offers a chance for low-output or even shut-down enterprises to survive. On the contrary, the institutional arrangement to curb land speculation not only hinders the redevelopment of idle industrial land, but also forces the conveyance of new industrial land to achieve a quantitatively reasonable demand in the name of the development of the industrial economy. Over the past few decades, this process repeats, and inefficient industrial land continually emerges. The constant industrial land allocation provides hotbeds for the prevalence of land price-oriented regeneration. The sustainable industrial development associated with the urbanization process is thus threatened. This has become a core problem of urbanization in China [8].
The targeted guidance for regeneration is an effective approach to resolving spatial problems of industrial land. A series of urban space problems are caused due to excessive leasing scale and inefficient use of industrial land. For instance, urban spatial fragmentation is strengthened [39,56,57] because industrial land is mainly distributed in urban fringe and suburbs and mixed with other functional lands [51]. The spatial problem also intensifies the contradiction among various types of stakeholders [39] and limits a region’s redevelopment [57,63]. According to Section 3.1.1, the transformation occurs on relatively small and independent industrial land parcels, leaving the distribution of L2 to be aggregated but the distribution of L1 to be fragmented. Moreover, according to Section 3.2, the significantly negative effect of the mean area and land efficiency on industrial land transformation indicated that the land parcels with a lower efficiency and smaller areas were more likely to be transformed. The redevelopment of fragmented land parcels can reduce the regional industrial fragmentation, and thus improve the urban spatial pattern. The government can guide inefficient industrial land and transform it into space for public facilities according to functional requirements. The policies of promoting production can bring together high-value enterprises and strengthen industrial aggregation. Therefore, this study insists that industrial land transformation can optimize the urban form and the industrial layout.
Improving inefficient land use and promoting its regeneration is related to the local government’s philosophy of urbanization and urban renewal. Formal industrial land transformation cannot be completed without the approval of the local government in China. The desire for fiscal revenue and extrabudgetary income in land transactions urges local governments to enlarge the industrial land scale and promote industrial land redevelopment [44]. In turn, regeneration can be useful for governments to promote the transformation of substandard industrial enterprises. The management mechanism in land transactions and prices results in the deviation between industrial land’s transfer cost and market price [8]. The parcels with advantageous locations can be easily transformed by market forces, while those with poorer performance and sites should be transformed into other infrastructures. Both of the two regeneration patterns can help relieve the financial pressure of local governments. Considering the positive impact of industrial land regeneration, it is necessary to implement supervision and withdraw measures on inefficient land from the perspective of benefit balance sharing. This can stimulate the full participation of market subjects in the regeneration of industrial land.

4.5. Highlights, Limitations, and Suggestions for Further Research

This study focuses on how land price appreciation affects industrial land transformation, enlightened by the large amount of inefficient and idle industrial land located in Minhang District, Shanghai. There are two main highlights of this study: first, econometric methods were employed to explore causal relationships between industrial land transformation and land prices rising expectations, which fills the methodological gap in industrial land transformation research. Another highlight is that a fine-grained industrial land data (i.e., at the parcel level) were adopted in this study. This can provide the potential to conduct a more in-depth and detailed analysis, compared to previous studies that used macro- or meso- level data.
However, this study still has several defects that need improving. First, this study did not consider industrial land parcels’ influence outside of the study area in Shanghai due to unavailable industrial data in other districts adjacent to the Minhang District. Second, the industrial clusters’ edge did not strictly follow the district boundary because of industrial land sprawl in southwestern Shanghai. This may conceal the real distribution of industrial land parcels. Third, there are a few limitations in the living quarter data. For instance, the location of second-hand housing transactions is unstable. The interpolation results thus cannot be directly compared. To calculate land prices’ growth rate, this study only took the living quarter data appearing in both 2015 and 2019 into consideration, which actually narrowed the sample size. The built year and types of living quarters were omitted, resulting in certain errors in price estimation. The acquired housing price might not be the real trading price given the price fluctuations and artificial adjustments for advertising. Moreover, the Euclidean distance alone was considered when obtaining the spatial distribution of land prices using the Kriging interpolation method, which might weaken the result to some extent. Fourth, the potential influence of relevant factors (e.g., types of land ownership, industrial categories, and density of investment and labor) was not directly estimated due to unavailable data. The omitted variables in the empirical stage added to the difficulties of evaluating the effect of land price. We managed to employ relevant variables like efficiency, neighbor industrial land, industrial parks, and CCA to substitute the effect of unobserved factors, but the performance was still hard to evaluate. Fifth, the lack of data for enterprises below the designated scale (the annual enterprise income is no more than CNY 20 million) might lead to errors in the output efficiency analysis.
Finally, this study suggests a few directions for further research. First, the regeneration of industrial land in this study was illustrated as a static result instead of a dynamic process. In fact, the regeneration involves various stakeholders and lasts for quite a long time covering several stages. Future studies can focus on the dynamic process. For instance, based on multi-source data (e.g., remote sensing and electricity consumption data), the dynamics of industrial land from manufacturing to transformation can be estimated by figuring out the exact time of transition and the real condition of manufacturing. Second, the subject of industrial land transformation is complex, and the orientations of different interest groups do not concur with each other. This method of divergence affects the transformation process. This process’s theoretical and practical value will play a significant role in the spatial planning of regeneration and urban management, deserving an in-depth analysis in the future. Third, the government introduced a series of regulations to control the transfer process and transaction value to curb land speculation [4,51]. Still, this problem has not effectively been solved [8]. Scholars can further focus on providing policymakers with theoretical and practical supports to mitigate bad effects from industrial land transformation in the game process.

5. Conclusions

This empirical study took the Minhang District of Shanghai as the study area and verified four hypotheses. First, this study showed distinct discrepancies in some features (e.g., the mean area, output efficiency, surrounding industrial land area, and location) between L1 and L2. Second, this study proved land prices rising expectations to be a driving force for promoting industrial land transformation. Third, it was found that two factors (e.g., land leasing policies and whether the industrial land is located in industrial parks) could influence the effect of land prices rising expectations on industrial land transformation. Finally, this study also found that the industrial land output could serve as a moderator to regulate the transformation process. These findings will provide policy makers (e.g., relevant authorities and urban planners) with significant references to coordinate the transformation process in a sustainable manner, given that industrial land transformation can bring both advantages and disadvantages.
It is usually believed that, after industrialization, industrial land vacancies will appear and wait for industry upgrading or the redevelopment of other types of land-use. However, China’s situation is slightly different. Some industrial landowners do not really start production after acquiring the land, but rather wait for policy shifts and reap excess profits by adjusting to commercial housing development, because the industrial land acquisition cost is very low at the start of the projects. As a result, the development of commercial housing excessively relies on price increase expectations rather than the market supply and demand relationship, causing defects in the matching of urban functional space. This experience of Chinese cities in the process of rapid urbanization driven by industrialization can provide reference for later countries.

Author Contributions

Conceptualization, Methodology, Data curation, Supervision, Project administration, Validation, Resources, Formal analysis, Funding acquisition, F.Y.; Data curation, Investigation, Software, Writing—Original draft preparation, P.T.; Writing—Review and Editing, X.C. and J.W.; Visualization, J.W. All authors have read and agreed to the published version of the manuscript.

Funding

This research was funded by the National Natural Science Foundation of China, grant number 51778436.

Institutional Review Board Statement

Not applicable.

Informed Consent Statement

Not applicable.

Data Availability Statement

The data presented in this study are available on request from the first author.

Conflicts of Interest

The authors declare no conflict of interest.

References

  1. Cai, M. Revenue, time horizon, and land allocation in China. Land Use Policy 2017, 62, 101–112. [Google Scholar] [CrossRef] [Green Version]
  2. Tao, R.; Su, F.; Liu, M.; Cao, G. Land leasing and local public finance in China’s regional development: Evidence from prefecture-level cities. Urban Stud. 2010, 47, 2217–2236. [Google Scholar] [CrossRef]
  3. Zhang, L.; Nian, Y.; Pi, J.; Zhou, Y. Land policy, land supply structure and housing prices. China J. Econ. 2017, 4, 91–118. [Google Scholar] [CrossRef]
  4. Lin, Y.; Qin, Y.; Yang, Y.; Zhu, H. Can price regulation increase land-use intensity? Evidence from China’s industrial land market. Reg. Sci. Urban Econ. 2020, 81, 103501. [Google Scholar] [CrossRef]
  5. Alder, S.; Shao, L.; Zilibotti, F. Economic reforms and industrial policy in a panel of Chinese cities. J. Econ. Growth 2016, 21, 305–349. [Google Scholar] [CrossRef]
  6. Zhang, J. Interjurisdictional competition for FDI: The case of China’s “development zone fever”. Reg. Sci. Urban Econ. 2011, 41, 145–159. [Google Scholar] [CrossRef]
  7. Schminke, A.; van Biesebroeck, J. Using export market performance to evaluate regional preferential policies in China. Rev. World Econ. 2013, 149, 343–367. [Google Scholar] [CrossRef] [Green Version]
  8. Tu, F.; Yu, X.; Ruan, J. Industrial land use efficiency under government intervention: Evidence from Hangzhou, China. Habitat Int. 2014, 43, 1–10. [Google Scholar] [CrossRef]
  9. Meng, Y.; Zhang, F.-R.; An, P.-L.; Dong, M.-L.; Wang, Z.-Y.; Zhao, T. Industrial land-use efficiency and planning in Shunyi, Beijing. Landsc. Urban Plan. 2008, 85, 40–48. [Google Scholar] [CrossRef]
  10. Sun, Y.; Ma, A.; Su, H.; Su, S.; Chen, F.; Wang, W.; Weng, M. Does the establishment of development zones really improve industrial land use efficiency? Implications for China’s high-quality development policy. Land Use Policy 2020, 90, 104265. [Google Scholar] [CrossRef]
  11. Huang, D.; Wan, W.; Dai, T.; Liang, J. Assessment of industrial land use intensity: A case study of Beijing economic-technological development area. Chin. Geogr. Sci. 2011, 21, 222–229. [Google Scholar] [CrossRef]
  12. Harvey, D. The geography of capitalist accumulation: A recpnstruction of the Marxian theory. Antipode 1975, 7, 9–21. [Google Scholar] [CrossRef]
  13. Lai, Y.; Tang, B. Institutional barriers to redevelopment of urban villages in China: A transaction cost perspective. Land Use Policy 2016, 58, 482–490. [Google Scholar] [CrossRef]
  14. Wang, W.; Rong, Z. Housing boom and firm innovation: Evidence from industrial firms in China. China Econ. Q. 2014, 13, 465–490. [Google Scholar] [CrossRef]
  15. Gao, J.; Chen, W.; Yuan, F. Spatial restructuring and the logic of industrial land redevelopment in urban China: I. Theoretical considerations. Land Use Policy 2017, 68, 604–613. [Google Scholar] [CrossRef]
  16. Tian, L.; Ma, W. Government intervention in city development of China: A tool of land supply. Land Use Policy 2009, 26, 599–609. [Google Scholar] [CrossRef]
  17. Gao, J.; Chen, W. Spatial restructuring and the logic of industrial land redevelopment in urban China: III. A case study of the redevelopment of a central state-owned enterprise in Nanjing. Cities 2020, 96, 604–613. [Google Scholar] [CrossRef]
  18. Gao, J.; Chen, W.; Liu, Y. Spatial restructuring and the logic of industrial land redevelopment in urban China: II. A case study of the redevelopment of a local state-owned enterprise in Nanjing. Land Use Policy 2018, 72, 372–380. [Google Scholar] [CrossRef]
  19. Wang, S.; Wang, J.; Wang, Y. Effect of land prices on the spatial differentiation of housing prices: Evidence from cross-county analyses in China. J. Geogr. Sci. 2018, 28, 725–740. [Google Scholar] [CrossRef] [Green Version]
  20. Wen, H.; Goodman, A.C. Relationship between urban land price and housing price: Evidence from 21 provincial capitals in China. Habitat Int. 2013, 40, 9–17. [Google Scholar] [CrossRef]
  21. Dubin, R.A. Predicting house prices using multiple listings data. J. Real Estate Financ. Econ. 1998, 17, 35–59. [Google Scholar] [CrossRef]
  22. Kuntz, M.; Helbich, M. Geostatistical mapping of real estate prices: An empirical comparison of kriging and cokriging. Int. J. Geogr. Inf. Sci. 2014, 28, 1904–1921. [Google Scholar] [CrossRef]
  23. Li, H.; Wei, Y.D.; Wu, Y.; Tian, G. Analyzing housing prices in Shanghai with open data: Amenity, accessibility and urban structure. Cities 2019, 91, 165–179. [Google Scholar] [CrossRef]
  24. Si, Z.; Shi, Y. The impacts of class 3A comprehensive hospitals on population distribution and housing price: Take children’s hospital of Fudan University for example. Econ. Geogr. 2013, 33, 74–81. [Google Scholar]
  25. Byth, K.; Ripley, B.D. On sampling spatial patterns by distance methods. Biometrics 1980, 36, 279–284. [Google Scholar] [CrossRef]
  26. Lotwick, H.W.; Silverman, B.W. Methods for analyzing spatial processes of several types of points. J. R. Stat. Soc. Ser. B 1982, 44, 406–413. [Google Scholar]
  27. Wiegand, T.; Moloney, K.A. Rings, circles, and null-models for point pattern analysis in ecology. Oikos 2004, 104, 209–229. [Google Scholar] [CrossRef]
  28. Austin, S.B.; Melly, S.J.; Sanchez, B.N.; Patel, A.; Buka, S.; Gortmaker, S.L. Clustering of fast-food restaurants around schools: A novel application of spatial statistics to the study of food environments. Am. J. Public Health 2005, 95, 1575–1581. [Google Scholar] [CrossRef]
  29. Cuthbert, A.L.; Anderson, W.P. Using spatial statistics to examine the pattern of urban land development in Halifax-Dartmouth. Prof. Geogr. 2002, 54, 521–532. [Google Scholar] [CrossRef]
  30. Baddeley, A.; Turner, R. spatstat: An R package for analyzing spatial point patterns. J. Stat. Softw. 2005, 12, 1–42. [Google Scholar] [CrossRef] [Green Version]
  31. Itoh, R. Estimating the willingness to pay of industrial firms for Japanese industrial parks. Urban Stud. 2013, 50, 2753–2765. [Google Scholar] [CrossRef]
  32. Chau, K.W.; Wong, S.K. Externalities of urban renewal: A real option perspective. J. Real Estate Financ. Econ. 2014, 48, 546–560. [Google Scholar] [CrossRef] [Green Version]
  33. Lee, C.-C.; Liang, C.-M.; Chen, C.-Y. The impact of urban renewal on neighborhood housing prices in Taipei: An application of the difference-in-difference method. J. Hous. Built Environ. 2017, 32, 407–428. [Google Scholar] [CrossRef]
  34. Rossi-Hansberg, E.; Sarte, P.D.; Owens, R., III. Housing externalities. J. Political Econ. 2010, 118, 485–535. [Google Scholar] [CrossRef]
  35. van Duijn, M.; Rouwendal, J.; Boersema, R. Redevelopment of industrial heritage: Insights into external effects on house prices. Reg. Sci. Urban Econ. 2016, 57, 91–107. [Google Scholar] [CrossRef]
  36. Newey, W.K. Efficient estimation of limited dependent variable models with endogenous explanatory variables. J. Econom. 1987, 36, 231–250. [Google Scholar] [CrossRef]
  37. Li, H.; Wei, Y.D.; Yu, Z.; Tian, G. Amenity, accessibility and housing values in metropontan USA: A study of salt Lake county, utah. Cities 2016, 59, 113–125. [Google Scholar] [CrossRef]
  38. Zheng, S.; Kahn, M.E. Land and residential property markets in a booming economy: New evidence from Beijing. J. Urban Econ. 2008, 63, 743–757. [Google Scholar] [CrossRef]
  39. Wang, B.; Li, T.; Yao, Z. Institutional uncertainty, fragmented urbanization and spatial lock-in of the pen-urban area of China: A case of industrial land redevelopment in Panyu. Land Use Policy 2018, 72, 241–249. [Google Scholar] [CrossRef]
  40. Guo, Y.; Yuan, Q.; Tan, S.; Xiang, Z. Urban renewal to integrate fragmented rural industrialized areas: A case study of Nanhai District, Foshan City. City Plan. Rev. 2020, 44, 53–61, 89. [Google Scholar]
  41. Jiang, Z. Industrialization, local government efforts and land finance: A perspective of land finance in China. China Ind. Econ. 2014, 10, 33–45. [Google Scholar] [CrossRef]
  42. Lin, S.-W.; Ben, T.-M. Impact of government and industrial agglomeration on industrial land prices: A Taiwanese case study. Habitat Int. 2009, 33, 412–418. [Google Scholar] [CrossRef]
  43. Cao, G.; Feng, C.; Tao, R. Local “Land finance” in China’s urban expansion: Challenges and solutions. China World Econ. 2008, 16, 19–30. [Google Scholar] [CrossRef]
  44. Xu, N. What gave rise to China’s land finance? Land Use Policy 2019, 87, 104015. [Google Scholar] [CrossRef]
  45. Peng, S.; Wang, S.; Chen, C.; Wei, H.; Wang, J.; Wu, X. Analysis of the economic rationality of local government’s downtick of the industrial land: Evidence from the municipalities in Guangdong Province. J. Nat. Resour. 2015, 30, 1078–1091. [Google Scholar] [CrossRef]
  46. Zhang, X.; Lin, Y.; Wu, Y.; Skitmore, M. Industrial land price between China’s Pearl River Delta and Southeast Asian regions: Competition or coopetition? Land Use Policy 2017, 61, 575–586. [Google Scholar] [CrossRef] [Green Version]
  47. Gomez-Antonio, M.; Hortas-Rico, M.; Li, L. The causes of urban sprawl in spanish urban areas: A apatial approach. Spat. Econ. Anal. 2016, 11, 219–247. [Google Scholar] [CrossRef]
  48. Gao, J.; Wei, Y.D.; Chen, W.; Chen, J. Economic transition and urban land expansion in provincial China. Habitat Int. 2014, 44, 461–473. [Google Scholar] [CrossRef]
  49. Lin, G.C.S. Reproducing spaces of chinese urbanisation: New city-based and land-centred urban transformation. Urban Stud. 2007, 44, 1827–1855. [Google Scholar] [CrossRef]
  50. Ye, L.; Wu, A.M. Urbanization, land development, and land financing: Evidence from Chinese cities. J. Urban Aff. 2014, 36, 354–368. [Google Scholar] [CrossRef]
  51. Zhou, L.; Tian, L.; Gao, Y.; Ling, Y.; Fan, C.; Hou, D.; Shen, T.; Zhou, W. How did industrial land supply respond to transitions in state strategy? An analysis of prefecture-level cities in China from 2007 to 2016. Land Use Policy 2019, 87, 104009. [Google Scholar] [CrossRef]
  52. Huang, Z.; Du, X. Government intervention and land misallocation: Evidence from China. Cities 2017, 60, 323–332. [Google Scholar] [CrossRef]
  53. Shen, T.; Ai, G.; Cui, N.; Gu, H. Interactive behavior of local government industrial land transfer strategy in the Yangtze River Delta. J. Ind. Technol. Econ. 2019, 38, 47–53. [Google Scholar] [CrossRef]
  54. Fang, L.; Tian, C.; Yin, X.; Song, Y. Political cycles and the mix of industrial and residential land leasing. Sustainability 2018, 10, 3077. [Google Scholar] [CrossRef] [Green Version]
  55. Huang, Z.; Du, X. Strategic interaction in local governments’ industrial land supply: Evidence from China. Urban Stud. 2017, 54, 1328–1346. [Google Scholar] [CrossRef]
  56. Tian, L. Land use dynamics driven by rural industrialization and land finance in the pen-urban areas of China: “The examples of Jiangyin and Shunde”. Land Use Policy 2015, 45, 117–127. [Google Scholar] [CrossRef]
  57. Zhu, J.; Guo, Y. Fragmented peri-urbanisation led by autonomous village development under informal institution in high-density regions: The case of Nanhai, China. Urban Stud. 2014, 51, 1120–1145. [Google Scholar] [CrossRef] [Green Version]
  58. Lieberman, M.B.; Asaba, S. Why do firms imitate each other? Acad. Manag. Rev. 2006, 31, 366–385. [Google Scholar] [CrossRef] [Green Version]
  59. Huang, Z.; He, C.; Wei, Y.H.D. A comparative study of land efficiency of electronics firms located within and outside development zones in Shanghai. Habitat Int. 2016, 56, 63–73. [Google Scholar] [CrossRef]
  60. Wang, K.; Xiong, K.; Gao, W. Research on the relationship between the conveyance mode of industrial land use rights and the output elasticity of land in the development zones. China Land Sci. 2013, 27, 4–9. [Google Scholar]
  61. Li, J.; Dai, S. Retrospect and prospect of China’s urban land use system reform in the past 60 years. Rev. Econ. Res. 2009, 63, 2–10. [Google Scholar] [CrossRef]
  62. Liu, J. Analysis on reform of industrial land transfer and utilization institution. J. Party Sch. Cent. Comm. C. P. C. 2015, 19, 65–70. [Google Scholar] [CrossRef]
  63. Wu, F.; Zhang, F.; Webster, C. Informality and the development and demolition of urban villages in the Chinese peri-urban area. Urban Stud. 2013, 50, 1919–1934. [Google Scholar] [CrossRef]
Figure 1. The location and distribution of industrial land in Minhang District, Shanghai: (a) The location of Shanghai in China; The map is based on the standard map from the standard map service website GS (2019) No. 1651 of the Ministry of Natural Resources, China (http://bzdt.ch.mnr.gov.cn/index.html, accessed on 27 April 2020), and the base map boundary is not modified. (b) The location of Minhang District in Shanghai. (c) The distribution of industrial land in Minhang District.
Sustainability 14 05280 g001
Figure 2. Kriging interpolation of the housing price and its growth rate: (a) The spatial distribution of the housing price in 2015; (b) The spatial distribution of the housing price growth rate from 2015 to 2019.
Sustainability 14 05280 g002
Figure 3. Framework of the methodology.
Sustainability 14 05280 g003
Figure 4. Spatial distribution of the industrial land and living quarters.
Sustainability 14 05280 g004
Figure 5. Clustering of industrial land (L1 and L2) and living quarters (P1 and P2): (a) Industrial parcels—Living quarters; (b) L1—Living quarters; (c) L2—Living quarters; (d) L1–P1; (e) L1–P2; (f) L2–P1.
Sustainability 14 05280 g005
Figure 6. Distribution of industrial land output value in Minhang District.
Sustainability 14 05280 g006
Table 1. The descriptions and examples of various industrial land parcels.
CategoriesDescriptionsExamples
Transformed landIt refers to the industrial land that has been transformed from industrial usage to other usages. Sustainability 14 05280 i001 Sustainability 14 05280 i002
Under-construction landIt refers to industrial land where the production activity is suspended and/or some buildings are being constructed. Sustainability 14 05280 i003 Sustainability 14 05280 i004
Idle landIt refers to industrial land that is disused and awaiting redevelopment. Sustainability 14 05280 i005 Sustainability 14 05280 i006
Continued-production landIt refers to industrial land where production activities stay active. Sustainability 14 05280 i007 Sustainability 14 05280 i008
Table 2. Classification of industrial land and living quarters.
TitlesCategoriesDescriptions
Industrial landTransformation-oriented land (L1)Transformed land
Under-construction land
Idle land
Continued-production land (L2)Continued-production land
Living quartersResidence with the higher growth rate (P1)The growth rate of average housing price that is higher than the median rate from 2015 to 2019
Residence with the lower growth rate (P2)The growth rate of average housing price that is lower than the median rate from 2015 to 2019
Table 3. The description of selected variables.
CategoriesVariablesDefinitionObs. MeanStd. DevMinMax
Dependent variableTransformA binary variable to identify whether an industrial land parcel is transformed (0 = No; 1 = Yes)5610 0.6230 0.4847 0 1
Independent variableslnPrice2015The logarithm of mean land prices of the industrial land parcel in 2015 (CNY/m2)5610 10.1229 0.1852 9.6535 10.6863
PriceGrowLand price growth rate of the industrial land parcel from 2015 to 2019 (%)5610 0.6476 0.0762 0.5023 0.9112
Control variableslnEfficiencyThe logarithm of output efficiency of the industrial land parcel (104 CNY/m2)5610 6.5351 1.9068 −0.1124 16.4058
lnAreaThe logarithm of the mean area of the industrial land parcel (m2)5610 8.7251 1.4084 2.4974 13.6191
lnYearThe logarithm of the existing year (until 2015) of the industrial land parcel56102.3769 0.7452 03.4657
lnAgg500The logarithm of the area of other industrial land within a 500 m buffer (not including itself, m2)56107.05874.6975013.8146
Tran500The proportion of L1 in total industrial land areas within a 500 m buffer (not including itself)56100.54660.355801
lnMetrodistThe logarithm of the nearest distance to a subway station from the industrial land parcel (m)56106.95590.947708.6897
lnCBDdistThe logarithm of the distance from the industrial land parcel to Xujiahui (m)56109.51880.35667.642410.1199
CCAA binary variable to identify whether the industrial land parcel locates in the CCA (0 = No; 1 = Yes)56100.76420.424601
IndparkA binary variable to identify whether the industrial land parcel locates in industrial parks (0 = No; 1 = Yes)56100.41930.493501
Instrumental variablelnSchDistThe logarithm of the nearest distance to a high school or primary school (m)56106.6813 0.8925 08.1565
Dummy variablesdummy_districtA binary variable to identify whether the industrial land parcel locates in district-level industrial parks (0 = No; 1 = Yes)56100.2141 0.4102 01
dummy_cityA binary variable to identify whether the industrial land parcel locates in city-level industrial parks (0 = No; 1 = Yes)56100.1086 0.3111 01
dummy stateA binary variable to identify whether the industrial land parcel locates in state-level industrial parks (0 = No; 1 = Yes)56100.0966 0.2955 01
Interaction variablesArea × EfficiencyThe product of the mean area and output efficiency of the industrial land parcel56100.2811 1.3509 −15.835816.8490
Price2015 × EfficiencyInteraction variables of Price and Efficiency, in which the price represents the expected land prices of land parcels in 20155610−0.0103 0.2003 −3.7776 2.2318
PriceGROW × EfficiencyInteraction variable of Price and Efficiency, in which the price represents the expected land prices of land parcels in 20155610−0.0023 0.0763 −0.5436 0.9225
Price2015 × AreaInteraction variable of Price and Area, in which the price represents the expected land prices of land parcels in 20155610−0.0013 0.2510 −2.0604 1.6730
PriceGROW × AreaInteraction variable of Price and Area, in which the price represents the land prices’ expected growth rate of land parcels from 2015 to 201956100.0061 0.1062 −1.0430 0.7942
Price2015 × Efficiency × AreaInteraction variable of Price, Efficiency and Area, in which the price represents the expected land prices of land parcels in 20155610−0.0035 0.2447 −3.6971 3.6560
PriceGROW × Efficiency × AreaInteraction variable of Price, Efficiency and Area, in which the price represents the land prices’ expected growth rate of land parcels from 2015 to 20195610−0.0012 0.0958 −1.0974 1.5482
Note: Xujiahui is the nearest urban sub-center of Shanghai city to Minhang district; 2. Interaction variable values are the product of involving variables after being centralized.
Table 4. Discrepancies between L1 and L2.
Indicators
(Mean Values)
Obs.lnArealnYearlnEfficiencylnAgg500Tran500lnMetrodistlnCBDdistCCA Rate (%)Indpark Rate (%)
L134958.42182.5501−2.47336.65440.62296.98029.493768.6428.32
L221159.22642.0906−1.72207.72670.42056.91589.560389.2664.39
Note: The definitions and descriptions of relevant indicators are the same as those in Table 3.
Table 5. Results of the land price’s effect on the industrial land transformation.
Model (1)Model (2)Model (3)Model (4)Model (5)Model (6)
VARIABLESLOGITLOGITPROBITPROBITIVPROBITIVPROBIT
lnPrice20151.199 *** 0.670 *** 10.32 ***
(0.311) (0.182) (2.635)
PriceGrow 0.907 ** 0.502 ** 12.12 ***
(0.425) (0.249) (2.931)
lnEfficiency−0.608 ***−0.610 ***−0.346 ***−0.347 ***−0.300 ***−0.315 ***
(0.0437)(0.0438)(0.0250)(0.0250)(0.0269)(0.0243)
lnArea−0.274 ***−0.272 ***−0.163 ***−0.163 ***−0.197***−0.207 ***
(0.0260)(0.0258)(0.0151)(0.0151)(0.0207)(0.0211)
lnYear0.370 ***0.357 ***0.220 ***0.213 ***0.298 ***0.184 ***
(0.0490)(0.0490)(0.0288)(0.0288)(0.0413)(0.0347)
lnAgg500−0.0216 ***−0.0232 ***−0.0138 ***−0.0147 ***−0.00146−0.0141 ***
(0.00695)(0.00695)(0.00410)(0.00409)(0.00611)(0.00487)
Tran5001.076 ***1.095 ***0.649 ***0.660 ***0.354 ***0.494 ***
(0.0950)(0.0947)(0.0559)(0.0557)(0.106)(0.0783)
lnMetrodist−0.01010.00395−0.003030.00467−0.108 ***0.0139
(0.0341)(0.0340)(0.0205)(0.0205)(0.0390)(0.0254)
lnCBDdist0.319 *−0.178 *0.184 *−0.09284.283 ***−0.0276
(0.171)(0.106)(0.0985)(0.0606)(1.120)(0.0701)
CCA−0.482 ***−0.441 ***−0.270 ***−0.249 ***−0.580 ***−0.275 ***
(0.104)(0.102)(0.0590)(0.0583)(0.110)(0.0673)
Indpark−0.718 ***−0.712 ***−0.433 ***−0.430 ***−0.540 ***−0.517 ***
(0.0799)(0.0798)(0.0475)(0.0474)(0.0661)(0.0608)
Instrumental variableNoNoNoNoYesYes
Constant−14.07 ***2.086 *−7.866 ***1.161 *−143.3 ***−6.373 ***
(4.521)(1.102)(2.629)(0.631)(36.97)(2.014)
AR----0.0000.000
Wald----0.0000.000
Observations561056105610561056105610
Robust standard errors in parentheses; *** p < 0.01, ** p < 0.05, * p < 0.1.
Table 6. Results of the effects of industrial park administration level on industrial land transformation.
Model (7)Model (8)Model (9)Model (10)Model (11)Model (12)
VARIABLESIVPROBITIVPROBITIVPROBITIVPROBITIVPROBITIVPROBIT
Before 2007After 2007Before 2007After 2007
lnPrice201522.65 **4.230 ** 10.61 ***
(10.04)(1.814) (2.705)
PriceGrow 21.62 ***6.054 ** 13.46 ***
(7.428)(2.601) (3.332)
lnEfficiency−0.264 ***−0.297 ***−0.268 ***−0.317 ***−0.306 ***−0.295 ***
(0.0649)(0.0330)(0.0496)(0.0315)(0.0263)(0.0269)
lnArea−0.150 ***−0.193 ***−0.192 ***−0.187 ***−0.199 ***−0.209 ***
(0.0352)(0.0332)(0.0336)(0.0324)(0.0211)(0.0220)
lnYear1.002 ***−0.04580.744 ***−0.148 **0.271 ***0.188 ***
(0.186)(0.0620)(0.110)(0.0708)(0.0385)(0.0362)
lnAgg5000.00616−0.00464−0.00450−0.0182 **−0.00218−0.0140 ***
(0.0118)(0.00894)(0.00768)(0.00781)(0.00602)(0.00503)
Tran5000.09630.394 ***0.458 ***0.399 ***0.388 ***0.425 ***
(0.314)(0.111)(0.142)(0.111)(0.0986)(0.0897)
lnMetrodist−0.300 **−0.0563−0.0260−0.00183−0.111 ***0.0347
(0.145)(0.0386)(0.0413)(0.0399)(0.0402)(0.0273)
lnCBDdist9.765 **1.626 **0.002650.003274.357 ***−0.0145
(4.371)(0.730)(0.108)(0.114)(1.136)(0.0731)
CCA−1.057 ***−0.246 *−0.424 ***−0.00588−0.601 ***−0.270 ***
(0.392)(0.133)(0.119)(0.158)(0.115)(0.0692)
Indpark−0.388 ***−0.662 ***−0.428 ***−0.650 ***
(0.114)(0.105)(0.0915)(0.103)
dummy_district −0.344 ***−0.578 ***
(0.0756)(0.0741)
dummy_city −0.554 ***−0.828 ***
(0.0922)(0.129)
dummy_state −0.923 ***−0.148
(0.170)(0.0992)
Instrumental VariablesYesYesYesYesYesYes
Constant−320.7 **−56.35 **−14.04 ***−2.413−146.8 ***−7.416 ***
(142.0)(24.99)(4.821)(2.143)(37.80)(2.284)
AR0.00000.01590.00000.01450.00000.0000
Wald0.02400.01970.00360.01990.00010.0001
Observations393416763934167656105610
Standard errors in parentheses; *** p < 0.01, ** p < 0.05, * p < 0.1.
Table 7. The results of moderation effects of output on industrial land transformation.
Model (13)Model (14)Model (15)Model (16)
VARIABLESPROBITIVPROBITPROBITIVPROBIT
lnPrice20150.650 ***11.41 ***
(0.183)(3.085)
PriceGrow 0.549 **17.00 ***
(0.257)(4.982)
lnEfficiency−0.333 ***−0.234 ***−0.332 ***−0.436 ***
(0.0243)(0.0495)(0.0245)(0.0881)
lnArea−0.173 ***−0.238 ***−0.175 ***−0.239 ***
(0.0155)(0.0297)(0.0155)(0.0381)
lnYear0.221 ***0.332 ***0.212 ***0.113 **
(0.0290)(0.0471)(0.0289)(0.0551)
lnAgg500−0.0138 ***−0.00332−0.0143 ***−0.00771
(0.00411)(0.00664)(0.00409)(0.00706)
Tran5000.644 ***0.377 ***0.656 ***0.374 ***
(0.0559)(0.115)(0.0558)(0.120)
lnMetrodist−0.000753−0.05770.004350.0213
(0.0207)(0.0455)(0.0205)(0.0367)
lnCBDdist0.177 *4.407 ***−0.0975−0.117
(0.0982)(1.285)(0.0605)(0.108)
CCA−0.267 ***−0.570 ***−0.246 ***−0.420 ***
(0.0588)(0.129)(0.0580)(0.114)
Indpark−0.433 ***−0.555 ***−0.433 ***−0.549 ***
(0.0474)(0.0744)(0.0474)(0.0862)
Area × Efficiency−0.0525 **−0.136 ***−0.0588 ***−0.0114
(0.0215)(0.0442)(0.0217)(0.0582)
Price × Efficiency−0.0255−0.175−0.351−11.04 **
(0.131)(0.930)(0.317)(5.079)
Price × Area0.1090.536−0.0374−8.076
(0.0861)(0.664)(0.193)(5.016)
Price × Efficiency × Area0.0967−2.847 **−0.3802.490
(0.124)(1.117)(0.274)(3.303)
Instrumental VariablesNoYesNoYes
Constant−7.499 ***−155.4 ***1.326 **−8.384 ***
(2.631)(43.00)(0.633)(3.201)
AR-0.0000-0.0000
Wald-0.0001-0.0025
Observations5610561056105610
Robust standard errors in parentheses; *** p < 0.01, ** p < 0.05, * p < 0.1.
Publisher’s Note: MDPI stays neutral with regard to jurisdictional claims in published maps and institutional affiliations.

