
Estimating Land-Use Change Using Machine Learning: A Case Study on Five Central Coastal Provinces of Vietnam

 ,
, 
Abstract
:1. Introduction
2. Materials and Methods
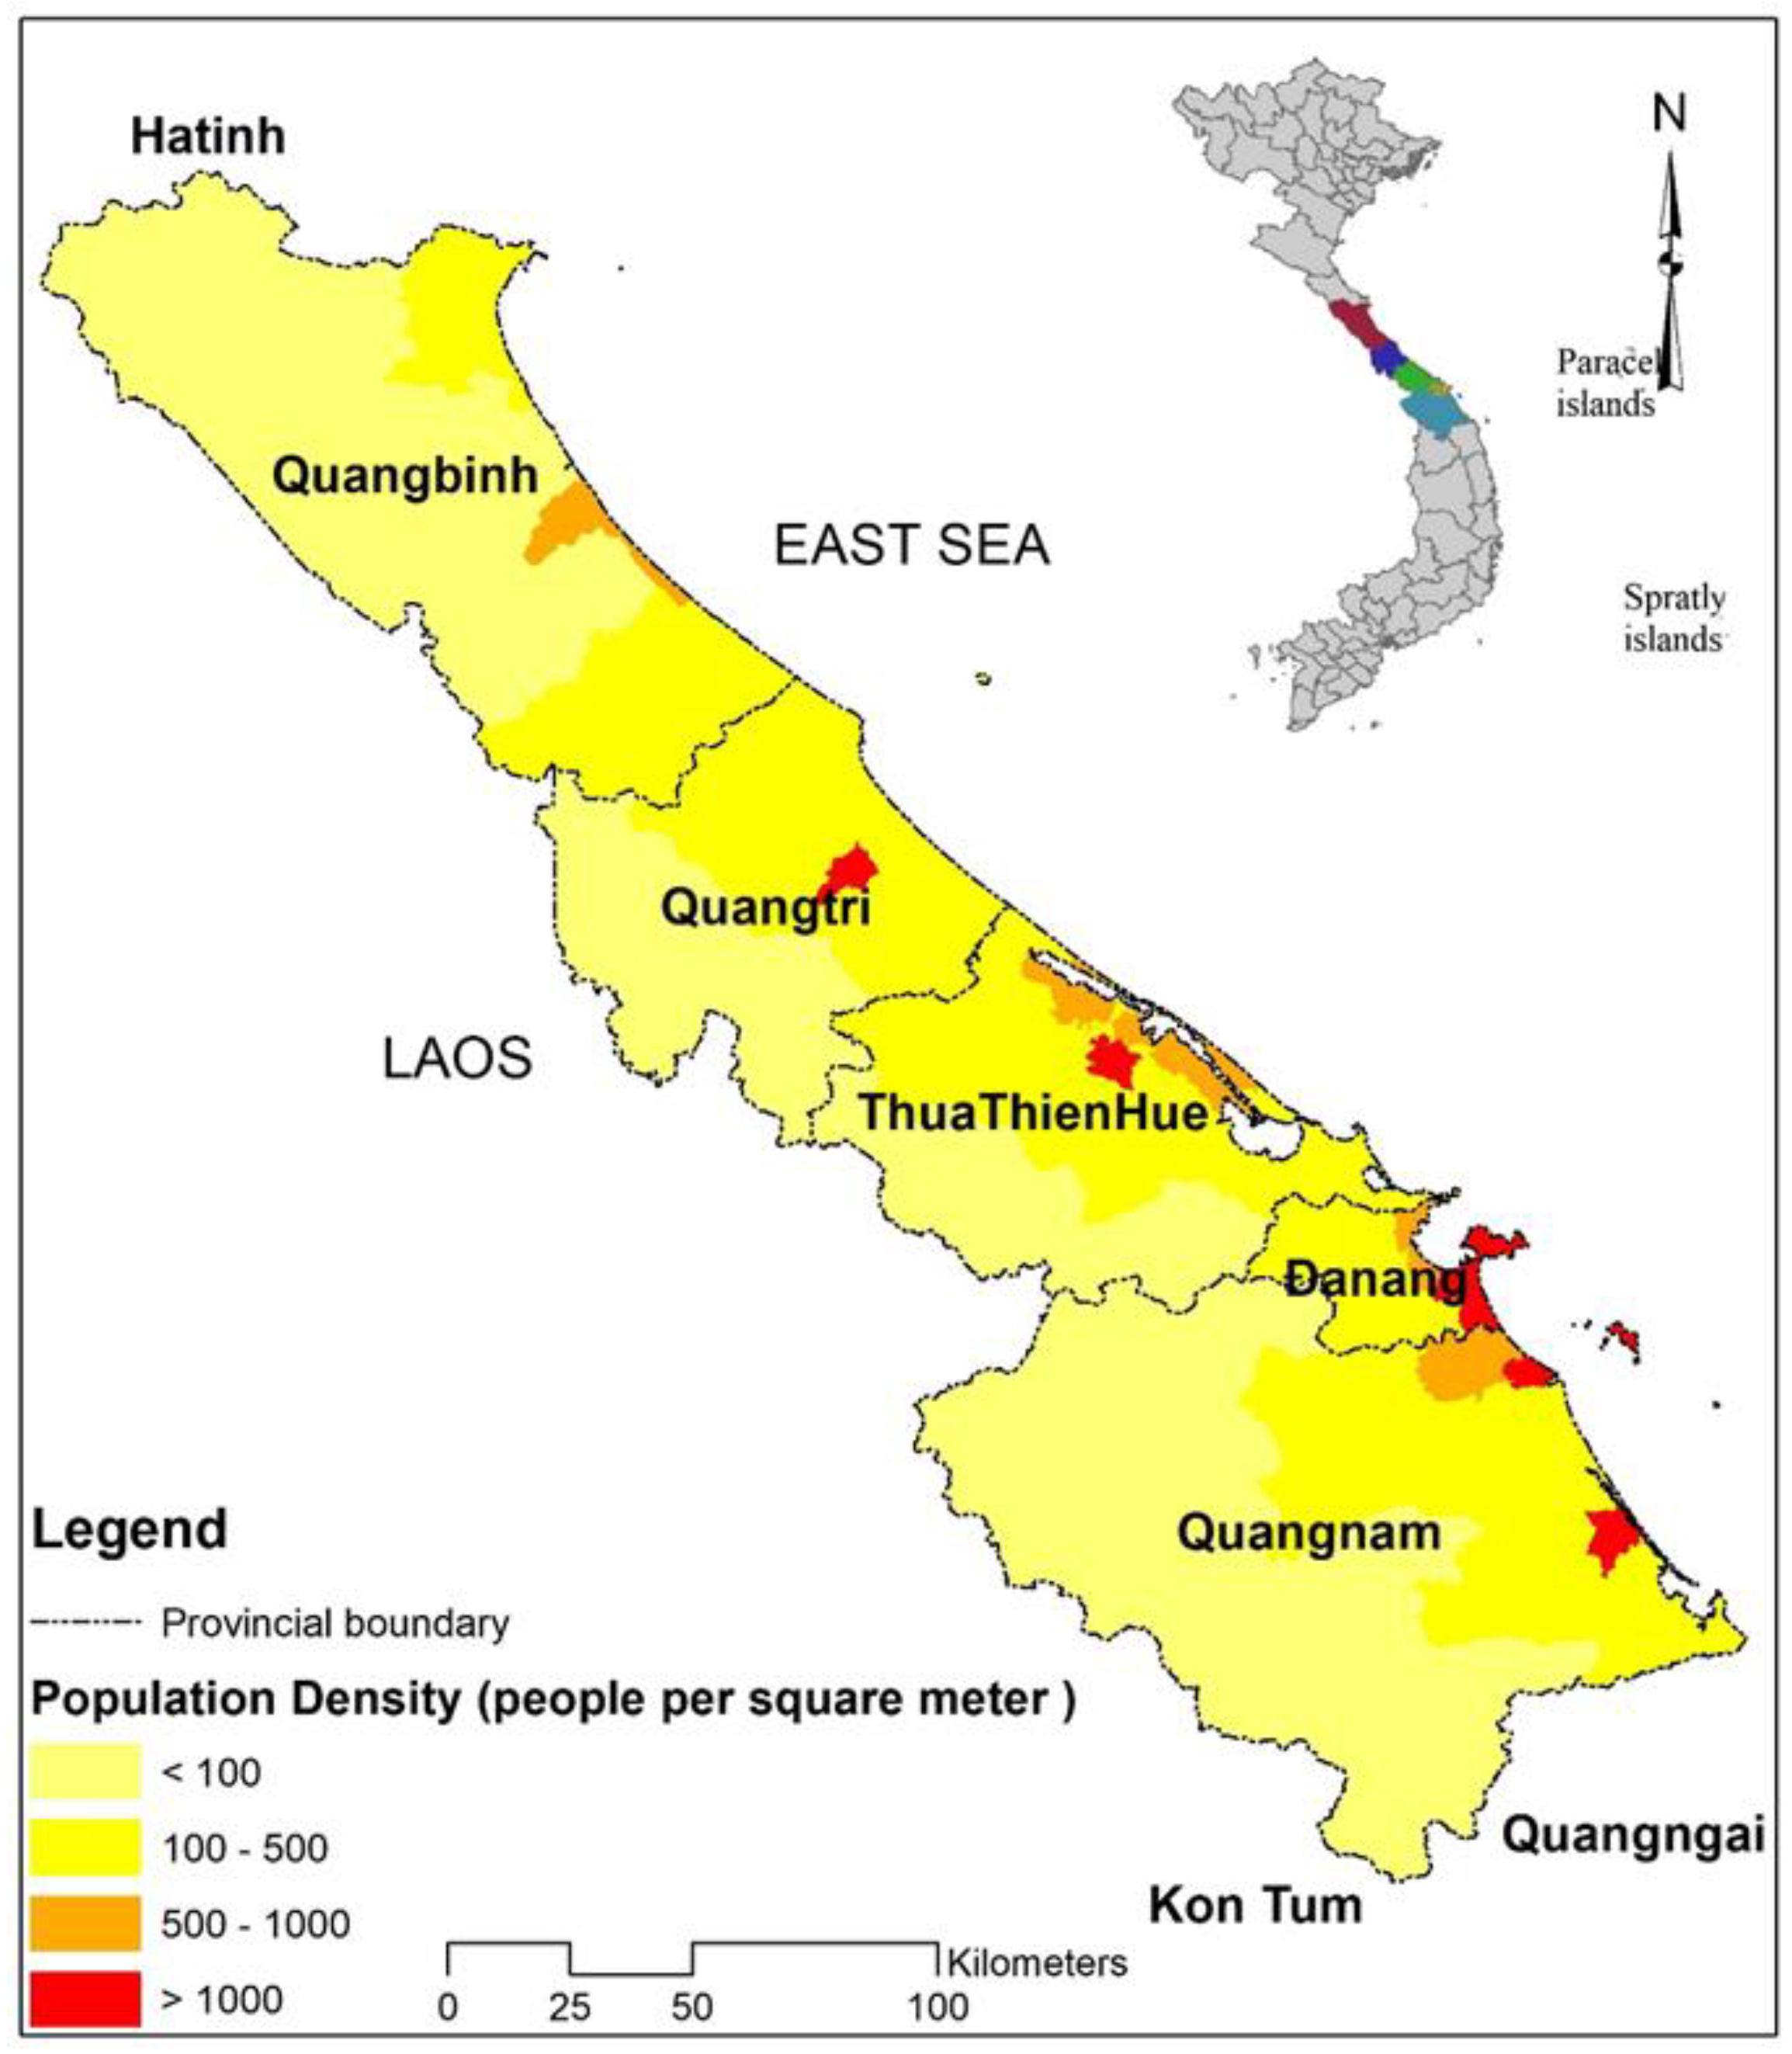
2.1. Study Area
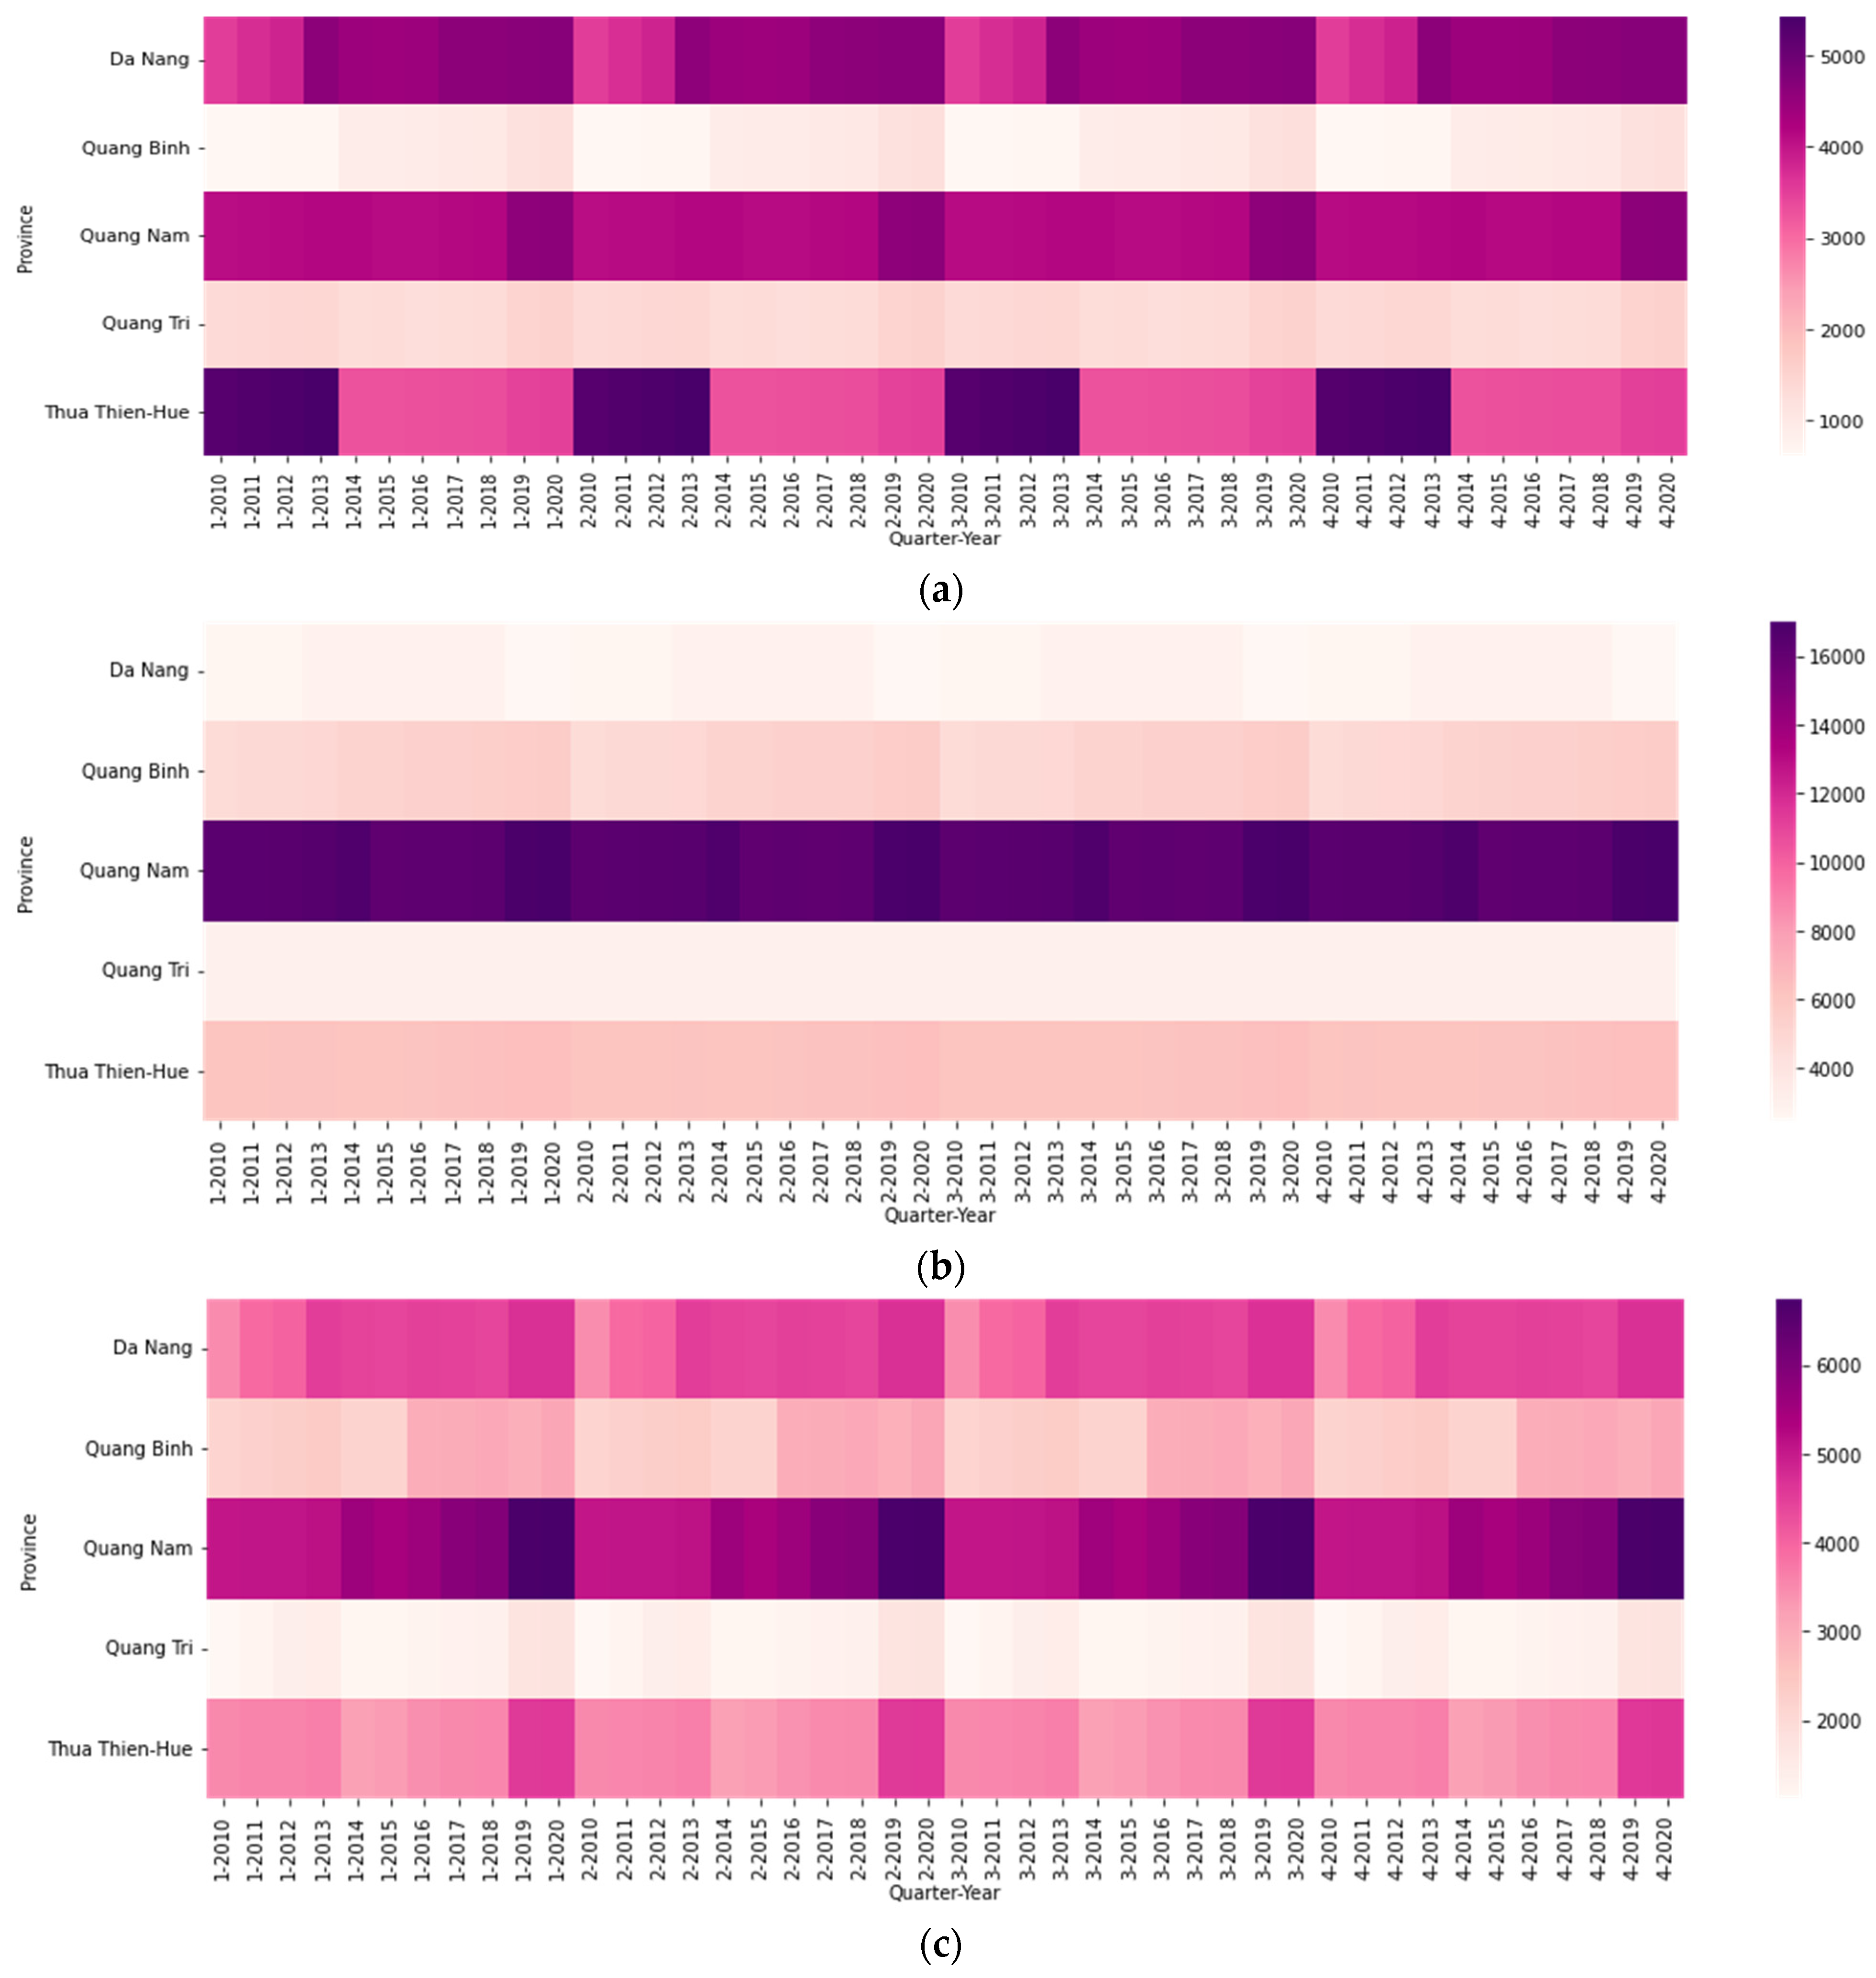
2.2. Database
2.3. Descriptions of Models
2.3.1. Multivariate Adaptive Regression Splines (MARS)
2.3.2. Lasso Linear Regression (LLR)
2.3.3. Random Forest Regression (RFR)
2.3.4. Performance Metrics
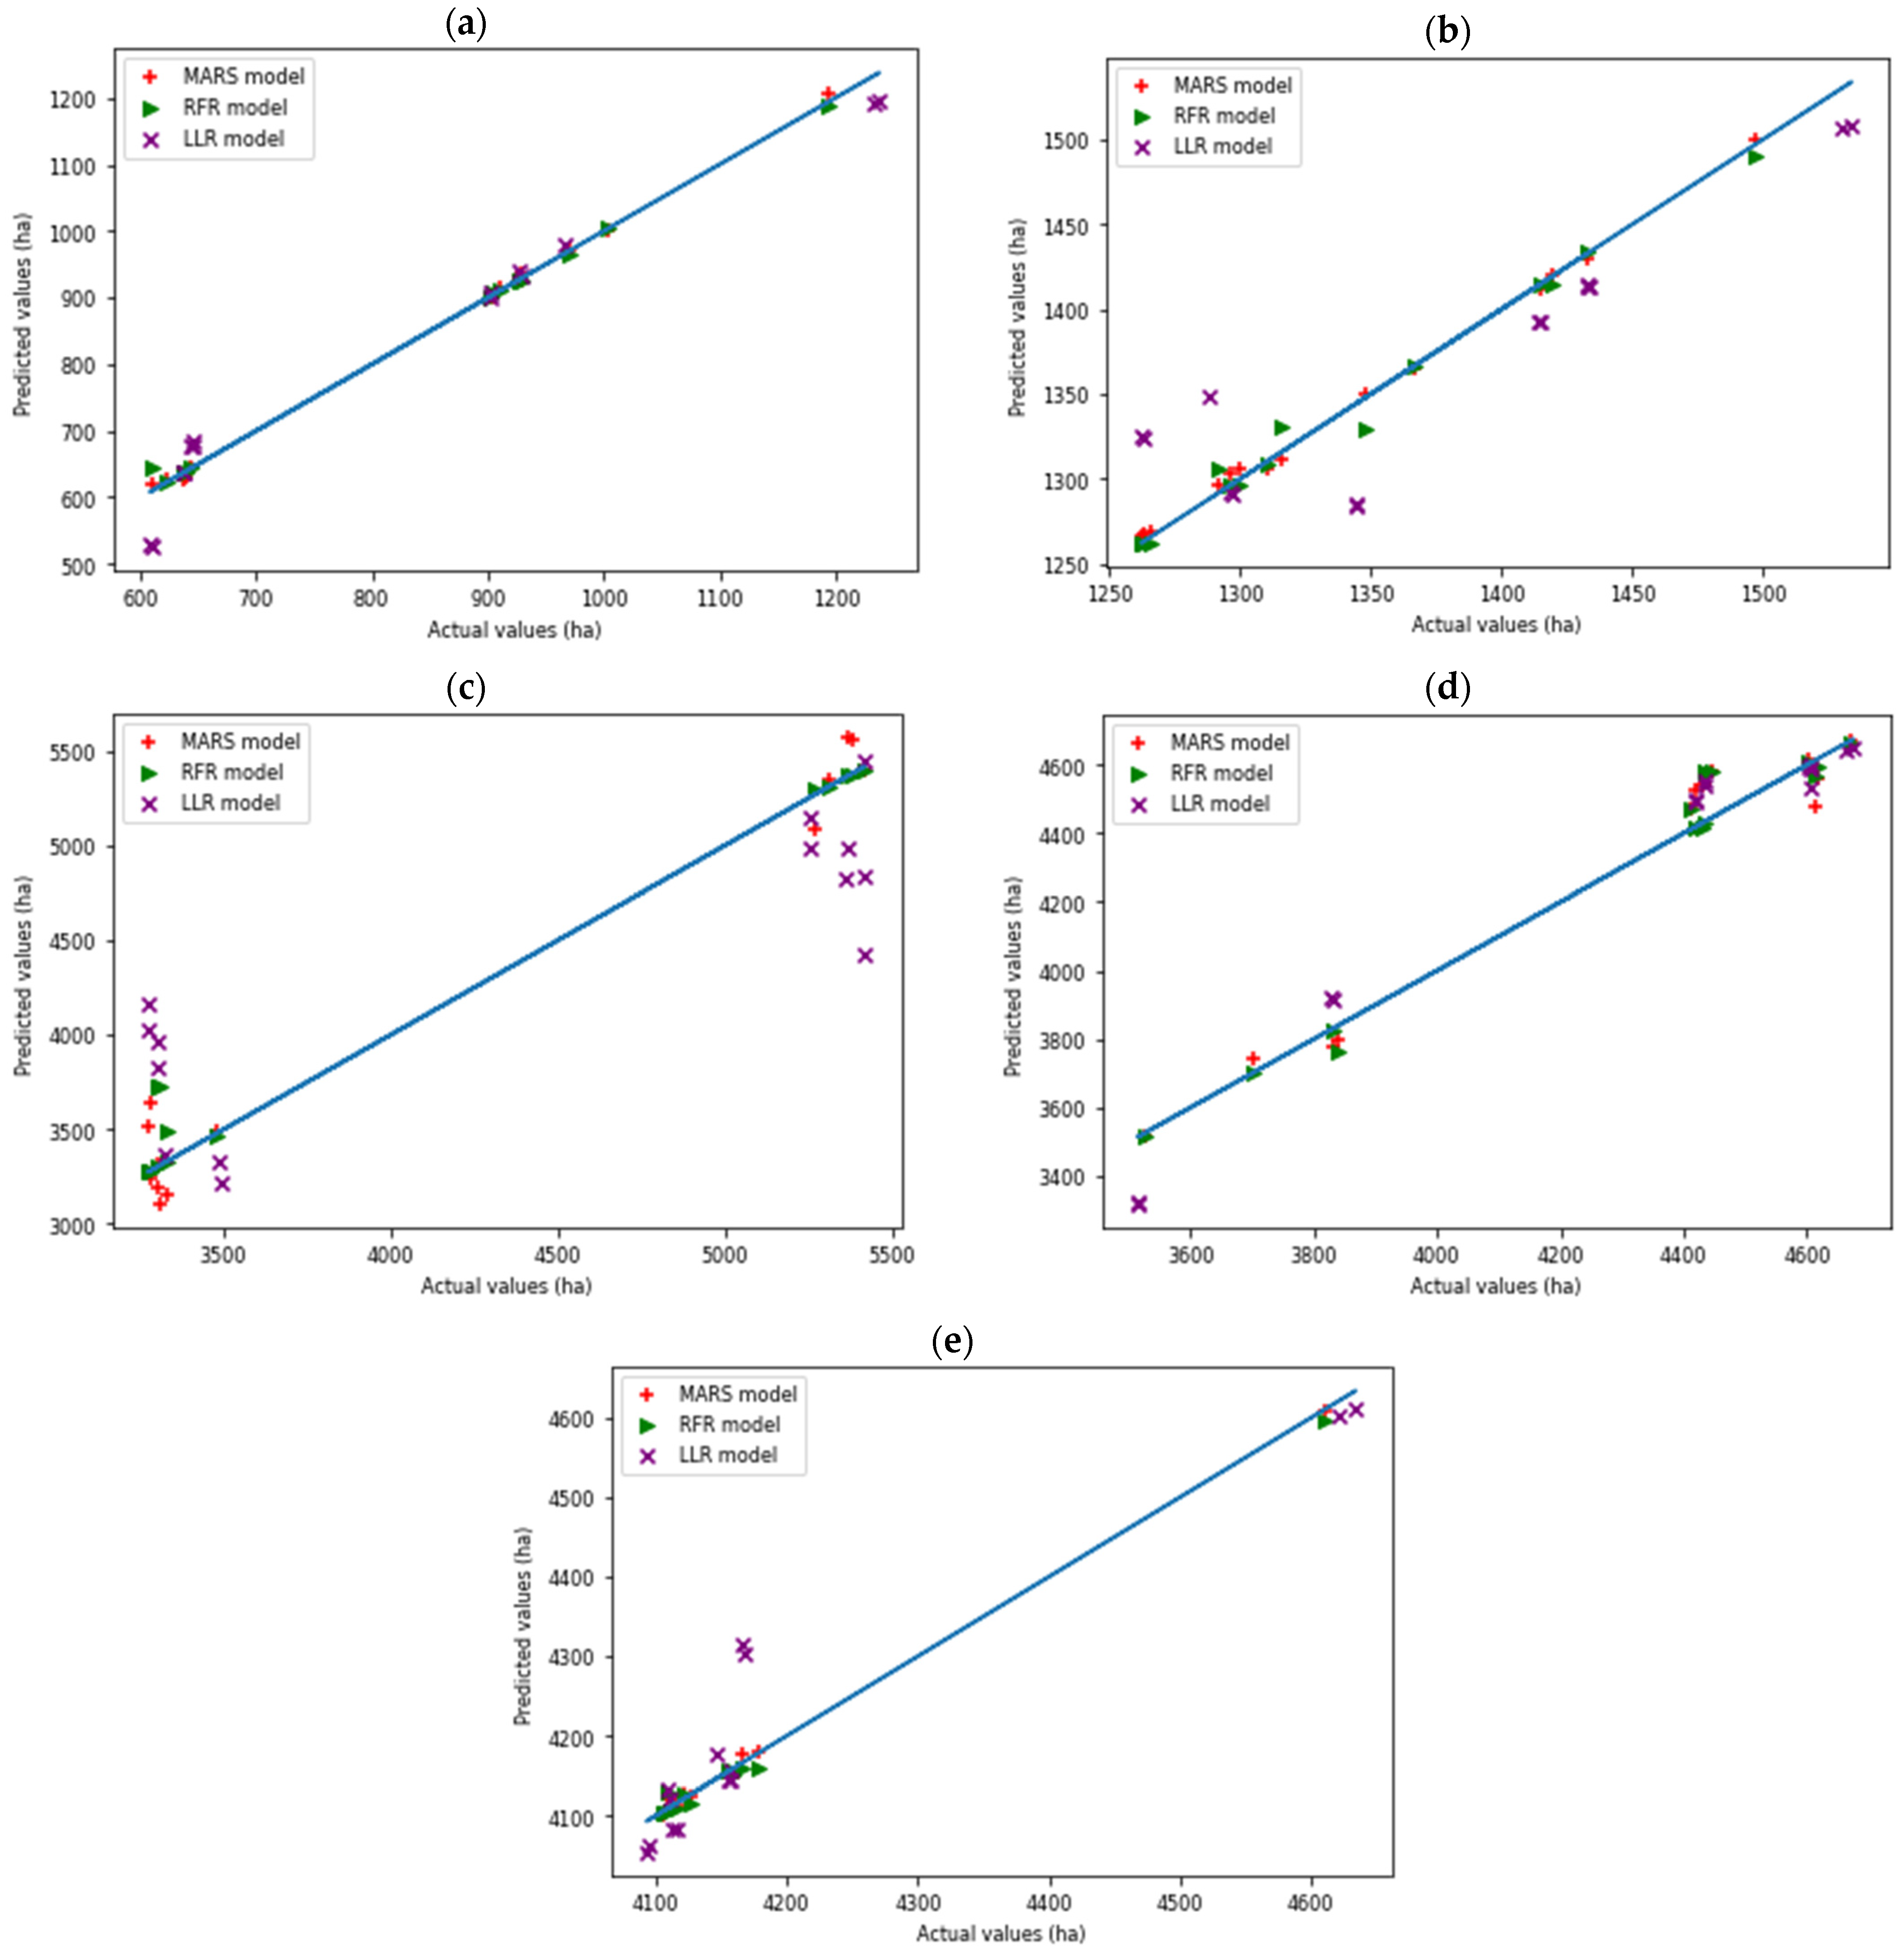
3. Results Analysis
4. Discussion
- Da Nang city, the most developed urban area in the region, has industrial parks equivalent to the urban land-use area. As a result, it is critical to relocate industrial zones in the ancient city, rationalize land use functions, employ high-tech equipment, and create a green environment. More importantly, to accommodate the influx of migrants from all over the country into the city’s working streets, local authorities must plan to build land funding and infrastructure in industrial zones or rural areas near industrial zones, lowering stress in Da Nang’s central city.
- The Quang Nam and Thua Thien Hue provinces, two provinces with many tangible cultural heritage sites such as Hue City, Hoi An Ancient Town, and My Son Holyland, need to build satellite urban areas to relieve the pressure on infrastructure and population for urban heritage areas. In addition, because the land fund for rural use is enormous, a strategy for converting agricultural land to industrial and commercial zones in rural areas is required to support rural growth and urban areas while also creating jobs for rural residents.
- Quang Binh and Quang Tri are two provinces with slower urban and industrial zone development than the Da Nang, Quang Nam, and Thua Thien-Hue provinces; however, plenty of rural land use and industrial land use funds are being used in these two provinces. As a result, these two provinces will need to construct satellite cities based on highly populated areas near industrial parks. In addition, it is necessary to form sub-regional centers in the district in the direction of commodity production with high technology.
5. Conclusions
Author Contributions
Funding
Institutional Review Board Statement
Informed Consent Statement
Data Availability Statement
Acknowledgments
Conflicts of Interest
Appendix A

| Criteria/Indicators | Type I | Type II | Type III | Type IV | Type V |
|---|---|---|---|---|---|
| Population | (a) >1 million: Central government-run city (b) 500,000: Provincial city | (c) 300,000 to 1 million: If class 2 is central government-run city, poulation should be more than 800,000 | (d) 100,000 to 350,000 | (e) 500,000 to 350,000 | (f) >4000 |
| Nonagricultural labor | 85% | 80% | 70% | 70% | >65% |
| Popolation density | (a) 12,000/km2 (b) 10,000/km2 | 8000 /km2 or 10,000 /km2 if the city is directly uncer central government control | 6000 km2 | 4000 km2 | 2000 km2 |
References
- Pijanowski, B.C.; Brown, D.; Shellito, B.A.; Manik, G.A. Using neural networks and GIS to forecast land use changes: A Land Transformation Model. Comput. Environ. Urban Syst. 2002, 26, 553–575. [Google Scholar] [CrossRef]
- Sang, L.; Zhang, C.; Yang, J.; Zhu, D.; Yun, W. Simulation of land use spatial pattern of towns and villages based on CA–Markov model. Math. Comput. Model. 2011, 54, 938–943. [Google Scholar] [CrossRef]
- Wang, S.W.; Gebru, B.M.; Lamchin, M.; Kayastha, R.B.; Lee, W.-K. Land Use and Land Cover Change Detection and Prediction in the Kathmandu District of Nepal Using Remote Sensing and GIS. Sustainability 2020, 12, 3925. [Google Scholar] [CrossRef]
- Liping, C.; Yujun, S.; Saeed, S. Monitoring and predicting land use and land cover changes using remote sensing and GIS techniques—A case study of a hilly area, Jiangle, China. PLoS ONE 2018, 13, e0200493. [Google Scholar] [CrossRef]
- Saputra, M.H.; Lee, H.S. Prediction of Land Use and Land Cover Changes for North Sumatra, Indonesia, Using an Artificial-Neural-Network-Based Cellular Automaton. Sustainability 2019, 11, 3024. [Google Scholar] [CrossRef] [Green Version]
- Veldkamp, A.; Lambin, E.F. Predicting land-use change. Agric. Ecosyst. Environ. 2001, 85, 1–6. [Google Scholar] [CrossRef]
- Viney, N.R.; Bormann, H.; Breuer, L.; Bronstert, A.; Croke, B.; Frede, H.; Gräff, T.; Hubrechts, L.; Huisman, J.A.; Jakeman, A.; et al. Assessing the impact of land use change on hydrology by ensemble modelling (LUCHEM) II: Ensemble combinations and predictions. Adv. Water Resour. 2009, 32, 147–158. [Google Scholar] [CrossRef]
- Su, L.; Zhu, J.H.; Wang, W.; Liu, M. Application of ARMA Model in Prediction of Land Use Demand Take Farmland in Jin-Hu Coastal Area as Example. Hunan Agric. Sci. 2012, 5, 61–63. [Google Scholar]
- Zhang, P.; Ke, Y.; Zhang, Z.; Wang, M.; Li, P.; Zhang, S. Urban Land Use and Land Cover Classification Using Novel Deep Learning Models Based on High Spatial Resolution Satellite Imagery. Sensors 2018, 18, 3717. [Google Scholar] [CrossRef] [Green Version]
- Luus, F.P.S.; Salmon, B.P.; Bergh, F.V.D.; Maharaj, B.T. Multiview Deep Learning for Land-Use Classification. IEEE Geosci. Remote Sens. Lett. 2015, 12, 2448–2452. [Google Scholar] [CrossRef] [Green Version]
- Mu, L.; Wang, L.; Wang, Y.; Chen, X.; Han, W. Urban Land Use and Land Cover Change Prediction via Self-Adaptive Cellular Based Deep Learning With Multisourced Data. IEEE J. Sel. Top. Appl. Earth Obs. Remote Sens. 2019, 12, 5233–5247. [Google Scholar] [CrossRef]
- Azad, A.; Wang, X. Land Use Change Ontology and Traffic Prediction through Recurrent Neural Networks: A Case Study in Calgary, Canada. ISPRS Int. J. Geo-Inf. 2021, 10, 358. [Google Scholar] [CrossRef]
- Kumar, S.; Radhakrishnan, N.; Mathew, S. Land use change modelling using a Markov model and remote sensing. Geomat. Nat. Hazards Risk 2013, 5, 145–156. [Google Scholar] [CrossRef]
- Lu, Y.; Wu, P.; Ma, X.; Li, X. Detection and prediction of land use/land cover change using spatiotemporal data fusion and the Cellular Automata–Markov model. Environ. Monit. Assess. 2019, 191, 68. [Google Scholar] [CrossRef] [PubMed]
- Lu, C.-J.; Lee, T.-S.; Lian, C.-M. Sales forecasting for computer wholesalers: A comparison of multivariate adaptive regression splines and artificial neural networks. Decis. Support Syst. 2012, 54, 584–596. [Google Scholar] [CrossRef]
- Genuer, R.; Poggi, J.-M.; Tuleau-Malot, C.; Villa-Vialaneix, N. Random Forests for Big Data. Big Data Res. 2017, 9, 28–46. [Google Scholar] [CrossRef]
- Antoniadis, A.; Lambert-Lacroix, S.; Poggi, J.-M. Random forests for global sensitivity analysis: A selective review. Reliab. Eng. Syst. Saf. 2020, 206, 107312. [Google Scholar] [CrossRef]
- Van de Geer, S.A. High-dimensional generalized linear models and the Lasso. Ann. Stat. 2008, 36, 614–645. [Google Scholar] [CrossRef]
- Wang, H.; Leng, C. Unified LASSO Estimation by Least Squares Approximation. J. Am. Stat. Assoc. 2007, 102, 1039–1048. [Google Scholar] [CrossRef]
- Dyar, M.; Carmosino, M.; Breves, E.; Ozanne, M.; Clegg, S.; Wiens, R. Comparison of partial least squares and lasso regression techniques as applied to laser-induced breakdown spectroscopy of geological samples. Spectrochim. Acta Part B At. Spectrosc. 2012, 70, 51–67. [Google Scholar] [CrossRef]
- Yilmaz, B.; Aras, E.; Nacar, S.; Kankal, M. Estimating suspended sediment load with multivariate adaptive regression spline, teaching-learning based optimization, and artificial bee colony models. Sci. Total Environ. 2018, 639, 826–840. [Google Scholar] [CrossRef] [PubMed]
- Bui, D.T.; Hoang, N.D.; Samui, P. Spatial pattern analysis and prediction of forest fire using new machine learning approach of Multivariate Adaptive Regression Splines and Differential Flower Pollination optimization: A case study at Lao Cai province (MARS). J. Environ. Manag. 2019, 237, 476–487. [Google Scholar]
- Nguyen, H.T.T.; Doan, T.M.; Radeloff, V. Applying random forest classification to map land use/land cover using landsat 8 oli. ISPRS Int. Arch. Photogramm. Remote Sens. Spat. Inf. Sci. 2018, 42, W4. [Google Scholar] [CrossRef] [Green Version]
- Ha, T.V.; Tuohy, M.; Irwin, M.; Tuan, P.V. Monitoring and mapping rural urbanization and land use changes using Landsat data in the northeast subtropical region of Vietnam. Egypt. J. Remote Sens. Space Sci. 2018, 23, 11–19. [Google Scholar] [CrossRef]
- Dennedy-Frank, P.J.; Gorelick, S.M. Insights from watershed simulations around the world: Watershed service-based restoration does not significantly enhance streamflow. Glob. Environ. Chang. 2019, 58, 101938. [Google Scholar] [CrossRef]
- Trinh-Tuan, L.; Matsumoto, J.; Ngo-Duc, T.; Nodzu, M.I.; Inoue, T. Evaluation of satellite precipitation products over Central Vietnam. Prog. Earth Planet. Sci. 2019, 6, 54. [Google Scholar] [CrossRef] [Green Version]
- Luu, C.; Von Meding, J.; Kanjanabootra, S.; Pham, D. A proposed flood risk assessment method for Central Vietnam. In Proceedings of the 5th International Conference on Building Resilience, Newcastle, NSW, Australia, 15–17 July 2015; pp. 336-1–336-11. [Google Scholar]
- Van Khanh, N. Identify and Assess the Impact of Climate Change and Sea Level Rise to the System of Landfills and Solid Waste Treatment Facilities in the Central Coast Region of Vietnam. In Waste Management and Resource Efficiency; Springer: Singapore, 2018; pp. 195–208. [Google Scholar] [CrossRef]
- Location and Natural Conditions. Available online: https://www.danang.gov.vn/web/en/detail?id=26029&_c=16407111 (accessed on 24 February 2022).
- Overview of Quang Binh Province. Available online: https://www.quangbinh.gov.vn/3cms/gioi-thieu-chung-14532.htm (accessed on 24 February 2022).
- Quang Nam Portal. Available online: https://quangnam.gov.vn/webcenter/portal/ubnd_en (accessed on 24 February 2022).
- Overview of Quang Tri Province. Available online: https://www.quangtri.gov.vn/xem-chi-tiet-gioi-thieu-tong-quan/-/view-article/1/3500113539863336577/1573630224087QuangTri (accessed on 24 February 2022).
- Population of Thua Thien Hue Province. Available online: https://thuathienhue.gov.vn/en-us/Home/Detail/tid/Population/newsid/65F39533-85E0-4C1B-BC34-A8B600A82A8E/cid/AEBA5AE7-F4B9-4D9B-A507-DE8802BF1D14TTH (accessed on 24 February 2022).
- Olyaie, E.; Abyaneh, H.Z.; Mehr, A.D. A comparative analysis among computational intelligence techniques for dissolved oxygen prediction in Delaware River. Geosci. Front. 2017, 8, 517–527. [Google Scholar] [CrossRef] [Green Version]
- Friedman, J.H. Multivariate adaptive regression splines. Ann. Stat. 1991, 19, 1–67. [Google Scholar] [CrossRef]
- Sekulic, S.; Kowalski, B.R. MARS: A tutorial. J. Chemom. 1992, 6, 199–216. [Google Scholar] [CrossRef]
- Steinberg, D. An alternative to neural nets: Multivariate adaptive regression splines (MRAS). PC AI 2001, 15, 38–41. [Google Scholar]
- Fan, J.; Wu, L.; Ma, X.; Zhou, H.; Zhang, F. Hybrid support vector machines with heuristic algorithms for prediction of daily diffuse solar radiation in air-polluted regions. Renew. Energy 2020, 145, 2034–2045. [Google Scholar] [CrossRef]
- LeBlanc, M.; Tibshirani, R. Adaptive principal surfaces. J. Am. Stat. Assoc. 1994, 89, 53–64. [Google Scholar] [CrossRef]
- Sharda, V.N.; Prasher, S.O.; Patel, R.M.; Ojasvi, P.R.; Prakash, C. Performance of Multivariate Adaptive Regression Splines (MARS) in predicting runoff in mid-Himalayan micro-watersheds with limited data/Performances de régressions par splines multiples et adaptives (MARS) pour la prévision d’écoulement au sein de micro-bassins versants Himalayens d’altitudes intermédiaires avec peu de données. Hydrol. Sci. J. 2008, 53, 1165–1175. [Google Scholar]
- Craven, P.; Wahba, G. Smoothing noisy data with spline functions. Numer. Math. 1978, 31, 377–403. [Google Scholar] [CrossRef]
- Mohsen, S. Computational Estimation of Biliary Excretion of Compounds and the Role of Transporters. Ph.D. Thesis, University of Kent, Canterbury, UK, 2014. [Google Scholar]
- Aydin, D.; Yilmaz, E. Modified Spline Regression based on Randomly Right-Censored Data: A Comparative Study. Commun. Stat. Simul. Comput. 2017, 47, 2587–2611. [Google Scholar] [CrossRef]
- Friedman, J.H.; Hastie, T.; Tibshirani, R. Regularization Paths for Generalized Linear Models via Coordinate Descent. J. Stat. Softw. 2010, 33, 1–22. [Google Scholar] [CrossRef] [Green Version]
- Tibshirani, R. Regression shrinkage and selection via the Lasso. J. R. Stat. Soc. Ser. B (Methodol.) 1996, 58, 267–288. [Google Scholar] [CrossRef]
- Chouzenoux, E.; Pesquet, J.-C. A Stochastic Majorize-Minimize Subspace Algorithm for Online Penalized Least Squares Estimation. IEEE Trans. Signal Process. 2017, 65, 4770–4783. [Google Scholar] [CrossRef] [Green Version]
- Breiman, L. Random forests. Mach. Learn. 2001, 45, 5–32. [Google Scholar] [CrossRef] [Green Version]
- Guo, L.; Chehata, N.; Mallet, C.; Boukir, S. Relevance of airborne lidar and multispectral image data for urban scene classification using Random Forests. ISPRS J. Photogramm. Remote Sens. 2011, 66, 56–66. [Google Scholar] [CrossRef]
- Rodriguez-Galiano, V.F.; Ghimire, B.; Rogan, J.; Chica-Olmo, M.; Rigol-Sanchez, J.P. An assessment of the effectiveness of a random forest classifier for land-cover classification. ISPRS J. Photogramm. Remote Sens. 2012, 67, 93–104. [Google Scholar] [CrossRef]
- Rodriguez-Galiano, V.; Sanchez-Castillo, M.; Chica-Olmo, M.; Chica-Rivas, M.J.O.G.R. Machine learning predictive models for mineral prospectivity: An evaluation of neural networks, random forest, regression trees and support vector machines. Ore Geol. Rev. 2015, 71, 804–818. [Google Scholar] [CrossRef]
- Seni, G.; Elder, J.F. Ensemble Methods in Data Mining: Improving Accuracy Through Combining Predictions. Synth. Lect. Data Min. Knowl. Discov. 2010, 2, 1–126. [Google Scholar] [CrossRef]
- Kardani, N.; Zhou, A.; Nazem, M.; Shen, S.-L. Estimation of Bearing Capacity of Piles in Cohesionless Soil Using Optimised Machine Learning Approaches. Geotech. Geol. Eng. 2019, 38, 2271–2291. [Google Scholar] [CrossRef]
- Touzani, S.; Granderson, J.; Fernandes, S. Gradient boosting machine for modeling the energy consumption of commercial buildings. Energy Build. 2018, 158, 1533–1543. [Google Scholar] [CrossRef] [Green Version]
- Yang, J.-H.; Yang, M.-S. A control chart pattern recognition system using a statistical correlation coefficient method. Comput. Ind. Eng. 2005, 48, 205–221. [Google Scholar] [CrossRef]
- Çevik, A.; Weber, G.-W.; Eyüboglu, B.M.; Oğuz, K.K. Voxel-MARS: A method for early detection of Alzheimer’s disease by classification of structural brain MRI. Ann. Oper. Res. 2017, 258, 31–57. [Google Scholar] [CrossRef]
- Taylor, K.E. Summarizing multiple aspects of model performance in a single diagram. J. Geophys. Res. Atmos. 2001, 106, 7183–7192. [Google Scholar] [CrossRef]
- Ghorbani, M.A.; Deo, R.C.; Yaseen, Z.M.; Kashani, M.H.; Mohammadi, B. Pan evaporation prediction using a hybrid multilayer perceptron-firefly algorithm (MLP-FFA) model: Case study in North Iran. Arch. Meteorol. Geophys. Bioclimatol. Ser. B 2017, 133, 1119–1131. [Google Scholar] [CrossRef]
- Jamali, A. Evaluation and comparison of eight machine learning models in land use/land cover mapping using Landsat 8 OLI: A case study of the northern region of Iran. SN Appl. Sci. 2019, 1, 1448. [Google Scholar] [CrossRef] [Green Version]
- Adab, H.; Morbidelli, R.; Saltalippi, C.; Moradian, M.; Ghalhari, G.A.F. Machine Learning to Estimate Surface Soil Moisture from Remote Sensing Data. Water 2020, 12, 3223. [Google Scholar] [CrossRef]
- Duong, P.C.; Trung, T.H.; Nasahara, K.N.; Tadono, T. JAXA High-Resolution Land Use/Land Cover Map for Central Vietnam in 2007 and 2017. Remote Sens. 2018, 10, 1406. [Google Scholar] [CrossRef] [Green Version]


| Province | Rural Land-Use (ha) | Industrial Land-Use (ha) | Urban Land-Use (ha) | Sub-Total |
|---|---|---|---|---|
| Quang Binh | 5632 | 3103 | 1238 | 9973 |
| Quang Tri | 3067 | 1740 | 1534 | 6341 |
| Thua Thien-Hue | 6420 | 4596 | 3494 | 14,510 |
| Da Nang | 2464 | 4694 | 4676 | 11,834 |
| Quang Nam | 17,024 | 6751 | 4634 | 28,409 |
| Total | 34,607 | 20,884 | 15,576 | 71,067 |
| Province | St Dev (ha) | Mean (ha) | Min (ha) | Max (ha) | Skewness | Kurtosis |
|---|---|---|---|---|---|---|
| Quang Binh | 214 | 878 | 608 | 1238 | 0.17 | −1.17 |
| Quang Tri | 84 | 1369 | 1262 | 1534 | 0.64 | −0.86 |
| Thua Thien-Hue | 959 | 4076 | 3272 | 5434 | 0.58 | −1.72 |
| Da Nang | 403 | 4317 | 3514 | 4676 | 1.03 | −0.67 |
| Quang Nam | 183 | 4219 | 4093 | 4634 | 0.87 | 1.65 |
| Quang Binh | Quang Tri | Thua Thien-Hue | Da Nang | Quang Nam | Average | |||||||||||||
|---|---|---|---|---|---|---|---|---|---|---|---|---|---|---|---|---|---|---|
| LLR | RFR | MARS | LLR | RFR | MARS | LLR | RFR | MARS | LLR | RFR | MARS | LLR | RFR | MARS | LLR | RFR | MARS | |
| MSE | 143 | 10 | 5 | 107 | 10 | 4 | 535 | 151 | 162 | 98 | 58 | 84 | 58 | 10 | 8 | 188.2 | 47.8 | 52.6 |
| MAE | 27 | 4 | 5 | 33 | 6 | 6 | 442 | 70 | 162 | 78 | 79 | 75 | 39 | 8 | 6 | 123.8 | 33.4 | 50.8 |
| RMSE | 38 | 11 | 6 | 39 | 9 | 9 | 535 | 150 | 131 | 98 | 98 | 84 | 59 | 10 | 8 | 153.8 | 55.6 | 47.6 |
| R | 0.91 | 0.91 | 0.91 | 0.82 | 0.91 | 0.91 | 0.67 | 0.92 | 0.91 | 0.89 | 0.87 | 0.89 | 0.86 | 0.91 | 0.92 | 0.83 | 0.904 | 0.908 |
| R2 | 0.92 | 0.94 | 0.94 | 0.66 | 0.93 | 0.94 | 0.56 | 0.92 | 0.92 | 0.9 | 0.9 | 0.91 | 0.84 | 0.94 | 0.94 | 0.776 | 0.926 | 0.93 |
| GCV | 88 | 193 | 66,746 | 7522 | 77 | |||||||||||||
Publisher’s Note: MDPI stays neutral with regard to jurisdictional claims in published maps and institutional affiliations. |
© 2022 by the authors. Licensee MDPI, Basel, Switzerland. This article is an open access article distributed under the terms and conditions of the Creative Commons Attribution (CC BY) license (https://creativecommons.org/licenses/by/4.0/).
Share and Cite
Giang, N.H.; Wang, Y.-R.; Hieu, T.D.; Ngu, N.H.; Dang, T.-T. Estimating Land-Use Change Using Machine Learning: A Case Study on Five Central Coastal Provinces of Vietnam. Sustainability 2022, 14, 5194. https://doi.org/10.3390/su14095194
Giang NH, Wang Y-R, Hieu TD, Ngu NH, Dang T-T. Estimating Land-Use Change Using Machine Learning: A Case Study on Five Central Coastal Provinces of Vietnam. Sustainability. 2022; 14(9):5194. https://doi.org/10.3390/su14095194
Chicago/Turabian StyleGiang, Nguyen Hong, Yu-Ren Wang, Tran Dinh Hieu, Nguyen Huu Ngu, and Thanh-Tuan Dang. 2022. "Estimating Land-Use Change Using Machine Learning: A Case Study on Five Central Coastal Provinces of Vietnam" Sustainability 14, no. 9: 5194. https://doi.org/10.3390/su14095194