Article

Loss of Coastal Wetlands in Lake Burullus, Egypt: A GIS and Remote-Sensing Study

1
Botany Department, College of Science, Tanta University, Tanta 31512, Egypt
2
Department of Environmental Science and Technology, University of Maryland, Animal Science Building 142, College Park, MD 20742, USA
3
Biology Department, College of Science, King Khalid University, Abha 61321, Saudi Arabia
4
Botany Department, Faculty of Science, Kafrelsheikh University, Kafr El-Sheikh 33516, Egypt
*
Author to whom correspondence should be addressed.
Sustainability 2022, 14(9), 4980; https://doi.org/10.3390/su14094980
Submission received: 5 March 2022 / Revised: 8 April 2022 / Accepted: 12 April 2022 / Published: 21 April 2022
(This article belongs to the Special Issue Frontiers in Wetland Ecology and Environmental Sustainability)

Abstract

:
Lake Burullus is the second largest lake at the northern edge of the Nile Delta, Egypt, and has been recognized as an internationally significant wetland that provides a habitat for migrating birds, fish, herpetofauna, and mammals. However, the lake is experiencing severe human impacts including drainage and conversion to agricultural lands and fish farms. The primary goal of this study was to use multispectral, moderate-spatial-resolution (30 m2) Landsat satellite imagery to assess marsh loss in Lake Burullus, Egypt, in the last 35 years (1985–2020). Iterative Self-Organizing Data Analyses (ISODATA) unsupervised techniques were applied to the Landsat 5 Thematic Mapper (TM) and Landsat 8 Operational Land Imager–Thermal Infrared Sensor (OLI–TIRS) satellite images for classification of the Lake Burullus area into four main land-use classes: water, marsh, unvegetated land surfaces (roads, paths, sand sheets and dunes), and agricultural lands and fish farms. The overall classification accuracy was estimated to be 96% and the Kappa index was 0.95. Our results indicated that there is a substantial loss (44.8% loss) in the marsh aerial coverage between 1985 and 2020. The drainage and conversion of wetlands into agricultural lands and/or fish farms is concentrated primarily in the western and southern part of the lake where the surface area of the agricultural lands and/or fish farms doubled (103.2% increase) between 2000 and 2020. We recommend that land-use-policy makers and environmental government agencies raise public awareness among the local communities of Lake Burullus of the economic and environmental consequences of the alarming loss of marshland, which will likely have adverse effects on water quality and cause a reduction in the invaluable wetland-ecosystem services.

Graphical Abstract

1. Introduction

Lake Burullus, a UNESCO-protected area located at the north edge of the Nile Delta (Figure 1), Egypt, is a major source of fish production in northern Egypt [1,2]. Several research studies have reported a large expansion of fish farms/ponds [3,4,5], especially in the eastern and southern parts of the lake and adjacent agricultural lands [6,7]. This expansion is the result of a surging demand for agricultural products and protein as a response to population growth in Egypt in the last few decades [8,9,10,11]. Commercial fishing is one of the major economic activities in the lake, producing 52,000 fish tons year−1 [12]. Because wetland soils are nutrient rich, draining and converting them into agricultural land has been the practice for decades, undermining the invaluable ecosystem services provided by the wetlands [13]. Wetlands are recognized as one of the most threatened and declining ecosystems on regional and global scales [14,15]. The wetlands of Lake Burullus provide a wide variety of ecosystem services to local communities from which they earn their living, including fisheries, reed cutting, grazing, bird hunting, collecting medicinal plants, and salt extraction. Because of the importance of the ecosystem services provided by wetlands, the coastal marshes of Lake Burullus must be protected from additional environmental degradation.
Sea-level rise also threatens coastal wetlands. According to the Intergovernmental Panel on Climate Change (IPCC), the eustatic rate of sea-level rise is accelerating: 1.7 mm year−1 from 1901 to 2010 and 3.2 mm year−1 from 1993 to 2010 [16,17]; both thermal expansion of the ocean and glacier melting remain the major factors contributing to the global sea-level rise. With a temperature rise of 4 °C or more, annual sea-level rise is estimated to be between 0.5 and 2 m by 2100 [18]. Coastal wetlands are among the most vulnerable habitats that are lost to sea-level rise. Marsh surface flooding and saltwater intrusion are the major consequences of a continuously rising sea [19,20], in addition to other impacts such as the submergence of lands, higher erosion rates [18], and an increase in stratification [21]. Coastal marshes, which are coastal wetland habitats dominated by herbaceous vegetation, should have vertical-accretion rates that are equal to or exceed the sea-level-rise rates [22,23] to avoid their loss and/or transition to a different ecosystem [19,24]. In Egypt, sea levels continue to rise, and the Egyptian Ministry of Water Resources reported higher rates of sea-level rise of 3.2 mm year−1 since 2012 compared to 1.3 mm year−1 in 1993.
Egyptian wetlands, in general, and the coastal wetlands in the north of Egypt, in particular, are the subject of numerous ecological, biological, and geological studies, including remote-sensing and geospatial studies [25,26,27,28,29,30,31]; however, the assessment of coastal marsh loss and its effects on wetland-ecosystem services have received less attention to date. The goals of this study were to use cost-free, moderate-spatial-resolution (30 m2), and multispectral satellite images (Landsat 5 Thematic Mapper (TM) images from 1985 and 2000; Landsat 8 Operational Land Imager-Thermal Infrared Sensor (OLI–TIRS) images from 2013 and 2020) for: (1) coastal-marsh-loss assessment at a regional scale (Lake Burullus), which could be used as a basis for scaling up across wetlands in the northern part of Egypt; (2) the use of Landsat 8 OLI–TIRS images to detect changes in marsh-vegetation phenology over the course of one year; and (3) providing insights into coastal marsh loss to inform the adaptive management for implementing wetland conservation strategies. Our hypotheses were: (1) marsh loss would be high, especially in the western and southern part of the lake, due to the massive agricultural and/or fish-farm expansion as a response to the human impacts of the population growth in the Nile Delta; (2) water aerial coverage would be highest in 2020, reflecting continuous sea-level rise, because the lake is connected to the Mediterranean Sea through an inlet in the north-east; and (3) marsh-vegetation aerial coverage would increase over the vegetation growing season, while water aerial coverage would increase in the winter after vegetation dieback.

2. Materials and Methods
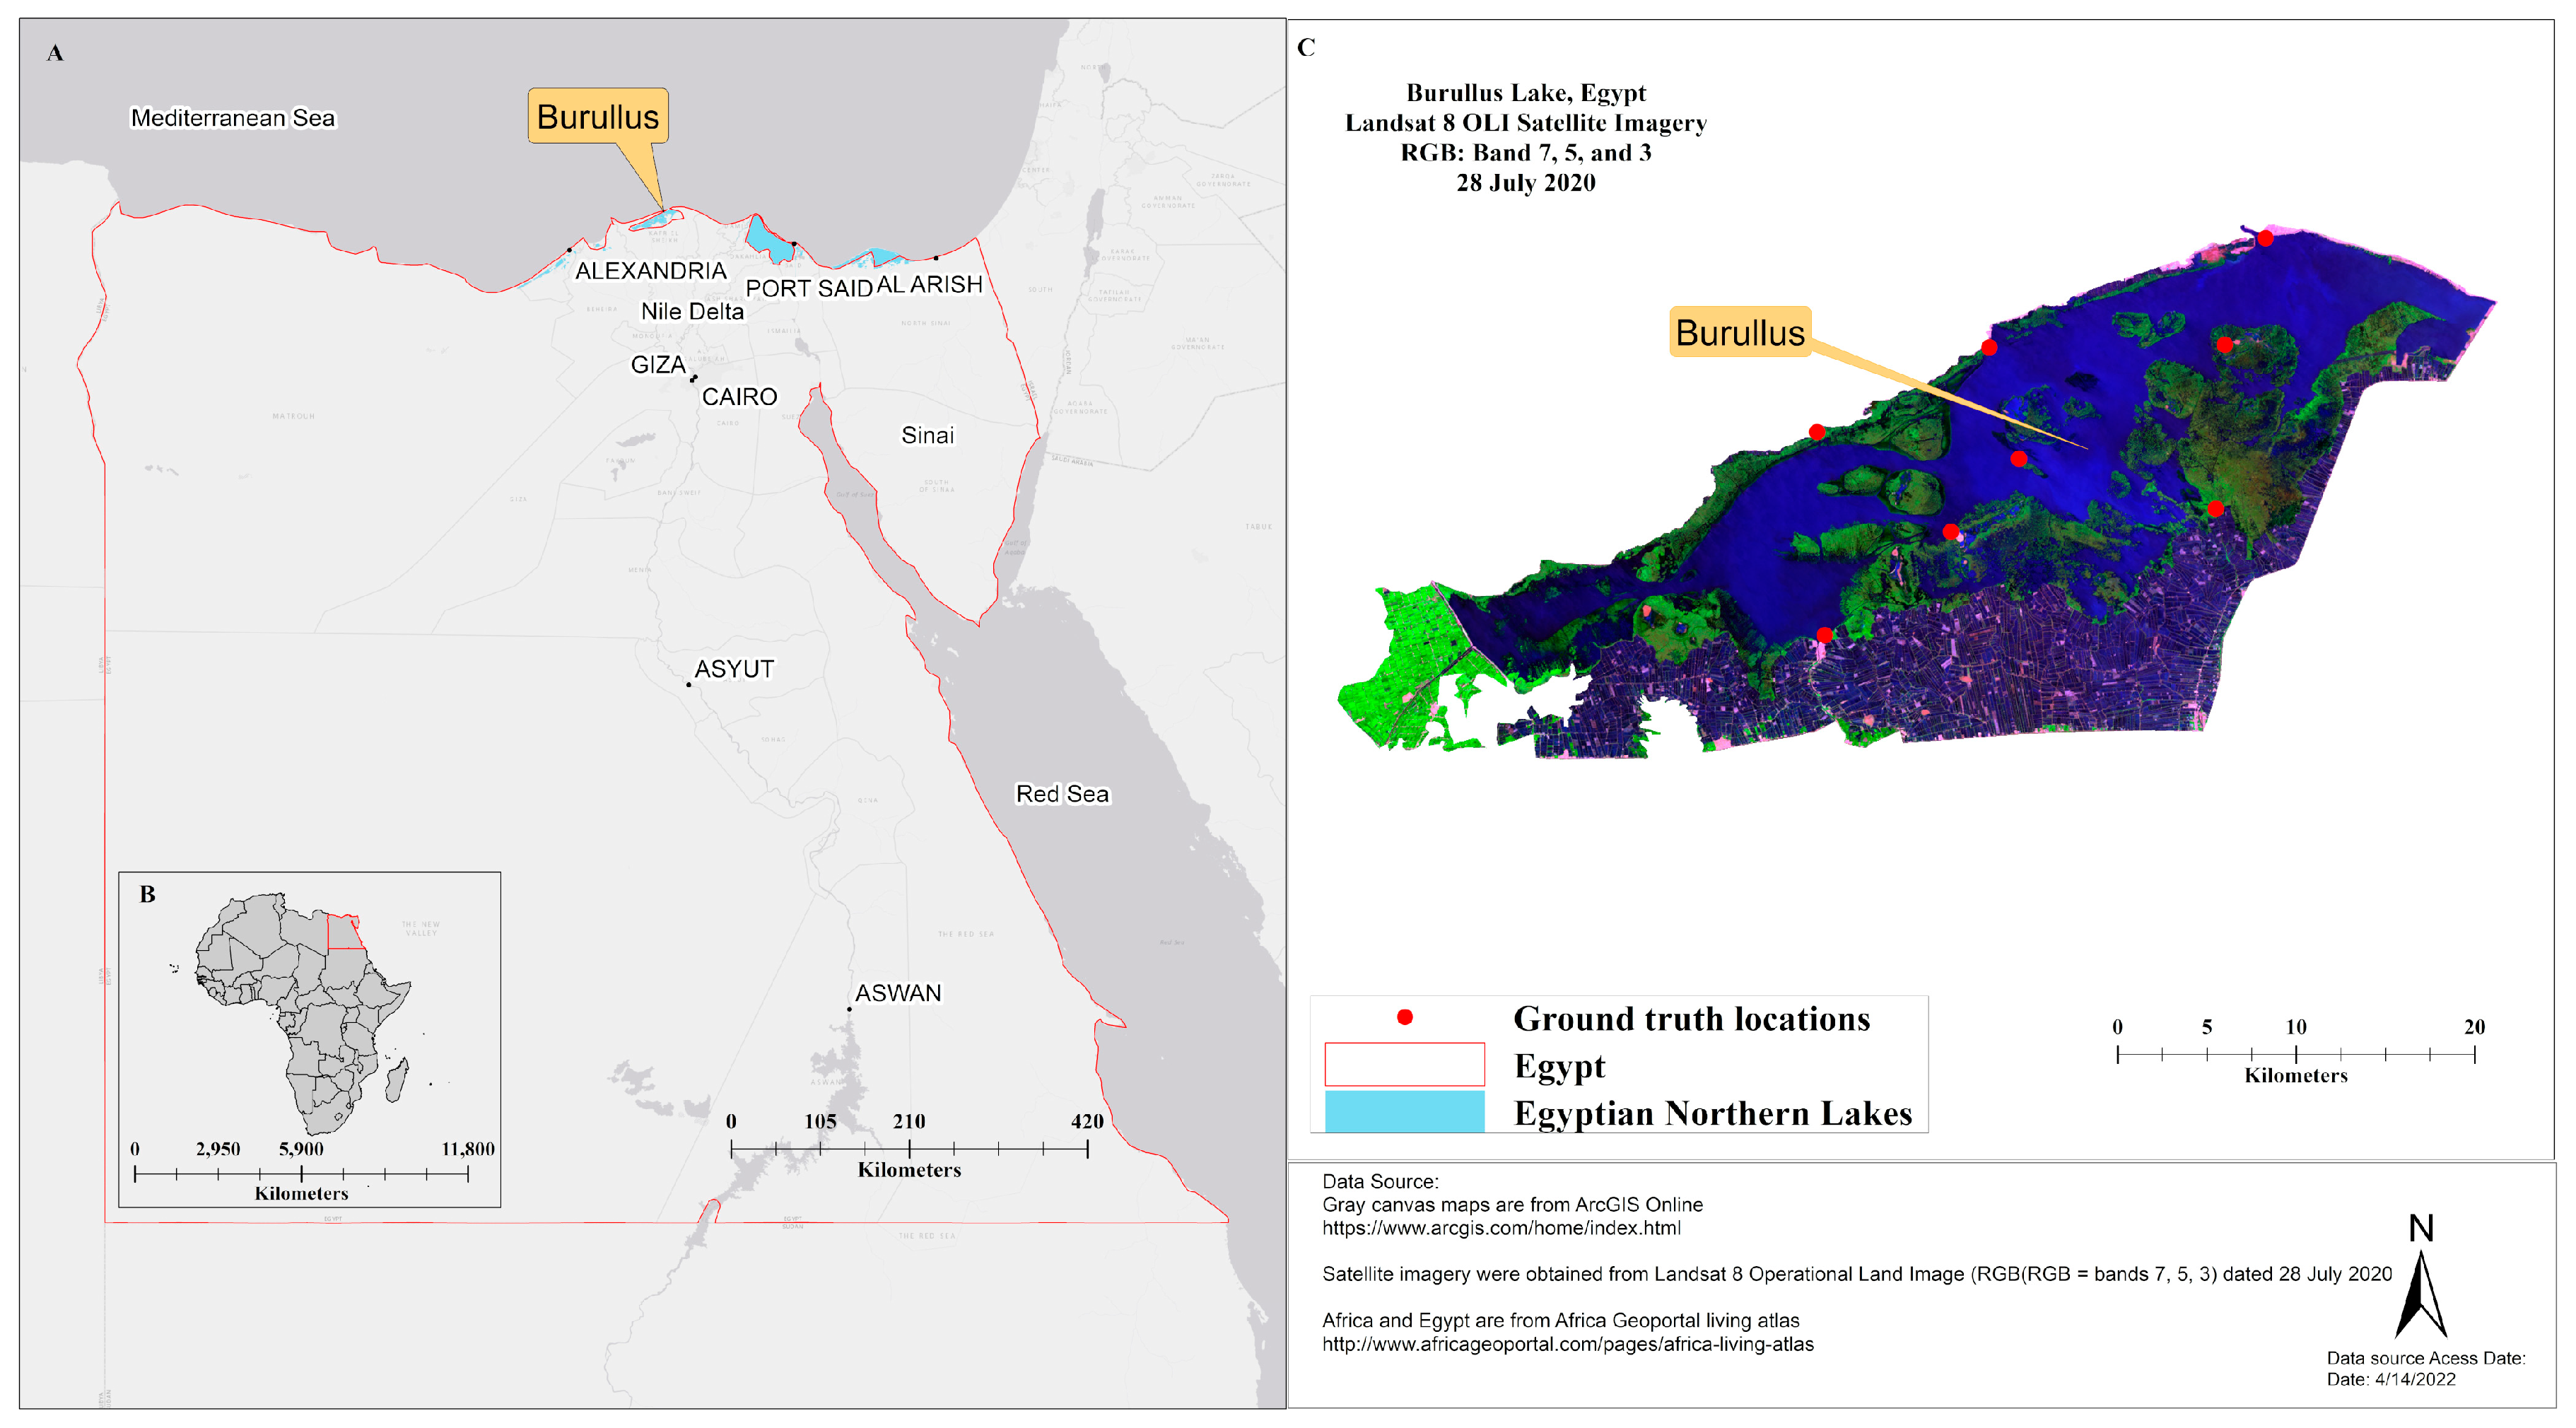
2.1. Study Area

Lake Burullus (Figure 1) is one of the five coastal lakes or lagoons located on the northern edge of the Nile Delta, Egypt. It is bordered by the Mediterranean Sea to the north and agricultural lands to the south and west. For more study-site description, see also [32,33,34,35]. The lake is listed as a wetland site of international importance for migrating birds under the Ramsar Convention [36]. In recent decades, Lake Burullus has been subjected to severe human activities [27,35,37,38]. Permission to access Lake Burullus was granted by the Environmental Authority for the Burullus Protected Area, Egypt. A total of eight ground-truth locations (Table S1) were selected in July 2012 where no endangered or protected species were present. Land-use-class pixels (30 m2) for each of the following habitats were selected for ground-truthing protocols [39]. During ground-truth field visits, the following habitats were identified: open water, marshes, unvegetated lands, fish ponds, and agricultural lands. Open-water habitats represent areas that have a water current and no emergent vegetation or submerged aquatic vegetation. Marsh habitats represent areas of the lake where either emergent and/or submerged aquatic vegetation is present. Non-vegetated areas include sand bars/dunes, paths, bare lands, roads, and reclaimed areas. Agricultural lands represent areas that have vegetation crops (e.g., corn). The fish ponds inside Lake Burullus are manmade, where lands were filled with water surrounded by thin ridges. Accordingly, those water pixels of fish ponds would be considered as a water habitat, while the ridges would be considered as part of the agricultural lands since those areas were previously farmlands (personal communication with local communities). For more detailed habitat description, please see Shaltout and Al-Sodany 2008 [40].

2.2. Satellite-Image Acquisition and Atmospheric Correction

Cost-free, moderate-resolution (30 m2), and multispectral (Table S2) satellite images (Path 177 and Row 38) were downloaded from the United States Geological Survey (USGS) Global Visualization Viewer (GloVis: https://glovis.usgs.gov/, accessed on 27 April 2017). The criteria used for the satellite-image selection were: (1) high atmospheric clarity (little haze or cloud cover), (2) regular intervals between dataset dates, and (3) dates that covered the marsh-vegetation growing season. Satellite images dated July 1985 and 2000 were accessed from Landsat 5 TM datasets, while satellite images dated May–November 2013 and July 2020 were accessed from Landsat 8 OLI–TIRS datasets (Table S3). All remote-sensing and geospatial processing for the satellite images were executed using ENVI [41] and ArcGIS Desktop 10.4, where all the images were projected onto the World Geodetic System 1984 (WGS1984). Radiance was calculated for the satellite images using standard remote-sensing techniques and equations [42,43]. The FLAASH module (Fast Line-of-Spot Atmospheric Analysis of Hypercubes, www.exelisvis.com, accessed on 27 April 2017) was used to atmospherically correct and calculate spectral surface reflectance [44]. Satellite images (Landsat 5 TM dated July 28 of 1985 and July 21 of 2000; Landsat 8 OLI–TIRS dated July 28 of 2020, Tables S2 and S3) were used to assess marsh loss in Lake Burullus since 1985. All available bands (1–7 for Landsat 5 TM, and 1–11 for Landsat 8 OLI–TIRS, Table S2) from the raster datasets were compiled in a composite raster image using the composite-bands tool. Shapefile as a polygon feature class for Lake Burullus identifying its boundaries was digitized and then used to extract the study-area portion from the composite satellite imagery by applying the extract-by-polygon tool. Both the vector shapefile and the raster images were spatially projected and geo-referenced to the WGS1984 datum.

2.3. Land-Use Classification and Marsh Loss Assessment

In remote-sensing and geospatial science, the Iterative Self-Organizing Data Analyses (ISODATA) unsupervised techniques [45,46] are widely used in the classification and clustering of satellite images [47] in different fields including agriculture and land-use management [48,49,50,51]. The ISODATA algorithm separates image cells into a user-specified number of distinct groups [45,46]. These are preferred over the supervised clustering techniques, which require an adequate number of training samples and are time consuming, particularly with large image datasets [52]. ISODATA, an unsupervised clustering algorithm, was applied to classify the study-area raster images [45,46,53], whereby the clustering was performed with the concurrent application of the Maximum Likelihood Classification for producing randomly chosen and user-defined clusters. The output raster classes were overlaid above the original Landsat satellite image for grouping and comparison purposes. The clusters (8 classes) produced from the ISODATA classification were grouped into four main classes as follows: (1) water; (2) marsh; (3) unvegetated land surfaces (roads, paths, sand sheets and dunes); and (4) agricultural lands and/or fish farms (Figure 2 and Table 1). Since both agricultural lands’ and fish farms’ land-use classes serve the same purpose for this study (assessing human impacts), those pixels (aerial coverage of 30 m2 on the ground) were merged into one major class. Upon completion of the major-land-use classification, raster images were converted into a vector dataset using the raster-to-polygon tool followed by a geometric-area (km2) calculation per each land-use class (Table 1). A GIS model was developed using ArcGIS Desktop Model Builder to extract and process all the different scenes under investigation (Source code can be found and available here: https://bitbucket.org/amrkeshta/land-use-classification/src/master/Model%20Builder%20Script%20for%20ISODATA).

2.4. Detection of Changes in Seasonal Marsh Aerial Coverage

Eight Landsat 8 OLI scenes collected between May and November 2013 were used to calculate the effect of phenological changes on the Lake Burullus marshland area (Table S3). Three masks were created to distinguish between the major land-cover types of Lake Burullus (the land-use class of agricultural lands and/or fish farms was excluded). Lake water, marsh vegetation, and non-marsh areas (unvegetated land surfaces) were identified on composite images of Landsat 8 OLI surface-reflectance bands 4 (red band λ = 0.64–0.67 µm), 5 (near infrared band λ = 0.85–0.88 µm), and 6 (short-wave infrared λ = 1.57–1.65 µm) (Figure 3 and Table S3). Water is black to dark blue; healthy vegetation is green; and soil, sand, and unvegetated marsh substrate is white, as are concrete and asphalt (Figure 3). The first mask outlines the boundaries of the lake. This mask includes or covers the waters of the lake and any marshes that border or occur within the Lake Burullus study area. The second mask covers only the deep-water areas that may be characterized by a typically high spectral reflectance in bands 4–6 due to sun glint of water waves or chlorophyll or sediment in the water. The third mask covers all the land areas not classified as being part of Lake Burullus marshes and waters, i.e., adjacent fish farms, agricultural lands, the non-vegetated delta adjacent to the Mediterranean Sea, the waters of the Mediterranean Sea, and a few, small areas of exposed soil or unvegetated marsh substrate located on islands in Lake Burullus (Figure 1A). We then classified the areas within the area defined by the first mask by surface-reflectance values into two major categories: lake water and marshland covered by marsh vegetation. The ENVI density-slice tool [41] was used to produce class image maps that determined the location and number of each pixel classified as water, marsh vegetation, and non-marsh area (Figure 3). We produced change-detection (CD) maps to show where there was a change in land cover over time (Figure 4), where red indicates pixels that changed from water to marsh vegetation, and blue indicates pixels that changed from marsh vegetation to water. The percentages of the Lake Burullus area consisting of lake water and marsh vegetation were calculated (Figure 5).

2.5. Land-Use-Classification Accuracy: Confusion Matrix and Kappa Coefficient

The confusion matrix (including user and producer accuracy presented in Table 2) and Kappa coefficient, which is a discrete multivariate parameter (Kappa statistic), were calculated to evaluate the performance and accuracy of the land-use classification for the satellite images [39,48,54,55,56,57]. The accuracy indices range from 0 to 1, where a value of 1 represents a 100-percent land-use-classification accuracy. The higher the accuracy indices, the better the performance of the land-use classification for an image. In our study, we considered a Kappa value of >0.75 to be considered acceptable for the accuracy of the clustering algorithm [47,53]. The overall accuracy was calculated as the percent of the total number of correctly classified samples in relation to the total number of reference samples chosen within a specific class (Table 2). In addition to the eight ground-truthing field locations (Table S1), a total of 160 random data points (40 points for each previously described major land-use class) were created as a point-feature class in ArcGIS Desktop 10.4 representing the classified Lake Burullus study area and were used for assessment of the accuracy indices. For comparison purposes and to assess land-use classification, three ArcGIS layers were overlaid above each other. From the top: the 160 random points were overlaid above the classified output raster (4 main classes), which were overlaid above the original Landsat imagery. This was done to check both user and producer accuracy [47,57]. For example, a point that was inside an open-water area should be checked against the original Landsat image to see if it was correctly classified as a water habitat inside the classified ISODATA raster or not.

3. Results

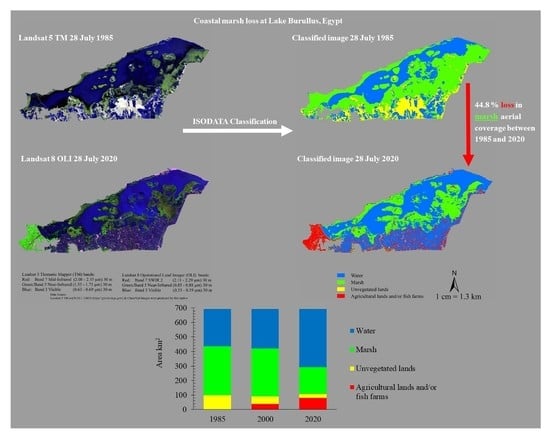
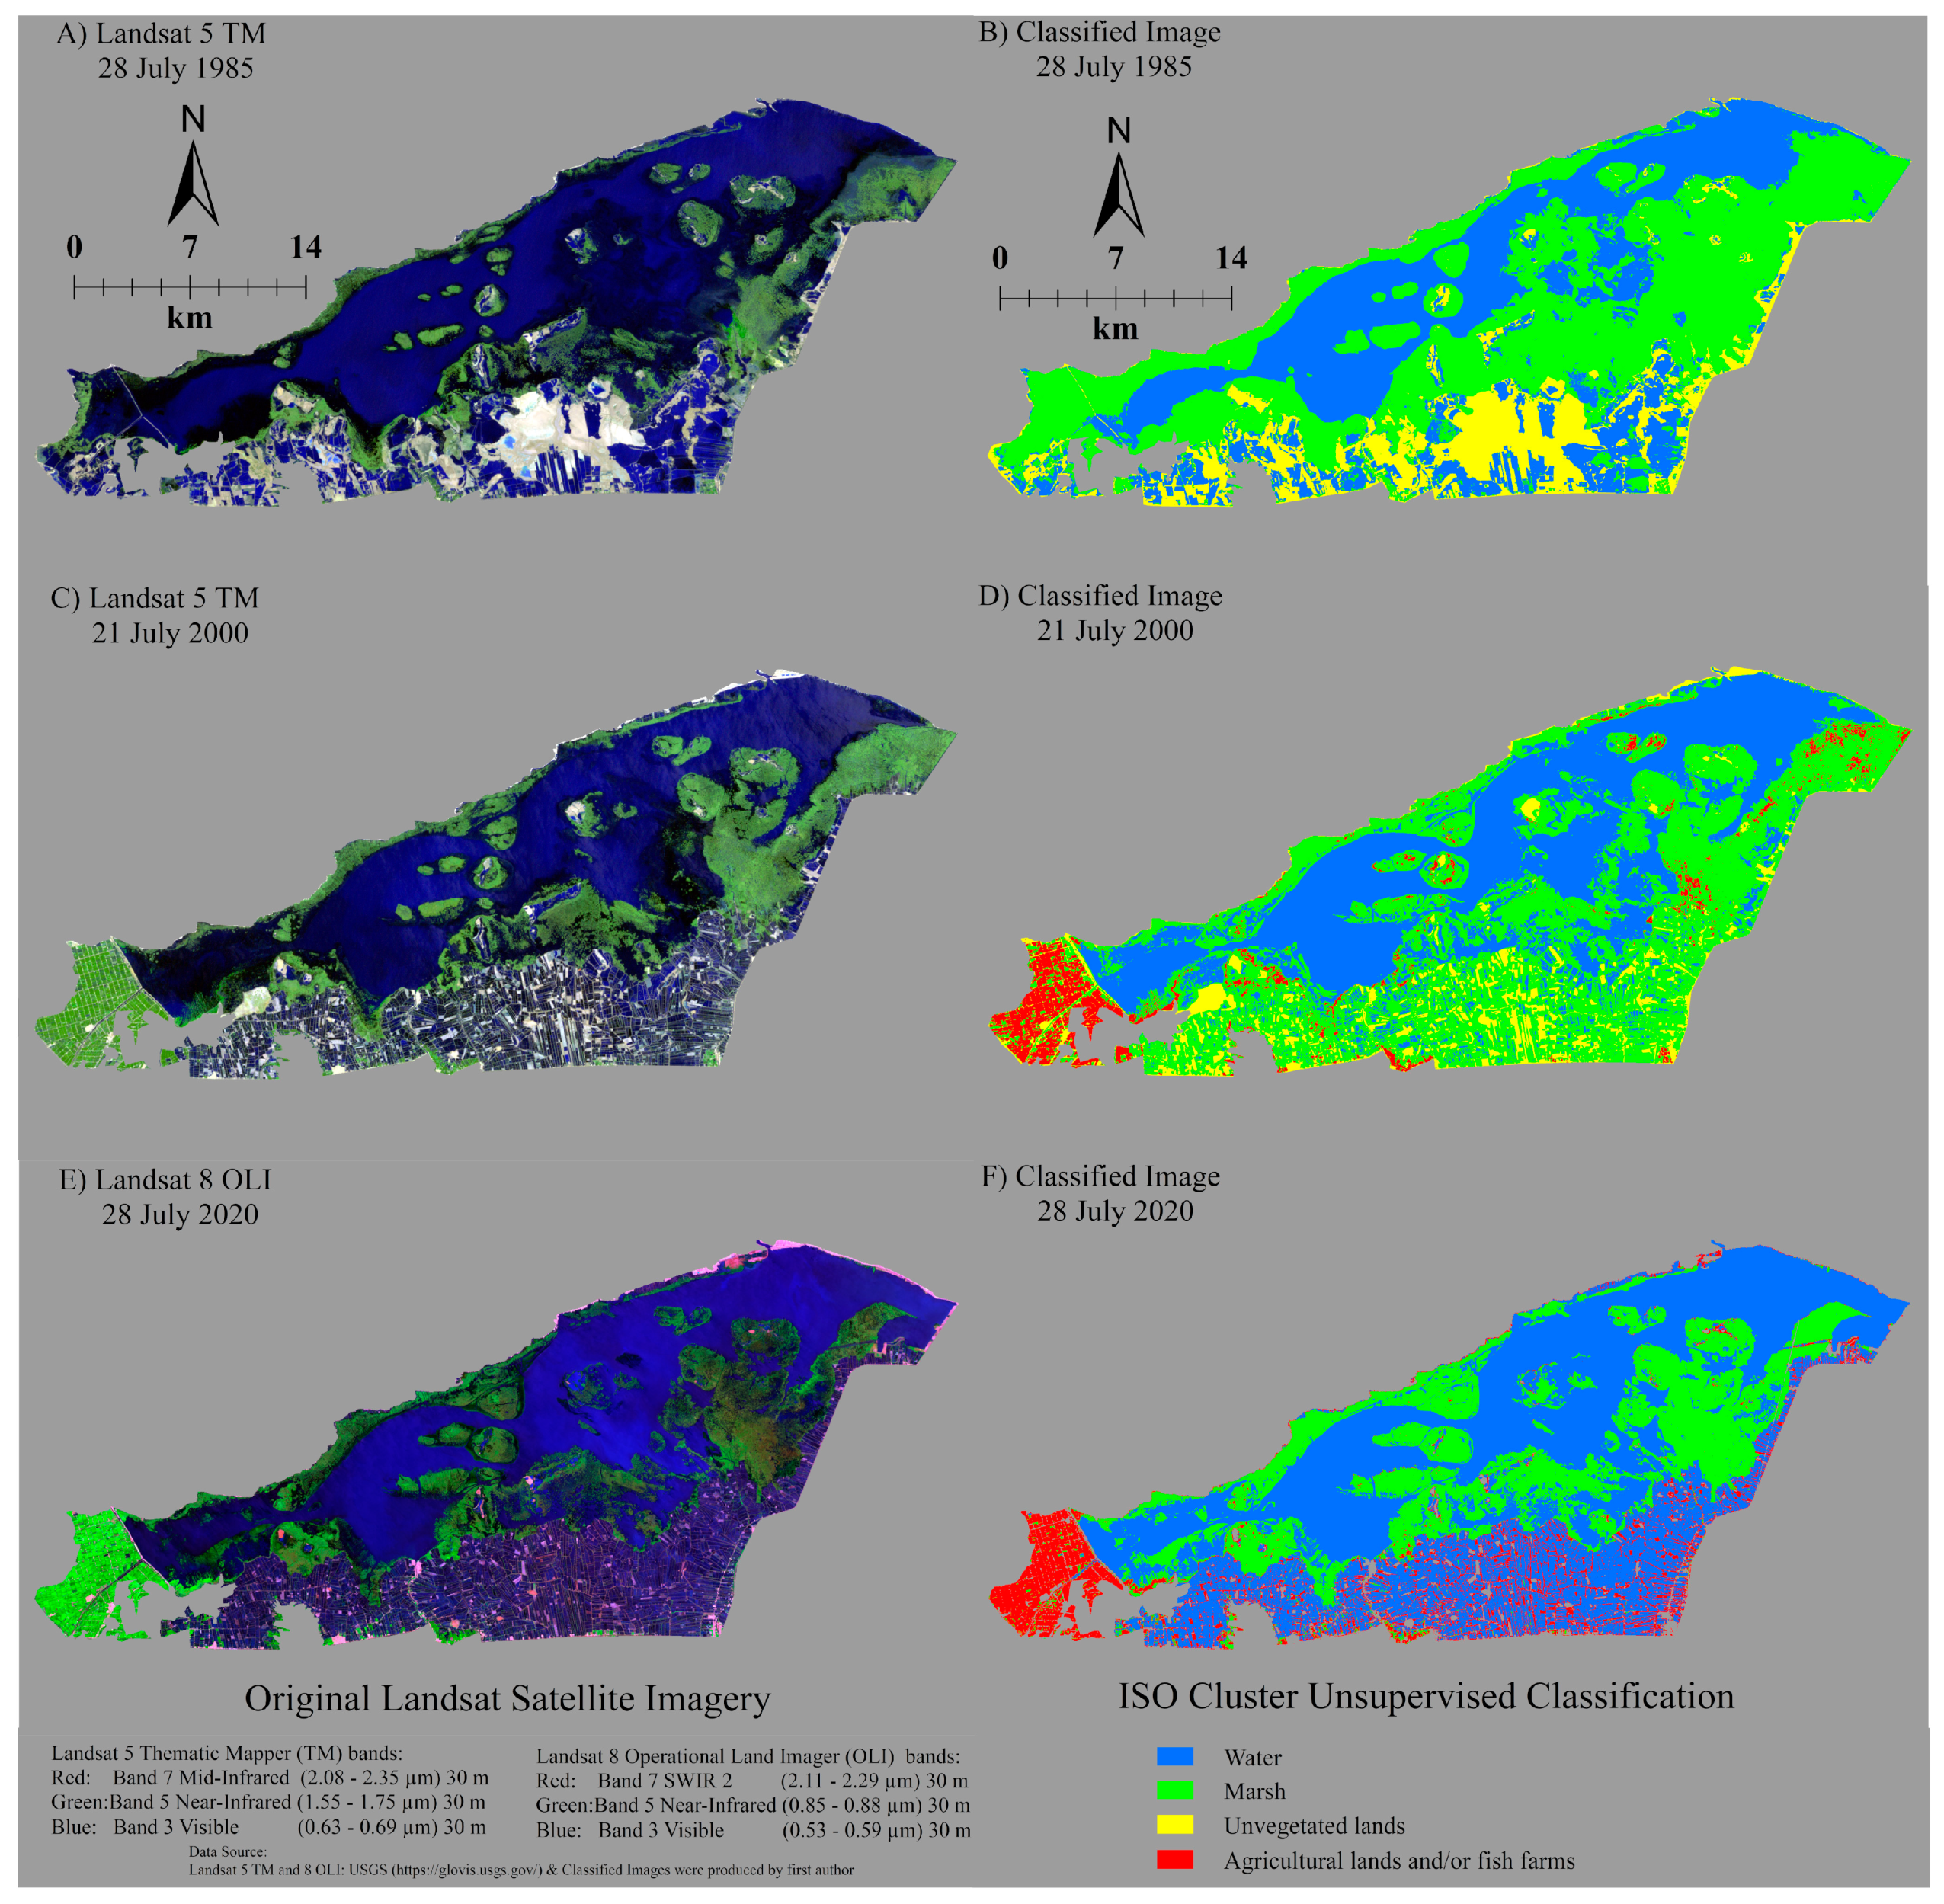
3.1. Land-Use Classification and Marsh Loss

The ISODATA classification of the Lake Burullus study-area satellite images (Landsat 5 TM and 8 OLI–TIRS) indicated that there was a substantial loss in those pixels that were classified as marsh and unvegetated land surfaces, while agricultural lands and/or fish farms and water bodies showed a significant increase in their aerial coverage in the period between July 1985 and 2020 (Figure 2 and Table 1) with an overall classification accuracy of 96% and a Kappa coefficient of 0.95 (Table 2). Marsh aerial coverage in the Lake Burullus study area drastically decreased from 335.6 km2 in July 1985 to 185.3 km2 in July 2020, representing a 44.8% loss (Table 1). Coastal marsh area in Lake Burullus drastically decreased between 2000 and 2020, where marsh aerial coverage significantly decreased from 329.7 km2 in July 2000 to 185.3 km2 in July 2020, representing a 43.8% loss and demonstrating that marsh loss was much higher between 2000 and 2020 than between 1985 and 2000. Pixels classified as agricultural lands and/or fish farms did not exist in July 1985, but based on Landsat 5 TM satellite imagery, they spanned an area of 39.3 km2 in July 2000, which then doubled by July 2020 to become 79.8 km2, reflecting the drainage and conversion of coastal wetlands into agricultural fields and fish farms to cope with the tremendous increase in the population growth in the Nile Delta in recent decades. The conversion of wetlands into agricultural fields was concentrated west of the lake in 2000 (Figure 2C,D). An additional increase in fish farms occurred along the southern lake shore between 21 July 2000 and 28 July 2020 (Figure 2).
Pixels classified as water bodies increased by 54.9% from 257.5 km2 in 1985 to 398.9 km2 in 2020, and by 46.8% from 271.7 km2 in 2000 to 398.9 km2 in 2020. Sea-level rise through Al-Bughaz inlet from the Mediterranean Sea may have contributed to this increase in lake area (Figure 1). The expansion of fish-pond creation to meet the local community needs and population growth might be another explanation for the increase in water aerial coverage since 2000. Moreover, 71.9% of pixels classified as unvegetated land surfaces (including large areas of exposed sand in the central south area of the lake) were replaced by either water due to rising sea-level or agricultural fields and/or fish farms (Figure 2 and Table 1).

3.2. Detection of Changes in Marsh and Water Aerial Coverage

The ENVI density-slice and change-detection algorithms (Figure 3 and Figure 4) applied to the Landsat 8 OLI images (May to November 2013, Tables S2 and S3) revealed that marsh-vegetation areas increased from 22 May 2013 (Figure 3A) to reach a peak on 25 July 2013 (Figure 3D, and with lowest water coverage identified in Figure 5) and then decreased on 14 November 2013 (Figure 5). The eight images show the lake’s marsh-vegetation-phenology cycle starting from the beginning of the growing season in May, reaching a peak at the end of July, and then dying back in the late fall and winter (Figure 5). Moreover, the greatest change in the marsh-vegetation area occurred in the middle and southern parts of the lake (Figure 3) where the majority of the non-emergent vegetation species grow until late summer (e.g., Ceratophyllum demersum and Potamogeton pectinatus).

4. Discussion

4.1. Population Growth and Food Demands Are the Major Factors for Marsh Loss in Lake Burullus

Cairo, Egypt’s largest city, had a 2.74% annual population growth between 1976 and 1986, and reached 10.17 million in 1996 [58]. In 2020, Egypt had a population of 104.1 million with a projected population of 168.9 million by 2050 [59]. These tremendous increases in population require a proportional increase in the agricultural lands and fish-farm expansion to cope with food demands. The drainage and conversion of wetlands into agricultural fields has been in practice for decades, due to their nutrient-rich soil. Moreover, the perception of the wetlands as a “wasteland” has led to a global reduction in wetlands [60], including African wetlands [61]. Our first hypothesis was that marsh aerial coverage within the Lake Burullus study area would have significantly decreased in recent years, mainly due to conversion into farmlands. In the Lake Burullus study area, we found that wetland marshes lost 44.8% of their aerial coverage between 1985 and 2020 and have been converted into agricultural lands and/or fish ponds, especially in the western and southern parts of the lake, respectively, which is in support of our first hypothesis. Our results indicated that there was a more substantial marsh loss between 2000 and 2020 than between 1985 and 2000, which reflects the higher demands of drainage and conversion of wetlands into agricultural lands and/or fish farms to cope with the food demands as a result of the increasing population growth, especially in the last few decades. The conversion of wetlands into agricultural lands have been reported by many research studies in Africa, including wetlands in Lake Burullus, and around the world. In Egypt, for example, there was a 42.8% overall loss in the Lake Burullus aerial coverage between 1973 and 2011 [31]. Moreover Eid (2020) reported an overall aerial-coverage loss for Lake Burullus from 481.82 km2 in 1990 to 454.25 km2 in 2019 [4]. Other research studies reported the overall shrinkage of the lake area due to human disturbance including land reclamation, which resulted in a decrease in the lake area from 503 km2 in 1984 to 410 km2 in 1997 (the length decreased from 56 to 47 km, while the width decreased from 15 to 14 km [62]. In Africa and globally: There was about a 67% loss of wetlands due to agricultural land use in Sanjiang Plain, China, between 1975 and 2004 [63]; 55% of wetlands were converted into farmlands in Kenya between 1966 and 2018 [64]; there was a 62% loss of the wetland vegetation in Uganda from 2002 to 2014 [65]; a 52% loss of wetlands between 1996 and 2004 in South Africa [66]; and 17.3% of marsh loss in the last four decades in New England, USA [67].

4.2. Rising Sea-Level Is a Real Threat for Marsh Loss in Egypt

Shoreline protection and coastal-ecosystem management have been in practice for decades in order to reduce higher erosion rates through building different types of engineering structures including sea walls, revetments, groins, and basalt riprap. The Lake Burullus shoreline is experiencing higher rates of erosion as a consequence of the continuously rising sea level [50,68,69]. The Mediterranean coast of Egypt extends for about 970 km, from Sallum (31°34′ N, 25°09′ E) in the west to Rafah in the east (34°20′ N, 31°25′ E), while Lake Burullus is located in the Nile Delta coast of Egypt, which experienced lower sedimentation rates due to less sediment received from the Nile River after building the Aswan High Dam in 1964. The resulting decrease in sedimentation rates and increase in erosion rates [70] threatens the Nile Delta coast with subsidence. Nile Delta lands subside as a response to natural and anthropogenic impacts with a subsidence rate of −3 to −8 mm/year at the coastal margin of the Nile Delta, and a rate of −12 to −20 mm/year at major cities in the Nile Delta [71]. Our second hypothesis was that the water aerial coverage in the Lake Burullus study area would have increased in recent years as a consequence of the continuously rising sea level. Both thermal expansion of the ocean and glacier melting remain the major factors contributing to the global sea-level rise [16,17]. Our results show that the water-pixel aerial coverage for the Lake Burullus study area increased by 54.9% from 1985 to 2020 according to the ISODATA classification of the Landsat satellite images dated July 1985, 2000, and 2020. Since the lake has a direct connection with the Mediterranean Sea through the Al-Bughaz inlet, the continuously rising sea level is a possible explanation for the water-aerial-coverage increase, which supports our second hypothesis. Moreover, the tremendous fish-pond expansion to meet the needs and food demand of the local communities and population is another explanation for the increase in the water-habitat aerial coverage since 2000. Similar to our research findings, higher water levels in Lake Burullus [72,73] and an increase in the water-body aerial coverage have been reported by many research studies [4,11,26,29,50,69]. Saltwater intrusion is another climate threat that contributes to coastal marsh loss [74,75], especially when the soil accretion rate is not coping with the continuously rising sea level [76,77]. The primary source of saltwater intrusion from the Mediterranean Sea to Lake Burullus is through the Al-Bughaz inlet in the northeast part of the lake. The rates of coastal subsidence and erosion may have increased in recent decades and are likely to accelerate with completion of the Grand Renaissance Dam [78].
Our third hypothesis was that the aerial coverage for the marsh-vegetation pixels would increase over the growing season and decrease to their minimum aerial coverage by winter, when most of the vegetation dieback occurs. Most of the submerged aquatic vegetation (e.g., Ceratophyllum demersum) occurs in the freshwater zones (middle and south part of the lake), where the lake receives 4 billion m3 of drainage water annually from the Nile Delta agricultural lands, which account for 97% of the water inflow [33]. By the end of the growing season and after vegetation dieback, most of the pixels that were classified as marsh vegetation at the start of the growing season were classified as water. Vegetation peaked in July, while the aerial coverage of water pixels peaked in November (Figure 5) after vegetation dieback, in support of our third hypothesis. Areas of the lake characterized by stable marsh vegetation typically consist of large patches of emergent vegetation (e.g., Phragmites australis and Typha domingensis). This emergent vegetation retained the same aerial exposure throughout the phenological cycle. Other floating plants such as Eichhornia crassipes were dominant in the southern part of the lake, while Atriplex portulacoides—a halophyte species—was dominant at the northeastern part of the lake near the saltwater inlet from the Mediterranean Sea.
The increase in agricultural lands and fish farms based on other studies suggest that the brackish waters of Lake Burullus are likely to experience salinity and water changes [79]. A significant change in salinity occurred in the 1950s when freshwater flow from the irrigation of new agricultural lands entered the lake [79]. The increase in agricultural lands and the concomitant increase in agricultural drainage decreases salinity and increases nutrient, pesticide, and pollution levels [79]. Freshwater biota species have become more abundant in the food web of the lake [80]. The eutrophication of lake waters is increasing due to increasing phosphate and nitrate levels, which are due to agricultural drainage, primarily in the southern and western parts of the lake [81]. A more diverse phytoplankton community was located near the fish farms and near the drains that enter Lake Burullus in the southern and western parts of the lake [81]. Changes in water chemistry and pollution levels are likely to affect productivity and change the species composition of wetland plant communities over time, as has been reported in tidal freshwater wetlands [82].

4.3. Implications and Outlook

The substantial expansion of agricultural lands and fish ponds in the western and southern parts of Lake Burullus at the expense of the overall aerial coverage of the lake reflects the inadequate understanding of the importance and value of coastal wetlands among local stakeholders, including land-use-policy makers and resident communities living near the lake. Therefore, our study findings recommend the following actions: (1) incentive programs for wetland conservation and restoration should be integrated into the country’s development plans, with special focus on coastal wetlands in the northern part of Egypt, for their invaluable role in flooding mitigation, wildlife habitats, and water quality; (2) raising public awareness of the importance of lake-water quality for commercial fisheries, farming, and the local economy to find a balance between the food demands of local communities and the ecosystem services provided by wetland conservation; and (3) construct a coastal defense system on the Nile Delta coast.

5. Conclusions

Land-use classification (with a Kappa index of 0.95) for the Lake Burullus study area revealed substantial marsh loss (44.8% loss) at the western and southern part of the lake where the marsh habitats were either drained and converted to agricultural fields or were converted into fish farms to meet the population-growth needs of the local communities in the Nile Delta region. The rate of marsh loss in Lake Burullus was substantially higher between 2000 and 2020 than between 1985 and 2000, which reflects the higher drainage rates of wetlands to cope with the increasing food demands of the Nile Delta population growth in the last two decades. Pixels classified as unvegetated lands (including exposed sand) had completely disappeared by July 2020, which is a result of an increase in the aerial coverage of water bodies, which in turn might be a true reflection of the continuously rising sea level. Change-detection techniques for Landsat 8 OLI satellite images revealed that marsh-vegetation pixels started to increase from May at the start of the growing season to reach a peak by July, and then decreased again by the end of November after vegetation dieback, reflecting a typical vegetation-phenology pattern. However, water pixels reached their maximum aerial coverage after the dieback of the non-emergent vegetation by winter. The results of this study indicate that the remote-sensing and geospatial techniques that were applied at the local level (Lake Burullus) are useful as a baseline for scaling up at the regional level in order to assess coastal marsh loss, especially in the northern part of Egypt. In conclusion, the loss of nearly half (44.8% loss) of the Lake Burullus marshland has a significant impact on the ecosystem services provided by these marshes. Therefore, public awareness should be raised among local communities living near the lake, especially at the southern and western parts.

Supplementary Materials

The following supporting information can be downloaded at: https://www.mdpi.com/article/10.3390/su14094980/s1. Table S1: Ground-truthing site names and their locations in Lake Burullus, Egypt. Latitude (N) and longitude (E) are presented in decimal degrees; Table S2: Spectral and spatial characteristics for Landsat 5 TM and 8 OLI–TIRS images; Table S3: List of Landsat 5 TM and 8 OLI datasets downloaded from the GLOVIS website (http://glovis.usgs.gov/, accessed on 27 April 2017).

Author Contributions

Conceptualization, A.E.K.; methodology, A.E.K. and J.C.A.R.; software, A.E.K. and J.C.A.R.; validation, A.E.K. and J.C.A.R.; formal analysis, A.E.K. and J.C.A.R.; investigation, A.E.K., J.C.A.R., K.H.S., A.H.B., M.K., A.S.E.-D. and E.M.E.; resources, A.E.K., J.C.A.R., K.H.S., A.H.B., M.K., A.S.E.-D. and E.M.E.; data curation, A.E.K.; writing—original draft preparation, A.E.K.; writing—review and editing, A.E.K., J.C.A.R., K.H.S., A.H.B., M.K., A.S.E.-D. and E.M.E.; visualization, A.E.K.; supervision, J.C.A.R., K.H.S., A.H.B., M.K., A.S.E.-D. and E.M.E.; project administration, J.C.A.R., K.H.S., A.H.B., M.K., A.S.E.-D. and E.M.E.; funding acquisition, A.E.K., A.H.B. and E.M.E. All authors have read and agreed to the published version of the manuscript.

Funding

This research was funded by the Deanship of Scientific Research at King Khalid University (grant number RGP.1/7/43); the Egyptian Cultural affairs & Mission sector in Cairo, Egypt; the Egyptian Cultural and Educational Bureau (ECEB) in Washington, DC; and the USDA National Institute of Food and Agriculture, Hatch project 1013805.

Institutional Review Board Statement

Not applicable.

Informed Consent Statement

Not applicable.

Data Availability Statement

The geospatial datasets generated and/or used to execute the land-use classification, density slice, and change detection are available upon request from the corresponding author.

Acknowledgments

The authors would like to thank the Egyptian Environmental Affairs Agency, Egypt for granting the access to the lake, and the staff at Lake Burullus Conservation Facility for providing housing. The first author is grateful for the Department of Environmental Science and Technology at University of Maryland at College Park, USA for providing the license for ENVI and ArcGIS 10.4 software required for geospatial and remote-sensing analyses and for the United States Geological Survey (USGS) for providing cost-free Landsat 5 TM and 8 OLI images. The last author would like to express sincere gratitude to the Deanship of Scientific Research at King Khalid University for funding this work through the Research Group Project under grant number RGP.1/7/43.

Conflicts of Interest

The authors declare no conflict of interest.

References

  1. Shaheen, S.M.; Abdelrazek, M.A.S.; Elthoth, M.; Moghanm, F.S.; Mohamed, R.; Hamza, A.; El-Habashi, N.; Wang, J.X.; Rinklebe, J. Potentially toxic elements in saltmarsh sediments and common reed (Phragmites australis) of Burullus coastal lagoon at North Nile Delta, Egypt: A survey and risk assessment. Sci. Total Environ. 2019, 649, 1237–1249. [Google Scholar] [CrossRef] [PubMed]
  2. Chen, Z.; Salem, A.; Xu, Z.; Zhang, W. Ecological implications of heavy metal concentrations in the sediments of Burullus Lagoon of Nile Delta, Egypt. Estuar. Coast. Shelf Sci. 2010, 86, 491–498. [Google Scholar] [CrossRef]
  3. Bocci, M.; Pastres, R.; Kholeif, S.; Dalla Barba, D.; Brigolin, D. Modelling the impacts of semi-intensive aquaculture on the foodweb functioning of a Nile Delta coastal lake. Afr. J. Mar. Sci. 2017, 39, 237–249. [Google Scholar] [CrossRef]
  4. Eid, A.N.M.; Olatubara, C.O.; Ewemoje, T.A.; Farouk, H.; El-Hennawy, M.T. Coastal wetland vegetation features and digital Change Detection Mapping based on remotely sensed imagery: El-Burullus Lake, Egypt. Int. Soil Water Conserv. Res. 2020, 8, 66–79. [Google Scholar]
  5. Okbah, M.A.; Hussein, N.R. Impact of environmental conditions on the phytoplankton structure in Mediterranean Sea lagoon, Lake Burullus, Egypt. Water Air Soil Pollut. 2006, 172, 129–150. [Google Scholar] [CrossRef]
  6. Arshad, M.; Khedher, K.M.; Ayed, H.; Mouldi, A.; Moghanm, F.S.; El Ouni, M.H.; Benkahla, N.; Laatar, E.; Bilal, M.; Zaher, M.A. Effects of land use and cultivation histories on the distribution of soil organic carbon stocks in the area of the Northern Nile Delta in Egypt. Carbon Manag. 2020, 11, 341–354. [Google Scholar] [CrossRef]
  7. Abukila, A.F. Assessing the drain estuaries’ water quality in response to pollution abatement. Water Sci. 2015, 29, 1–18. [Google Scholar] [CrossRef] [Green Version]
  8. Salem, M.; Tsurusaki, N.; Divigalpitiya, P. Remote sensing-based detection of agricultural land losses around Greater Cairo since the Egyptian revolution of 2011. Land Use Pol. 2020, 97, 8. [Google Scholar] [CrossRef]
  9. Zhang, Y.; Wang, H.Y.; Xie, P.; Rao, Y.X.; He, Q.S. revisiting spatiotemporal changes in global urban expansion during 1995 to 2015. Complexity 2020, 2020, 11. [Google Scholar] [CrossRef]
  10. Schilling, J.; Hertig, E.; Tramblay, Y.; Scheffran, J. Climate change vulnerability, water resources and social implications in North Africa. Reg. Environ. Chang. 2020, 20, 12. [Google Scholar] [CrossRef] [Green Version]
  11. Blasco, J.M.D.; Cian, F.; Hanssen, R.E.; Verstraeten, G. Mapping and quantifying the human-environment interactions in middle Egypt using machine learning and satellite data fusion techniques. Remote Sens. 2020, 12, 22. [Google Scholar]
  12. Khalil, M.; El-Dawy, F. Ecological Survey of Burullus Nature Protectorate: Fishes and Fisheries; MedWetCoast, Global Environmental Facility (GEF) and Egyptian Environmental Affairs Agency (EEAA): Cairo, Egypt, 2002; p. 69. [Google Scholar]
  13. Mitsch, W.J.; Gosselink, J.G. Wetlands; Wiley: Hoboken, NJ, USA, 2007. [Google Scholar]
  14. MEA. Ecosystems and Human Well-Being: Wetlands and Water Synthesis; World Resources Institute: Washington, DC, USA, 2005. [Google Scholar]
  15. Weise, K.; Hofer, R.; Franke, J.; Guelmami, A.; Simonson, W.; Muro, J.; O’Connor, B.; Strauch, A.; Flink, S.; Eberle, J.; et al. Wetland extent tools for SDG 6.6.1 reporting from the Satellite-based Wetland Observation Service (SWOS). Remote Sens. Environ. 2020, 247, 12. [Google Scholar] [CrossRef]
  16. IPCC. Climate Change 2014: Synthesis Report. Contribution of Working Groups I, II and III to the Fifth Assessment Report of the Intergovernmental Panel on Climate Change; 5th Report; IPCC: Geneva, Switzerland, 2014; p. 151. [Google Scholar]
  17. IPCC. Special Report on the Impacts of Global Warming of 1.5 C above Pre-Industrial Levels and Related Global Greenhouse Gas Emission Pathways, in the Context of Strengthening the Global Response to the Threat of Climate Change, Sustainable Development, and Efforts to Eradicate Poverty; IPCC: Geneva, Switzerland, 2018. [Google Scholar]
  18. Nicholls, R.J.; Marinova, N.; Lowe, J.A.; Brown, S.; Vellinga, P.; De Gusmao, D.; Hinkel, J.; Tol, R.S. Sea-level rise and its possible impacts given a ‘beyond 4 C world’in the twenty-first century. Philos. Trans. R. Soc. A 2011, 369, 161–181. [Google Scholar] [CrossRef] [PubMed] [Green Version]
  19. Webb, E.L.; Friess, D.A.; Krauss, K.W.; Cahoon, D.R.; Guntenspergen, G.R.; Phelps, J. A global standard for monitoring coastal wetland vulnerability to accelerated sea-level rise. Nat. Clim. Chang. 2013, 3, 458–465. [Google Scholar] [CrossRef] [Green Version]
  20. Mills, L.; Janeiro, J.; Neves, A.A.S.; Martins, F. The impact of Sea level rise in the Guadiana Estuary. J. Comput. Sci. 2020, 44, 101169. [Google Scholar] [CrossRef]
  21. Hong, B.; Liu, Z.; Shen, J.; Wu, H.; Gong, W.; Xu, H.; Wang, D. Potential physical impacts of sea-level rise on the Pearl River Estuary, China. J. Mar. Syst. 2020, 201, 103245. [Google Scholar] [CrossRef]
  22. Cahoon, D.R.; Hensel, P.F.; Spencer, T.; Reed, D.J.; McKee, K.L.; Saintilan, N. Coastal Wetland Vulnerability to Relative Sea-Level Rise: Wetland Elevation Trends and Process Controls. In Wetlands and Natural Resource Management; Verhoeven, J.T.A., Beltman, B., Bobbink, R., Whigham, D.F., Eds.; Springer: Berlin/Heidelberg, Germany, 2006; pp. 271–292. [Google Scholar]
  23. Beckett, L.H.; Baldwin, A.H.; Kearney, M.S. Tidal Marshes across a Chesapeake Bay Subestuary Are Not Keeping up with Sea-Level Rise. PLoS ONE 2016, 11, 12. [Google Scholar] [CrossRef]
  24. Spidalieri, K. Where the Wetlands Are—And Where They Are Going: Legal and Policy Tools for Facilitating Coastal Ecosystem Migration in Response to Sea-Level Rise. Wetlands 2020, 40, 1765–1776. [Google Scholar] [CrossRef]
  25. Mohsen, A.; Elshemy, M.; Zeidan, B.A. Change detection for Lake Burullus, Egypt using remote sensing and GIS approaches. Environ. Sci. Pollut. Res. 2018, 25, 30763–30771. [Google Scholar] [CrossRef]
  26. Masria, A.; El-Adawy, A.A.; Sarhan, T. A holistic evaluation of human-induced LULCC and shoreline dynamics of El-Burullus Lagoon through remote sensing techniques. Innov. Infrastruct. Solut. 2020, 5, 10. [Google Scholar] [CrossRef]
  27. El-Zeiny, A.; El-Kafrawy, S. Assessment of water pollution induced by human activities in Burullus Lake using Landsat 8 operational land imager and GIS. Egypt. J. Remote Sens. Space Sci. 2017, 20, S49–S56. [Google Scholar] [CrossRef] [Green Version]
  28. Moghanm, F.S.; Belal, A.B. Assessment and Mapping of Environmentally Sensitive Areas To Desertification Using Gis in An Area of The North Delta Region of Egypt. Egypt. J. Soil Sci. 2018, 58, 325–335. [Google Scholar]
  29. El-Asmar, H.M.; Hereher, M.E. Change detection of the coastal zone east of the Nile Delta using remote sensing. Environ. Earth Sci. 2011, 62, 769–777. [Google Scholar] [CrossRef]
  30. Sameh, B.; Khalafallah, A.; Omar, M.; Khalil, M.M.; Yehia, A.; Allam, M. An integrated field and remote sensing approach for water quality mapping of Lake Burullus, Egypt. Int. J. Environ. Sci. Eng. 2015, 6, 15–20. [Google Scholar]
  31. El-Asmar, H.M.; Hereher, M.E.; El Kafrawy, S.B. Surface area change detection of the Burullus Lagoon, North of the Nile Delta, Egypt, using water indices: A remote sensing approach. Egypt. J. Remote Sens. Space Sci. 2013, 16, 119–123. [Google Scholar] [CrossRef] [Green Version]
  32. Eid, E.M.; Keshta, A.E.; Shaltout, K.H.; Baldwin, A.H.; El-Din, S.; Ahmed, A. Carbon sequestration potential of the five Mediterranean lakes of Egypt. Fundam. Appl. Limnol. 2017, 190, 87–96. [Google Scholar] [CrossRef]
  33. El-Shinnawy, I. Al-Burullus Wetland’s Hydrological Study; MedWetCoast, Global Environmental Facility (GEF) and Egyptian Environmental Affairs Agency (EEAA): Cairo, Egypt, 2002. [Google Scholar]
  34. El-Sheikh, M.A.; Al-Sodany, Y.M.; Eid, E.M.; Shaltout, K.H. Ten years primary succession on a newly created landfill at a lagoon of the Mediterranean Sea (Lake Burullus RAMSAR site). Flora 2012, 207, 459–468. [Google Scholar] [CrossRef]
  35. Shaltout, K.; Khalil, M. Lake Burullus: Burullus Protected Area; Egyptian Environmental Affairs Agency: Cairo, Egypt, 2005. [Google Scholar]
  36. Ghoraba, S.M.M.; Halmy, M.W.A.; Salem, B.B.; Badr, N.B.E. Assessing risk of collapse of Lake Burullus Ramsar site in Egypt using IUCN Red List of Ecosystems. Ecol. Indic. 2019, 104, 172–183. [Google Scholar] [CrossRef]
  37. Keshta, A.E.; Shaltout, K.H.; Baldwin, A.H.; El-Din, A.A.S. Sediment clays are trapping heavy metals in urban lakes: An indicator for severe industrial and agricultural influence on coastal wetlands at the Mediterranean coast of Egypt. Mar. Pollut. Bull. 2020, 151, 110816. [Google Scholar] [CrossRef]
  38. El Baz, S.M. Benthic foraminifera as bioindicators of heavy metal pollution in Lake Burullus, Egypt. Arab. J. Geosci. 2015, 8, 5491–5509. [Google Scholar] [CrossRef]
  39. Congalton, R.G. A Review Of Assessing The accuracy of classifications of remotely sensed data. Remote Sens. Environ. 1991, 37, 35–46. [Google Scholar] [CrossRef]
  40. Shaltout, K.H.; Al-Sodany, Y.M. Vegetation analysis of Burullus Wetland: A RAMSAR site in Egypt. Wetl. Ecol. Manag. 2008, 16, 421–439. [Google Scholar] [CrossRef]
  41. EVIS. ENVI User’s Guide; ITT Visual Information Solutions: Boulder, CO, USA, 2010. [Google Scholar]
  42. Chander, G.; Markham, B.L.; Helder, D.L. Summary of current radiometric calibration coefficients for Landsat MSS, TM, ETM+, and EO-1 ALI sensors. Remote Sens. Environ. 2009, 113, 893–903. [Google Scholar] [CrossRef]
  43. Jensen, J.R. Remote Sensing of the Environment: An Earth Resource Perspective; Pearson Prentice Hall: Upper Saddle River, NJ, USA, 2007. [Google Scholar]
  44. Berk, A.; Adler-Golden, S.; Ratkowski, A.; Felde, G.; Anderson, G.; Hoke, M.; Cooley, T.; Chetwynd, J.; Gardner, J.; Matthew, M. Exploiting MODTRAN Radiation Transport for Atmospheric Correction: The FLAASH Algorithm. In Proceedings of the Fifth International Conference on Information Fusion, Annapolis, MD, USA, 8–11 July 2002; pp. 798–803. [Google Scholar]
  45. Ball, G.H.; Hall, D.J. ISODATA, A Novel Method of Data Analysis and Pattern Classification; Stanford Research Institute: Menlo Park, CA, USA, 1965. [Google Scholar]
  46. Richards, J.A. Remote Sensing Digital Image Analysis: An Introduction; Springer: Berlin/Heidelberg, Germany, 2013; Volume 3. [Google Scholar]
  47. Eastman, J.R. Guide to GIS and Image Processing Volume 1; Clark University: Worcester, MA, USA, 2001. [Google Scholar]
  48. Ejiagha, I.R.; Ahmed, M.R.; Hassan, Q.K.; Dewan, A.; Gupta, A.; Rangelova, E. Use of remote sensing in comprehending the influence of urban landscape’s composition and configuration on land surface temperature at neighbourhood scale. Remote Sens. 2020, 12, 2508. [Google Scholar] [CrossRef]
  49. Popescu, C.A.; Herbei, M.V.; Sala, F. Remote sensing in the analysis and characterization of spatial variability of the territory. A study case in Timis County, Romania. Sci. Pap. Ser. Manag. Econ. Eng. Agric. Rural Dev. 2020, 20, 505–514. [Google Scholar]
  50. Ahmed, M.H.; El Leithy, B.M.; Thompson, J.R.; Flower, R.J.; Ramdani, M.; Ayache, F.; Hassan, S.M. Application of remote sensing to site characterisation and environmental change analysis of North African coastal lagoons. Hydrobiologia 2009, 622, 147–171. [Google Scholar] [CrossRef]
  51. Dobermann, A.; Ping, J.L.; Adamchuk, V.I.; Simbahan, G.C.; Ferguson, R.B. Classification of crop yield variability in irrigated production fields. Agron. J. 2003, 95, 1105–1120. [Google Scholar] [CrossRef] [Green Version]
  52. Anderberg, M.R. Cluster Analysis for Applications: Probability and Mathematical Statistics: A Series of Monographs and Textbooks; Academic Press: Cambridge, MA, USA, 2014; Volume 19. [Google Scholar]
  53. Panda, S.S.; Hoogenboom, G.; Paz, J. Distinguishing blueberry bushes from mixed vegetation land use using high resolution satellite imagery and geospatial techniques. Comput. Electron. Agric. 2009, 67, 51–58. [Google Scholar] [CrossRef]
  54. Johnson, B.A.; Jozdani, S.E. Confusion matrices help prevent reader confusion: Reply to Bechtel, B.; et al. A weighted accuracy measure for land cover mapping: Comment on Johnson et al. Local Climate Zone (LCZ) Map accuracy assessments should account for land cover physical characteristics that affect the local thermal environment. Remote Sens. 2019, 11, 2420. Remote Sens. 2020, 12, 6. [Google Scholar]
  55. Rajendran, S.; Nasir, S.; Al Jabri, K. Mapping and accuracy assessment of siltation of recharge dams using remote sensing technique. Sci. Rep. 2020, 10, 19. [Google Scholar] [CrossRef]
  56. Olofsson, P.; Foody, G.M.; Herold, M.; Stehman, S.V.; Woodcock, C.E.; Wulder, M.A. Good practices for estimating area and assessing accuracy of land change. Remote Sens. Environ. 2014, 148, 42–57. [Google Scholar] [CrossRef]
  57. Johnson, B.A.; Jozdani, S.E. Local Climate Zone (LCZ) Map accuracy assessments should account for land cover physical characteristics that affect the local thermal environment. Remote Sens. 2019, 11, 2420. [Google Scholar] [CrossRef] [Green Version]
  58. Sutton, K.; Fahmi, W. Cairo’s urban growth and strategic master plans in the light of Egypt’s 1996 population census results. Cities 2001, 18, 135–149. [Google Scholar] [CrossRef]
  59. International Data Base (Demographic Data) and Central Intelligence Agency. United Nations Data, World Population Prospects: The 2019 Revision. US Census Bureau; 2019. Available online: https://www.census.gov/popclock/world/eg#world-footer (accessed on 21 October 2020).
  60. Zedler, J.B.; Kercher, S. Wetland resources: Status, trends, ecosystem services, and restorability. Annu. Rev. Environ. Resour. 2005, 30, 39–74. [Google Scholar] [CrossRef] [Green Version]
  61. Rebelo, L.M.; McCartney, M.P.; Finlayson, C.M. Wetlands of Sub-Saharan Africa: Distribution and contribution of agriculture to livelihoods. Wetl. Ecol. Manag. 2010, 18, 557–572. [Google Scholar] [CrossRef]
  62. El-Reefy, H.I.; Badran, H.M.; Sharshar, T.; Hilal, M.A.; Elnimr, T. Factors affecting the distribution of natural and anthropogenic radionuclides in the coastal Burullus Lake. J. Environ. Radioact. 2014, 134, 35–42. [Google Scholar] [CrossRef] [PubMed]
  63. Zhang, J.Y.; Ma, K.M.; Fu, B.J. Wetland loss under the impact of agricultural development in the Sanjiang Plain, NE China. Environ. Monit. Assess. 2010, 166, 139–148. [Google Scholar] [CrossRef] [PubMed] [Green Version]
  64. Ondiek, R.A.; Vuolo, F.; Kipkemboi, J.; Kitaka, N.; Lautsch, E.; Hein, T.; Schmid, E. Socio-Economic Determinants of Land Use/Cover Change in Wetlands in East Africa: A Case Study Analysis of the Anyiko Wetland, Kenya. Front. Environ. Sci. 2020, 7, 16. [Google Scholar] [CrossRef]
  65. Isunju, J.B.; Kemp, J. Spatiotemporal analysis of encroachment on wetlands: A case of Nakivubo wetland in Kampala, Uganda. Environ. Monit. Assess. 2016, 188, 203. [Google Scholar] [CrossRef]
  66. Troy, B.; Sarron, C.; Fritsch, J.M.; Rollin, D. Assessment of the impacts of land use changes on the hydrological regime of a small rural catchment in South Africa. Phys. Chem. Earth 2007, 32, 984–994. [Google Scholar] [CrossRef]
  67. Watson, E.B.; Wigand, C.; Davey, E.W.; Andrews, H.M.; Bishop, J.; Raposa, K.B. Wetland Loss Patterns and Inundation-Productivity Relationships Prognosticate Widespread Salt Marsh Loss for Southern New England. Estuaries Coasts 2017, 40, 662–681. [Google Scholar] [CrossRef] [PubMed]
  68. Poulos, S.E.; Collins, M.B. Fluviatile sediment fluxes to the Mediterranean Sea: A quantitative approach and the influence of dams. Geol. Soc. Lond. Spec. Publ. 2002, 191, 227–245. [Google Scholar] [CrossRef]
  69. Elkafrawy, S.B.; Basheer, M.A.; Mohamed, H.M.; Naguib, D.M. Applications of remote sensing and GIS techniques to evaluate the effectiveness of coastal structures along Burullus headland-Eastern Nile Delta, Egypt. Egypt. J. Remote Sens. Space Sci. 2020, 24, 247–254. [Google Scholar] [CrossRef]
  70. Crossland, C.J.; Kremer, H.H.; Lindeboom, H.; Crossland, J.I.M.; Le Tissier, M.D. Coastal Fluxes in the Anthropocene: The Land-Ocean Interactions in the Coastal Zone Project of the International Geosphere-Biosphere Programme; Springer: Berlin/Heidelberg, Germany, 2005. [Google Scholar]
  71. Rateb, A.; Abotalib, A.Z. Inferencing the land subsidence in the Nile Delta using Sentinel-1 satellites and GPS between 2015 and 2019. Sci. Total Environ. 2020, 729, 138868. [Google Scholar] [CrossRef]
  72. Shalby, A.; Elshemy, M.; Zeidan, B.A. Assessment of climate change impacts on water quality parameters of Lake Burullus, Egypt. Environ. Sci. Pollut. Res. 2020, 27, 32157–32178. [Google Scholar] [CrossRef]
  73. Shaban, M.; Farag, H.N. Data driven water quality modeling for drain/canal inflows to Lake Burullus. Ain Shams Eng. J. 2018, 9, 3197–3205. [Google Scholar] [CrossRef]
  74. Delaune, R.D.; Nyman, J.A.; Patrick, W.H. Peat Collapse, Pending And Wetland Loss In A Rapidly Submerging Coastal Marsh. J. Coast. Res. 1994, 10, 1021–1030. [Google Scholar]
  75. Charles, S.P.; Kominoski, J.S.; Troxler, T.G.; Gaiser, E.E.; Servais, S.; Wilson, B.J.; Davis, S.E.; Sklar, F.H.; Coronado-Molina, C.; Madden, C.J.; et al. Experimental Saltwater Intrusion Drives Rapid Soil Elevation and Carbon Loss in Freshwater and Brackish Everglades Marshes. Estuaries Coasts 2019, 42, 1868–1881. [Google Scholar] [CrossRef]
  76. Best, U.S.N.; Van der Wegen, M.; Dijkstra, J.; Willemsen, P.; Borsje, B.W.; Roelvink, D.J.A. Do salt marshes survive sea level rise? Modelling wave action, morphodynamics and vegetation dynamics. Environ. Modell. Softw. 2018, 109, 152–166. [Google Scholar] [CrossRef]
  77. Reed, D.; Wang, Y.; Meselhe, E.; White, E. Modeling wetland transitions and loss in coastal Louisiana under scenarios of future relative sea-level rise. Geomorphology 2020, 352, 106991. [Google Scholar] [CrossRef]
  78. Stanley, J.-D.; Clemente, P.L. Increased land subsidence and sea-level rise are submerging Egypt’s Nile Delta coastal margin. GSA Today 2017, 27, 4–11. [Google Scholar] [CrossRef] [Green Version]
  79. Said, T.O.; El Moselhy, K.M.; Rashad, A.A.M.; Shreadah, M.A. Organochlorine contaminants in water, sediment and fish of Lake Burullus, Egyptian Mediterranean Sea. Bull. Environ. Contam. Toxicol. 2008, 81, 136–146. [Google Scholar] [CrossRef] [PubMed]
  80. Younis, A.M. Environmental impacts on Egyptian Delta Lakes’ biodiversity: A case study on Lake Burullus. In Egyptian Coastal Lakes and Wetlands: Part II; Springer: Berlin/Heidelberg, Germany, 2018; pp. 107–128. [Google Scholar]
  81. Ali, E.M. Impact of drain water on water quality and eutrophication status of Lake Burullus, Egypt, a southern Mediterranean lagoon. Afr. J. Aquat. Sci. 2011, 36, 267–277. [Google Scholar] [CrossRef]
  82. Baldwin, A.H. Nitrogen and Phosphorus Differentially Affect Annual and Perennial Plants in Tidal Freshwater and Oligohaline Wetlands. Estuaries Coasts 2013, 36, 547–558. [Google Scholar] [CrossRef]
Figure 1. Study-site map showing Lake Burullus among northern Egyptian lakes (A) with ground-truth locations (red dots in panel C), while panel B is an inset showing the outlined location of Egypt in Africa (B). The Landsat 8 Operational Land Imager (OLI) satellite image for Lake Burullus (C) is dated 28 July 2020 (Red: band 7, Green: band 5, and Blue: band 3). Map produced in ArcMap 10.4.
Sustainability 14 04980 g001
Figure 2. Comparison of ISODATA cluster land-use classification of Lake Burullus for Landsat 5 TM images on 28 July 1985 (A,B); 21 July 2000 (C,D), and Landsat 8 OLI image on 28 July 2020 (E,F).
Sustainability 14 04980 g002
Figure 3. Change in land use of classified images (AH) produced with ENVI density-slice function for Landsat 8 image (RGB = Landsat Band 6, 5, 4) of Lake Burullus from May to November 2013. (green: marsh; black: water; and white: non marsh area).
Sustainability 14 04980 g003
Figure 4. Change-detection maps produced with ENVI change-detection function showing marsh loss and gain from May through November 2013 (AG) for Landsat 8 image (RGB = Landsat Band 6, 5, 4) of Lake Burullus. Red represents increase in marsh vegetation and blue represents a decrease in marsh vegetation (i.e., an increase in water).
Sustainability 14 04980 g004
Figure 5. Percent change (%) in lake pixels classified as marsh vegetation and water for Lake Burullus.
Sustainability 14 04980 g005
Table 1. Total percent loss or gain for different land-use classes of Lake Burullus resulting from ISODATA cluster classification for Landsat 5 TM and 8 OLI satellite imagery from July 1985 to 2020.
Land-Use ClassificationLandsat 5 TM
28 July 1985
Landsat 5 TM
21 July 2000
Landsat 8 OLI
28 July 2020
%
Number of PixelsArea km2Number of PixelsArea km2Number of PixelsArea km2% Loss (−) or Gain (+) Since 1985% Loss (−) or Gain (+) Since 2000
Water286,073257.5301,855271.7443,251398.954.946.8
Marsh372,853335.6366,309329.7205,903185.3−44.8−43.8
Unvegetated lands109,63398.756,75851.130,76227.7−71.9−45.8
Agricultural lands and/or fish farms----43,62139.388,63979.8--103.2
Total area km2691.7691.7691.7----
Table 2. Accuracy assessment and confusion matrix of ISODATA algorithms for Landsat 8 OLI classified images.
Land-Use Classification Reference WaterReference MarshReference
Unvegetated Lands
Reference Agricultural Lands and/or Fish FarmsTotal
Points
Water4200244
Marsh0420143
Unvegetated lands0040141
Agricultural lands and/or fish farms0023840
Total pixels42424242--
Producer’s accuracy (%)100.0100.095.290.5--
User’s accuracy (%)95.597.797.695.0--
Overall classification accuracy (%)96
Kappa coefficient0.95
Publisher’s Note: MDPI stays neutral with regard to jurisdictional claims in published maps and institutional affiliations.

