Review

Bibliometric Analysis of Data Sources and Tools for Shoreline Change Analysis and Detection

1
Geography Department, Faculty of Arts and Humanities, University of Porto, Via Panorâmica Edgar Cardoso, 4150-564 Porto, Portugal
2
Research Centre for Territory, Transports and Environment (CITTA), Rua Dr. Roberto Frias s/n, 4200-465 Porto, Portugal
3
Centre of Studies in Geography and Spatial Planning (CEGOT), Via Panorâmica Edgar Cardoso, 4150-564 Porto, Portugal
*
Author to whom correspondence should be addressed.
Sustainability 2022, 14(9), 4895; https://doi.org/10.3390/su14094895
Submission received: 18 March 2022 / Revised: 11 April 2022 / Accepted: 14 April 2022 / Published: 19 April 2022
(This article belongs to the Special Issue Modelling for Sustainable Marine Management)

Abstract

:
The world has a long record of shoreline and related erosion problems due to the impacts of climate change/variability in sea level rise. This has made coastal systems and large inland water environments vulnerable, thereby activating research concern globally. This study is a bibliometric analysis of the global scientific production of data sources and tools for shoreline change analysis and detection. The bibliometric mapping method (bibliometric R and VOSviewer package) was utilized to analyze 1578 scientific documents (1968–2022) retrieved from Scopus and Web of Science databases. There is a chance that in the selection process one or more important scientific papers might be omitted due to the selection criteria. Thus, there could be a bias in the present results due to the search criteria here employed. The results revealed that the U.S.A. is the country with the most scientific production (16.9%) on the subject. Again, more country collaborations exist among the developed countries compared with the developing countries. The results further revealed that tools for shoreline change analysis have changed from a simple beach transect (0.1%) to the utilization of geospatial tools such as DSAS (14.6%), ArcGIS/ArcMap (13.8%), and, currently, machine learning (5.1%). Considering the benefits of these geospatial tools, and machine learning in particular, more utilization is essential to the continuous growth of the field. Found research gaps were mostly addressed by the researchers themselves or addressed in other studies, while others have still not been addressed, especially the ones emerged from the recent work. For instance, the one on insights for reef restoration projects focused on erosion mitigation and designing artificial reefs in microtidal sandy beaches.

Graphical Abstract

1. Introduction

Coastal systems and large inland water environments are under threat of climate change/variability and sea level rise. Several research studies have stressed the impacts of climate change, climate variability (extreme events) and sea level rise on global shorelines and related erosion [1,2,3]. The situation is further aggravated by the current anthropogenic pressure (urbanization) [4]. As reiterated by Ware et al. [5], human settlement has always been concentrated along the coast and large inland waterbodies. This assertion was earlier stressed by Blackburn et al. [6], who reported that 16 of the world’s megacities are found within coastal regions and large deltas. A recent study by Bamunawala et al. [7] projected that the collective impacts of climate change (sea level rise, temperature, and precipitation) and anthropogenic influences (urbanization) will cause 90% of global shorelines to retreat.
A shoreline is the point of the physical border between land and water [8]. While this definition looks simple, it is indeed challenging in its practical application [9]. The position of the shoreline changes through time due to cross-shore and alongshore sediment movement in the littoral zone, and through changes in water levels [9,10]. The temporal nature and time scale of shorelines must, therefore, be considered in shoreline investigation [9,10]. An understanding of the temporal and time scales in shoreline position is essential for science, engineering, and coastal managers [11]. Shoreline position detection is, thus, important especially considering the long history of human habitation of the coast and the banks of large waterbodies and their recent adaptation [10]. This has meant that the term shoreline change is not limited to only the coast but encompasses lake and lagoon environments as well [12,13,14]. Credit in this sense, should, thus, be given to earlier geoscientists such as Carr [15], de Boer and Carr [16], El-Ashry and Wanless [17], and Gulliver [18], whose work contributed to the advancement of information on shoreline change.
The term shoreline was used in the 1800s [18], while the term shoreline change appeared in the 1960s [17]. However, the combined term shoreline change analysis first appeared in the scientific articles in the late 1970s [19]. During this time, computations and the development of diverse geospatial tools including aerial photography, satellite imagery, and Light Detection and Ranging (LiDAR) were made to formalize the shoreline change analysis process. As reiterated by Burningham and Fernandez-Nunez [10], the awareness about coastal hazards and risks such as shoreline recession and their impacts on coastal inhabitants increased during this time.
The changing nature of the shoreline position drew the attention of coastal researchers to develop and adopt shoreline indicators. As emphasized by Boak and Turner [9], shoreline indicator is utilized as a proxy to show shoreline position. Boak and Turner [9] classified shoreline indicators into 3 groups. Group 1included those indicators that are based on visible coastal features (e.g., an earlier high-tide line or the wet/dry boundary). Studies such as Boye, et al. [20] and Mahapatra, et al. [21] employed these indicators. Group 2 was based on tidal data (e.g., mean high water or mean sea level) with studies such as Crapoulet et al. [22] and Moore et al. [23] utilizing these indicators. Group 3 was based on the application of image processing skills to extract proxy shoreline characteristics. Studies such as Luijendijk et al. [24] and Vos et al. [25] have employed the third indicator. Studies such as Pollard et al. [26] and Salmon et al. [27] have also utilized a combination of the three indicators.
There exist several sources of data for shoreline change analysis. However, the choice of data usage is dependent on availability [9]. Data are, thus, sourced from historical land-based photographs, coastal maps and charts, aerial photography, beach surveys, Global Positioning System (GPS), remote sensing, Multispectral/hyperspectral imaging, Airborne Light Detection and Ranging technology (LiDAR), microwave sensors, and video imaging [9]. It must be stated that each of these sources has strengths and weaknesses (see Boak and Turner [9]). The use of the Unmanned Aerial Vehicle (UAV) to source data for shoreline change analysis has gained popularity in recent times [28].
Tools used for shoreline change analysis differ. Previous shorelines change analyses were simple, as they were made by directly comparing already existing maps [10]. This period gave little or no room for accuracy and uncertainty estimates. This method of shoreline change analysis changed entirely during the 1970s due to the advancement in computer technology and the related Geographic Information System (GIS). This period allowed for the combination of diverse data types, the ability to scale, and correct geospatial elements and digitize shorelines, which transformed shoreline change analysis into a more computational perspective [10]. An earlier tool for shoreline change analysis was the Coastal Feature Mapping system developed by Underwood and Anders [29]. This tool estimates position coordinates (X and Y) through varying ground control points and finally plots multiple shoreline maps for estimating change rates [29]. Again, the Digital Shoreline Analysis System (DSAS) was developed by the United States Geological Survey (USGS). Since its original development in the early 1990s, the DSAS has undergone a series of enhancements. The first version (V.1.0) was created in 1992 by Danforth and Thieler [30], the second (V.2.0) in 2003 by Thieler et al. [31], the third version (V.3.0) in 2005 by Thieler et al. [32], the fourth version (V.4.0) in 2009 by Thieler, et al. [33], and the fifth in 2018 consisting of versions (V.5.0 and V.5.1) by Himmelstoss et al. [34,35].
The high utilization of the DSAS software is due to its easy incorporation into ArcGIS/ArcMap. This has made its utilization in shoreline change research undoubtable [36,37]. However, other GIS software such as the QGIS has also received attention in recent times. As reiterated by Burningham and Fernandez-Nunez [10], researchers nowadays use the QGIS to generate a shoreline database and create shapefiles or other form of geospatial files and import them into programming environments such as Python, MATLAB, or R, to perform shoreline change analysis. Studies such as De Lima et al. [38] and Griffiths et al. [39] have used QGIS in assessing shoreline change. Tools such as the AMBUR and the Open Digital Shoreline Analysis System (ODSAS) have also been widely recognized due to their capabilities in estimating coastal variations [40,41,42]. Additionally, the utilization of models and algorithms has increased in recent times, and this has provided a place for machine learning in shoreline change analysis [43,44,45].
There exist several research studies on shoreline change analysis and detection. Many of which are either an original article (e.g., Moore et al. [23], Vos et al. [25], Santos et al. [37], Castelle et al. [46], and Yadav et al. [47]) or review the literature (e.g. Boak and Turner [9], Apostolopoulos and Nikolakopoulos [48], and Parthasarathy and Deka [49]). As research continues to grow, it is worthwhile to understand the current state of global scientific production on the subject. So far, little or no studies have attempted anything in this regard. It is, therefore, important to utilize the bibliometric method, which can chart the history of publications and the development of scientific output on the subject [50]. The bibliometric approach uses statistical and mathematical techniques to analyze scientific publications. As reiterated by Aria, et al. [51], the bibliometric approach can be used to analyze the contributions of authors, journals, and countries to a research field. The bibliometric approach can also map out clearly important themes and reveal gaps in a particular field of study [52].
The bibliometric approach has been utilized by many authors in different fields [53,54,55,56]. However, in the field of shoreline change analysis and detection, it is less utilized. To the best of our knowledge, it is only Mishra et al. [36] who has performed a bibliometric analysis on shoreline change analysis. However, the researchers only focused on the development of the DSAS tool and did not attempt to observe the progress on data sources (methods) and other important tools for shoreline change analysis and detection. The present study thus builds on these, and extends them to include developments in data sources (methods) and tools for shoreline change analysis and detection. This study performed bibliometric analysis of data sources (methods) and tools for shoreline change analysis and detection. The following objectives were, therefore, studied: data sources (methods) for shoreline change analysis and publication growth and the critical assessment of the tools for shoreline change analysis and detection. As the global sea level continues to rise under a changing climate [1,2,57,58], information on shoreline change analysis through research is essential. This research, therefore, does not stand to benefit only coastal communities and coastal engineers or planners, but also provides understanding of the existing body of literature on shoreline change analysis and detection, which will assist potential research.

2. Materials and Methods

2.1. Search and Selection Process

This study retrieved scientific documents on data sources (methods) and tools for shoreline change analysis and detection from Scopus (Elsevier) and Web of Science (WoS) (Clarivate Analytics) databases. These two databases were chosen because they cover broad scientific disciplines and are also seen as the largest abstract and citation databases for scientific documents [59]. Several studies (e.g., Lima and Bonetti [60] and Pathmanandakumar, et al. [61]) have stressed the difficulties of merging two databases for bibliometric analysis and, thus, use a single database. This study, however, made efforts to integrate the Scopus and the Wos databases (see Supplementary Material Table S1 for details of the merging procedure). The usage and integration of both databases in this study helped to reduce the risk of losing important documents on data sources (methods) and tools for shoreline change analysis and detection.
The authors met and discussed a range of keywords related to data sources (methods) and tools for shoreline change analysis and detection. A search for relevant documents in both databases was, therefore, performed. The functions Title, Abstract, Keywords (TITLE-ABS-KEY), and Topic (TS) for Scopus and WoS, respectively, were employed in the documents search. To include all relevant documents, the search combined Boolean operators such as ‘AND’ and ‘OR’ with the search terms (Table 1).
The study placed no restriction on the publication years, document types, languages, and subject/research areas. A total of 2516 and 1405 documents were found in Scopus and WoS, respectively. Documents selection criteria were applied to titles and abstracts. The study centered its exclusion criteria based on the inclusion of data sources (methods) and tools for shoreline change analysis and detection. This made sure that only studies on data sources (methods) and tools for shoreline change analysis and detection were included. After reading through the titles and abstracts, a total of 1453 and 762 studies were found that were eligible in Scopus and WoS, respectively. Eligible studies in both databases were first exported in BibTeX format and later the Plain Text format for WoS (see Supplementary Material Table S1). These formats aided the merger of the two databases in the bibliometric R and the Visualization of Similarities (VOSviewer) package. In this regard, 637 duplicates were identified and removed by the bibliometric R package. In total, 1578 documents (Table 2) were deemed eligible and were utilized in the study. The documents retrieved from both databases covered 5 decades (1968–2022).

2.2. Bibliographic Mapping

The study employed bibliographic mapping methods (quantitative approaches) to visualize the global scientific production on data sources (methods) and tools for shoreline change analysis and detection through the usage of bibliographic data [50]. Data analysis was, thus, performed through the utilization of the bibliometric R package (version 2.2.0) [50], while data visualization was performed through the VOSviewer software (1.6.17) [51]. The study used the bibliometric R package because of its capability of creating various possibilities for data analyses [62]. This package, thus, gives an order of actions for bibliographic data importation for bibliometric analyses and provides assumptions on statistics including citations and keywords. The VOSviewer, an open bibliometric visualizer, can analyze large data sets and create insightful images that help data analysis [63]. The bibliometric analysis in this study placed emphasis on the global intellectual construction surrounding shoreline change analysis and detection and the applicable data sources (methods) and tools. This was, therefore, realized by carrying out analysis such as keyword and citation. Keyword analysis helped in the explanation of the nature of the networks and concepts utilized by authors. Analysis performed in this regard was focused on the co-occurrences of keywords. Citation analysis was also useful in detecting relevant authors. In addition, country analysis was essential and helped to understand the most prominent and productive countries that published scientific documents on data sources (methods) and tools for shoreline change analysis and detection. Analysis was further performed to understand the thematic progress and the direct citation analysis of data sources (methods) and tools for shoreline change analysis and detection.

3. Results

3.1. Scientific Mapping

3.1.1. Publication Trends in Data Sources (Methods) and Tools for Shoreline Change Analysis and Detection

Figure 1 shows the annual publication distribution of data sources (methods) and tools for shoreline change analysis and detection globally between 1968 and 2022. Although shoreline studies established itself in the 1800s [18], it is clear from Figure 1 that studies on data sources and tools for shoreline change analysis and detection appeared in the scientific journal in 1968. The scientific production has, since then, increased exponentially and has seen an annual percentage growth rate of 8.01%. A critical look at Figure 1 indicates that the year 2021 recorded the highest (202) number of publications, followed by 2020 (178), while the lowest (1) was recorded in the years 1968, 1971, 1972, 1980, 1983, and 1984. The year 2022 has a total of 32; however, it must be noted that a databases search for published articles for the year 2022 only captured the months of January and February. A total of 32 publications for one and half months, therefore, shows a promising scientific production, and this study believes that the total number of publications for the year 2022 will surpass that of 2021 as the highest as per this analysis. The percentage growth rate of 8.01% indicates the fast-changing shorelines and the impact of this globally. This echoed an increasing concern among the scientific community to realize the fundamental processes of shoreline change in order to plan for the appropriate adaptation and mitigation measures. (A list of all the studies (1578) used for the analysis carried out in the present study can be found in Supplementary Material Table S2.

3.1.2. Most Relevant Sources in Data Sources and Tools for Shoreline Change Analysis and Detection

Table 3 shows the top-20 most relevant journals in data sources and tools for shoreline change analysis and detection. From Table 3, the majority of the documents (192) were published in the Journal of Coastal Research, followed by Remote Sensing (46), while Marine Geodesy (15) is the lowest.

3.1.3. Most Relevant Authors in Data Sources and Tools for Shoreline Change Analysis and Detection

Table 4 shows the 20 most relevant authors in data sources and tools for shoreline change analysis and detection. From Table 4, Zhang Y is recognized as the most relevant author on the subject, while Misria A takes the last spot among the top 20 considering the fractionalized articles of the authors. It must be stated that articles fractionalized of the individual authors represents a fraction of their co-authored publications.

3.2. Country Analysis

3.2.1. Most Productive Countries

Figure 2 shows a summary of the most productive countries that have contributed to scientific production on data sources and tools for shoreline change analysis and detection. The study places emphasis on the 20 most productive countries. Among the top 20, the United States of America (U.S.A.) is the country with the most scientific production (267), followed by India (191), while there is a tie between Poland and Portugal for the lowest (20) among the top 20. It must be stated that country ranking is centered on the first author’s affiliation.

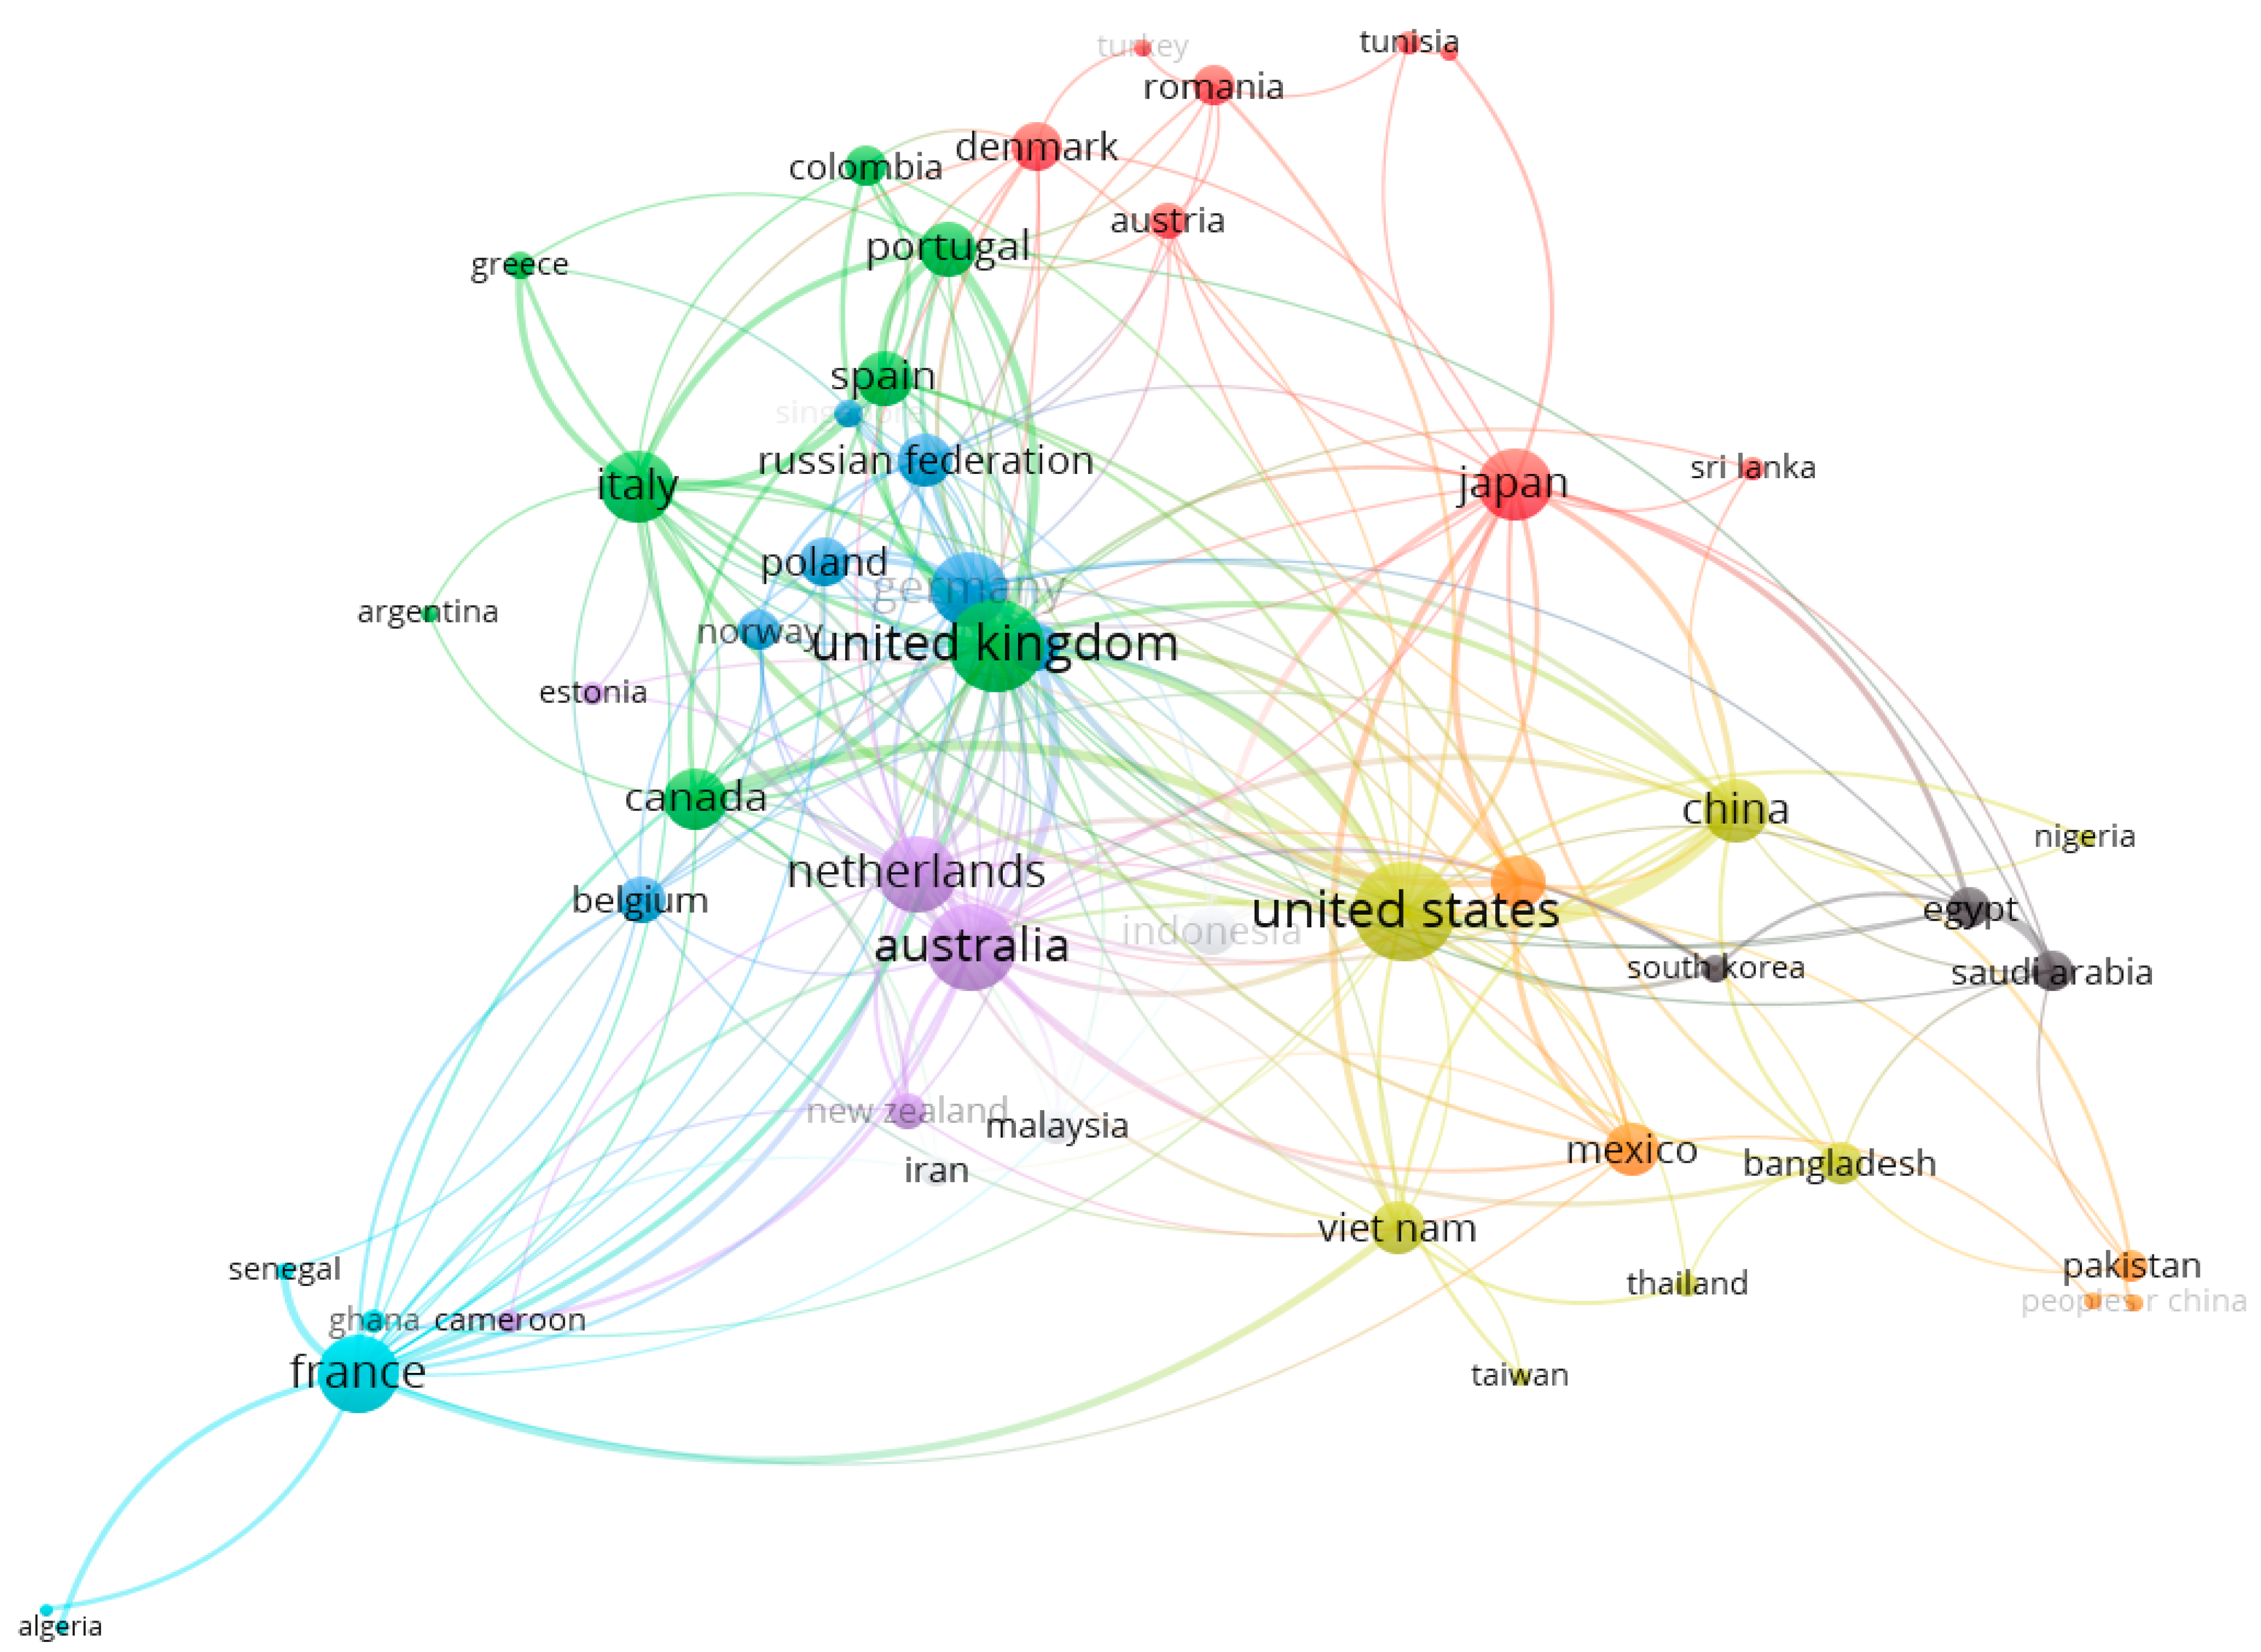
3.2.2. Country Collaborative Analysis

In this analysis, the VOSviewer software was utilized to map and visualize the collaboration network among countries and their published scientific documents. Here, the default setting (a threshold of the minimum number of 5 documents of a country) was maintained. The study did not change this default setting, as a minimum of 5 documents gives a strong indication of a country’s commitment to collaborate with other countries. Of the 282 countries identified, 51 met the threshold. The 51 countries were grouped into 9 clusters with links (221) and total link strength (474). It must be stated that, a stronger collaboration between countries is identified by the links and the total link strength.
From Figure 3, the yellow color with U.S.A. and China is recognized as the countries with the greatest collaborations. The second is the green color, consisting of countries such as the United Kingdom and Italy. The third is the violet color containing countries such as Australia and the Netherlands. France and Ghana, in a light blue color, pick up the fourth position. The blue color containing countries such as Germany and Brazil is seen as fifth. Following this is the red color, with countries such as Japan and Denmark. India and Mexico, in a light brown color, pick up the seventh spot. Indonesia and Malaysia in a white color are eighth, and Egypt and Saudi Arabia in a black color pick up the last place.

3.3. Keywords Analysis

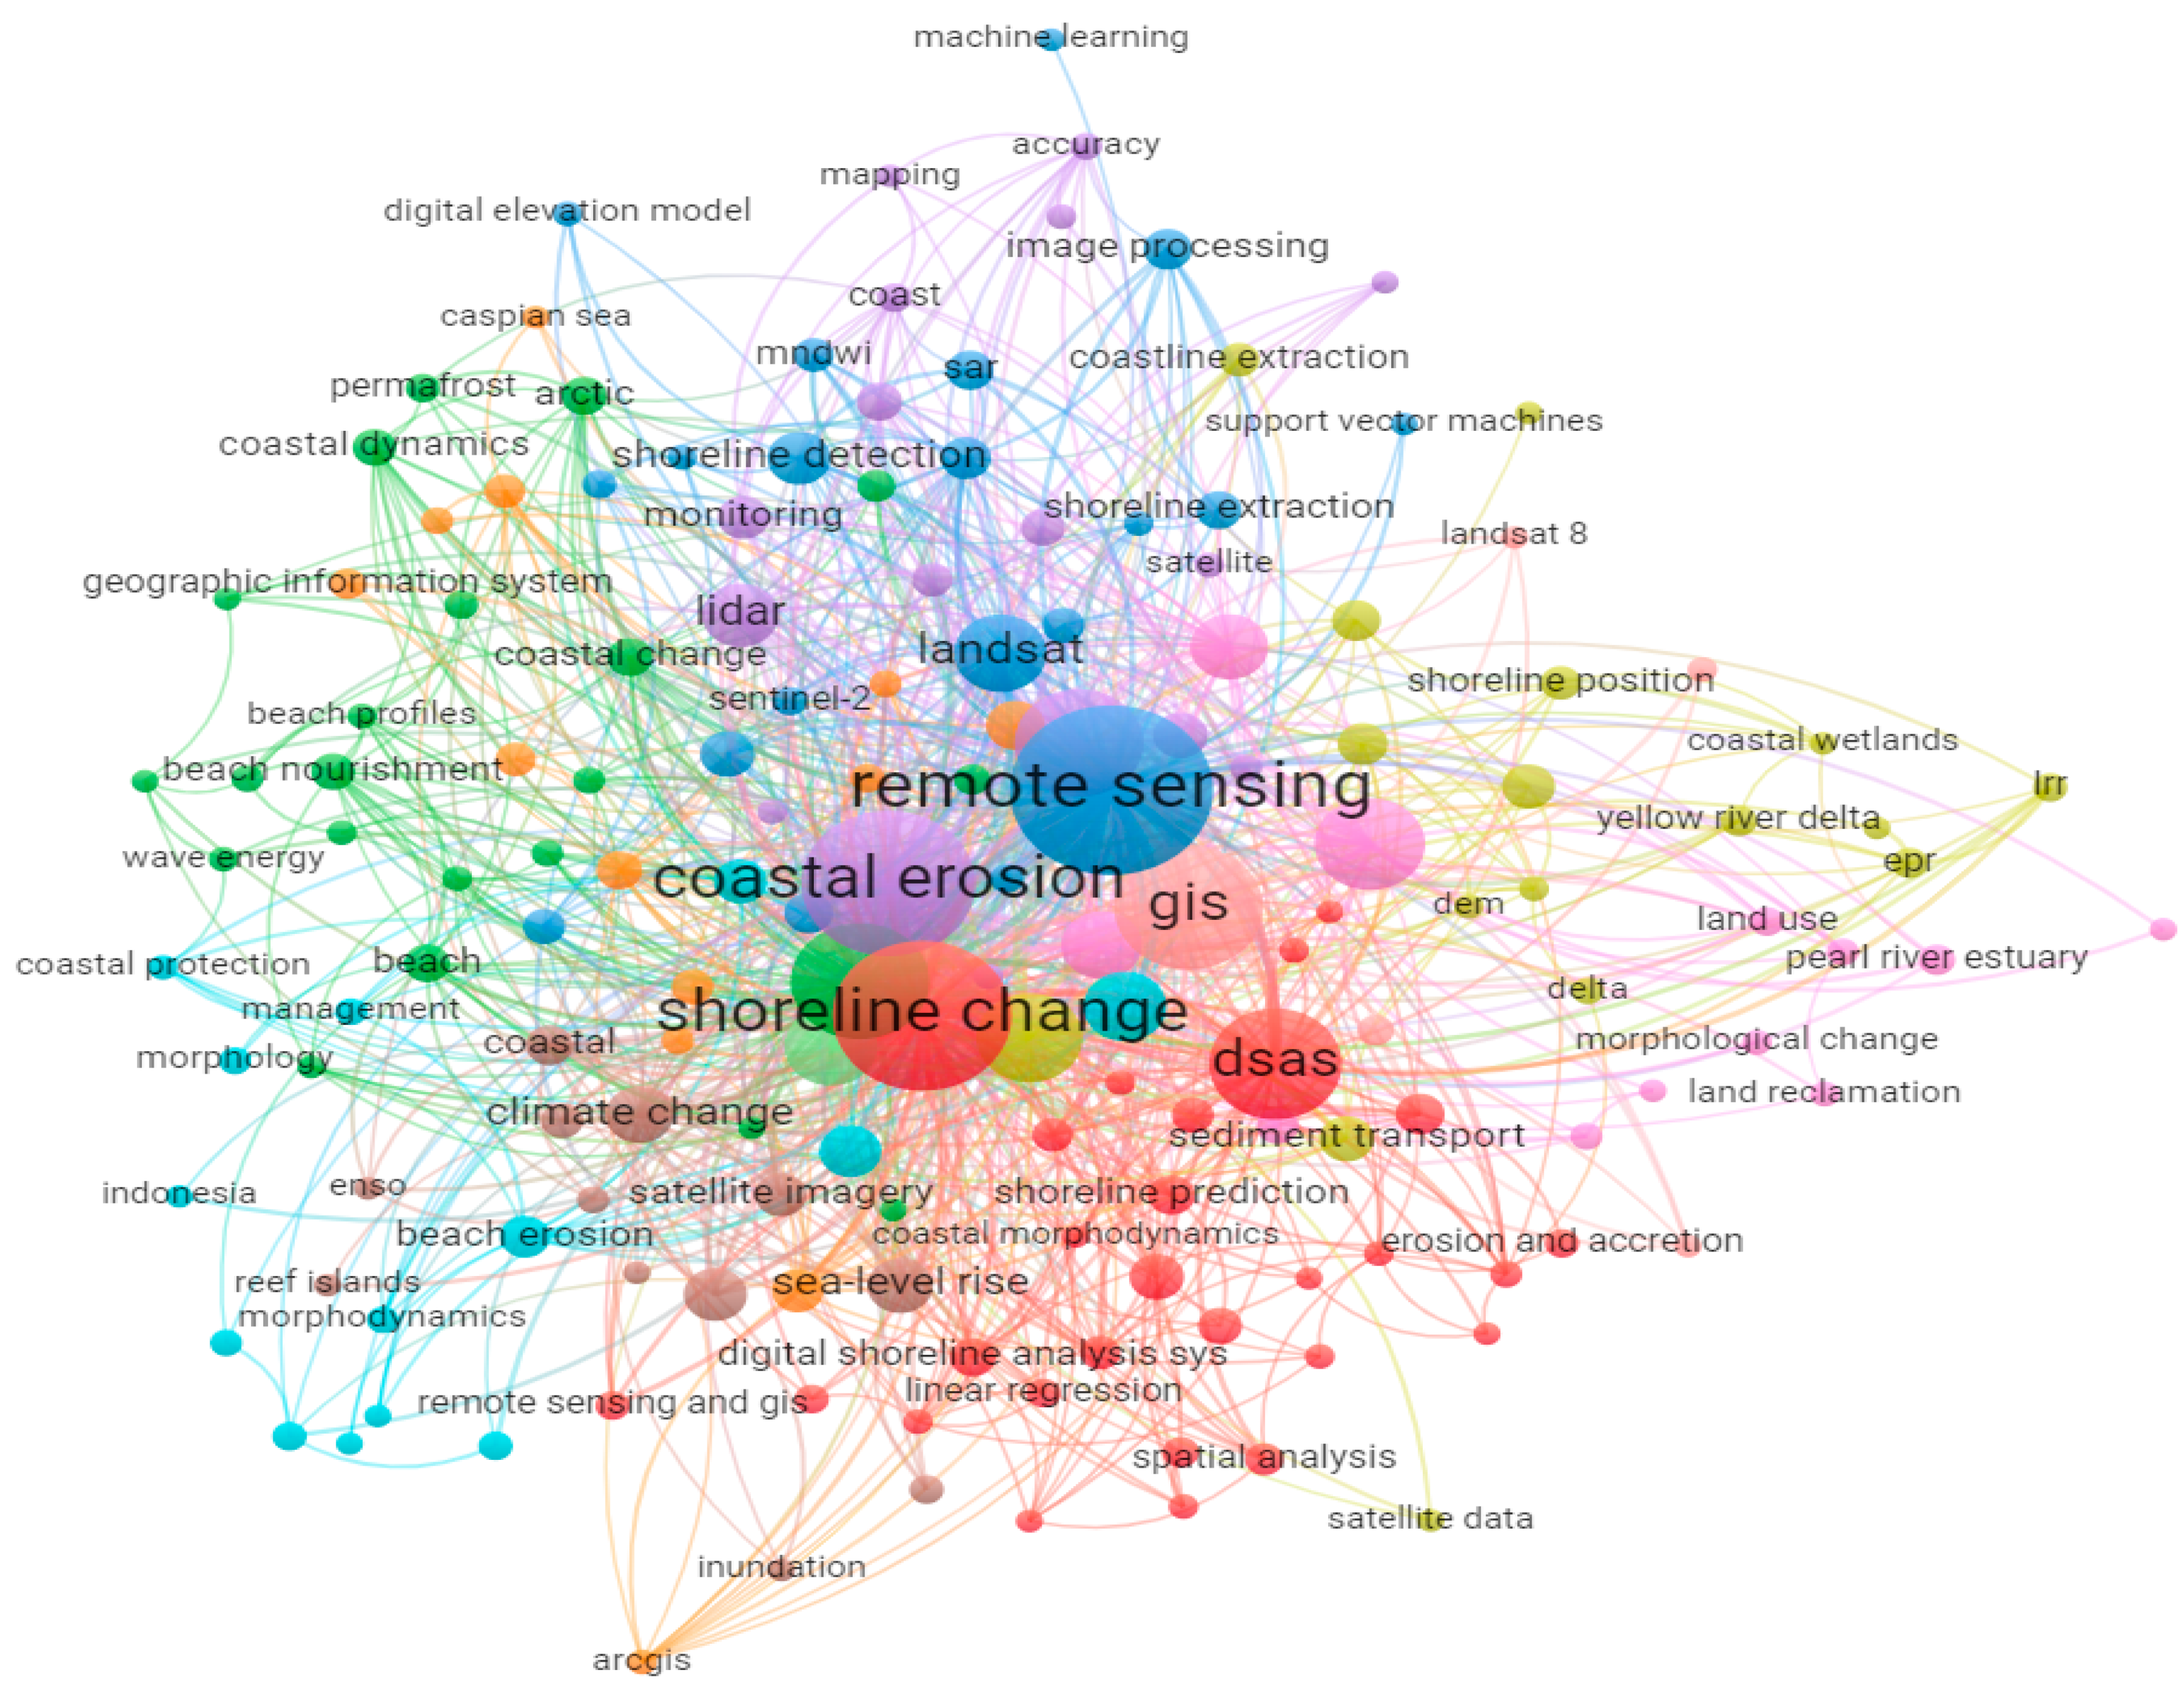
Keywords Co-Occurrence Analysis

Analysis was performed on keywords co-occurrence as shown on Figure 4. Keywords were retrieved from the titles and abstracts of the 1578 documents analyzed in the present study. The VOSviewer software was once again used in this analysis. Over here, the default setting (a threshold of the minimum number of 5 occurrences of a keyword) was maintained. The study believed that the occurrence of a keyword 5 times indicates the importance keyword to the subject. Of the 3146 keywords, 161 meet the threshold. In all, 11 clusters with links (1503) and total link strength (3161) were identified and examined based on the total link strength approach. Of these 11 clusters, 7 are of major dimensions and indicate greater co-occurrence of the resultant keywords in either the titles or abstracts (Figure 4). Clusters in circles are depicted by diverse colors and dimensions.
Of these 7 major clusters, the blue color containing keywords such as remote sensing and Landsat is the first and the most co-occurred keywords. The second is seen in the red color with keywords such as shoreline change and DSAS. The third occurred in the purple color with keywords like coastal erosion and shoreline. The green color makes the fourth and have keywords such as erosion and beach. Keywords such as GIS and Landsat 8 in the pink color make the fifth most co-occurred. The yellow color containing keywords like shoreline changes/position and coastline changes/extraction is the sixth, while the black color with keywords like coastline and shoreline protection is the less co-occurred.

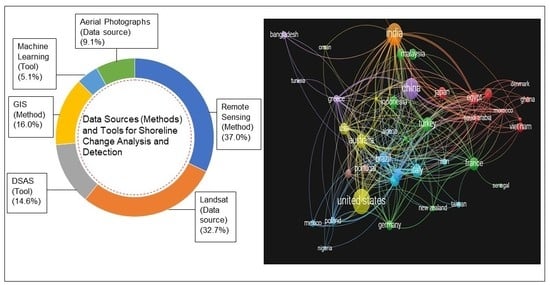
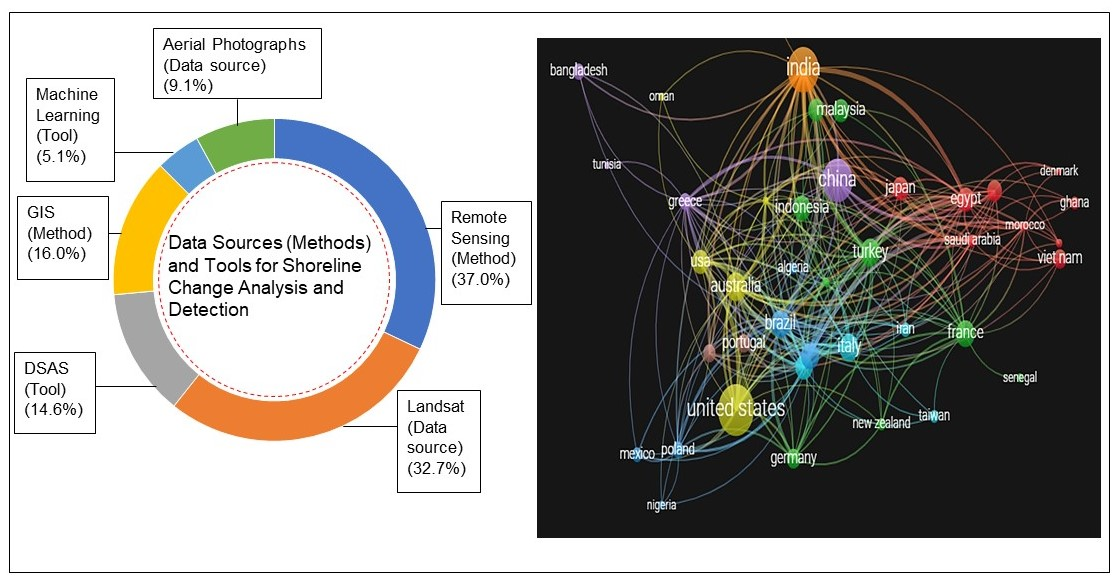
3.4. Data Sources (Methods) and Tools for Shoreline Change Analysis and Detection

Figure 5a–c show the data sources, methods, and tools used in shoreline change analysis and detection. Figure 5a shows that Landsat (516 studies) is the most utilized data source for research on the subject, followed by the combination of multiple (425) data sources, while the least utilized includes the Global Navigation Satellite system (GNSS), the MODIS, Pléiades, and QuickBird (1) satellite imageries. From Figure 5b, the majority of the studies on the subject employ remote sensing methods (578 studies), while the photo interpretation method (1) is the least utilized method. From Figure 5c, the majority (968 studies) did not indicate any specific tool, followed by the DSAS tool (231) and the ArcGIS/ArcMap (218). The least (1) utilized tools include the beach transect the, Coastal Analyst System from Space Imagery Engine (CASSIE), CoastSat, IDRISI, Intergraph, LaeNet, Spatial analysis of coastal risks (MAp-RISC), Spreadsheet Mapper, SPSS, and VEdge_Detector.

3.5. Thematic Progression Analysis

Figure 6 depicts the main research topics based on the global scientific publication of the subject matter of data sources and tools for shoreline change analysis and detection. Placing emphasis on relevant degrees (centrality) (horizontal axis) and development degrees (density) (vertical axis), a four-topic quadrant is identified [64]. It is worth noting that the sizes of the circles in the individual quadrants are relative to the number of documents and are equal to each keyword.
Topics found in the upper-right quadrant (motor themes) reveal the hot topics and indicate greater density and stronger centrality. Topics in this quadrant are highly noticeable concepts that are relevant and related directly to other conceptual topics. Topics found in the lower-right quadrant (basic themes) depict important keywords in the data sources and tools for shoreline change analysis and detection as a research area but are not advanced. Again, topics in the upper-left quadrant (niche/specialized themes) are highly engaged and show highly improved internal links but slight external links. Additionally, topics located in the lower-left quadrant (emerging or declining themes) describe themes as less advanced with minimal centrality and density. Coastal erosion is observed as the hot topic on the subject. This topic has higher density and stronger centrality and relates well with other conceptual themes. Basic topics on data sources and tools for shoreline change analysis and detection studies include erosion and shoreline change. Niche topics comprise shoreline evolution and coastal management, while remote sensing is recognized as an emerging topic.

3.6. Direct Citation Analysis

Figure 7 depicts the intellectual structure portrayed through a historical direct citation network. As reiterated by Borgman and Furner [65], the historical direct citation denotes a sequential map of the most important citations arising from a bibliographic database. Relevance in this sense is not only given to the authors, but also the topics of interest on the subject and the related discussion that researchers bring up. A summary of data sources and tools for shoreline change analysis and detection is displayed in Supplementary Material Table S3. From Figure 7, 9 clusters are identified, and these show the articles that have direct citation. A thorough review of the historical direct citation was undertaken to trace the subject’s information. The 3 earliest and the 3 latest publications in the clusters are reported. For some clusters, however, either the earliest or the latest publication was reported depending on the number of direct citations in that cluster.
As shown in Figure 7, a direct citation in the field emerged in 1984 (blue colored cluster) by the work of Jantunen and Raitala [66]. The study used multitemporal Landsat data to locate shoreline changes in the Porttipahta Finland water reservoir. Three other studies directly cited this study (Figure 7; 3 direct lines), and it was also cited afterwards by Eliot and Clarke [67] and Chen [68]. Generally, the studies’ central focus was on shoreline change detection. Works in this cluster employed diverse approaches, such as remote sensing techniques (multitemporal Landsat satellite data) used by Jantunen and Raitala [66] to locate shoreline changes in the Porttipahta Finland water reservoir, the use of beach survey records to evaluate temporal and spatial bias in the estimation of shoreline rate of change statistics from beach survey information by Eliot and Clarke [67], the use of remote sensing (multi-temporal satellite images-SPOT) to detect shorelines changes for tideland areas by Chen [68], the use of field measurements and remote sensing (Landsat images) to analyze the influence of climatic variations on river delta hydrodynamics and morphodynamics by da Silva et al. [69], the utilization of remote sensing and GIS (RapidEye images and DSAS) to evaluate sedimentary balance and morphological changes observed in Pecém Port in Brazil by Duarte et al. [70], and remote sensing and GIS (Landsat images, DSAS) to observe a bimodal climate control of shoreline change by Kelly et al. [71]. The works in this cluster stated varying outcomes including the importance of using digital Landsat data to generate information about environmental changes in reservoir areas, variations in the trends of short term beach surveys (5-year records), detection of error in sand barriers tests, greater changes occurring westwards from the Parnaíba river delta, anthropogenic activities seriously changing coastal morphology and the natural elements, and the phase of the Interdecadal Pacific Oscillation (IPO) determining the bimodal climate control of shorelines.
The work of Frihy, et al. [72] in 1994 led the second (red colored cluster) and was directly cited by 1 other study (Figure 7; 1 direct line). The study employed remote sensing techniques (Landsat- MSS and aerial photograph) to analyze the pattern of shoreline changes (beach erosion) in the northwestern Nile delta. The key finding in this was the detection of the longshore pattern or the sequence of beach erosion and accretion [72].
The work of Solomon [73] in 2005 led the third (brown colored cluster) and was directly cited by Jones et al. [74]. This study analyzed the spatial and temporal variability of shoreline change in the Beaufort-Mackenzie region of Canada. Aerial photographs and GPS surveys were the data sources used, whereas the Geographic Resources Analysis Support System (GRASS) was the tool used. The key finding was the dominance of shoreline retreat with mean annual retreat rates (−0.6 m/yr) [73].
Again, the work of Ojeda and Guillén [75] in 2008 led the fourth (green colored cluster). This work was directly cited by 1 other study (Figure 7; 1 direct line). The study monitored shoreline dynamics and beach rotation of artificial embayed beaches in the city of Barcelona [75]. Data sources utilized in this study included cameras (Argus video systems), surveys using the differential Global Position System (dGPS), and the Intertidal Beach Mapper software as the main tools. The main finding in this study was a general retreating trend with displacements of the shorelines, which resulted from the oblique wave incidence during strong storm phenomena [75].
The fifth (pink colored cluster) was also led by the work of Heo et al. [44] in 2009. This work received a direct citation from 1 other study. This was followed by Chaaban et al. [76] in 2012, which received 3 direct citations from other studies. Largely, the studies in this cluster focused on proposing methodologies and data sources in estimating shoreline change. Methods (data sources) used in this study were the utilization of remote sensing (Corona) [44], GIS (aerial photographs) [76], remote sensing (LiDAR) [77], and field surveying (LiDAR and GPS survey) [78]. Key findings from this cluster included the reliability in the use of the buffering and non-linear least square in shoreline change estimation [44], the identification of retreat (82%) in shorelines between 1947 and 2005 [76], significant declines in shorelines [77], and the advancement of the sea towards the coast since the 16th century [78].
In addition, the work of Hou, et al. [79] in 2016 was essential and led the sixth (light blue colored cluster). This work received a direct citation from 1 other study. The study examined coastline changes in China [79]. The study used remote sensing, GIS, and field survey approaches and data sources such as topographic maps and Landsat Thematic Mapper (TM)/Landsat Enhanced Thematic Mapper Plus (ETM) +/Operational Land Imager (OLI). The key finding was the dramatic change in the coastline structure of mainland China because of coastline artificialization caused by sea reclamation and coastal engineering [79].
Furthermore, the seventh (purple colored cluster) was led by the study of Templin et al. [80] in 2018 and afterwards by Dominici et al. [43] in 2019. Both studies were directly cited by 1 other study. The study of Templin et al. [80] described the application of low-cost fixed-wing UAVs for inland lake shorelines, while that of Dominici et al. [43] found high resolution satellite images for instantaneous shoreline extraction using algorithms. Both studies employed remote sensing approaches, with the addition of algorithms in the case of [43]. UAV by [80] and satellite- WorlView-2 images by Dominici et al. [43] were the data sources utilized in both studies. The findings were that a low-cost UAV is an excellent tool for estimating shallow changes in lake shorelines [80] and the detection of greater accuracy in the Active Connections Matrix (ACM) algorithms for testing satellite images for shoreline extraction [43].
Moreover, the eighth (light green colored cluster) was led by the work of Hisabayashi et al. [45] in 2018. This work received a direct citation from 1 other study. The study examined shoreline change in Funafuti Atoll through the usage of satellite images [45]. A remote sensing approach was used with data sources originating from satellite images such as QuickBird-2, WorldView-2, WorldView-3, and Landsat-OLI data. Tools used were CLASlite software and Terrset-IDRISI. The finding from this study was a decrease (0.13%) in net island area [45].
The final (light brown colored cluster) was led by Zanutta et al. [28] in 2020. This work was cited directly by 1 other study. The study evaluated UAV and ground surveys as a mapping tool for monitoring shoreline and beach changes [28]. This study utilized the remote sensing and field survey approaches. Relevant data were LiDAR data, Digital Terrain Models (DTMs), orthophotos, and UAV (DJI Matrice 600 and Spark) images. The Agisoft Metashape Professional Edition 1.5.5, Agisoft LLC, the RTKLIB v. 2.4.3 software, and QGIS software were the tools employed in the study. The key finding was that low-cost, professional, and commercial UAVs are good tools to produce maps and detect topographical changes.
In general, this review has indicated that the research field focuses on changes along coasts (coastlines/shorelines), riverbanks, deltas and lake shorelines. It is interesting to note that the research field has witnessed significant transformations in terms of methodologies (data sources) and tools used. Since the utilization of low-resolution aerial photographs and historical maps in the interpretation of shorelines between capes Hatteras and Fear in North Carolina by El-Ashry and Wanless [17], there has been an advancement in the quality of data used for shoreline change analysis and detection. The work of Herbich and Hales [81], which was presented at the Third Annual Offshore Technology Conference by the American Institute of Mining, Metallurgical, and Petroleum Engineers, Inc., held in Houston, Texas, was essential to this research area. In their work, they talked about remote sensing techniques and the available instruments used in determining changes in coastlines [81]. The works of Dolan et al. [8], which questioned the reliability of aerial photographs in shoreline change measurements was also important. From this point, researchers in the field began exploring more advanced techniques. The work of Jantunen and Raitala [66] was, thus, the first study in this field to utilize multitemporal high resolution satellite- Landsat data to analyze shoreline change. From this point, researchers started using high-resolution satellite images, including aerial photographs.
The growth in remote sensing approaches and the utilization of high-resolution satellite images was challenged with the appropriate tools for shoreline quantification. This challenge was addressed in the 1990s. Thieler and Danforth [82] developed the DSMS/DSAS, a powerful tool used for estimating shoreline rates of change and uncertainties. This era saw the integration of remote sensing and GIS techniques in shoreline change analysis and detection (e.g., Cetin et al. [83] and Williams [84]). The 2000s comprised reviews in the techniques used for shoreline mapping. The work of Moore [85], which provided an overview of errors related with shoreline mapping and the suggested factors like choosing the most appropriate method for shoreline mapping and using GPS over topographical sheets to establish control, etc. (see Moore [85] for more details) was essential to the research field. Additionally, the work of Boak and Turner [9], which revisited shoreline definition and detection, was important in this time. Their work provided better explanations, especially on shoreline indicators and data sources [9].
Beginning from the mid-2000s, the research field suffered massive transformation with respect to approaches and data sources. While remote sensing, GIS approaches, and DSAS tool still dominate, there has been an increasing utilization of models, algorithms (machine learning), and new software in the research field (e.g. the ACM algorithms by Dominici et al. [46], the buffering and non-linear least square model by Heo et al. [47], CLASlite and Terrset-IDRISI software by Hisabayashi et al. [48], and the GRASS software used by Solomon [79]). It is interesting to note that there has been a shift towards the use of low-cost UAVs (e.g. Zanutta et al. [28], Templin et al. [80], Łubczonek et al. [86], and Medvedev et al. [87]) even though the use of satellite images still dominates the field.
In summary, the research field of shoreline change has seen advancements, especially, in the data sources, approaches, and tools. The field began with the detection of shoreline positions through historical maps, aerial photographs, and now through high resolution satellite images. The remote sensing approach (see Figure 5b) dominates the field. It is interesting to note that field measurements and surveys through the employment of GPS has consistently been utilized in the research field. Researchers use GPS surveys to establish control. GPS surveys are also used to validate remote sensing data. The DSAS has remained an important tool in the research field and shows dominance. However, there has been an increasing utilization of other software such as the QGIS, GRASS, Terset-IDRISI, ERDAS, CoastSat, AMBUR, etc. for coastal variation analysis. The increasing utilization of models, algorithms, and programming environments for research in the field has, therefore, provided room for machine learning (see Figure 5c) in the shoreline change analysis and detection field. It is interesting to note that some of the studies that lead to a cluster are related to one direct citation. There is, however, the chance that these studies could be cited by many more papers. This review believes that papers citing these studies are not indexed in the databases used for the document search in the present study, which could result in their inability capture papers directly citing them.

3.7. Viewpoints of Shoreline Change Analysis and Detection through Machine Learning Tools

The scientific mapping which covers five decades on the research field (see Section 3.1) indicates one major viewpoint, that is, progression from observation and interpretation (qualitative description) of historical maps to spatio-temporal analysis (quantitative and/or computational analysis) of high-resolution satellite images employing geospatial techniques (remote sensing). It is worth noting that the field has benefited from both the observational and spatio-temporal analyses.
With the combined progression of qualitative description and improved quantitative and/or computational analysis, intelligent (machine learning) shoreline change analysis and detection tools have been developed. In this review, machine learning makes up 81, or 5.1% of all the documents (1578) analyzed (Figure 8). As the global shorelines continue to change, an indirect average production of about two scientific documents employing machine learning tools occur yearly. This shows the low utilization of the machine learning tools despite the consistent growth in the field.

4. Discussion

The review has revealed the increasing publication trends and the advancement of information on the subject. Although the first Landsat satellite was released in 1972, it was first utilized as a data source for shoreline change analysis and detection in 1984 by Jantunen and Raitala [66] as revealed in this review. Landsat, together with remote sensing and DSAS, have, thus, remained the most utilized data source, method and tool, respectively, on the subject. Researchers in the field choose diverse sources to publish their work. The Journal of Coastal Research (JCR) (Education & Research Foundation) and Remote Sensing (MDPI AG) have been the two most influential in this regard. JCR is based in the U.S.A. and had its first year of publication in 1985. Its long period of establishment and country of publication could be the reason for its prominence. As shown in the review, the majority of the documents in the field were produced in the U.S.A. It could also be due to the journal’s scope, which covers all coastal research and subjects relevant to the natural and engineered environment (https://meridian.allenpress.com/jcr, accessed on 15 March 2022). This review believes that the increasing utilization of the remote sensing methods, Landsat as a data source, and machine learning have contributed to the prominence of Remote Sensing. Remote Sensing, having its first year of publication in 2009, publishes original research papers, reviews, technical notes, and communications in remote sensing science. It publishes new, advanced methods of remote sensing (https://mjl.clarivate.com/journal-profile, accessed on 15 March 2022). It is, however, interesting to note that the first scientific article on the subject by El-Ashry and Wanless [17] with regard to this review was published in Marine Geology.
The review has also revealed that several countries contributed to the research development in the field. As shown in Figure 3, the U.S.A. is the country with the most contributions (267 articles; 16.3%), followed by India (191; 11.6%) and China (179; 10.9%), with a tie between Poland (20; 1.2%) and Portugal (20; 1.2%) for the last position among the top 20. A critical analysis among the top 20 from Figure 3 shows that more contributions on the subject are undertaken by the developed countries (65%) (e.g., the U.S.A. Turkey, France, Italy, Australia, Spain, South Korea, Canada, UK, Japan, Germany, Greece, Poland, and Portugal). Notwithstanding, works from the developing countries are encouraging (35%). For instance, India, China, and Brazil were the second, third, and fourth most productive countries on the subject, respectively. On average, bigger clusters and stronger links were observed for the developed countries in the country collaboration analysis as against the developing countries. The high dominance of the developed countries in this field could be due to the well-established research institutions and the level of economic development, which results in their stronger collaborations. This assertion has been reiterated in the study of Liverpool [88]. This notwithstanding, Zhang, Y, Liu, Y, and Li, X correspondingly, are the first three most relevant authors on the subject. It is interesting to note that these authors are based in a developing country (China) [89]. Again, it must be stated that the contributions from the developing countries are higher in Asia (India and China), South America (Brazil), and North Africa (Egypt) (see Figure 2). Little or no contribution is observed in Sub-Saharan African (SSA) countries. In SSA, Ghana has contributed a total of 14, or 0.9% articles on the subject, followed by Nigeria (6; 0.4%), with a range of 0, or 0.0% to 3, or 0.1% for the rest of the countries. The low research contributions in SSA could be due to low levels of economic development (less funding) and less established research institutions. It could also be due to difficulties obtaining data, as the research field in recent times uses high resolution spatial-temporal satellite images. Some satellite images are expensive, but some others are free. There are other difficulties in obtaining data, such as expensive measuring equipment or lack of historic long-term field data, etc.
The thematic progression of the subject can be linked to the growth in multi-temporal high resolution satellite data (remote sensing). Shoreline change analysis and detection rise above simple observation (description) to high resolution satellite data analysis with the employment of geospatial tools such as remote sensing, GIS, and machine learning approaches. This study believes that the subject’s continuous advancement is due to the negative impacts of climate change and variability (sea level rise, temperature, and precipitation, extreme events) and anthropogenic activities (urbanization), which pose risks to coastal zones and their environments. These zones and their communities have, therefore, become vulnerable to inundation and erosion [90]. It is no wonder coastal erosion, shoreline change, climate change, sea level rise, vulnerability, and coastal zone management are the hot topics within the subject. This also reflects the highly utilized keywords on the subject, such as coastal erosion, shoreline change, remote sensing, and DSAS. This, therefore, makes shoreline change (erosion) the fundamental problem most researchers in the field are addressing (see Figure 6).
Found research gaps (see Table S3) were mostly addressed by the researchers themselves. For example, SAR utilization for shoreline change modelling was identified and addressed by Marghany and Hashim [91]. Other found gaps were also addressed in other studies. For instance, reliable methodologies for estimating shoreline recession identified by Heo et al. [44] was addressed by Chaaban et al. [76], while the shoreline mapping accuracy and problems identified by Łubczonek et al. [86] were addressed by Zanutta et al. [28]. It must be stated that some gaps have still not been addressed, especially the ones that have emerged from the recent work, for instance, that of Escudero et al. [92]. These gaps on the subject show the current state of knowledge and indicate potential research directions. This review, therefore, gives a summary of the current state of knowledge and the data sources and tools to be utilized for future research.
The study accepts the possibility of the omission of important scientific papers considering the selection criteria employed. Therefore, there could be a bias in the present results due to the search criteria here employed. The pioneer works by authors such as R.A. Holman, N.G. Plant, T. Lippmann in the late 1980s and 1990s using video imagery for shoreline detection are not included. For instance, the document search in the present study did not capture the study of Holman et al. [93] on the application of video image processing to the study of nearshore processes. Again, the search did not include the study of Plant and Holman [94] on intertidal beach profile estimation using video images, and that of Lippmann and Holman [95] on the quantification of sand bar morphology using a video technique on wave dissipation.

5. Conclusions

The global production of data sources (methods) and tools for shoreline change analysis and detection has been investigated. Due to the negative impacts of climate change/variability and anthropogenic activities, it is pronounced that there has been an increase in data sources (methods) and tools for shoreline change analysis and detection studies globally. This review concludes that shoreline change analysis and detection studies have progressed from using simple observation (description) from historical maps and topographical maps to employing high-resolution multi-temporal satellite images with remote sensing and GIS approaches for a better understanding of the subject.
This review asserts that the potency of geospatial approaches and tools such as remote sensing, GIS, and machine learning have not been completely discovered. There is a need for more utilization considering their enormous benefits. This review establishes that machine learning (models and algorithms) for shoreline change analysis and detection is an emerging theme. The introduction of machine learning could offer suitable tools and techniques required for the growth of automatic shoreline extraction globally.
The analysis on countries’ collaborations revealed less extensive cooperation in comparison to the research network on the subject globally. Greater collaborations are observed among the developed countries as against the developing countries. Additionally, more documents on the subject are produced by the developed countries, reflecting their ability to plan adaptations to and mitigate the subject’s problem. Although the contributions and collaborations from the developing countries are encouraging, they have not been evenly represented. There is, therefore, the need for a collaborative and supportive research network to ensure the continuous global development of the research field. It must be stated that there is the likelihood that in the selection process, one or more important scientific papers might be omitted due to the selection criteria. There could, therefore, be a bias in the present results due to the search criteria used.

Supplementary Materials

The following supporting information can be downloaded at: https://www.mdpi.com/article/10.3390/su14094895/s1, Table S1: procedure followed in merging Scopus and WoS databases; Table S2: list of all the studies (1578) used for the analysis carried out in the present study; Table S3: summary of scientific publications with direct citation of data sources (methods) and tools for shoreline change analysis and detection (1968–2022).

Author Contributions

Conceptualization, J.A.; methodology, J.A.; software, J.A.; validation, J.A.; formal analysis, J.A.; investigation, J.A.; resources, J.A.; data curation, J.A.; writing—original draft preparation, J.A.; writing—review and editing, J.A., A.M. and H.M.; visualization, J.A., A.M. and H.M.; supervision, A.M. and H.M.; funding acquisition, J.A. All authors have read and agreed to the published version of the manuscript.

Funding

This study is part of the Ph.D. research project ‘Assessing climate change and climate variability impacts in the coastal savannah agroecological zone of Ghana’ financed by the Portuguese Foundation for Science and Technology (Fundação para a Ciência e Tecnologia)-FCT under the PhD research grant (reference: 2021.05220.BD). The study also received support from the Centre of Studies in Geography and Spatial Planning (CEGOT), funded by national funds through the Foundation for Science and Technology (FCT) under the reference UIDB/04084/2020.

Conflicts of Interest

The authors declare no conflict of interest.

References

  1. Le Cozannet, G.; Bulteau, T.; Castelle, B.; Ranasinghe, R.; Wöppelmann, G.; Rohmer, J.; Bernon, N.; Idier, D.; Louisor, J.; Salas, Y.; et al. Quantifying uncertainties of sandy shoreline change projections as sea level rises. Sci. Rep. 2019, 9, 42. [Google Scholar] [CrossRef] [PubMed] [Green Version]
  2. Nicholls, R.J.; Cazenave, A. Sea-Level Rise and Its Impact on Coastal Zones. Science 2010, 328, 1517–1520. [Google Scholar] [CrossRef] [PubMed]
  3. Oppenheimer, M.; Glavovic, B.C.; Hinkel, J.; van de Wal, R.; Magnan, A.K.; Abd-Elgawad, A.; Cai, R.; Cifuentes-Jara, M.; DeConto, R.M.; Ghosh, T.; et al. Sea Level Rise and Implications for Low-Lying Islands, Coasts and Communities. In IPCC Special Report on the Ocean and Cryosphere in a Changing Climate; Portner, H.-O., Roberts, D.C., Masson-Delmotte, V., Zhai, P., Tignor, M., Poloczanska, E., Mintenbeck, K., Alegría, A., Nicolai, M., Okem, A., et al., Eds.; The Intergovernmental Panel on Climate Change: Geneva, Switzerland, 2019. [Google Scholar]
  4. Alvarez-Cuesta, M.; Toimil, A.; Losada, I. Reprint of: Modelling long-term shoreline evolution in highly anthropized coastal areas. Part 2: Assessing the response to climate change. Coast. Eng. 2012, 169, 103985. [Google Scholar] [CrossRef]
  5. Ware, D.; Buckwell, A.; Tomlinson, R.; Foxwell-Norton, K.; Lazarow, N. Using Historical Responses to Shoreline Change on Australia’s Gold Coast to Estimate Costs of Coastal Adaptation to Sea Level Rise. J. Mar. Sci. Eng. 2020, 8, 380. [Google Scholar] [CrossRef]
  6. Blackburn, S.; Marques, C.; de Sherbinin, A.; Modesto, F.; Ojima, R.; Oliveau, S.; Bolde, C.C.P. Mega-Urbanisation on the Coast. In Megacities and the Coast: Risk, Resilience, and Transformation; Pelling, M., Blackburn, S., Eds.; Routledge/Taylor & Francis Group: New York, NY, USA; London, UK, 2013; pp. 25–26. [Google Scholar]
  7. Bamunawala, J.; Ranasinghe, R.; Dastgheib, A.; Nicholls, R.J.; Murray, A.B.; Barnard, P.L.; Sirisena, T.A.J.G.; Duong, T.M.; Hulscher, S.J.M.H.; van der Spek, A. Twenty-first-century projections of shoreline change along inlet-interrupted coastlines. Sci. Rep. 2021, 11, 14038. [Google Scholar] [CrossRef]
  8. Dolan, R.; Hayden, B.P.; May, P.; May, S.K. The reliability of shoreline change measurements from aerial photographs. Shore Beach 1980, 48, 22–29. [Google Scholar]
  9. Boak, E.H.; Turner, I. Shoreline Definition and Detection: A Review. J. Coast. Res. 2005, 21, 688–703. [Google Scholar] [CrossRef] [Green Version]
  10. Burningham, H.; Fernandez-Nunez, M. Shoreline change analysis. In Sandy Beach Morphodynamics; Jackson, D.W.T., Short, A.D., Eds.; Elsevier: Amsterdam, The Netherlands, 2020; pp. 439–460. [Google Scholar] [CrossRef]
  11. Douglas, B.C.; Crowell, M.; Winter, F. Long-term shoreline position prediction and error propagation. J. Coast. Res. 2000, 16, 145–152. [Google Scholar]
  12. Baral, R.; Pradhan, S.; Samal, R.N.; Mishra, S.K. Shoreline Change Analysis at Chilika Lagoon Coast, India Using Digital Shoreline Analysis System. J. Indian Soc. Remote Sens. 2018, 46, 1637–1644. [Google Scholar] [CrossRef]
  13. Dereli, M.A.; Tercan, E. Assessment of Shoreline Changes using Historical Satellite Images and Geospatial Analysis along the Lake Salda in Turkey. Earth Sci. Inform. 2020, 13, 709–718. [Google Scholar] [CrossRef]
  14. Vivek, G.; Goswami, S.; Samal, R.N.; Choudhury, S.B. Monitoring of Chilika lake mouth dynamics and quantifying rate of shoreline change using 30 m multi-temporal Landsat data. Data Brief 2019, 22, 595–600. [Google Scholar] [CrossRef]
  15. Carr, A.P. Shingle Spit and River Mouth: Short Term Dynamics. Trans. Inst. Br. Geogr. 1965, 36, 117. [Google Scholar] [CrossRef]
  16. De Boer, G.; Carr, A.P. Early Maps as Historical Evidence for Coastal Change. Geogr. J. 1969, 135, 17–39. [Google Scholar] [CrossRef]
  17. El-Ashry, M.T.; Wanless, H.R. Photo interpretation of shoreline changes between capes Hatteras and Fear (North Carolina). Mar. Geol. 1968, 6, 347–379. [Google Scholar] [CrossRef]
  18. Gulliver, P.F. Shoreline topography. Proc. Am. Acad. Arts Sci. 1899, 8, 151–258. [Google Scholar] [CrossRef]
  19. Tanner, W.F. Standards for Measuring Shoreline Change; Coastal Research: Tallahassee, FL, USA, 1978; p. 85. [Google Scholar]
  20. Boye, C.B.; Addo, K.A.; Wiafe, G.; Dzigbodi-Adjimah, K. Spatio-temporal analyses of shoreline change in the Western Region of Ghana. J. Coast. Conserv. 2018, 22, 769–776. [Google Scholar] [CrossRef]
  21. Mahapatra, M.; Ratheesh, R.; Rajawat, A.S. Shoreline Change Analysis along the Coast of South Gujarat, India, Using Digital Shoreline Analysis System. J. Indian Soc. Remote Sens. 2014, 42, 869–876. [Google Scholar] [CrossRef]
  22. Crapoulet, A.; Héquette, A.; Marin, D.; Levoy, F.; Bretel, P. Variations in the response of the dune coast of northern France to major storms as a function of available beach sediment volume. Earth Surf. Process. Landf. 2017, 42, 1603–1622. [Google Scholar] [CrossRef]
  23. Moore, L.J.; Ruggiero, P.; List, J.H. Comparing Mean High Water and High Water Line Shorelines: Should Proxy-Datum Offsets be Incorporated into Shoreline Change Analysis? J. Coast. Res. 2006, 22, 894–905. [Google Scholar] [CrossRef]
  24. Luijendijk, A.; Hagenaars, G.; Ranasinghe, R.; Baart, F.; Donchyts, G.; Aarninkhof, S. The state of the world’s beaches. Sci. Rep. 2018, 8, 1–11. [Google Scholar] [CrossRef]
  25. Vos, K.; Harley, M.D.; Splinter, K.D.; Simmons, J.A.; Turner, I.L. Sub-annual to multi-decadal shoreline variability from publicly available satellite imagery. Coast. Eng. 2019, 150, 160–174. [Google Scholar] [CrossRef]
  26. Pollard, J.A.; Spencer, T.; Brooks, S.M.; Christie, E.K.; Möller, I. Understanding spatio-temporal barrier dynamics through the use of multiple shoreline proxies. Geomorphology 2020, 354, 107058. [Google Scholar] [CrossRef]
  27. Salmon, C.; Duvat, V.K.E.; Laurent, V. Human- and climate-driven shoreline changes on a remote mountainous tropical Pacific Island: Tubuai, French Polynesia. Anthropocene 2019, 25, 100191. [Google Scholar] [CrossRef]
  28. Zanutta, A.; Lambertini, A.; Vittuari, L. UAV Photogrammetry and Ground Surveys as a Mapping Tool for Quickly Monitoring Shoreline and Beach Changes. J. Mar. Sci. Eng. 2020, 8, 52. [Google Scholar] [CrossRef] [Green Version]
  29. Underwood, S.G.; Anders, F.J. Evaluation of the Coastal Features Mapping System for Shoreline Mapping (No. CERC-91-13); Coastal Engineering Research Center: Vicksburg, MS, USA, 1991; p. 49. [Google Scholar]
  30. Danforth, W.W.; Thieler, E.R. Digital Shoreline Mapping System (DSMS) User’s Guide, Version 1.0; US Geological Survey: Reston, VI, USA, 1992; p. 33.
  31. Thieler, E.R.; Martin, D.; Ergul, A. Digital Shoreline Analysis System (DSAS) Version 2.0: An ArcView Extension for Calculating Shoreline Change (No. 2003-76); US Geological Survey: Reston, VI, USA, 2003.
  32. Thieler, E.R.; Himmelstoss, E.A.; Zichichi, J.L.; Miller, T.L. Digital Shoreline Analysis System (DSAS) Version 3.0: An ArcGIS Extension for Calculating Shoreline Change; Open-File Report 2005–1304; US Geological Survey: Reston, VI, USA, 2005.
  33. Thieler, E.R.; Himmelstoss, E.A.; Zichichi, J.L.; Ergun, A. Digital Shoreline Analysis System (DSAS) Version 4.0: An ArcGIS Extension for Calculating Shoreline Change; Open File Report 2008–1278, USA; US Geological Survey: Reston, VI, USA, 2009.
  34. Himmelstoss, E.A.; Henderson, R.E.; Kratzmann, M.G.; Farris, A.S. Digital Shoreline Analysis System (DSAS) Version 5.1 User Guide; U.S. Geological Survey Open: Reston, VI, USA, 2021; p. 104. [CrossRef]
  35. Himmelstoss, E.A.; Henderson, R.E.; Kratzmann, M.G.; Farris, A.S. Digital Shoreline Analysis System (DSAS) Version 5.0 User Guide; Open-File Report 2018–1179; Geological Survey Open: Reston, VI, USA, 2018; p. 126.
  36. Mishra, M.; Sudarsan, D.; Kar, D.; Naik, A.K.; DAS, P.P.; Santos, C.A.; da Silva, R.M. The development and Research trend of using dsas tool for shoreline change analysis: A scientometric analysis. J. Urban Environ. Eng. 2020, 14, 69–77. [Google Scholar] [CrossRef]
  37. Santos, C.A.G.; Nascimento, T.V.M.D.; Mishra, M.; da Silva, R.M. Analysis of long- and short-term shoreline change dynamics: A study case of João Pessoa city in Brazil. Sci. Total Environ. 2021, 769, 144889. [Google Scholar] [CrossRef]
  38. De Lima, L.T.; Fernández-Fernández, S.; Espinoza, J.M.D.A.; Albuquerque, M.D.G.; Bernardes, C. End Point Rate Tool for QGIS (EPR4Q): Validation Using DSAS and AMBUR. ISPRS Int. J. Geo-Inf. 2021, 10, 162. [Google Scholar] [CrossRef]
  39. Griffiths, D.; House, C.; Rangel-Buitrago, N.; Thomas, T. An assessment of areal and transect-based historic shoreline changes in the context of coastal planning. J. Coast. Conserv. 2019, 23, 315–330. [Google Scholar] [CrossRef] [Green Version]
  40. Jackson, C.W., Jr.; Alexander, C.R.; Bush, D.M. Application of the AMBUR R package for spatio-temporal analysis of shoreline change: Jekyll Island, Georgia, USA. Comput. Geosci. 2012, 41, 199–207. [Google Scholar] [CrossRef]
  41. Hoeke, R.K.; Zarillo, G.A.; Synder, M. A GIS-Based Tool for Extracting Shoreline Positions from Aerial Imagery (BeachTools); US Army Corps of Engineer Research and Development Center, Coastal and Hydraulics Lab: Vicksburg, MS, USA, 2001.
  42. Gómez-Pazo, A.; Payo, A.; Paz-Delgado, M.V.; Delgadillo-Calzadilla, M.A. Open Digital Shoreline Analysis System: ODSAS v1.0. J. Mar. Sci. Eng. 2022, 10, 26. [Google Scholar] [CrossRef]
  43. Dominici, D.; Zollini, S.; Alicandro, M.; Della Torre, F.; Buscema, P.M.; Baiocchi, V. High Resolution Satellite Images for Instantaneous Shoreline Extraction Using New Enhancement Algorithms. Geosciences 2019, 9, 123. [Google Scholar] [CrossRef] [Green Version]
  44. Heo, J.; Kim, J.H.; Kim, J.W. A new methodology for measuring coastline recession using buffering and non-linear least squares estimation. Int. J. Geogr. Inf. Sci. 2009, 23, 1165–1177. [Google Scholar] [CrossRef]
  45. Hisabayashi, M.; Rogan, J.; Elmes, A. Quantifying shoreline change in Funafuti Atoll, Tuvalu using a time series of Quickbird, Worldview and Landsat data. GIScience Remote Sens. 2018, 55, 307–330. [Google Scholar] [CrossRef]
  46. Castelle, B.; Masselink, G.; Scott, T.; Stokes, C.; Konstantinou, A.; Marieu, V.; Bujan, S. Satellite-derived shoreline detection at a high-energy meso-macrotidal beach. Geomorphology 2021, 383, 107707. [Google Scholar] [CrossRef]
  47. Yadav, A.; Dodamani, B.M.; Dwarakish, G.S. Shoreline analysis using Landsat-8 satellite image. ISH J. Hydraul. Eng. 2021, 27, 347–355. [Google Scholar] [CrossRef]
  48. Apostolopoulos, D.; Nikolakopoulos, K. A review and meta-analysis of remote sensing data, GIS methods, materials and indices used for monitoring the coastline evolution over the last twenty years. Eur. J. Remote Sens. 2021, 54, 240–265. [Google Scholar] [CrossRef]
  49. Parthasarathy, K.; Deka, P.C. Remote sensing and GIS application in assessment of coastal vulnerability and shoreline changes: A review. ISH J. Hydraul. Eng. 2021, 27, 588–600. [Google Scholar] [CrossRef]
  50. Aria, M.; Cuccurullo, C. Bibliometrix: An R-tool for comprehensive science mapping analysis. J. Informetr. 2017, 11, 959–975. [Google Scholar] [CrossRef]
  51. Aria, M.; Misuraca, M.; Spano, M. Mapping the Evolution of Social Research and Data Science on 30 Years of Social Indicators Research. Soc. Indic. Res. 2020, 149, 803–831. [Google Scholar] [CrossRef]
  52. Van Eck, N.J.; Waltman, L. Software survey: VOSviewer, a computer program for bibliometric mapping. Scientometrics 2009, 84, 523–538. [Google Scholar] [CrossRef] [Green Version]
  53. Guo, Y.-M.; Huang, Z.-L.; Guo, J.; Li, H.; Guo, X.-R.; Nkeli, M.J. Bibliometric Analysis on Smart Cities Research. Sustainability 2019, 11, 3606. [Google Scholar] [CrossRef] [Green Version]
  54. Baiyegunhi, T.L.; Baiyegunhi, C.; Pharoe, B.K. Global Research Trends on Shale Gas from 2010–2020 Using a Bibliometric Approach. Sustainability 2022, 14, 3461. [Google Scholar] [CrossRef]
  55. Wang, M.; Li, L.; Hou, C.; Guo, X.; Fu, H. Building and Health: Mapping the Knowledge Development of Sick Building Syndrome. Buildings 2022, 12, 287. [Google Scholar] [CrossRef]
  56. Zhang, J.; Xiong, K.; Liu, Z.; He, L. Research progress and knowledge system of world heritage tourism: A bibliometric analysis. Herit. Sci. 2022, 10, 42. [Google Scholar] [CrossRef]
  57. Enríquez, A.R.; Marcos, M.; Álvarez-Ellacuría, A.; Orfila, A.; Gomis, D. Changes in beach shoreline due to sea level rise and waves under climate change scenarios: Application to the Balearic Islands (western Mediterranean). Nat. Hazards Earth Syst. Sci. 2017, 17, 1075–1089. [Google Scholar] [CrossRef] [Green Version]
  58. IPCC. IPCC Special Report on the Ocean and Cryosphere in a Changing Climate; Portner, H.-O., Roberts, D.C., Masson-Delmotte, V., Zhai, P., Tignor, M., Poloczanska, E., Mintenbeck, K., Alegría, A., Nicolai, M., Okem, A., et al., Eds.; IPCC: Geneva, Switzerland, 2019. [Google Scholar]
  59. Wang, X.; Fang, Z.; Sun, X. Usage patterns of scholarly articles on Web of Science: A study on Web of Science usage count. Scientometrics 2016, 109, 917–926. [Google Scholar] [CrossRef]
  60. Lima, C.O.; Bonetti, J. Bibliometric analysis of the scientific production on coastal communities’ social vulnerability to climate change and to the impact of extreme events. Nat. Hazards 2020, 102, 1589–1610. [Google Scholar] [CrossRef]
  61. Pathmanandakumar, V.; Chenoli, S.N.; Goh, H.C. Linkages between Climate Change and Coastal Tourism: A Bibliometric Analysis. Sustainability 2021, 13, 10830. [Google Scholar] [CrossRef]
  62. Ellegaard, O. The application of bibliometric analysis: Disciplinary and user aspects. Scientometrics 2018, 116, 181–202. [Google Scholar] [CrossRef] [Green Version]
  63. Van Eck, N.J.; Waltman, L. Manual for VOSviewer Version 1.6.17. 2021. Available online: https://www.vosviewer.com/documentation/Manual_VOSviewer_1.6.17.pdf (accessed on 18 December 2021).
  64. Cobo, M.J.; López-Herrera, A.G.; Herrera-Viedma, E.; Herrera, F. An approach for detecting, quantifying, and visualizing the evolution of a research field: A practical application to the Fuzzy Sets Theory field. J. Informetr. 2011, 5, 146–166. [Google Scholar] [CrossRef]
  65. Borgman, C.L.; Furner, J. Scholarly communication and bibliometrics. Annu. Rev. Inf. Sci. Technol. 2002, 36, 2–72. [Google Scholar] [CrossRef] [Green Version]
  66. Jantunen, H.; Raitala, J. Locating shoreline changes in the Porttipahta (Finland) water reservoir by using multitemporal Landsat data. Photogrammetria 1984, 39, 1–12. [Google Scholar] [CrossRef]
  67. Eliot, I.; Clarke, D. Temporal and spatial bias in the estimation of shoreline rate-of-change statistics from beach survey information. Coast. Manag. 1989, 17, 129–156. [Google Scholar] [CrossRef]
  68. Chen, L.C. Detection of shoreline changes for tideland areas using multi-temporal satellite images. Int. J. Remote Sens. 1998, 19, 3383–3397. [Google Scholar] [CrossRef]
  69. Da Silva, A.G.A.; Stattegger, K.; Schwarzer, K.; Vital, H.; Heise, B.; Silva, D. The Influence of Climatic Variations on River Delta Hydrodynamics and Morphodynamics in the Parnaíba Delta, Brazil. J. Coast. Res. 2015, 31, 930–940. [Google Scholar] [CrossRef]
  70. Duarte, C.R.; De Miranda, F.P.; Landau, L.; Souto, M.V.S.; Sabadia, J.A.B.; Neto, C.D.S.; Rodrigues, L.I.D.C.; Damasceno, A.M. Short-time analysis of shoreline based on RapidEye satellite images in the terminal area of Pecém Port, Ceará, Brazil. Int. J. Remote Sens. 2018, 39, 4376–4389. [Google Scholar] [CrossRef]
  71. Kelly, J.T.; McSweeney, S.; Shulmeister, J.; Gontz, A.M. Bimodal climate control of shoreline change influenced by Interdecadal Pacific Oscillation variability along the Cooloola Sand Mass, Queensland, Australia. Mar. Geol. 2019, 415, 105971. [Google Scholar] [CrossRef]
  72. Frihy, O.E.; Nasr, S.M.; El Hattab, M.M.; El Raey, M. Remote sensing of beach erosion along the Rosetta promontary, northwestern Nile delta, Egypt. Int. J. Remote Sens. 1994, 15, 1649–1660. [Google Scholar] [CrossRef]
  73. Solomon, S.M. Spatial and temporal variability of shoreline change in the Beaufort-Mackenzie region, northwest territories, Canada. Geo-Mar. Lett. 2004, 25, 127–137. [Google Scholar] [CrossRef]
  74. Jones, B.M.; Hinkel, K.M.; Arp, C.; Eisner, W.R. Modern Erosion Rates and Loss of Coastal Features and Sites, Beaufort Sea Coastline, Alaska. ARCTIC 2008, 61, 361–372. [Google Scholar] [CrossRef] [Green Version]
  75. Ojeda, E.; Guillén, J. Shoreline dynamics and beach rotation of artificial embayed beaches. Mar. Geol. 2008, 253, 51–62. [Google Scholar] [CrossRef]
  76. Chaaban, F.; Darwishe, H.; Battiau-Queney, Y.; Louche, B.; Masson, E.; El Khattabi, J.; Carlier, E. Using ArcGIS® Modelbuilder and Aerial Photographs to Measure Coastline Retreat and Advance: North of France. J. Coast. Res. 2012, 285, 1567–1579. [Google Scholar] [CrossRef]
  77. Crapoulet, A.; Héquette, A.; Levoy, F.; Bretel, P. Assessment of shoreline change and coastal sediment budget in the Bay of Wissant (northern France) using airborne LiDAR. Géomorphol. Relief Processus Environ. 2015, 21, 313–330. [Google Scholar] [CrossRef] [Green Version]
  78. Ruz, M.-H.; Héquette, A.; Marin, D.; Sipka, V.; Crapoulet, A.; Cartier, A. Development of an incipient foredune field along a prograding macrotidal shoreline, northern France. Géomorphol. Relief Processus Environ. 2017, 23, 37–50. [Google Scholar] [CrossRef]
  79. Hou, X.; Wu, T.; Hou, W.; Chen, Q.; Wang, Y.; Yu, L. Characteristics of coastline changes in mainland China since the early 1940s. Sci. China Earth Sci. 2016, 59, 1791–1802. [Google Scholar] [CrossRef]
  80. Templin, T.; Popielarczyk, D.; Kosecki, R. Application of Low-Cost Fixed-Wing UAV for Inland Lakes Shoreline Investigation. Pure Appl. Geophys. 2018, 175, 3263–3283. [Google Scholar] [CrossRef] [Green Version]
  81. Herbich, J.B.; Hales, Z.L. Remote Sensing Techniques used in Determining Changes. In Proceedings of the Coastlines, Offshore Technology Conference, Houston, TX, USA, 18 April 1971. [Google Scholar] [CrossRef]
  82. Thieler, E.R.; Danforth, W.W. Historical shoreline mapping (II) application of the Digital Shoreline Mapping and Analysis Systems (DSMS/DSAS) to shoreline change mapping in Puerto Rico. J. Coast. Res. 1994, 10, 600–620. [Google Scholar]
  83. Cetin, H.; Bal, Y.; Demirkol, C. Engineering and Environmental Effects of Coastline Changes in Turkey, Northeastern Mediterranean. Environ. Eng. Geosci. 1999, 3, 315–330. [Google Scholar] [CrossRef]
  84. Williams, H.F.L. Sand-spit erosion following interruption of longshore sediment transport: Shamrock Island, Texas. Environ. Earth Sci. 1999, 37, 153–161. [Google Scholar] [CrossRef]
  85. Moore, L.J. Shoreline mapping techniques. J. Coast. Res. 2000, 16, 111–124. Available online: http://www.jstor.org/stable/4300016 (accessed on 18 December 2021).
  86. Ubczonek, J.; Łącka, M.; Zaniewicz, G. Analysis of the accuracy of shoreline mapping in inland navigational charts (Inland ENC) using photogrammetric and sonar images. Sci. J. Marit. Univ. Szczec. 2019, 58, 45–54. [Google Scholar] [CrossRef]
  87. Medvedev, A.; Telnova, N.; Alekseenko, N.; Koshkarev, A.; Kuznetchenko, P.; Asmaryan, S.; Narykov, A. UAV-Derived Data Application for Environmental Monitoring of the Coastal Area of Lake Sevan, Armenia with a Changing Water Level. Remote Sens. 2020, 12, 3821. [Google Scholar] [CrossRef]
  88. Liverpool, L. Researchers from Global South Under-Represented in Development Research. Nature 2021. Available online: https://www.nature.com/articles/d41586-021-02549-9 (accessed on 2 February 2022).
  89. Dong, F.; Pan, Y.; Li, Y.; Zhang, S. How public and government matter in industrial pollution mitigation performance: Evidence from China. J. Clean. Prod. 2021, 306, 127099. [Google Scholar] [CrossRef]
  90. Nicholls, R.J.; Wong, P.P.; Burkett, V.R.; Codignotto, J.O.; Hay, J.E.; McLean, R.F.; Ragoonaden, S.; Woodroffe, C.D. Coastal Systems and Low-Lying Areas. In Climate Change 2007: Impacts, Adaptation and Vulnerability. Contribution of Working Group II to the Fourth Assessment Report of the Intergovernmental Panel on Climate Change; Parry, M.L., Canziani, O.F., Palutikof, J.P., van der Linden, P.J., Hanson, C.E., Eds.; Cambridge University Press: Cambridge, UK, 2007; pp. 315–356. [Google Scholar]
  91. Marghany, M.; Hashim, M. Velocity bunching and Canny algorithms for modelling shoreline change rate from synthetic ap-erture radar (SAR). Int. J. Phys. Sci. 2010, 5, 1908–1914. [Google Scholar]
  92. Escudero, M.; Reguero, B.G.; Mendoza, E.; Secaira, F.; Silva, R. Coral Reef Geometry and Hydrodynamics in Beach Erosion Control in North Quintana Roo, Mexico. Front. Mar. Sci. 2021, 8, 684732. [Google Scholar] [CrossRef]
  93. Holman, R.A.; Sallenger, A.H., Jr.; Lippmann, T.C.; Haines, J.W. The application of video image processing to the study of nearshore processes. Oceanography 1993, 6, 78–85. [Google Scholar] [CrossRef] [Green Version]
  94. Plant, N.G.; Holman, R.A. Intertidal beach profile estimation using video images. Mar. Geol. 1997, 140, 1–24. [Google Scholar] [CrossRef]
  95. Lippmann, T.C.; Holman, R.A. Quantification of sand bar morphology: A video technique based on wave dissipation. J. Geophys. Res. Ocean. 1989, 94, 995–1011. [Google Scholar] [CrossRef]
Figure 1. Annual global publication trends in data sources and tools for shoreline change analysis and detection (1968–2022). Note: The year 2022 covers only the 1st trimester.
Sustainability 14 04895 g001
Figure 2. Most productive countries in the scientific production on data sources and tools for shoreline change analysis and detection (1968–2022). Note: *Poland and Portugal have 20 documents and so, the study saw the need to report both. N indicates number of documents.
Sustainability 14 04895 g002
Figure 3. Countries collaboration network analysis of data sources and tools for shoreline change analysis and detection production globally (1968–2022).
Sustainability 14 04895 g003
Figure 4. Keyword co-occurrence analysis of data sources and tools for shoreline change analysis and detection production globally (1968–2022).
Sustainability 14 04895 g004
Figure 5. (a) Data sources; (b) methods; and (c) tools used in shoreline change analysis and detection (1968–2022). *NI (Not Indicated) shows number of studies that did not report data sources (a), methods (b), and tools used (c). *Multiple shows number of studies that utilized more than 1 data sources (a), methods (b), and tools (c).
Sustainability 14 04895 g005
Figure 6. Thematic progression of data sources and tools for shoreline change analysis and detection globally (1968–2022).
Sustainability 14 04895 g006
Figure 7. Historical direct citation network of data sources and tools for shoreline change analysis and detection (1968–2022). Note: 129 studies are involved in the blue cluster; 4 studies in the pink; 3 studies in the purple; and 2 studies each in the red, brown, green, light blue, light green, and light brown clusters.
Sustainability 14 04895 g007
Figure 8. Development in machine learning tools in shoreline change analysis and detection studies.
Sustainability 14 04895 g008
Table 1. Keywords used for documents search.
Scopus
TITLE-ABS-KEY((“Shoreline change” OR “shoreline mapping” OR “shoreline analysis” OR “shoreline position” OR “shoreline detection” OR “coastline change” OR “coastal erosion” OR “coastal accretion”) AND (“GIS” OR “Geographic Information System” OR “QGIS” OR “remote sensing” OR “Landsat” OR “aerial photography” OR “beach survey” OR “Global Position System” OR “GPS” OR “satellite imagery” OR “multispectral imagery” OR “hyperspectral imagery” OR “ Airborne Light Detection and Ranging technology” OR “LiDAR” OR “microwave sensors” OR “video imaging” OR “Unmanned Aerial Vehicle” OR “UAV”))
WoS
TS = ((“Shoreline change” OR “shoreline mapping” OR “shoreline analysis” OR “shoreline position” OR “shoreline detection” OR “coastline change” OR “coastal erosion” OR “coastal accretion”) AND (“GIS” OR “Geographic Information System” OR “QGIS” OR “remote sensing” OR “Landsat” OR “aerial photography” OR “beach survey” OR “Global Position System” OR “GPS” OR “satellite imagery” OR “multispectral imagery” OR “hyperspectral imagery” OR “ Airborne Light Detection and Ranging technology” OR “LIDAR” OR “microwave sensors” OR “video imaging” OR “Unmanned Aerial Vehicle” OR “UAV”))
Table 2. Document types considered in data sources and tools for shoreline change analysis and detection.
Document TypeNumber
Abstract report/meeting2
Article1148
Data paper2
Proceedings paper22
Book chapter32
Conference paper338
Correction3
Note1
Review30
Total1578
Table 3. Top-20 most relevant journals in data sources and tools for shoreline change analysis.
S/NJournalsNumber of Documents
1Journal of Coastal Research192
2Remote Sensing46
3Geomorphology45
4IOP Conferences Series: Earth and Environmental Science38
5Journal of Coastal Conservation37
6International Archives of the Photogrammetry Remote Sensing and Spatial Information Sciences- ISPRS Archives29
7Marine Geology29
8International Journal of Remote Sensing27
9International Geoscience and Remote Sensing Symposium (IGARSS)24
10Proceedings of SPIE- The International Society for Optical Engineering24
11Environmental Earth Sciences23
12Ocean and Coastal Management23
13Journal of the Indian Society of Remote Sensing20
14Environmental Monitoring and Assessment19
15Arabian Journal of Geosciences17
16Journal of Marine Science and Engineering17
17Natural Hazards17
18ISPRS International Journal of Geo-Information16
19Regional Studies in Marine Science16
20Marine Geodesy15
Table 4. Top-20 most relevant authors in data sources and tools for shoreline change analysis.
S/NAuthorsArticlesArticles Fractionalized
1Zhang Y176.53
2Liu Y143.04
3Li X134.33
4Turner I122.96
5Bayram B112.37
6Wang Y113.39
7Del R L102.75
8Li J102.47
9Pardo-Pascual J102.12
10Anthony E91.71
11Goncalves R92.22
12Hou X92.65
13Jones B91.80
14Kankara R92.73
15Li R92.46
16Mishra M92.08
17Wang C92.21
18Awange J82.22
19Islam M81.47
20Masria A81.95
Publisher’s Note: MDPI stays neutral with regard to jurisdictional claims in published maps and institutional affiliations.

