1. Introduction
In order to fulfill a wide set of development and environmental objectives, governments and international organizations have used planned relocation as a common spatial strategy [
1]. As one of China’s most important poverty reduction initiatives and a component of the country’s national rural development policy, poverty alleviation relocation (PAR) is a project that employs resettlement as a tool to assist the targeted poor in inhospitable and development-restricted environments, particularly those who are living in “spatial poverty traps” such as distant mountainous places or in desert and semiarid regions [
2,
3]. For sustainable rural development, those targeted poor households were relocated to new communities with improved transportation, medical care, education, living environment, etc. [
4].
In terms of relocation destination, three different resettlement modes were identified in PAR, namely resettlement to nearby villages, resettlement to nearby townships, and resettlement to cities [
5,
6]. Rural–rural resettlement to a nearby village was examined in this study, which aimed to consolidate the scattered impoverished people into a neighboring administrative village with better infrastructure and growth potential, which may help preserve the original social capital of the survivors to a considerable extent [
7]. Rural–rural resettlements have been shown to develop place identity at a higher rate than rural–urban/town resettlements [
8], considering the shorter relocation distance and smaller cultural and social gaps. As a result, people frequently take for granted social integration following a rural–rural relocation; however, the extent to which the PAR projects reshaped individuals’ social network contexts in rural communities was usually overlooked.
To assess the performance of long-term social sustainability, drawing on the experience of resettled villagers and local villagers in the new community, this study explored how resettlement reshaped their social relations in terms of the changes in neighboring social-interaction scope and intergroup social support [
9]. In terms of residential segregation, a previous study defined four resettlement types: the centralized, adjacent, enclave, and infill types [
10]. We, therefore, developed four cases as that were representative of PAR projects, which were located in the administrative area of Shiyan City, Hubei Province. Having drawn on the data we collected from two field surveys and in-depth interviews that were carried out in 2019 and 2021, the study aimed to address four specific questions:
First, how are the scope of neighboring social interactions and intergroup social support in the four resettlement types and two groups manifested in the PAR projects? For a better understanding of the social impact under different resettlement types, a cross-type and cross-group comparison study can help us grasp it more thoroughly, offering planning suggestions when considering issues with adopting a given resettlement type as well.
Second, how did the scope of social interaction and social support change from 2019 to 2021? Through a 2-year observation, the change at different time stages can reveal the dynamic social impact in the longer term from a sustainable perspective.
Third, how do such effects vary by the socioeconomic attributes of the migrant residents versus local residents? Comprehending the complexities may reveal the critical social determinants that affect the establishment of social networks and highlight the specific attention and tailor-made efforts required for vulnerable groups.
Fourth, in what ways have residents employed the spaces of social interaction and economic activities to enhance their own wellbeing? The act of laying claims to space and economy activities provides decision makers with spatial and economic perspectives for future work, which planners can utilize to develop specific spatial and economic strategies to enhance social and economic integration.
4. Impact on Residents’ Social Networks
4.1. Overall Impact
Their choices were collected with the two surveys, as shown in
Table 2.
4.1.1. Social Interaction Scope Change
Table 2 shows that the migrant group witnessed much more significant changes in scope of interaction than the local group, both positively and negatively. On the positive side, it is delightful to see that there was a greater proportion of migrants who reported an increased scope: 28.8% in 2019 and 39.3% in 2021 experienced expanded social interactions as a result of PAR, compared to only 24.2% and 30.1% of the locals feeling the same. However, on the negative side, many migrants indicated that their scopes had narrowed due to the resettlement, with 40.9% in 2019 and 34.7% in 2021 reporting as such.
The local residents in the host villages with longer residence lengths, as the dominant members of the mainstream host society, had a more stable status as no decline in scope of social interaction occurred. About 70% of them had relatively stable social networks, which developed and had been maintained in advance of the resettlement process. In comparison to the migrant group, the local group experienced less urgency and had more options for expanding their scope of interaction within the community.
The above findings supported the idea that the resettled members were generally keener than the locals to reestablish their neighboring intergroup social networks [
23]. After PAR, on one hand, they were more willing to embrace the increased likelihood of making new friends and forming new connections through a variety of occasions; on the other hand, the new living environment and lifestyle inevitably brought an end to some traditional forms of social interaction, which means that previous friends from the original villages may have become estranged as a result of gradually increased social distance and geographic separation.
4.1.2. Social Support Change
As for social support, it followed a similar pattern to the social-interaction scope change: the migrants were more willing to ask for intergroup social support, and subsequently, compared to the locals, the migrants experienced a more significant increase, which was continuously observed during 2019–2021. The migrant targeted poor were naturally recognized as the marginalized social group due to their lower income levels and development potential in the implementation of PAR projects; hence, they were usually found to be more reliant on local social networks due to the necessity of mutual support and their relatively constrained social mobility. Results also shows that social support always had lower values in all measured levels. This can be explained by the fact that social support necessitates a greater level of quality in social interactions.
What kind of supports were they willing to ask for from the intergroup members? Respondents were asked to choose from “yes” or “no” following Ven der Poel’s proposed three kinds of support: social companionship (mutual visit, hanging out); instrumental support (housework, caring, borrowing items, borrowing money, filling forms); and emotional support (marital problems, critical advice, comfort) [
42]. We summarized the percentage distribution among 10 categories when seeking social support from outgroup members in
Figure 2.
Generally, the migrant group was found to have a higher desire for social support than the local group, and this was true across all categories of support provided. With respect to the support types, as illustrated by
Figure 2, social companionship had a relatively low threshold, as in 2021, 56% and 40% of migrants were willing to visit and spend time with their new neighboring friends, compared to the local group’s 25% and 18%, respectively. Social companionship was also significantly enhanced over time, as the percentages approximately doubled from 2019 to 2021. It is understandable that as a result of the deepened interactions, social companionship was naturally enhanced by mutual visiting and spending time together. Emotional support was constrained amongst the same group members, as less than 10% of either group were willing to seek emotional comfort, which is often reserved for intimate links because it is often associated with personal privacy and unpleasant psychological states. Interestingly, in the instrumental support criterion, regarding the borrowing money category, the reports from neither group changed over time. Furthermore, there was very little evidence of any local group requesting financial assistance from the migrants, which was likely due to the fact that migrants, as the targeted poor hoping to alleviate poverty by relocation, are often sensitive and disadvantaged financially.
4.2. Specific Impact over Resettlement Types
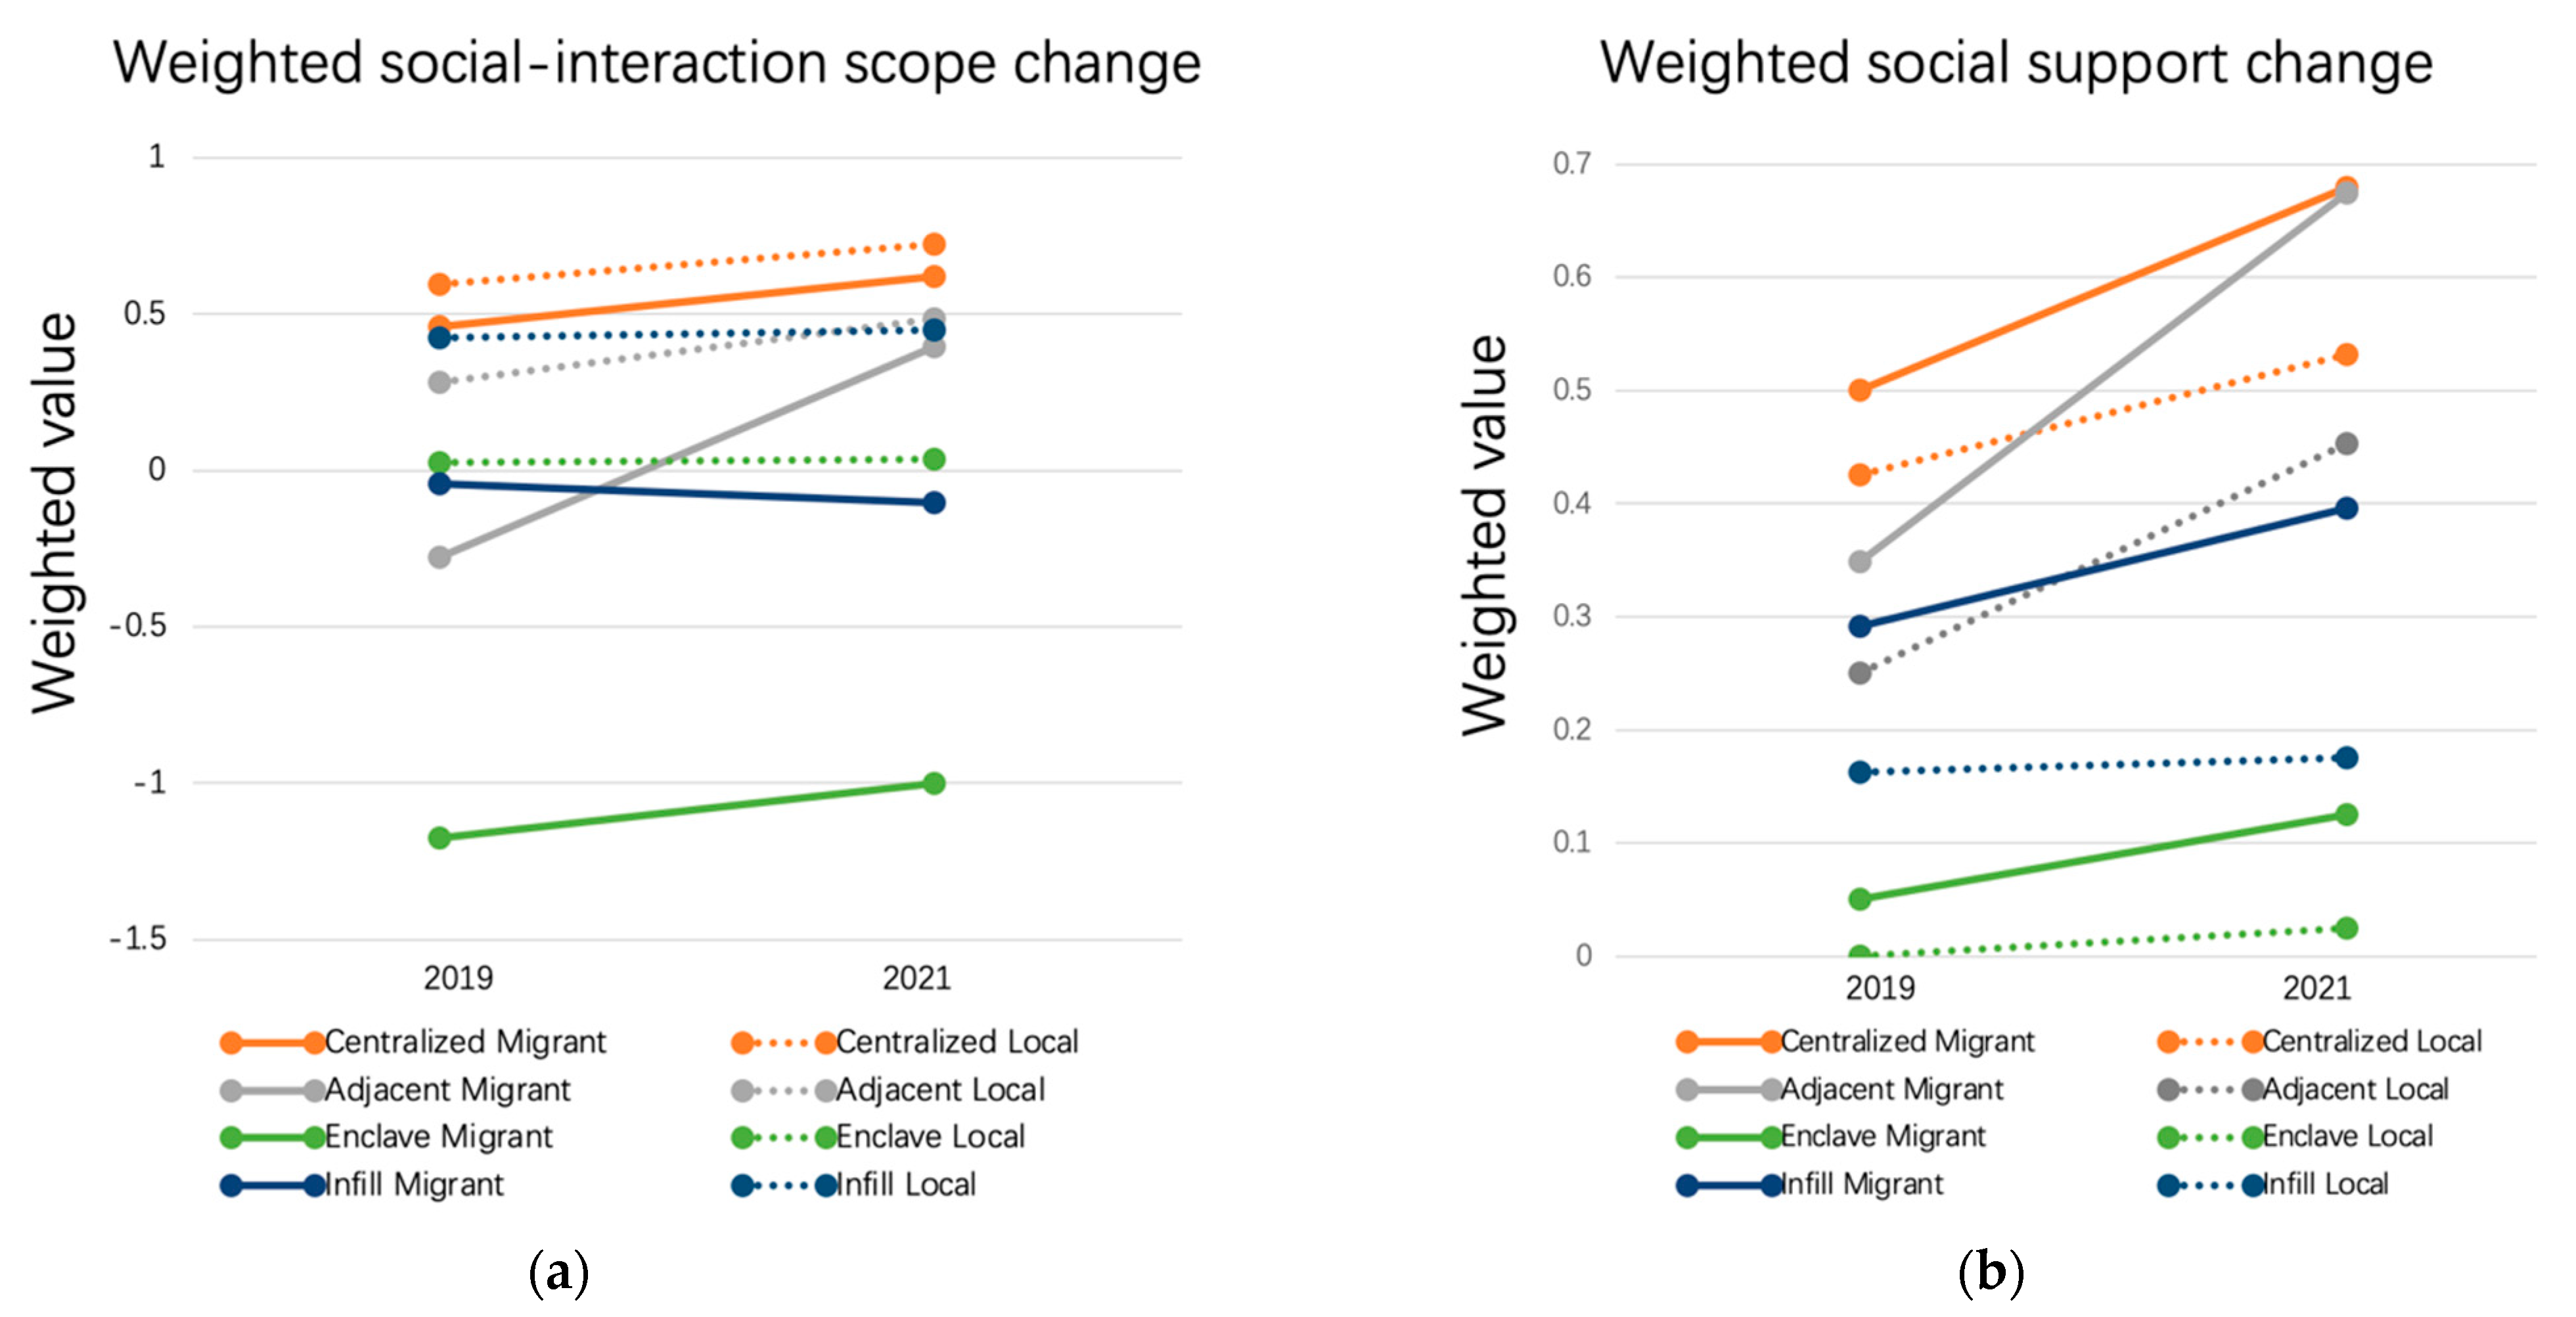
Based on the assigned values of the variables in
Table 2,
Figure 3 summarizes the specific impact over resettlement types by calculating the weighted values of their social-interaction scope change (
Figure 3a) and social support change (
Figure 3b). It demonstrates the evolution tendency under various resettlement types and physical environments, as well as their tendency through time. This study divided the time period into two stages: an earlier stage (PAR year-2019) and a later stage (2019–2021).
As a whole, we discovered that the locals experienced greater expansion in social interaction than the migrants in all four types of resettlements (
Figure 3a), indicating that the PAR project had a negative impact, overweighting the positive impact on the migrant group, considering the possibility of disconnection from previous social ties.
Figure 3b, on the other hand, depicts an inverse scenario, in which the migrant groups outperformed the local groups in terms of social support, which may be explained by the fact that vulnerable groups with lower incomes have a greater desire for social support.
4.2.1. Social Interaction Scope Change
Table 3 explores the dynamic changes of the two stages regarding the four different resettlement types.
According to the first survey conducted in 2019, in the earlier stage, the centralized type had the best performance in promoting intergroup interaction. The responses showed that 56% of the migrants and 45% of the locals in the centralized type successfully made new friends after resettlement. The enclave type was underperformed, as we found that the majority of migrants, approximately 85%, were confronted with difficulties in their attempts to expand and instead narrowed the scope. In contrast, the adjacent type and infill type had similar mid-level performances.
It is demonstrated in the flow charts that, in the later stage (2019–2021), more upwards and downwards curves were found in the migrant group, indicating that the re-settlers were more positively and negatively impacted over time than the locals. Specifically, the data showed that from 2019 to 2021, 37 out of 181 (20.4%) resettled individuals reported a further enlarged scope, whereas just 24 out of 273 (8.8%) local residents reported a similar circumstance.
Specifically, it can be estimated that approximately 16%, 58%, 5%, and 5% of the migrants in the centralized, adjacent, enclave, and infill types, respectively, underwent further expansion during the 2-year period. Among them, the adjacent type experienced the most dramatic change, while the infill type was found to show an opposite trend, as some residents experienced a process of increases and decreases.
4.2.2. Social Support Change
Similarly,
Table 4 summarized the specific impact on social support change over resettlement types. We concluded that the centralized type was the most outstanding type for promoting social support throughout the whole periods; then follows the adjacent type, in which great progress was made in the later stage (2019–2021). Mutual social supports underperformed in the enclave and infill types, presumably due to the distance barrier and scattered layout.
4.3. Understanding the Complexity
What is the most succinct way to summarize the performances of the four resettlement types? Their social performance and spatial reasons were explained and suggestions for planners were provided when considering the appropriate resettlement type.
Centralized type: Well performed and group balanced. Both groups performed well in the two stages in promoting neighboring interaction and support, forming a balanced status. Their performances also improved steadily over time. It is assumed that the resettlement occupied the public infrastructures of the centralized location collectively, thereby turning it into a “social hub” that facilitated the gathering and social contact of both groups. Therefore, we regard the centralized type as the superior choice.
Adjacent type: Rapid improvement in the later stage. This case performed at a middle level, but over time, we witnessed the largest growth slope, which allowed it to reach and even surpass the performance of the centralized type in the later stage. The main factor was that the average physical and social distances were among the smallest, thus enhancing the likelihood of an unforeseen contact, particularly in the border area. It is considered a wise choice in a longer term.
Enclave type: Consistently negative. The enclave type consistently underperformed in terms of generating social interaction and social support, while the local group remained stable and appeared to be irrelevant. It is possible that the enclave layout, due to the distance barrier, physically reduced the likelihood of intergroup meetings, hence potentially increasing residential segregation and hindering social integration. In this case, we recommend that the enclave type be considered as a last resort, unless there are other inevitable risks that are weighted more heavily than this point, such as land use restriction and protection of cultivated land.
Infill type: Rare improvement in the later stage. In the early stage, both groups thrived but failed to continue promoting intergroup social interaction. Between 2019 and 2021, the locals experienced no change, while the migrants showed a further narrowing of the scope of social interaction. Its smaller-sized clusters in the scattered layout may have been the reason for this phenomenon in which their connections with former friends were being alienated faster than the building of new local social connections. We assumed that after settling down, people would normally tend to interact within the cluster for a longer term. However, we observed an increase in migrants preferring the social support as progressively deepening social relationships. This type is considered to fit fragmented and hilly terrain conditions, where enhanced transport links between scattered clusters are required to maximize internal and external accessibility.
5. Discussion
5.1. Relation with Personal Socioeconomic Attributes
People’s social networks are heavily influenced by the composition of their households as well as their socioeconomic statuses [
43]. In particular, marginalized groups such as low income, elderly, and single residence are particularly more reliant on neighboring relationships due to a lack of alternative possibilities. Therefore, we developed a list of potential socioeconomic variables, including gender, age, education, employment, family size, workplace, monthly household income, and frequency of using the public squares. Two multiple linear regression models were built, one for the migrant group and one for the local group, in order to determine the connections between social-interaction scope change and socioeconomic attributes for the two groups (
Table 5).
With statistically significant effects, the results implied that age, family size, income, and frequency of using public spaces were regarded as important predictors for both groups in predicting changes in social interaction. Residents who were middle aged (40–60), had middle-sized families, with middle-level incomes, and those who utilized the public spaces more frequently were more likely to expand their scope of social interaction.
The distinctions between the two groups are: (1) The migrants are also influenced by the workplace while the locals are not. Presumably, this is because migrant workers away from the community may not have the time, opportunity, nor energy to socially structure their new communities by acquiring new local acquaintances; consequently, they will definitely experience a decreasing social scope in their local communities. (2) Monthly income had a more significant impact on the migrant group than the local group. Given the fact that the migrants targeted were poor, their economic disadvantage makes them financially sensitive in many aspects, including social participation in activities and interactions.
Monthly income was the most critical variable affecting the migrant group. Those who earned CNY 3000–7000 per month, as their financial situation improved, symbolically represented themselves as having shed the “poor” label and successfully approached the mainstream level, leading to the expansion of social networks. However, for those who earned less than CNY 1000 per month, there was a very high chance that they would be marginalized and would fail to integrate.
Another related socioeconomic factor was the frequency of visits to public spaces. Two facts may explain this finding. The first is the personality aspect: persons who were more inclined to visit public spaces were found to have more outgoing personalities, which indicated that they were more interested in forming new ties. The second is the public space aspect: public spaces serve as physical carriers for large-scale gatherings and public social activity, as well as being venues for meeting new people and expanding social interactions.
What are the possible reasons preventing the residents from visiting public spaces? We randomly asked 20 residents who rarely visited the facilities for a better understanding. As shown in
Figure 4, 75% of them expressed dissatisfaction with the equipment and maintenance work on the public facilities, naming it as the primary reason preventing them from visiting. In addition, 65% thought that the public social activities held there were not that attractive. Many of them mentioned square dancing, which is regularly held in Chinese communities, and was described by a number of respondents as having the greatest engagement among middle-aged residents, but it failed to encourage the younger and older generations to become involved. Moreover, about half of them had no interest in using the public spaces, as some were busy with work or domestic chores, while others had physical disabilities. Furthermore, 25% found them difficult to access due to distance concerns, which was particularly the case for the infill type, as the clusters were in scattered layouts, making the residents less inclined to pay a visit. The relevance of multifunctional planning based on demand assessment for diverse socioeconomic groups, as well as the selection of accessible locations for public spaces, are consequently emphasized.
5.2. Laying Claims to Space
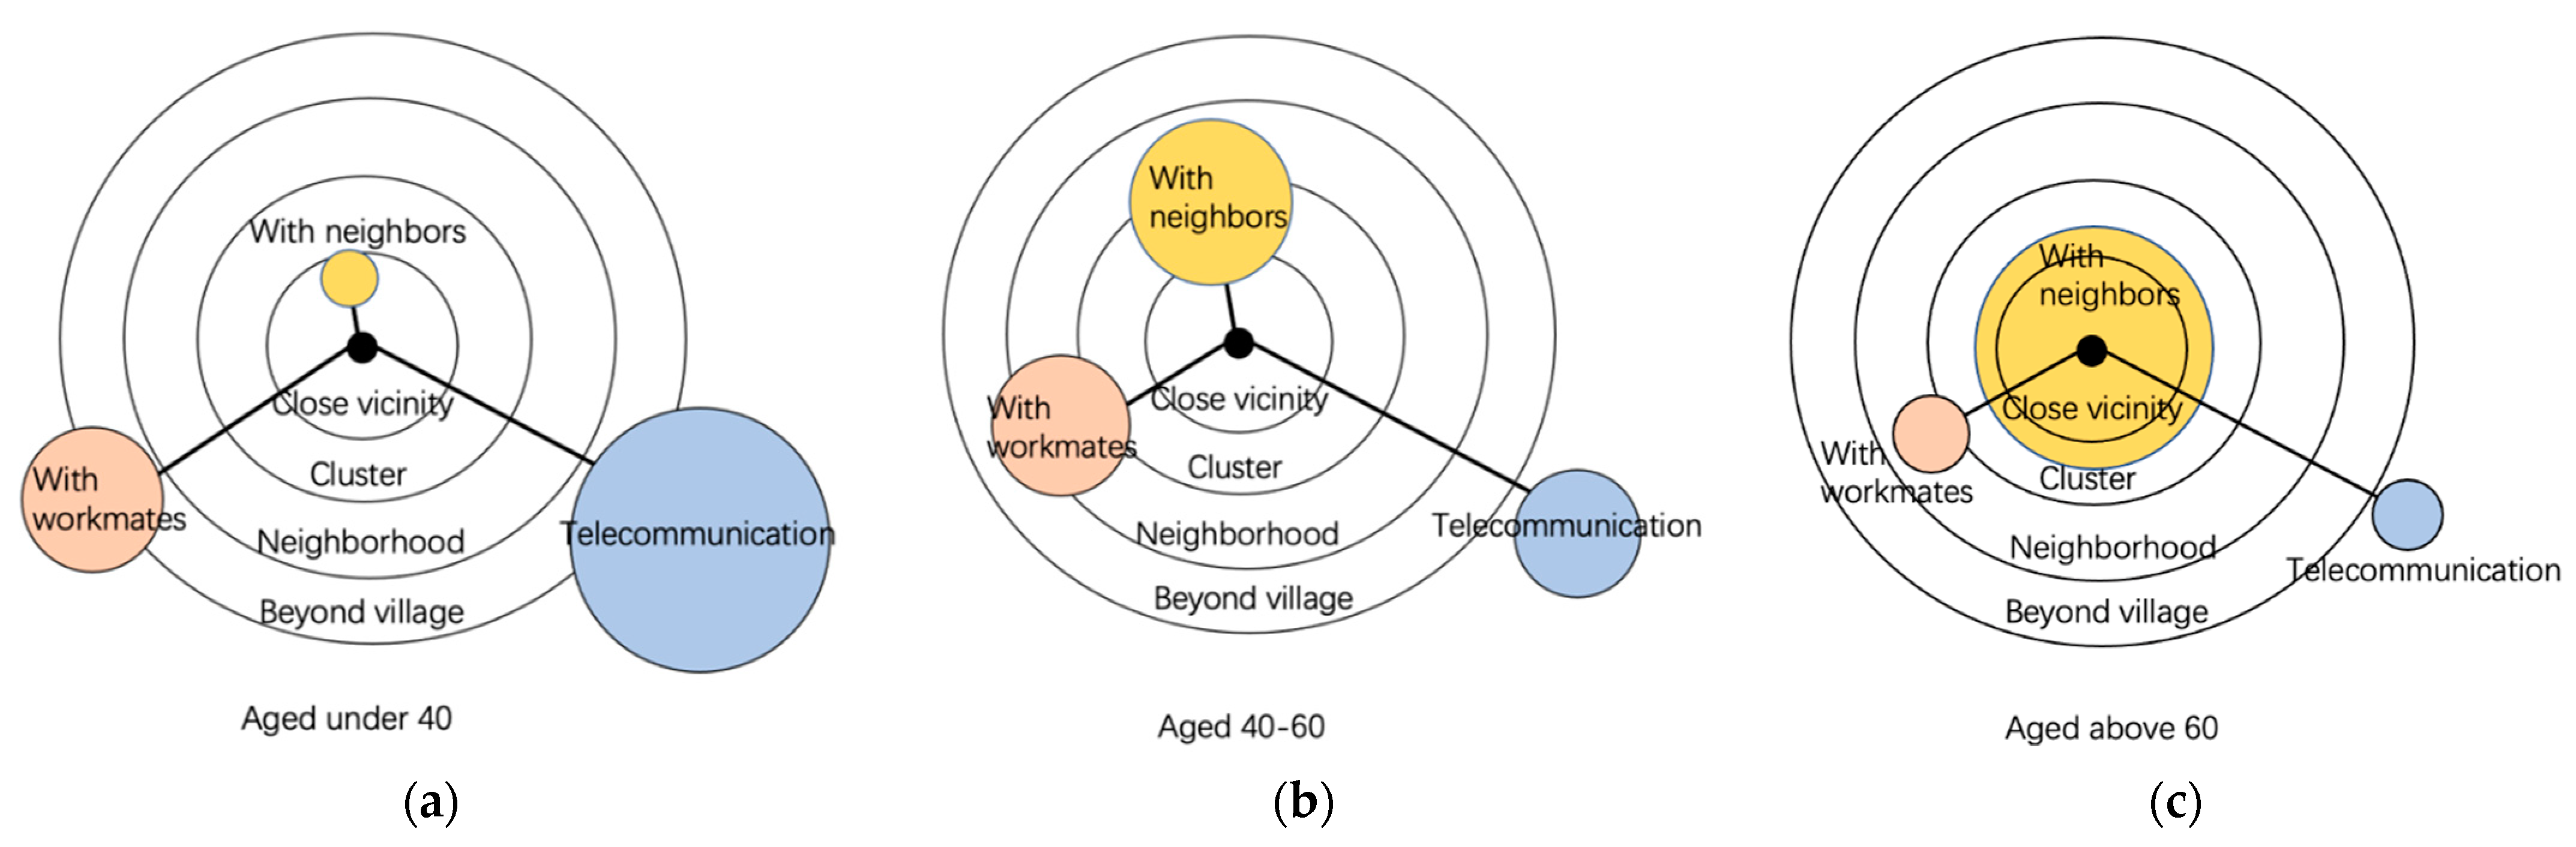
Our research looked into the spatial anchoring of social interactions in accordance with Schnell’s proposed socio-spatial isolation indices [
44]. We categorized the three kinds of social activities on a social basis: namely, working, meeting neighbors and friends, and telecommunication. Next, we identified four territories on a spatial basis that was defined by four concentric circles, with increasing distances from the homesites: namely, close vicinity, cluster, neighborhood, and beyond the village. Close vicinity, with the closest proximity to home, was mainly exclusively occupied by a single group in the collective PAR projects, rendering it the space that carried the most social interactions and social support.
Such socio-spatial dynamics have a tendency to differ depending on the age cohort. As shown as
Figure 5, younger residents (aged under 40) appeared to have the broadest activity territory, as the main workforce, with longer hours in the workplace outside of the village area. Their addiction to the internet was highlighted, resulting in a greater level of involvement in telecommunications in the cyber world. Thus, the time and effort afforded to neighboring social interactions in the real world were significantly limited. Middle-aged residents (aged 40–60), on the other hand, were more adaptable to changing work schedules while still maintaining high mobility, owing to their relatively more mature life experiences and social capital, which made them the foundation of a kinship-based social network in the rural community. They were more active in narrowing territories than the younger residents. Longer hours were spent in the neighborhood, thereby increasing the amount of social interaction among neighbors and enabling them to achieve the best results in terms of broadening their scope of social interaction. Finally, the older residents (aged above 60) were found to be restricted to the smallest territories, given the fact that the older generation generally has a lower level of working participation and physical mobility, but a higher incidence of single residence, and greater difficulty utilizing current communications technologies. They may have spent a long time with proximate neighbors who were mainly from the same group, thereby making a limited contribution to the expansion of social interactions.
5.3. Economic Benefits and Limitations
On the one hand, the majority of migrants reported increased income and household assets as a result of the project, demonstrating that poverty alleviation through relocation projects successfully enhanced the living standards and economic conditions of the targeted population. The narrowed social capital gaps between locals and migrants contributes to the social equality and integration.
On the other hand, we discovered that migrants still lack social and economic parity with the locals in the local employment market. Many locals in Xiling village, for example, worked in the turquoise mining and processing factories, whereas vast numbers of migrants remained unemployed or were engaged in low-wage agriculture-related jobs. Because of its short production cycle, low output threshold, and intense space utilization, mushroom production and processing has become the dominant business for migrant poor households to make full use of the local plentiful mountain resources (
Figure 6). However, we discovered that mushroom production was primarily conducted in a family workshop, which was not only inefficient, but also unable to ensure quality. This extremely exclusive production mode can easily lead to a lack of economic integration with local industries and other production units, thus limiting social capital and interpersonal integration in a longer term.
Economic integration strategies should be proposed at all levels, which is an important step before developing emotional attachments and achieving true social integration. Such as the introduction of cooperative organizations, the provision of related production guidance and education, the diversification of industries and production methods, the expansion of production scale, and the promotion of centralized production, etc. They are favorable to boosting economic equality and enhancing local industry integration in order to accomplish true poverty alleviation and long-term growth.
6. Conclusions
Targeting the migrant group and the local group from the poverty alleviation relocation project in rural communities, this study researched the reshaping of neighboring social networks through a longer-term observation from 2019 to 2021.
Following the typology of resettlement in terms of residential segregation, four types of resettlements were investigated: namely, the centralized, adjacent, enclave, and infill types. The migrant group and the local group were each asked to express their personal experiences on changes in neighboring social-interaction scope and in intergroup social support. The results were compared and analyzed by groups and resettlement types.
By groups, the migrant group witnessed much more significant changes than the local group in terms of the interaction scope, both positively and negatively. Some successfully made new local ties, while some lost connections with previous social ties. The locals, such as the dominant group in the mainstream host society, had a more stable status as no decrease in the scope of social interaction occurred. Regarding the social support, a similar trend was observed: the migrants were more willing to ask for intergroup social support and subsequently, compared to the locals, the more significant increase was maintained in the later stage between 2019–2021. Intergroup social support of the social companionship kind was relatively common.
By resettlement types, we offered some advice for planners when deciding which type to adopt for promoting social integration:
The centralized type is the superior choice, as it showed a good and balanced performance in all stages. Both groups in the representative case performed well in promoting neighboring interaction and support, contributing to a balanced status. Their performances also steadily improved with time.
The adjacent type was a good choice in the longer term, considering its rapid improvement in the later stage. The case showed middle-level performance in the early stage (before 2019), but it improved rapidly over time, as we saw a larger growth slope between 2019 and 2021, causing it to outperform the centralized type.
The enclave type should be reserved as the last option because of its consistently negative impact. The enclave type continuously underperformed in promoting social interaction and social support, as migrants mainly suffered quite obvious negative impacts brought by PAR, while the local group remained unchanged and showed irrelevance.
The infill type could be a considerable choice for the short term, as it rarely showed improvement in the later stage. In the early stage, both groups thrived but failed to continue promoting intergroup social interaction. Between 2019 and 2021, the locals rarely experienced changes, while the migrants narrowed their scope of social interaction but increased in social support.
The associated personal socioeconomic factors for fostering the scope expansion of social interaction were also explored, with particular emphasis on the perspectives of locals and migrants. In both groups, the most important predictors were found to be age, family size, income, and the frequency of visiting public spaces. The socio-spatial dynamics of the age cohorts also differed. As people’s ages increased, their activity territories shrank from territories beyond the village, to the neighborhood, and to close vicinity. As a result, consideration should be given to customized spatial planning depending on the characteristics of the users. Moreover, we discovered that migrants still lack social and economic parity with the locals in the local employment market, strategies were proposed at all levels, to boost economic equality and enhance local industry integration.
Through a 2-year observation, this study provides insight for the reshaping of neighboring social networks, and the comparisons of resettlement types, groups, and years provide the planners with preferred options for the resettlement type and deciding the relocation destination in a longer term. We consider it helpful and an important aspect for promoting social sustainability in the rural community after collective relocation.
However, the study has some limitations. First, the 2-year period of observation maybe still insufficient to reflect a complete pattern of social change. Longer observations are expected in order to achieve true long-term sustainability. Second, the existing measurement dimensions are still vague and simplistic, and more variables may be added in the future: for example, frequency, items, subjectivity, and quality of social interactions, as well as economic and cultural dimensions, etc. Third, we only examined the cases in Hubei Province, central China, and we suspect that the results would be different in other regions with distinct geographical and socioeconomic backgrounds, comparative studies are necessary for gaining a broader perspective on a greater scale. In our future study, we expect to establish a thorough assessment system to examine the effectiveness of various types of PAR projects in different regions under the present policies and to provide predictions and suggestions on future development trends.


