
Identifying Critical Risk Factors in Green Product Certification Using Hybrid Multiple-Criteria Decision-Making


Abstract
:1. Introduction
2. Literature Review
2.1. Uncertainty Analysis in the Certification Process
2.2. Identifying Risk Factors in the Certification Process
2.3. Analysis of Risk Factors in Product Certification
2.4. MCDM and Its Application in Risk Management and Green Product
3. Methodology
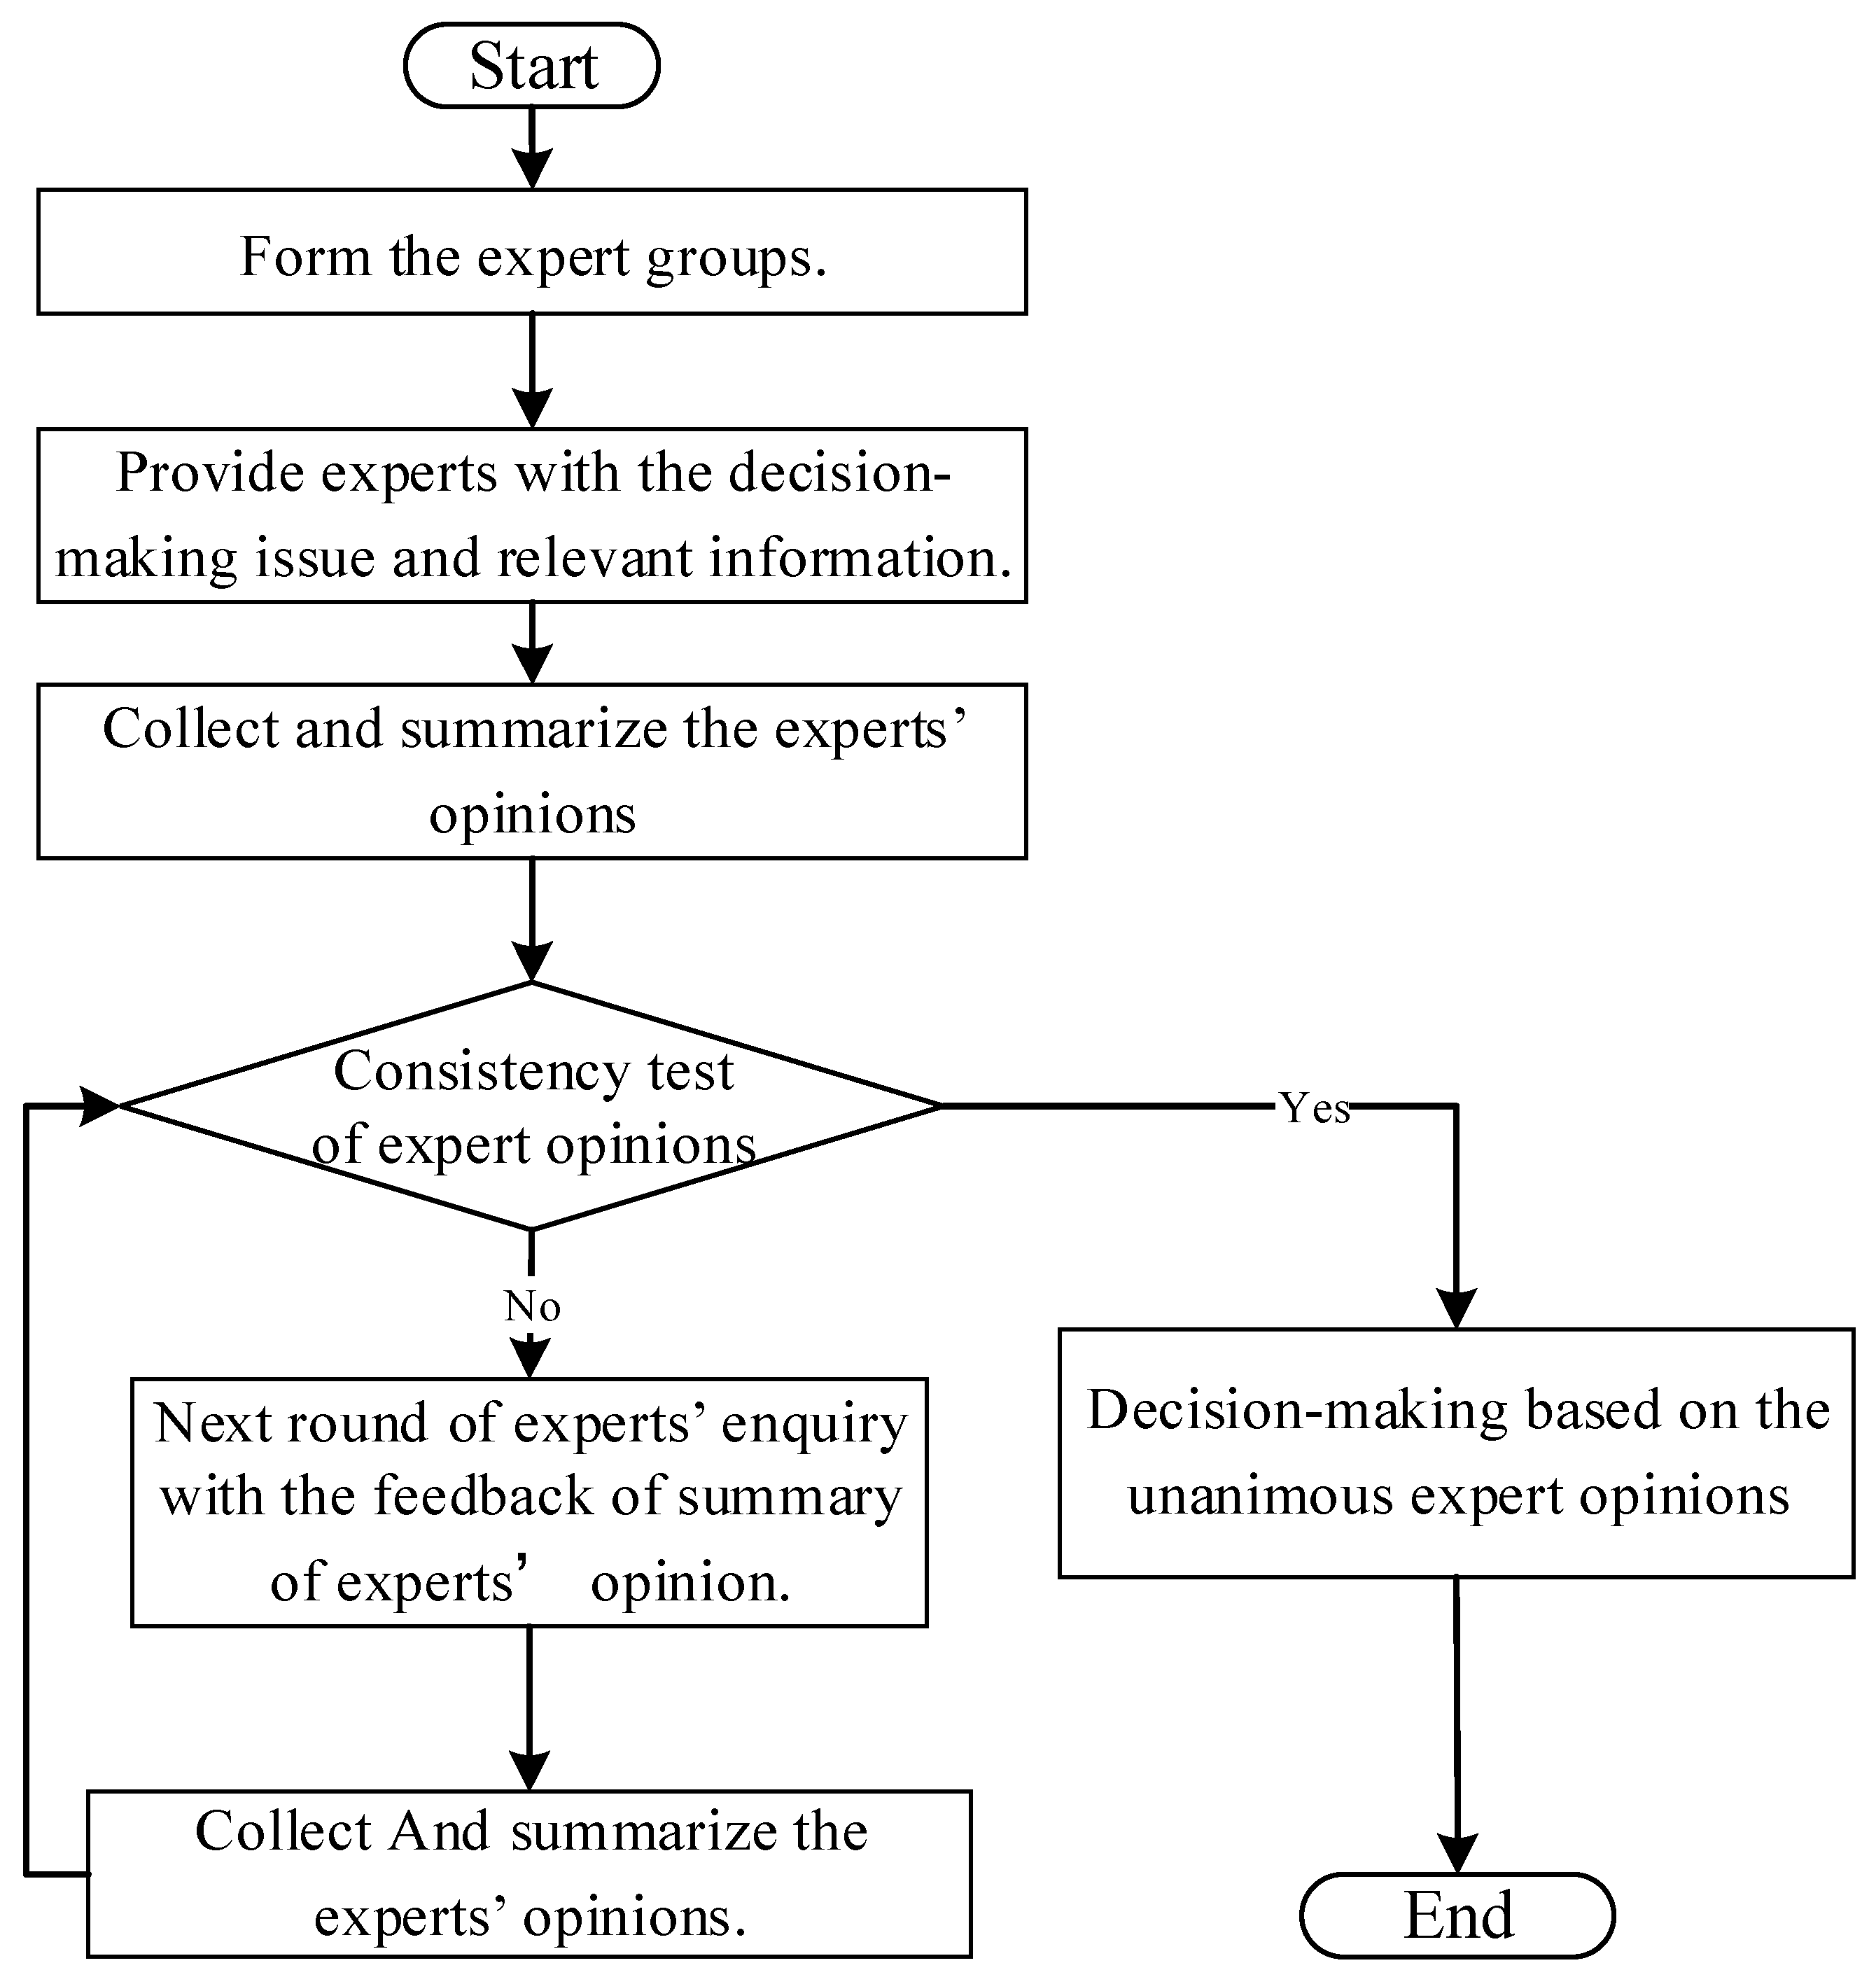
3.1. Delphi Method
- Step 1: Form a group of experts based on the issues to be decided;
- Step 2: Provide the experts with the problems to be solved and the relevant information;
- Step 3: Collect the experts’ opinions;
- Step 4: Perform a consistency test on the expert opinions.
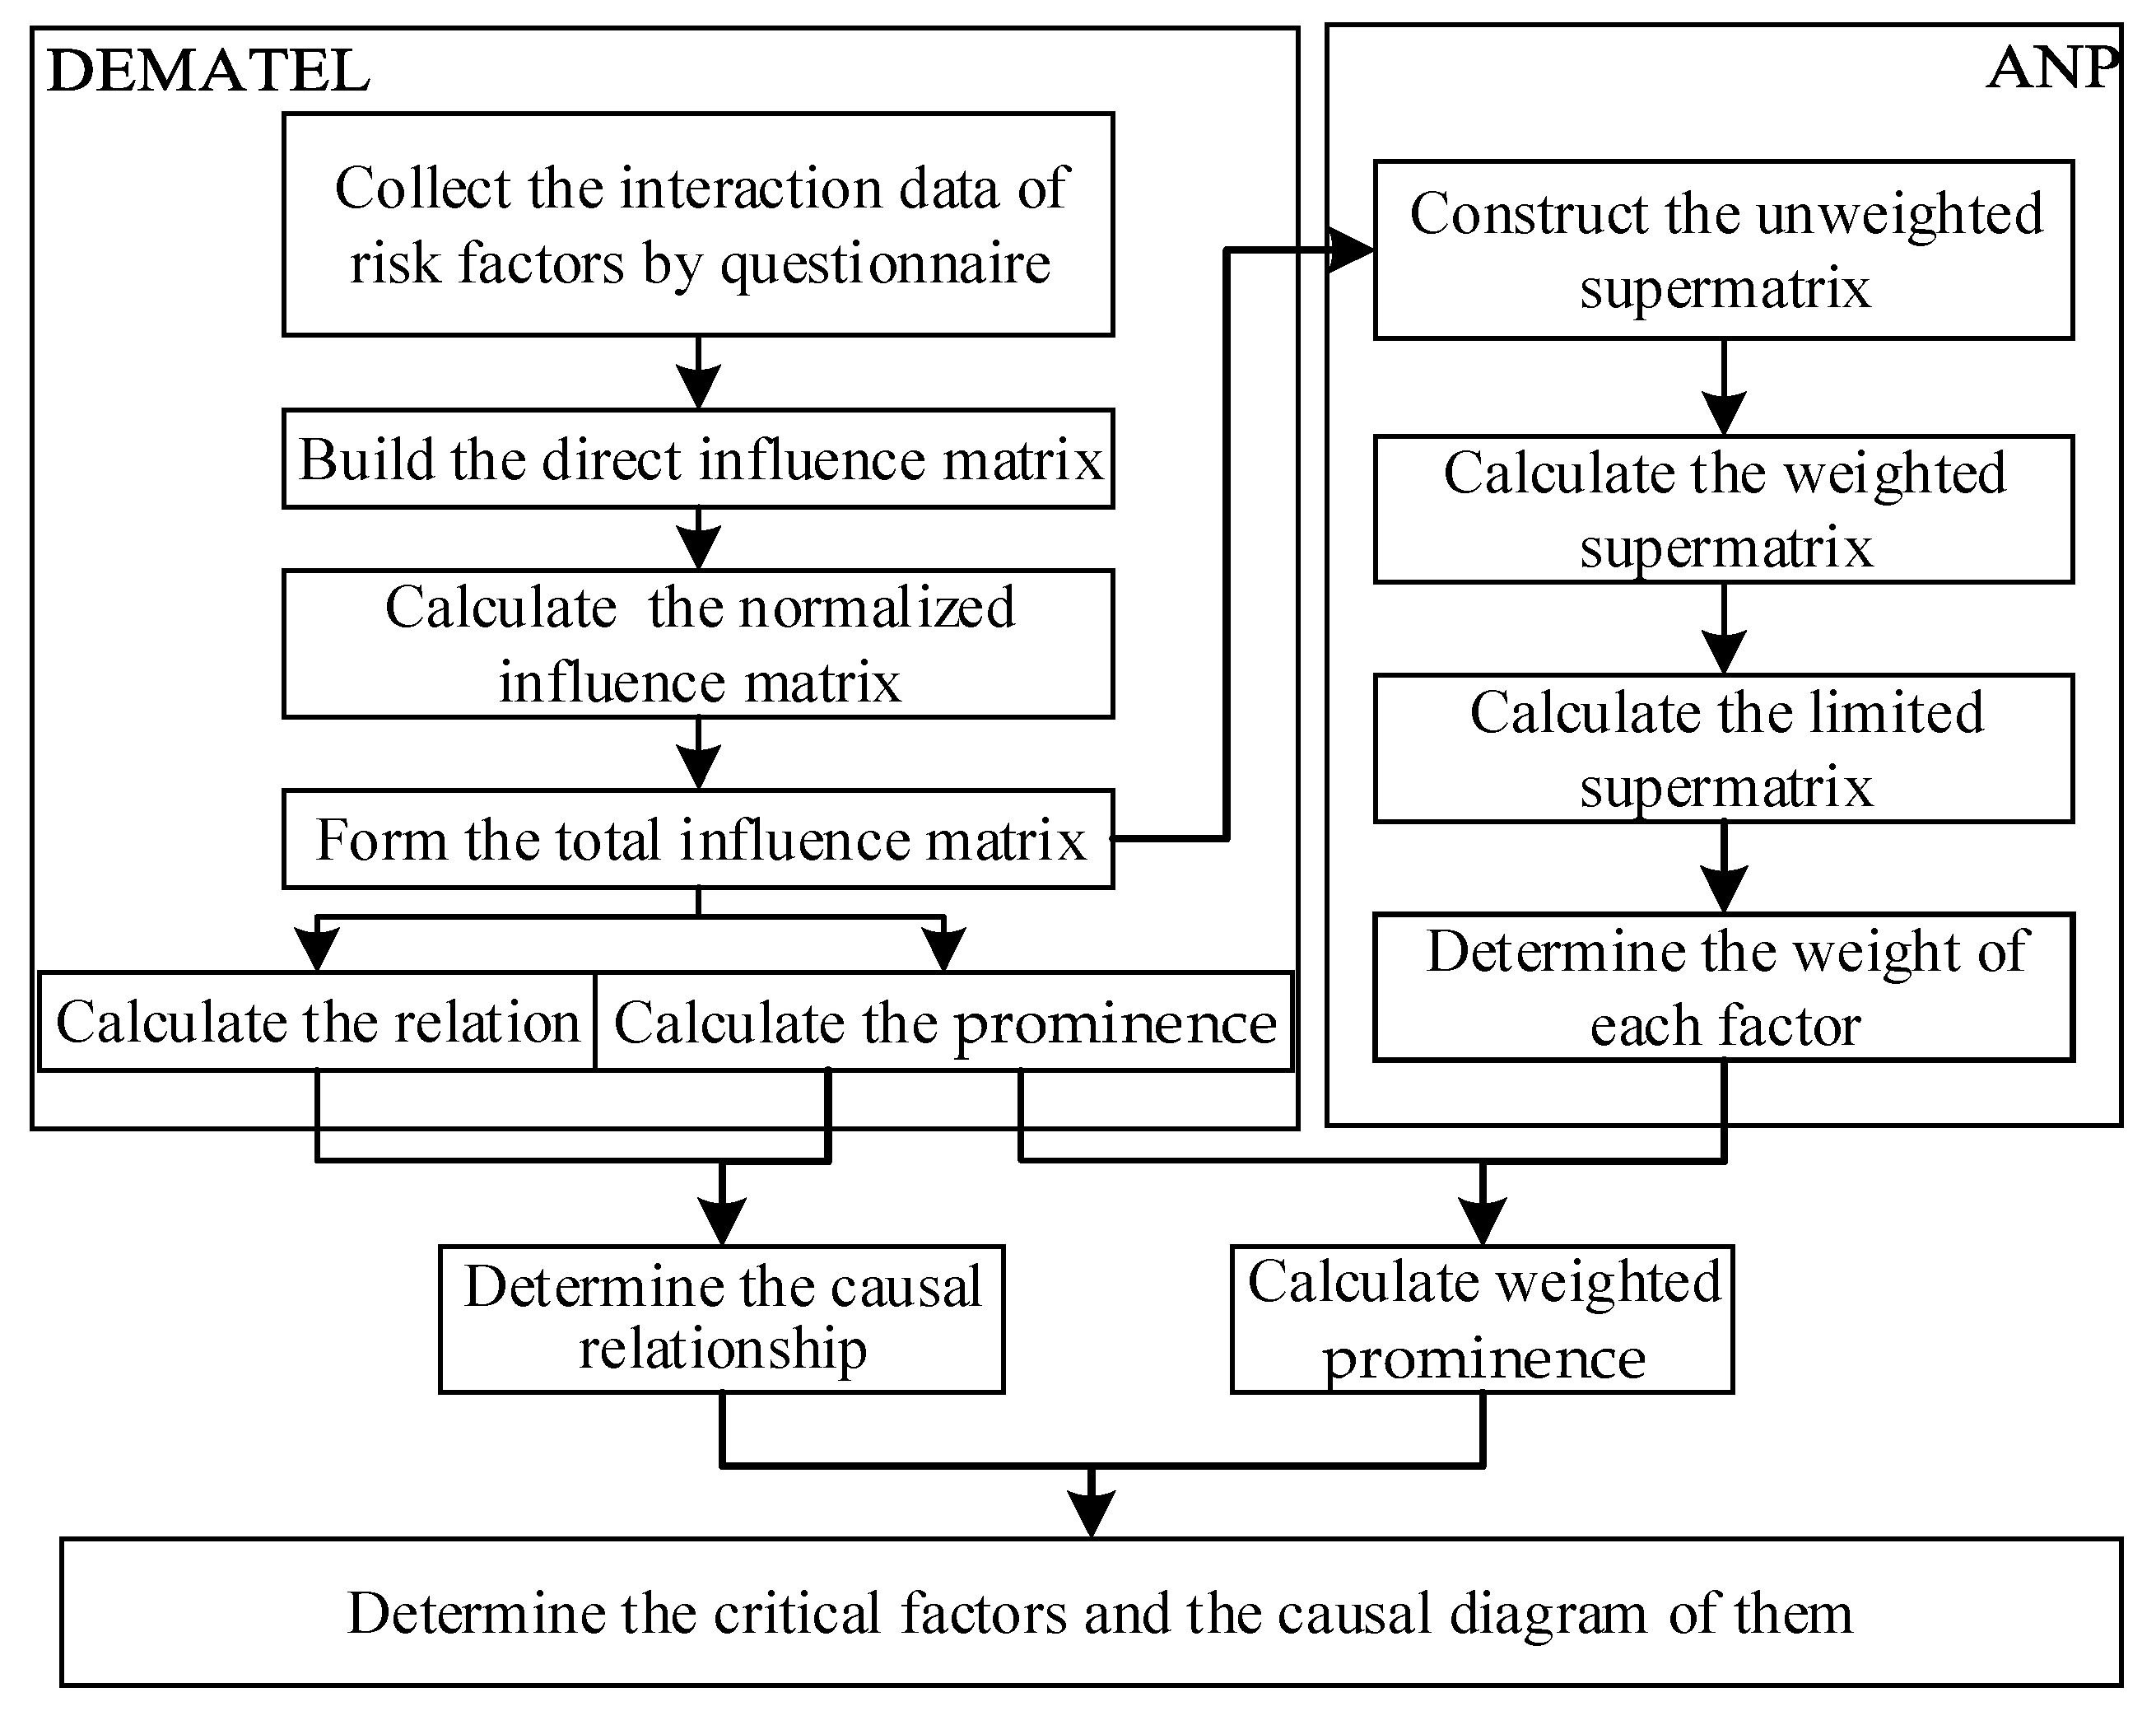
3.2. D–ANP
- First, we collected data on interactions among the risk factors in GPC by using a questionnaire. The initial direct influence matrix Z for the risk factors in GPC is shown in Equation (1), where indicates the degree of influence of risk factor i on factor j:
- Second, we normalized the matrix Z to obtain the normalized direct influence matrix X. The process is shown in Equation (2), where .
- Third, we calculated the total influence matrix T according to the normalized direct influence matrix X. , and I represents the unit matrix. The total influence matrix T is regarded as an unweighted supermatrix for ANP. The weighted supermatrix, limited supermatrix, and the weights of each risk factor were calculated by the ANP.
- Fourth, we determined the interactional relationships between the risk factors. We assumed that in the total influence matrix T, represents the sum of the risk factors in the row, namely, the value of the comprehensive impact of the i-th risk factor on the other factors, and represents the sum of the risk factors in the columns, that is, the total impact on the i-th risk factor by the other factors. The relation of the i-th risk factor can be obtained by . If , it indicates that this risk factor has a significant impact on the other factors, and is called the driving factor. The higher the value is, the greater the influence of the risk factor on the other factors. If the opposite is the case, the factor is called the outcome factor. This was used to construct a diagram of the causal relationships among the risk factors.
- Finally, we determined the ranking of the risk factors and critical ones. The prominence of the i-th risk factor was calculated by , indicating its importance in GPC. At the same time, the weight of each factor was calculated according to the ANP. The weighted prominence of each factor was calculated and was used to rank the risk factors and identify the critical ones.
4. Empirical Study
4.1. Establishing the Formal Decision Structure
4.2. Identification and Analysis of the Critical Risk Factors
5. Discussion and Implications
- (1)
- The standardization of management of certification institutions is the most important risk factor. The effectiveness of GPC is affected by whether the certification body earnestly implements the rules of certification, and whether the selection, training, continuing education, and performance evaluation of the personnel are scientific and reasonable. Therefore, certification institutions should strengthen their measure of standardization. Only in this way can they deal with all kinds of certification-related risks. However, the standardization of the management-related risks of certification institutions is a resulting factor that is mainly affected by the working life of these institutions, which shows that they need to continually improve their specifications in the long term.
- (2)
- The working life and experience of the certification institution are the critical factors driving the risk in certification. The former has a decisive impact on the experience, impartiality, and standardization of management of the organization. It also significantly affects the allocation of human resources and the standardization of sampling operations in the process of certification. Therefore, organizations that have carried out certification for a long time have rich certification experience and a more standardized management system to ensure the impartiality of the process. In this way, the institutions can allocate the necessary number of competent personnel to carry out the relevant business operations. The experience of certification institutions has a decisive impact on the difficulty of testing green indicators, the coverage of inspection of green indices, and the number of green indices. Certification institutions with rich experience can improve their coverage of the green indices of certification businesses to reduce the risk caused by a large number of indices and the difficulty of testing them. Regulatory authorities should also strengthen the inspections and supervision of certification businesses with little experience.
- (3)
- The impartiality of certification institutions has an important impact on the overall risk in GPC. If there is no guarantee of impartiality, the green certificate issued by the institution has no authority. The impartiality of the certification institution is mainly reflected in whether it aims to make a profit, has established an adequate committee to maintain impartiality, its operation and management are independent, it has an interest-based relationship with the entrusting enterprise, has issued a declaration of impartiality and implemented it, has established a code of conduct to regulate the behavior of the certification personnel, and whether there is discrimination against the applicant. Certification institutions should test their own impartiality based on the above and regulatory authorities need to supervise them as well.
- (4)
- If the certification institution reduces the number of green indicators for inspection or does not appropriately inspect green indicators to save on labor and material resources during the inspection, the certification-related risks increase. Rules for the implementation of GPC must be strictly implemented in the process of certification, and the standard of coverage of green indicators stipulated by the state should not be meddled with. The regulatory authorities should conduct spot-checks on the human and material resources used, as well as the green indicators inspected, to ensure the quality of the certification work.
- (5)
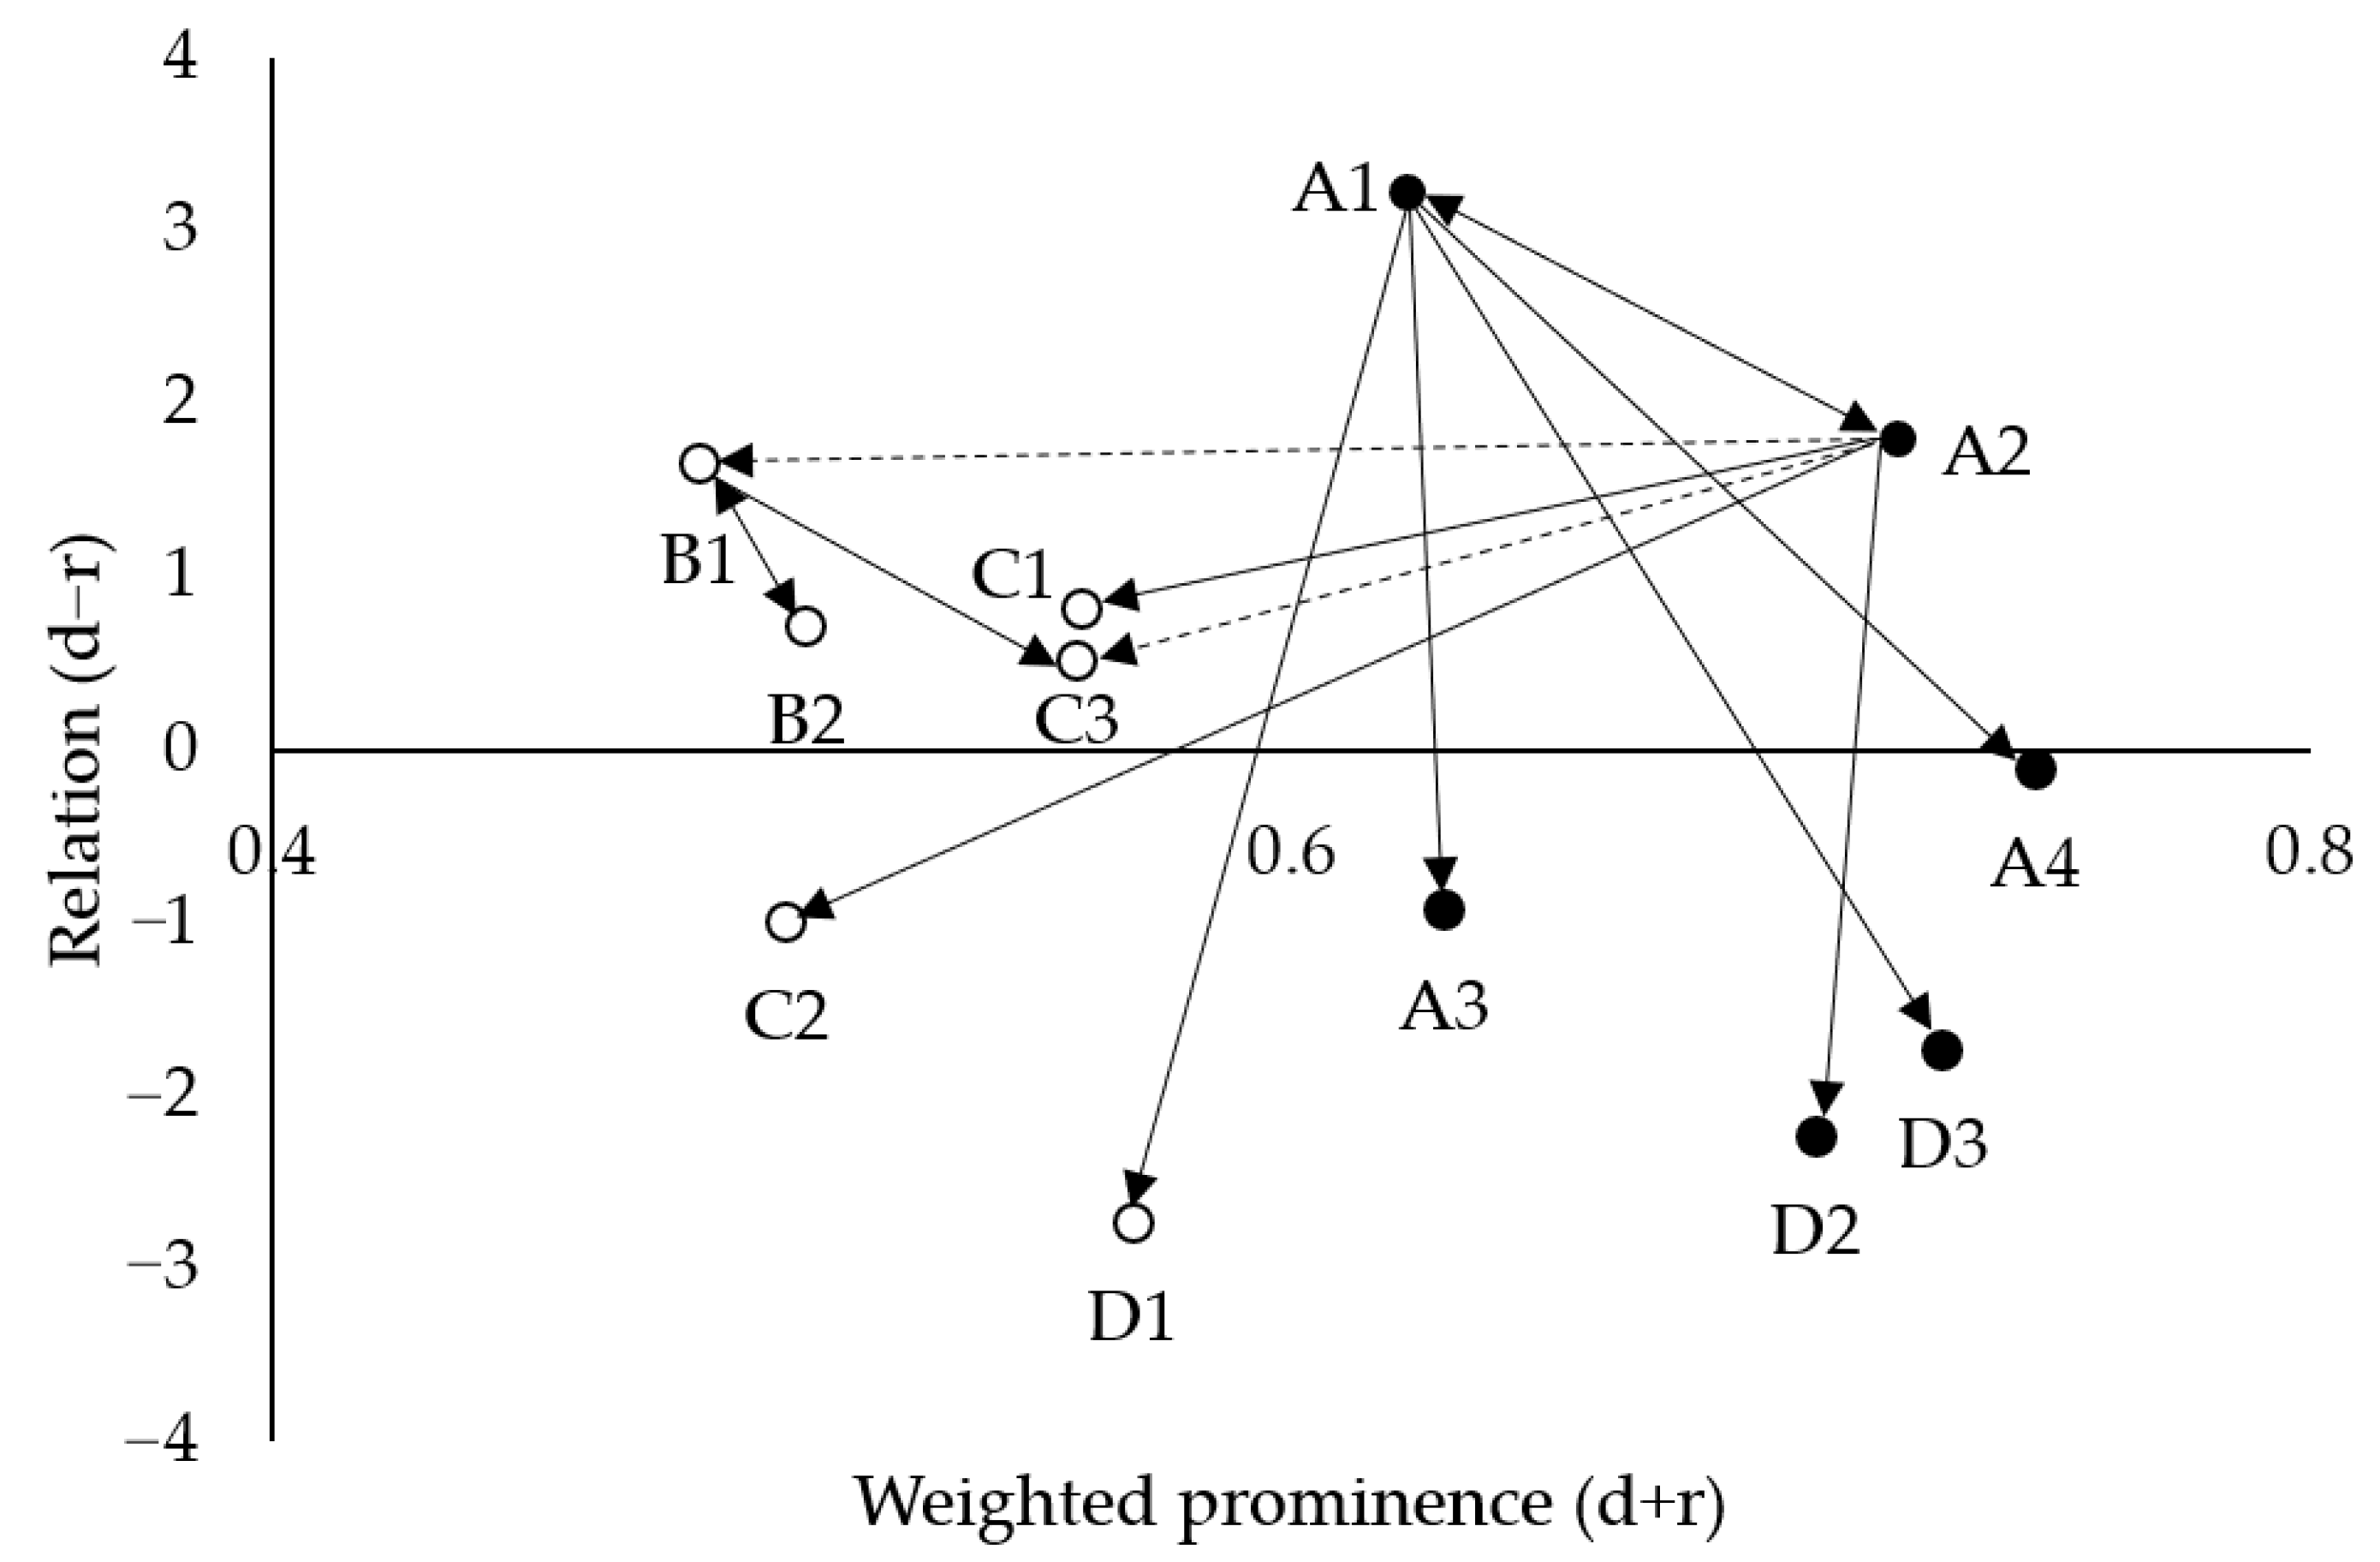
- The degree of standardization of sampling in the implementation of GPC has an important impact on the overall risk in GPC. Standardization is mainly manifested in whether different categories of products of the same certification unit were sampled, whether the number of sampling products to be inspected meets the requirements of the certification specifications, whether the sampling method is scientific and reasonable, and whether the laboratory for sampling has the corresponding qualifications. If the sampling inspection is not standardized, the risk of certification increases. Therefore, the relevant management should be strengthened in the implementation of certification. In addition, as shown in Figure 2, the degree of normalization of sampling is a resulting factor that is mainly affected by the age of the certification body. That is, the sampling operation of certification bodies with more experience is more standardized, which means that supervision departments should strengthen the inspection of sampling operations in newly established certification institutions.
- (6)
- The risk factors pertaining to the entrusting enterprise and the certification business are also sources of risk to GPC. However, the results here showed that these two types of risks were not critical. The scale of the entrusting enterprise, the satisfaction of the technical management, and the difficulty of the certification business did not play a decisive role in the risk to certification because the entrusting enterprise and the authentication business were only the objects of authentication, which is an external cause of the system of risk. However, external causes could permeate the system through internal causes. If the certification institution has the corresponding professional experience and standardized certification management, strictly implements the norms of implementation of certification, fairly carries out the certification business, and is equipped with the necessary material and human resources, potential risks associated with the object of certification can be avoided.
6. Conclusions
- First, we formed the initial set of risk factors for certification by combining the insights of past studies in the area. The set contained 18 risk factors pertaining to the certification institution, entrusting enterprise, certification business, and the implementation of certification. Expert scoring was used to screen and optimize this initial set. Six risk factors below the threshold were eliminated by calculating the mean value of their necessity scores and dispersion coefficients. A set of risk factors in GPC containing 12 risk factors was thus obtained;
- Second, we used the DEMATEL method to analyze the interactional relationship among the risk factors. A questionnaire survey was filled out by experts in the field of GPC, and the data were used to construct a direct influence matrix of the risk factors. A total influence matrix was then obtained from it. The risk factors are divided into driving factors and resulting factors according to their relations. Driving factors were the fundamental sources of risk in GPC and included the working life of the certification institution, its certification experience, the scale of the entrusting enterprise, satisfaction with the technical management of the entrusting enterprise, the number of green indicators involved in the certification business, and the multi-site attribute of the certification business;
- Third, the DEMATEL–ANP model was used to identify the critical risk factors in GPC. The weighted prominence of each risk factor was then calculated by combining its prominence from the DEMATEL model with its weight coefficient from the ANP model. It was used to identify the critical risk factors in GPC;
- Finally, countermeasures for risk prevention and to ensure control over GPC were proposed.
Author Contributions
Funding
Institutional Review Board Statement
Informed Consent Statement
Data Availability Statement
Acknowledgments
Conflicts of Interest
Appendix A

1. What do you think about the impact of the working life of the certification institution on its certification experience?
|
2. What do you think about the impact of the working life of the certification institution on its strength?
|
3. What do you think about the impact of the working life of the certification institution on its impartiality?
|
4. What do you think about the impact of the working life of the certification institution on its management standardization?
|
References
- Gurau, C.; Ranchhod, A. International green marketing: A comparative study of British and Romanian firms. Mark. Rev. 2005, 2, 547–561. [Google Scholar] [CrossRef]
- Lam, A.Y.C.; Lau, M.M.; Cheung, R. Modelling the relationship among green perceived value, green trust, satisfaction, and repurchase intention of green products. Contemp. Manag. Res. 2016, 12, 47–60. [Google Scholar] [CrossRef]
- Palevich, R. Lean Sustainable Supply Chain: How to Create a Green Infrastructure with Lean Technologies; Pearson Education: London, UK, 2011. [Google Scholar]
- General Rules for Green Product Evaluation; GB/T 33761-2017; China Standards Press: Beijing, China, 2018.
- Hemmelskamp, J.; Brockmann, K.L. Environmental labels—The German ‘Blue Angel’. Futures 1997, 29, 67–76. [Google Scholar] [CrossRef]
- Zhang, C.L.; Zhang, J.; Tian, X.F. Identification and evaluation of key risk points of green product certification based on combination weighting. J. Stat. Inf. 2019, 34, 83–91. [Google Scholar]
- Murphy, B.; Martini, M.; Fedi, A. Consumer trust in organic food and organic certifications in four European countries. Food Control 2021, 133, 108–148. [Google Scholar] [CrossRef]
- Zhang, C.L.; Zhang, J.; Jiang, P. Assessing the risk of green building materials certification using the back-propagation neural network. Environ. Dev. Sustain. 2021. Early Access. [Google Scholar] [CrossRef]
- Ouyang, Y.P.; Shieh, H.M.; Tzeng, G.H. A VIKOR technique based on DEMATEL and ANP for information security risk control assessment. Inf. Sci. 2013, 232, 482–500. [Google Scholar] [CrossRef]
- Bao, C.; Wu, D.; Li, J. Measuring systemic importance of banks considering risk interactions: An ANOVA-like decomposition method. J. Manag. Sci. Eng. 2020, 5, 23–42. [Google Scholar] [CrossRef]
- Saaty, T.L. Fundamentals of Decision Making and Priority Theory with the AHP; RWS Publications: Pittsburgh, PA, USA, 1994. [Google Scholar]
- Tian, B.; Liu, P.Y.; Zheng, Y.S. Research on risk identification and evaluation of Internet of vehicles information platform based on ANP Method. Inf. Sci. 2018, 36, 100–104. [Google Scholar]
- Liu, C.; Li, K.; Jiang, P.; Li, D.; Su, L.; Lu, S.; Li, A. A hybrid multiple criteria decision-making technique to evaluate regional intellectual capital: Evidence from China. Mathematics 2021, 9, 1676. [Google Scholar] [CrossRef]
- Jiang, P.; Wang, Y.; Liu, C.; Hu, Y.-C.; Xie, J. Evaluating Critical Factors Influencing the Reliability of Emergency Logistics Systems Using Multiple-Attribute Decision Making. Symmetry 2020, 12, 1115. [Google Scholar] [CrossRef]
- Gao, G.J. Innovation and Perfection of Compulsory Product Certification System; Southwest University of Political Science & Law: Chongqing, China, 2016. [Google Scholar]
- Albersmeier, F.; Schulze, H.; Jahn, G.; Spiller, A. The reliability of third-party certification in the food chain: From checklists to risk-oriented auditing. Food Control 2009, 20, 927–935. [Google Scholar] [CrossRef]
- Deaton, B.J. A theoretical framework for examining the role of third-party certifiers. Food Control 2004, 15, 615–619. [Google Scholar] [CrossRef]
- Bao, C.B.; Wu, D.S.; Wan, J. Comparison of Different Methods to Design Risk Matrices from The Perspective of Applicability. Procedia Comput. Sci. 2017, 122, 455–462. [Google Scholar] [CrossRef]
- Clean Clothes Campaign. Looking for a Quick Fix: How Weak Social Auditing is Keeping Workers in Sweatshops, Amsterdam. 2005. Available online: http://www.cleanclothes.org/ftp/05-quick_fix.pdf (accessed on 1 December 2021).
- Anders, S.; Souza Monteiro, D.M.; Rouviere, E. Objectiveness in the market for third-party certification: What can we learn from market structure? In Proceedings of the 105th EAAE Seminar ‘International Marketing and International Trade of Quality Food Products’, Bologna, Italy, 8–10 March 2007.
- Schulze, H.; Albersmeier, F.; Jahn, G.; Spiller, A. Checklist governance: Risk oriented audits to improve the quality of certification standards in the food sector. In Proceedings of the 16th Annual World Food and Agribusiness Forum, Symposium and Case Conference of the IAMA, Buenos Aires, Argentina, 10–13 June 2006. [Google Scholar]
- Wu, D.S.; Zhu, X.Q.; Wan, J. A Multi objective Optimization Approach for Selecting Risk Response Strategies of Software Project: From the Perspective of Risk Correlations. Int. J. Inf. Technol. Decis. Mak. 2019, 18, 339–364. [Google Scholar] [CrossRef]
- Wang, W. Risk control in certification project management. China Certif. Accredit. 2010, 3, 46–47. [Google Scholar]
- Liu, Z.A. Risk analysis and control of organic agricultural product certification. Trop. Agric. Sci. Technol. 2011, 34, 40–42. [Google Scholar]
- Tanner, B. Independent assessment by third-party certification bodies. Food Control 2000, 11, 415–417. [Google Scholar] [CrossRef]
- Pignatti, E.; Spadoni, R. Trust within the Organic Food Supply Chain: The Role of the Certification Bodies. In Proceedings of the 99th EAAE Seminar ‘Trust and Risk in Business Networks’, Bonn, Germany, 8–10 February 2006. [Google Scholar]
- Jahn, G.; Schramm, M.; Spiller, A. The Reliability of Certification: Quality Labels as a Consumer Policy Tool. J. Consum. Policy 2006, 28, 53–73. [Google Scholar] [CrossRef]
- Du, Q.T.; Chang, Y.C.; Ma, X.W. Research on risk assessment of certification of fabricated building parts and components. J. Eng. Manag. 2019, 33, 32–37. [Google Scholar]
- Pang, R. Risk analysis in the process of GMP certification based on the new version. Discov. Value 2014, 4, 112. [Google Scholar]
- Sun, Y.; Chen, D.D. Quality risk analysis and control of on-site inspection for GMP certification. Merch. Qual. 2018, 3, 252. [Google Scholar]
- Zhao, M. Preliminary study on risk management mode of management system certification. Stand. Sci. 2010, 9, 82–86. [Google Scholar]
- Tan, F.M.; Xu, X.X.; Wang, F.F. Risk identification of inspectors in factory on-site inspection. China Qual. Certif. 2017, 9, 50–52. [Google Scholar]
- Yin, X.M. Preliminary study on risk management mode recognized by certification bodies. Stand. Sci. 2013, 10, 84–87. [Google Scholar]
- Liu, C.F.; Xu, X.X.; Wang, F.F. Risk identification of factory in factory on-site inspection. China Qual. Certif. 2017, 9, 53–54. [Google Scholar]
- Liu, H. Quality risk analysis and control of on-site inspection of GMP certification. Heilongjiang Med. J. 2015, 28, 1243–1244. [Google Scholar]
- Jiang, Y.Z.; Zou, Y. Quality risk analysis and control of on-site inspection of GMP certification. J. Guangdong Pharm. Univ. 2010, 26, 302–304. [Google Scholar]
- Cheng, Z.W.; Yao, D.M.; Shi, W. Risk analysis of common administrative regulations of system certification Institutions. China Certif. Accredit. 2014, 6, 23–24. [Google Scholar]
- Wan, L.J.; Zhu, Y.; Liu, J.H. Research on endogenous risk management of agricultural product quality and safety certification—Taking pollution-free agricultural product certification as an example. Food Nutr. China 2016, 22, 9–12. [Google Scholar]
- Zha, S.S.; Guo, Y.; Huang, S.H.; Tang, P.Z. A hybrid MCDM approach based on ANP and TOPSIS for facility layout selection. Trans. Nanjing Univ. Aeronaut. Astronaut. 2018, 35, 1027–1037. [Google Scholar]
- Wudhikarn, R.; Chakpitak, N.; Neubert, G. Use of an Analytic Network Process and Monte Carlo Analysis in New Product Formula Selection Decisions. Asia-Pac. J. Oper. Res. 2015, 32, 1550007. [Google Scholar] [CrossRef]
- Wang, Z.Y.; Yan, L.L.; Deng, Y.Y.; Yang, H.M. Evaluation and optimization of design schemes based on entropy weight and VIKOR method. J. Mach. Des. 2022, 39, 154–160. [Google Scholar]
- Li, S.G.; Ma, Y.H.; Zhu, E.J. Analysis of institutional barriers of integration innovation based on AHP-DEMATEL. J. Harbin Eng. Univ. 2022. Early Access. [Google Scholar]
- Dezert, J.; Tchamova, A.; Han, D.Q.; Tacnet, J.M. The SPOTIS rank reversal free method for multi-criteria decision-making support. In Proceedings of the 23rd International Conference on Information Fusion, Rustenburg, South Africa, 6–9 July 2020; pp. 195–202. [Google Scholar]
- Bączkiewicz, A.; Kizielewicz, B.; Shekhovtsov, A.; Yelmikheiev, M.; Kozlov, V.; Sałabun, W. Comparative Analysis of Solar Panels with Determination of Local Significance Levels of Criteria Using the MCDM Methods Resistant to the Rank Reversal Phenomenon. Energies 2021, 14, 5727. [Google Scholar] [CrossRef]
- Stoilova, S. Application of SIMUS Method for Assessment Alternative Transport Policies for Container Carriage. In Proceedings of the 18th International Scientific Conference Engineering for Rural Development, Jelgava, Latvia, 22–24 May 2019. [Google Scholar]
- Stoilova, S.; Munier, N. Analysis of Policies of Railway Operators Using SWOT Criteria and the SIMUS Method: A Case for the Bulgarian Railway Network. Sustainability 2021, 13, 6948. [Google Scholar] [CrossRef]
- Kizielewicz, B.; Więckowski, J.; Shekhovtsov, A.; Wątróbski, J.; Depczyński, R.; Sałabun, W. Study towards the time-based mcda ranking analysis—A supplier selection case study. Facta Univ. Ser. Mech. Eng. 2021, 19, 381–399. [Google Scholar] [CrossRef]
- Wu, R.B.; He, Y.X.; Jia, Y.F. Key personnel risk assessment method based on improved AHP. China Saf. Sci. J. 2021, 31, 112–118. [Google Scholar]
- Zeng, X.K.; Feng, Y.; Lai, W.Q. Risk assessment of urban gas pipeline based on AHP and entropy weight method. J. Saf. Sci. Technol. 2021, 17, 130–135. [Google Scholar]
- Su, Y.S.; Zhang, C.L.; He, Y.H. Regional coal mine safety risk grade evaluation based on AHP and Fuzzy Mathematics. Coal Technol. 2019, 38, 124–127. [Google Scholar]
- Erol, H.; Dikmen, I.; Atasoy, G. An analytic network process model for risk quantification of mega construction projects. Expert Syst. Appl. 2022, 191, 1–17. [Google Scholar] [CrossRef]
- Su, Y.S.; Zhang, C.L.; Liao, M.J. Safety risk assessment of county mining area based on ANP and probabilistic neural network. Saf. Coal Mines 2020, 51, 251–256. [Google Scholar]
- Ge, J.J.; Peng, B.H.; Wei, G.; Wan, A.X. Risk assessment on drug production safety based on Grey-Analytic Network Process. Kybernetes 2021, 12. Early Access. [Google Scholar] [CrossRef]
- Wang, Y.; Sheng, Y.; Xue, X.Q. Blockchain technology and internet financial risk prevention and control route. Stud. Sci. Sci. 2022, 40, 257–268. [Google Scholar]
- Zhang, W.D.; Chen, Y.Z.; Li, Q.; Wu, D. Analysis of degree of influence and risk possibility of fire risk factors in large-scale public buildings in cities. J. Saf. Environ. 2021, 21, 1434–1439. [Google Scholar]
- Lin, W.C. Maritime Environment Assessment and Management Using through Balanced Scorecard by Using DEMATEL and ANP Technique. Int. J. Environ. Res. Public Health 2022, 19, 2873. [Google Scholar] [CrossRef] [PubMed]
- Wudhikarn, R.; Chakpitak, N.; Neubert, G. An analytic network process approach for the election of green marketable products. Benchmarking Int. J. 2015, 22, 994–1018. [Google Scholar] [CrossRef]
- Schmidt, R.C. Managing Delphi surveys using nonparametric statistical techniques. Decis. Sci. 1997, 8, 763–774. [Google Scholar] [CrossRef]
- Jiang, P.; Hu, Y.C.; Yen, G.F.; Tsao, S.J. Green supplier selection for sustainable development of the automotive industry using grey decision-making. Sustain. Dev. 2018, 26, 890–903. [Google Scholar] [CrossRef]
- Deng, Z.Y. Multi Criteria Decision Analysis Method and Application; Dingmao Book Publishing Co. Ltd.: Taipei, China, 2012. [Google Scholar]


| Risk Category | Risk Factor | Risk Description | References |
|---|---|---|---|
| Certification institution | Working life | Years in business | [26,33] |
| Certification experience | Number of certification services in the same field in the last three years | [26,29,30] | |
| Strength | Business scale of certification institution | [26,38] | |
| Impartiality | ① Is there an organizational structure to ensure fairness? ② Is there any interest relationship with the applicant? | [20,21,25,29,30] | |
| Management standardization | ① Formulation and improvement of certification system and rules. ② Are the selection, training, and evaluation of certification personnel scientific and reasonable? | [24,26,33,37] | |
| Entrusting enterprise | Social credit | The entrusting enterprise has user complaints, negative news, etc. | [27,31] |
| Nature of enterprise | The nature and type of ownership of the entrusting enterprise | [27,31] | |
| Scale of enterprise | Enterprise turnover, profit, and other indicators | [27,34,35,36] | |
| Satisfaction of enterprise | The soundness of the enterprise management system, progress of process technology, satisfaction of energy conservation, and environmental protection | [27,31,34,35,36,38] | |
| Certification business | Number of green indexes | Types and quantity of green index of products to be certified | [21,31] |
| Difficulty of detection of green indexes | Objectivity and difficulty in identifying the green index of the products to be certified | [21,31] | |
| Multi-site attribute of business | Multi-site attribute of the production to be certified | [21,31] | |
| Certification implementation | Staffing | Human resources for document inspection, sampling inspection, on-site inspection, and other links of certification implementation | [21,31] |
| Professional quality of personnel | The professional ability and quality of the personnel assigned to each link, such as document inspection, sampling inspection, and on-site inspection in the implementation of certification | [21,24,26,32,38] | |
| Inspection coverage of green indexes | Coverage of products, projects, and green indicators to be reviewed | [24,31] | |
| Degree of sampling standardization | The number of samples and method of sampling meet the relevant national specifications | [24,31,38] | |
| Level of subcontractor testing organization | Level of organization of testing by subcontractor or laboratory | [31,37] | |
| Communication frequency with enterprises | Maintaining frequent communication with certified enterprises | [23,31,38] |
| Expert | Duties | Gender | Age | Specializes in | Working Area | Seniority (yr) | Experience |
|---|---|---|---|---|---|---|---|
| I | Senior Engineer | Male | 45 | Certification | Beijing | 16 | Since June 2005, he has served at J Certification Authority, and he is currently a senior engineer. |
| II | Senior Engineer | Male | 40 | Certification | Beijing | 13 | Since June 2008, he has served at J Certification Authority, and he is currently a senior engineer. |
| III | Professor | Male | 45 | Green development | Beijing | 18 | Since September 2003, he has served at Beijing Information Science and Technology University, and he is currently a professor. |
| IV | Professor | Male | 36 | Quality control | Beijing | 10 | Since September 2008, he has served at Beijing Information Science and Technology University, and he is currently a professor. |
| V | Associate Professor | Male | 34 | Circular economy | Shanghai | 9 | Since September 2012, he has served at Fudan University, and he is currently an associate professor. |
| Risk Category | Risk Factor | Necessity Scoring | Mean Value | Standard Deviation | CDI | ||||
|---|---|---|---|---|---|---|---|---|---|
| Ⅰ | Ⅱ | Ⅲ | Ⅳ | Ⅴ | |||||
| Certification institution | Working life | 6 | 6 | 8 | 6 | 8 | 6.8 | 1.095 | 0.161 |
| Certification experience | 8 | 8 | 7 | 8 | 10 | 8.2 | 1.095 | 0.134 | |
| Strength | 3 | 6 | 6 | 5 | 8 | 5.6 | 1.817 | 0.324 | |
| Impartiality | 10 | 10 | 8 | 7 | 10 | 9.0 | 1.414 | 0.157 | |
| Management standardization | 8 | 9 | 8 | 7 | 9 | 8.2 | 0.837 | 0.102 | |
| Entrusting enterprise | Social credit | 3 | 3 | 7 | 5 | 6 | 4.8 | 1.789 | 0.373 |
| Nature of enterprise | 2 | 6 | 6 | 6 | 6 | 5.2 | 1.789 | 0.344 | |
| Scale of enterprise | 8 | 8 | 8 | 7 | 9 | 8.0 | 0.707 | 0.088 | |
| Satisfaction of enterprise | 7 | 8 | 7 | 6 | 9 | 7.4 | 1.140 | 0.154 | |
| Certification business | Number of green indexes | 7 | 6 | 8 | 8 | 10 | 7.8 | 1.483 | 0.190 |
| Difficulty of detection of green indexes | 6 | 7 | 8 | 9 | 10 | 8.0 | 1.581 | 0.198 | |
| Multi-site attribute of business | 8 | 7 | 7 | 8 | 10 | 8.0 | 1.225 | 0.153 | |
| Certification Implementation | Staffing | 10 | 8 | 9 | 6 | 9 | 8.4 | 1.517 | 0.181 |
| Professional quality of personnel | 7 | 6 | 8 | 5 | 9 | 7.0 | 1.581 | 0.226 | |
| Inspection coverage of green indexes | 7 | 9 | 7 | 7 | 10 | 8.0 | 1.414 | 0.177 | |
| Degree of sampling standardization | 9 | 9 | 10 | 6 | 10 | 8.8 | 1.643 | 0.187 | |
| Level of subcontractor testing organization | 3 | 6 | 7 | 5 | 9 | 6.0 | 2.236 | 0.373 | |
| Communication frequency with enterprises | 5 | 9 | 8 | 6 | 10 | 7.6 | 2.074 | 0.273 | |
| Risk Category | Risk Factor | Necessity Scoring | Mean Value | Standard Deviation | CDI | Variable Number | ||||
|---|---|---|---|---|---|---|---|---|---|---|
| I | II | III | IV | V | ||||||
| Certification institution | Working life | 6 | 6 | 8 | 6 | 8 | 6.8 | 1.095 | 0.161 | A1 |
| Certification experience | 8 | 8 | 7 | 8 | 10 | 8.2 | 1.095 | 0.134 | A2 | |
| Strength | 5 | 6 | 6 | 5 | 6 | 5.6 | 0.548 | 0.098 | discarded | |
| Impartiality | 10 | 10 | 8 | 7 | 10 | 9.0 | 1.414 | 0.157 | A3 | |
| Management standardization | 8 | 9 | 8 | 7 | 9 | 8.2 | 0.837 | 0.102 | A4 | |
| Entrusting enterprise | Social credit | 4 | 4 | 5 | 4 | 5 | 4.4 | 0.548 | 0.125 | discarded |
| Nature of enterprise | 4 | 5 | 6 | 5 | 5 | 5.0 | 0.707 | 0.141 | discarded | |
| Scale of enterprise | 8 | 8 | 8 | 7 | 9 | 8.0 | 0.707 | 0.088 | B1 | |
| Satisfaction of enterprise | 7 | 8 | 7 | 6 | 9 | 7.4 | 1.140 | 0.154 | B2 | |
| Certification business | Number of green indexes | 7 | 6 | 8 | 8 | 10 | 7.8 | 1.483 | 0.190 | C1 |
| Difficulty of detection of green indexes | 6 | 7 | 8 | 9 | 10 | 8.0 | 1.581 | 0.198 | C2 | |
| Multi-site attribute of business | 8 | 7 | 7 | 8 | 10 | 8.0 | 1.225 | 0.153 | C3 | |
| Certification Implementation | Staffing | 10 | 8 | 9 | 6 | 9 | 8.4 | 1.517 | 0.181 | D1 |
| Professional quality of personnel | 5 | 5 | 7 | 5 | 7 | 5.8 | 1.095 | 0.189 | discarded | |
| Inspection coverage of green indexes | 7 | 9 | 7 | 7 | 10 | 8.0 | 1.414 | 0.177 | D2 | |
| Degree of sampling standardization | 9 | 9 | 10 | 6 | 10 | 8.8 | 1.643 | 0.187 | D3 | |
| Level of subcontractor testing organization | 4 | 5 | 6 | 5 | 6 | 5.2 | 0.837 | 0.161 | discarded | |
| Communication frequency with enterprises | 5 | 7 | 6 | 5 | 6 | 5.8 | 0.837 | 0.144 | discarded | |
| Factor | A1 | A2 | A3 | A4 | B1 | B2 | C1 | C2 | C3 | D1 | D2 | D3 |
|---|---|---|---|---|---|---|---|---|---|---|---|---|
| A1 | 0.000 | 1.750 | 1.750 | 1.875 | 0.375 | 0.375 | 0.625 | 1.250 | 0.625 | 1.500 | 1.500 | 2.000 |
| A2 | 0.375 | 0.000 | 1.500 | 1.750 | 0.625 | 0.625 | 1.000 | 1.625 | 0.750 | 1.375 | 1.875 | 2.000 |
| A3 | 0.625 | 0.500 | 0.000 | 1.500 | 0.625 | 0.500 | 0.500 | 0.500 | 0.625 | 1.375 | 1.625 | 1.875 |
| A4 | 0.500 | 0.875 | 1.625 | 0.000 | 0.625 | 0.375 | 0.750 | 1.125 | 0.875 | 1.750 | 1.625 | 2.000 |
| B1 | 0.250 | 0.500 | 0.625 | 0.750 | 0.000 | 1.875 | 1.125 | 1.000 | 1.375 | 1.375 | 1.250 | 1.000 |
| B2 | 0.000 | 0.250 | 0.750 | 0.875 | 1.500 | 0.000 | 1.375 | 1.250 | 1.250 | 1.375 | 1.250 | 0.750 |
| C1 | 0.375 | 0.625 | 1.125 | 0.750 | 0.625 | 1.125 | 0.000 | 1.125 | 1.125 | 1.875 | 1.500 | 1.000 |
| C2 | 0.500 | 0.750 | 1.000 | 0.625 | 0.125 | 0.875 | 0.500 | 0.000 | 0.500 | 1.625 | 1.375 | 1.250 |
| C3 | 0.125 | 0.625 | 0.625 | 0.500 | 0.875 | 1.250 | 0.875 | 1.500 | 0.000 | 1.750 | 1.625 | 1.375 |
| D1 | 0.375 | 0.625 | 1.000 | 0.750 | 0.500 | 0.125 | 0.500 | 0.875 | 0.750 | 0.000 | 1.500 | 1.500 |
| D2 | 0.250 | 0.875 | 1.250 | 1.125 | 0.375 | 0.750 | 0.875 | 1.000 | 0.750 | 1.625 | 0.000 | 1.250 |
| D3 | 0.375 | 0.625 | 1.625 | 1.750 | 0.000 | 0.750 | 0.625 | 1.125 | 0.750 | 1.375 | 1.750 | 0.000 |
| Factor | A1 | A2 | A3 | A4 | B1 | B2 | C1 | C2 | C3 | D1 | D2 | D3 |
|---|---|---|---|---|---|---|---|---|---|---|---|---|
| A1 | 0.000 | 0.128 | 0.128 | 0.138 | 0.028 | 0.028 | 0.046 | 0.092 | 0.046 | 0.110 | 0.110 | 0.147 |
| A2 | 0.028 | 0.000 | 0.110 | 0.128 | 0.046 | 0.046 | 0.073 | 0.119 | 0.055 | 0.101 | 0.138 | 0.147 |
| A3 | 0.046 | 0.037 | 0.000 | 0.110 | 0.046 | 0.037 | 0.037 | 0.037 | 0.046 | 0.101 | 0.119 | 0.138 |
| A4 | 0.037 | 0.064 | 0.119 | 0.000 | 0.046 | 0.028 | 0.055 | 0.083 | 0.064 | 0.128 | 0.119 | 0.147 |
| B1 | 0.018 | 0.037 | 0.046 | 0.055 | 0.000 | 0.138 | 0.083 | 0.073 | 0.101 | 0.101 | 0.092 | 0.073 |
| B2 | 0.000 | 0.018 | 0.055 | 0.064 | 0.110 | 0.000 | 0.101 | 0.092 | 0.092 | 0.101 | 0.092 | 0.055 |
| C1 | 0.028 | 0.046 | 0.083 | 0.055 | 0.046 | 0.083 | 0.000 | 0.083 | 0.083 | 0.138 | 0.110 | 0.073 |
| C2 | 0.037 | 0.055 | 0.073 | 0.046 | 0.009 | 0.064 | 0.037 | 0.000 | 0.037 | 0.119 | 0.101 | 0.092 |
| C3 | 0.009 | 0.046 | 0.046 | 0.037 | 0.064 | 0.092 | 0.064 | 0.110 | 0.000 | 0.128 | 0.119 | 0.101 |
| D1 | 0.028 | 0.046 | 0.073 | 0.055 | 0.037 | 0.009 | 0.037 | 0.064 | 0.055 | 0.000 | 0.110 | 0.110 |
| D2 | 0.018 | 0.064 | 0.092 | 0.083 | 0.028 | 0.055 | 0.064 | 0.073 | 0.055 | 0.119 | 0.000 | 0.092 |
| D3 | 0.028 | 0.046 | 0.119 | 0.128 | 0.000 | 0.055 | 0.046 | 0.083 | 0.055 | 0.101 | 0.128 | 0.000 |
| Factor | A1 | A2 | A3 | A4 | B1 | B2 | C1 | C2 | C3 | D1 | D2 | D3 |
|---|---|---|---|---|---|---|---|---|---|---|---|---|
| A1 | 0.122 | 0.345 | 0.495 | 0.480 | 0.192 | 0.252 | 0.282 | 0.423 | 0.3008 | 0.571 | 0.576 | 0.587 |
| A2 | 0.144 | 0.217 | 0.463 | 0.454 | 0.205 | 0.266 | 0.301 | 0.435 | 0.3034 | 0.550 | 0.583 | 0.567 |
| A3 | 0.134 | 0.206 | 0.284 | 0.365 | 0.169 | 0.207 | 0.217 | 0.291 | 0.2402 | 0.448 | 0.465 | 0.463 |
| A4 | 0.140 | 0.256 | 0.434 | 0.306 | 0.188 | 0.227 | 0.260 | 0.370 | 0.2855 | 0.526 | 0.521 | 0.523 |
| B1 | 0.110 | 0.211 | 0.334 | 0.322 | 0.143 | 0.317 | 0.275 | 0.342 | 0.3065 | 0.471 | 0.460 | 0.418 |
| B2 | 0.090 | 0.186 | 0.326 | 0.314 | 0.234 | 0.185 | 0.280 | 0.342 | 0.2877 | 0.453 | 0.441 | 0.385 |
| C1 | 0.121 | 0.222 | 0.371 | 0.327 | 0.183 | 0.263 | 0.195 | 0.349 | 0.2874 | 0.503 | 0.479 | 0.426 |
| C2 | 0.114 | 0.201 | 0.317 | 0.277 | 0.123 | 0.210 | 0.196 | 0.225 | 0.2081 | 0.421 | 0.407 | 0.383 |
| C3 | 0.102 | 0.218 | 0.333 | 0.305 | 0.196 | 0.271 | 0.253 | 0.368 | 0.2078 | 0.488 | 0.479 | 0.439 |
| D1 | 0.102 | 0.186 | 0.304 | 0.273 | 0.138 | 0.157 | 0.186 | 0.273 | 0.2145 | 0.297 | 0.398 | 0.383 |
| D2 | 0.107 | 0.224 | 0.358 | 0.332 | 0.152 | 0.220 | 0.237 | 0.317 | 0.2439 | 0.455 | 0.350 | 0.415 |
| D3 | 0.121 | 0.219 | 0.400 | 0.387 | 0.135 | 0.227 | 0.230 | 0.338 | 0.2532 | 0.461 | 0.485 | 0.353 |
| Factor | d | r | d + r | d − r | Type |
|---|---|---|---|---|---|
| A1 | 4.626 | 1.406 | 6.032 | 3.220 | Driving factors |
| A2 | 4.488 | 2.691 | 7.178 | 1.797 | Driving factors |
| A3 | 3.488 | 4.417 | 7.904 | −0.929 | Outcome factors |
| A4 | 4.036 | 4.142 | 8.178 | −0.106 | Outcome factors |
| B1 | 3.708 | 2.057 | 5.764 | 1.651 | Driving factors |
| B2 | 3.521 | 2.801 | 6.322 | 0.721 | Driving factors |
| C1 | 3.728 | 2.912 | 6.640 | 0.815 | Driving factors |
| C2 | 3.082 | 4.074 | 7.155 | −0.992 | Outcome factors |
| C3 | 3.658 | 3.139 | 6.797 | 0.519 | Driving factors |
| D1 | 2.912 | 5.644 | 8.556 | −2.731 | Outcome factors |
| D2 | 3.411 | 5.643 | 9.054 | −2.233 | Outcome factors |
| D3 | 3.609 | 5.340 | 8.949 | −1.731 | Outcome factors |
| Factor | A1 | A2 | A3 | A4 | B1 | B2 | C1 | C2 | C3 | D1 | D2 | D3 |
|---|---|---|---|---|---|---|---|---|---|---|---|---|
| A1 | 0.103 | 0.103 | 0.103 | 0.103 | 0.103 | 0.103 | 0.103 | 0.103 | 0.103 | 0.103 | 0.103 | 0.103 |
| A2 | 0.100 | 0.100 | 0.100 | 0.100 | 0.100 | 0.100 | 0.100 | 0.100 | 0.100 | 0.100 | 0.100 | 0.100 |
| A3 | 0.080 | 0.080 | 0.080 | 0.080 | 0.080 | 0.080 | 0.080 | 0.080 | 0.080 | 0.080 | 0.080 | 0.080 |
| A4 | 0.091 | 0.091 | 0.091 | 0.091 | 0.091 | 0.091 | 0.091 | 0.091 | 0.091 | 0.091 | 0.091 | 0.091 |
| B1 | 0.084 | 0.084 | 0.084 | 0.084 | 0.084 | 0.084 | 0.084 | 0.084 | 0.084 | 0.084 | 0.084 | 0.084 |
| B2 | 0.080 | 0.080 | 0.080 | 0.080 | 0.080 | 0.080 | 0.080 | 0.080 | 0.080 | 0.080 | 0.080 | 0.080 |
| C1 | 0.084 | 0.084 | 0.084 | 0.084 | 0.084 | 0.084 | 0.084 | 0.084 | 0.084 | 0.084 | 0.084 | 0.084 |
| C2 | 0.070 | 0.070 | 0.070 | 0.070 | 0.070 | 0.070 | 0.070 | 0.070 | 0.070 | 0.070 | 0.070 | 0.070 |
| C3 | 0.082 | 0.082 | 0.082 | 0.082 | 0.082 | 0.082 | 0.082 | 0.082 | 0.082 | 0.082 | 0.082 | 0.082 |
| D1 | 0.067 | 0.067 | 0.067 | 0.067 | 0.067 | 0.067 | 0.067 | 0.067 | 0.067 | 0.067 | 0.067 | 0.067 |
| D2 | 0.078 | 0.078 | 0.078 | 0.078 | 0.078 | 0.078 | 0.078 | 0.078 | 0.078 | 0.078 | 0.078 | 0.078 |
| D3 | 0.081 | 0.081 | 0.081 | 0.081 | 0.081 | 0.081 | 0.081 | 0.081 | 0.081 | 0.081 | 0.081 | 0.081 |
| Risk Factors | Prominence | Weight | Weighted Prominence | Sorting |
|---|---|---|---|---|
| Working life of certification institution A1 | 6.032 | 0.103 | 0.623 | 6 |
| Experience of certification institution A2 | 7.178 | 0.100 | 0.719 | 3 |
| Impartiality of certification institution A3 | 7.904 | 0.080 | 0.63 | 5 |
| Management standardization of certification institution A4 | 8.178 | 0.091 | 0.746 | 1 |
| Scale of entrusting enterprise B1 | 5.764 | 0.084 | 0.484 | 12 |
| Satisfaction of entrusting enterprises B2 | 6.322 | 0.08 | 0.505 | 10 |
| Number of green indexes of certification business C1 | 6.64 | 0.084 | 0.559 | 8 |
| Difficulty of detection of green indexes of certification business C2 | 7.155 | 0.070 | 0.501 | 11 |
| Multi-site attribute of business C3 | 6.797 | 0.082 | 0.558 | 9 |
| Staffing in certification implementation D1 | 8.556 | 0.067 | 0.569 | 7 |
| Inspection coverage of green indexes in certification implementation D2 | 9.054 | 0.078 | 0.703 | 4 |
| Degree of sampling standardization in certification implementation D3 | 8.949 | 0.081 | 0.728 | 2 |
Publisher’s Note: MDPI stays neutral with regard to jurisdictional claims in published maps and institutional affiliations. |
© 2022 by the authors. Licensee MDPI, Basel, Switzerland. This article is an open access article distributed under the terms and conditions of the Creative Commons Attribution (CC BY) license (https://creativecommons.org/licenses/by/4.0/).
Share and Cite
Zhang, C.; Zhang, J.; Yang, Q. Identifying Critical Risk Factors in Green Product Certification Using Hybrid Multiple-Criteria Decision-Making. Sustainability 2022, 14, 4513. https://doi.org/10.3390/su14084513
Zhang C, Zhang J, Yang Q. Identifying Critical Risk Factors in Green Product Certification Using Hybrid Multiple-Criteria Decision-Making. Sustainability. 2022; 14(8):4513. https://doi.org/10.3390/su14084513
Chicago/Turabian StyleZhang, Changlu, Jian Zhang, and Qiong Yang. 2022. "Identifying Critical Risk Factors in Green Product Certification Using Hybrid Multiple-Criteria Decision-Making" Sustainability 14, no. 8: 4513. https://doi.org/10.3390/su14084513