Article

Reinforced Concrete Wind Turbine Towers: Damage Mode and Model Testing

1
School of Water Conservancy, North China University of Water Resources and Electric Power, Zhengzhou 450045, China
2
Collaborative Innovation Center of Water Resources Efficient Utilization and Protection Engineering, Zhengzhou 450045, China
3
Henan Hydraulic Structure Safety Engineering Technology Research Center, Zhengzhou 450045, China
4
Puyang Yellow River Bureau, Puyang 457000, China
5
Power China Zhongnan Engineering Corporation Limited, Changsha 410014, China
*
Author to whom correspondence should be addressed.
Sustainability 2022, 14(8), 4410; https://doi.org/10.3390/su14084410
Submission received: 14 February 2022 / Revised: 5 April 2022 / Accepted: 6 April 2022 / Published: 7 April 2022

Abstract

:
This study investigates the complex load-bearing mechanism of the reinforced concrete tower of large wind turbines through a structural model test. MTS electro-hydraulic servo loading system was used to load two reinforced concrete tower models for the push-out test. The ultimate bearing capacity of the reinforced concrete tower was found to be 8.894 kN. The test findings revealed that the top of the tower is subjected to unilateral shear as the horizontal load increases. As a result, the concrete strain in the compression zone of the test piece increases to its highest level in the bottom plastic hinge area. The concrete in the compression zone is being crushed in the meantime. The reinforcement achieves its yield point and deforms within the range of plastic failure when subjected to extreme loads. The outcomes of this study serve as a foundation for the running of wind turbines in extreme conditions.

1. Introduction

Wind power generation has become widely used as a green, environmentally friendly, renewable energy source as people pay more attention to the emission peak and carbon neutrality [1]. The tower supports the entire wind turbine; hence its structural safety is critical to its smooth operation. Currently, the majority of wind turbine towers are made of steel. However, when the unit capacity and weight increase, the steel tower becomes higher and larger [2,3,4], revealing numerous flaws in rigidity and anti-vibration performance. The reinforced concrete tower structure appeared at this time and has since become the preferred solution for large-capacity, high-tower wind turbines [5,6].
Wind turbine tower structures have been the subject of extensive research in recent years. For example, Seidel [7] compared the GEWE3.X series of all-steel towers against concrete towers and discovered that concrete towers are can solve the transportation problem of traditional steel towers because they can be made everywhere near the wind farm. Quilligigan et al. [8] analyzed the fatigue of concrete towers and steel towers based on wind speed and height. They found that concrete towers of wind turbines larger than 3 MW are less likely to undergo fatigue failure and are more cost-effective than steel towers. Brughuis [9] evaluated the performance of a 100-m-high reinforced concrete tower with that of a 120-m-high steel tower, concluding that the reinforced concrete structure is more feasible and rational. The fatigue resistance and stability of a 100-m-high prestressed concrete tower were investigated by Singh [10]. He found that the prestressed concrete tower has good performance, low maintenance and construction costs, and high flexibility. Way et al. [11] studied the material cost of high wind towers in the context of South Africa. They found that the material cost of concrete towers and hybrid towers was lower than steel towers, especially when the hub height exceeded 100 m. The above studies have shown that reinforced concrete towers have higher rigidity, corrosion resistance, stability, and vibration resistance and lower cost than steel towers.
There are also an increasing number of studies focusing on the complex stress mechanism and mechanical properties of reinforced concrete towers. For example, Lyu et al. [12] experimentally investigated the perforated plate connectors of the wind turbine foundation and discovered that perforated steel bars positively impact component shear resistance. Chen et al. [13] experimentally investigated the joint bearing capacity of internal and external steel members of concrete-filled steel tube components with internal stiffeners. They concluded that the strain and deformation of internal and external steel-concrete tower components are consistent. Li et al. [14] conducted a pseudo-static test on the seismic performance of frustum-shaped and lattice-shaped wind turbine towers. They obtained their mechanical properties, failure mechanisms, and failure characteristics. Jin et al. [15] conducted a nonlinear stress test on a reinforced concrete wind turbine tower. They determined its failure mode, ultimate bearing capacity, and structural ductility under static loads, providing the foundation for subsequent research into reinforced concrete towers. Zhang [16] conducted a model test of a prestressed concrete wind turbine tower, comparing its static and dynamic behaviors to conventional steel towers. Their results showed that the concrete tower outperformed the steel tower in seismic and anti-overturning capabilities. Zhang et al. [17] performed a pull-out test and simulation analysis of the wind turbine foundation model. They discovered the nonlinear contact mechanics of the steel-concrete structure, which can be used to design wind turbine foundations. Wang et al. [18] investigated the mechanical properties of concrete columns under various loading rates. Their findings revealed that when the loading rate increases, the bearing capacity and stiffness of the members increase, while their ductility and deformability decrease. Patil et al. [19] evaluated the performance of a wind turbine tower subjected to ground motions. They found that the wind turbine tower investigated is most vulnerable to overturning in the event of an earthquake.
Furthermore, numerous advancements in numerical simulation have been achieved. For example, Liu et al. [20] investigated the stress mechanism of a reinforced concrete plane frame structure in a fire. They concluded that the frame has a local and a general failure mode depending on the size of the columns. Tang et al. [21] investigated the reinforced concrete tower from the design and economic viewpoints and came to a conclusion that the double row self-aligning roller bearing can be simulated by the spring element. Vries [22] optimized the cross-section of the concrete tower and designed a steel-concrete tower with a height of 133 m and a power of 2.3 MW based on the square section. Walia et al. [23] optimized the design of offshore wind turbine towers by considering welding and cost into account. Vernardos et al. [24] experimentally analyzed a scale-reducing tower model and explored its mechanical properties from the strength, stiffness, and failure mechanism using the fine finite element method. Ma et al. [25] analyzed the response of 100 m high prestressed concrete tower under seismic load through time history analysis and found that seismic load should be considered more in detail when designing wind turbines that are supported by concrete towers. Through numerical simulation and theoretical calculation, Lan et al. [26] analyzed the design process of a tower under the ultimate limit state, serviceability limit state, and fatigue limit state.
Hu et al. [27] investigated the aerodynamic performance of tower-based and tower-free floating offshore wind turbines during surging, pitching, and yawing motions using the computational fluid dynamics (CFD) approach. Tang et al. [28] use a new method combining acoustic emission and normalized cumulative parameters to characterize the tower damage. They discovered that the normalized cumulative duration is suitable for describing the occurrence of yield damage, and the energy can be used to determine the damage stage. de Lana et al. [29] investigated the mechanical behaviors of prestressed concrete towers on circular sections and used genetic algorithms to optimize the tower structure.
In summary, most researches focus on the mechanical properties of wind turbine foundations, towers, and concrete columns. Furthermore, the mechanical behaviors of reinforced concrete towers during their service life have not been fully defined. Therefore, this study aimed to briefly explore: (i) the complex load-bearing mechanism of the reinforced concrete tower of large wind turbines, (ii) investigates the mechanical properties of the reinforced concrete tower under wind loads and its failure mechanism through a structural model test, (iii) and identifies the dangerous and weak parts of the tower, providing a theoretical reference for the safe running of wind turbines.

2. Experimental Scheme

2.1. Model Design

In this study, two sets of reinforced concrete towers were constructed at a scale of 1:15 to represent the basic design size of a 2 MW wind turbine developed in China. The wind turbine prototype has a tower height of 60 m, a bottom diameter of 4.5 m, a top diameter of 2.4 m, and a wall thickness of 0.45 m. Two sets of reinforced concrete tower components with the same material properties and parameters were made to eliminate the experiment’s discreteness: top cross-sectional radius 237 mm, bottom radius 300 mm, and wall thickness 30 mm. The components’ longitudinal and hooped reinforcements were symmetrical. Figure 1 depicts the cross-sectional shape and size of the test pieces.
The bottom of the wind turbine towers should have a strong load-bearing capacity as they usually adopt a slender cantilever structure. The tower bottom is the most critical area because the load mainly acts on the tower top and less on the tower body. The lower half of the scaled tower, which reduced the test pieces’ height to 1.8 m, was selected due to the limitation of the jack’s height. The wind turbine prototype’s concrete grade is C30, and longitudinal reinforcement is HRB335 steel. The similarity ratio of elastic modulus determined in this test is 1. Therefore, the test pieces’ concrete strength grade was C30, the protective layer was 15 mm thick, the longitudinal reinforcement was HRB335 steel, and the hooped reinforcement was No.10 galvanized iron wires spaced 20 cm apart. For more information, see Table 1.

2.2. Measuring Scheme

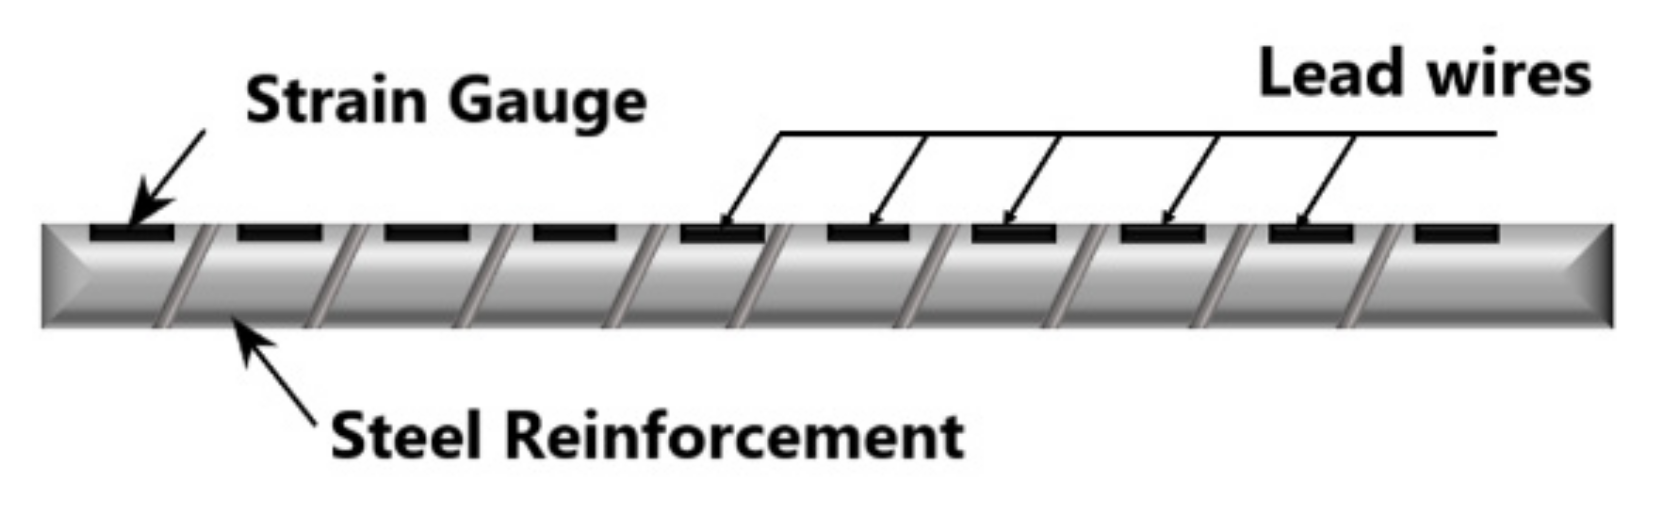
2.2.1. Strain Measurement of Longitudinal Reinforcement

To accurately measure the stress and strain changes of the reinforcement during the loading process, each longitudinal reinforcement in the study was pasted with a resistance strain gauge to obtain its stress state in the concrete body, as shown in Figure 2.

2.2.2. Tower Strain and Displacement Measurement

The tower was tensioned, and the tension surface was whitened with white paint before the experiment to make it easier to see the crack breadth. Given the stress characteristics of the concrete tower, strain gauges were installed on the surface of the tower to measure the concrete strain, as shown in Figure 3a. During the experiment, the cracks were visually observed with the help of a magnifying glass. The crack width under different loads was measured by a crack monitoring instrument, and the final crack width was recorded when the tower reached yield failure.
In this experiment, measuring points were arranged in the exposed concrete layer to measure the stress deformation of the concrete tower in the tension zone. Pull-wire displacement gauges with a measurement range of 1000 mm were set along the tension axis of the tower body at the heights of 0.55 m, 1.45 m, and 1.75 m, respectively, to measure the horizontal displacement of the tower at different heights, as shown in Figure 3b. The data of reinforcement strain, concrete strain, and tower displacement is collected by the DH3816N multi-channel static stress–strain test and analysis system.

2.3. Loading Scheme

The tower test models were loaded using an MTS electro-hydraulic servo loading system. The MTS testing system was used to load the model structure and measure the horizontal displacement and dynamic characteristics of the structure under dynamic loads. The system consists of a reaction wall, an electro-hydraulic servo loading system, a data acquisition system, and a test model. The MTS electro-hydraulic servo loading system and the computer were used to control the entire experiment in real-time. Before the experiment, all displacement gauges were calibrated, and a resistance strain gauge was placed at the corresponding measuring point of the longitudinal reinforcement. The multi-channel coordinated loading system uses the MTS electro-hydraulic servo loading system to control the acquisition of monotonic load data on the top of the tower. The components were continually loaded with a one-way dynamic force at a rate that increased in six steps from 1.00 mm/min to 4.00 mm/min until the test piece failed and was damaged. The target displacement was 100 mm. The tower roof members were embedded in advance to adequately simulate the directional load, as shown in Figure 4a. As indicated in Figure 4b, the load was applied through the direction conversion device. The loading and testing systems are schematically depicted in Figure 4c.

3. Results and Analysis

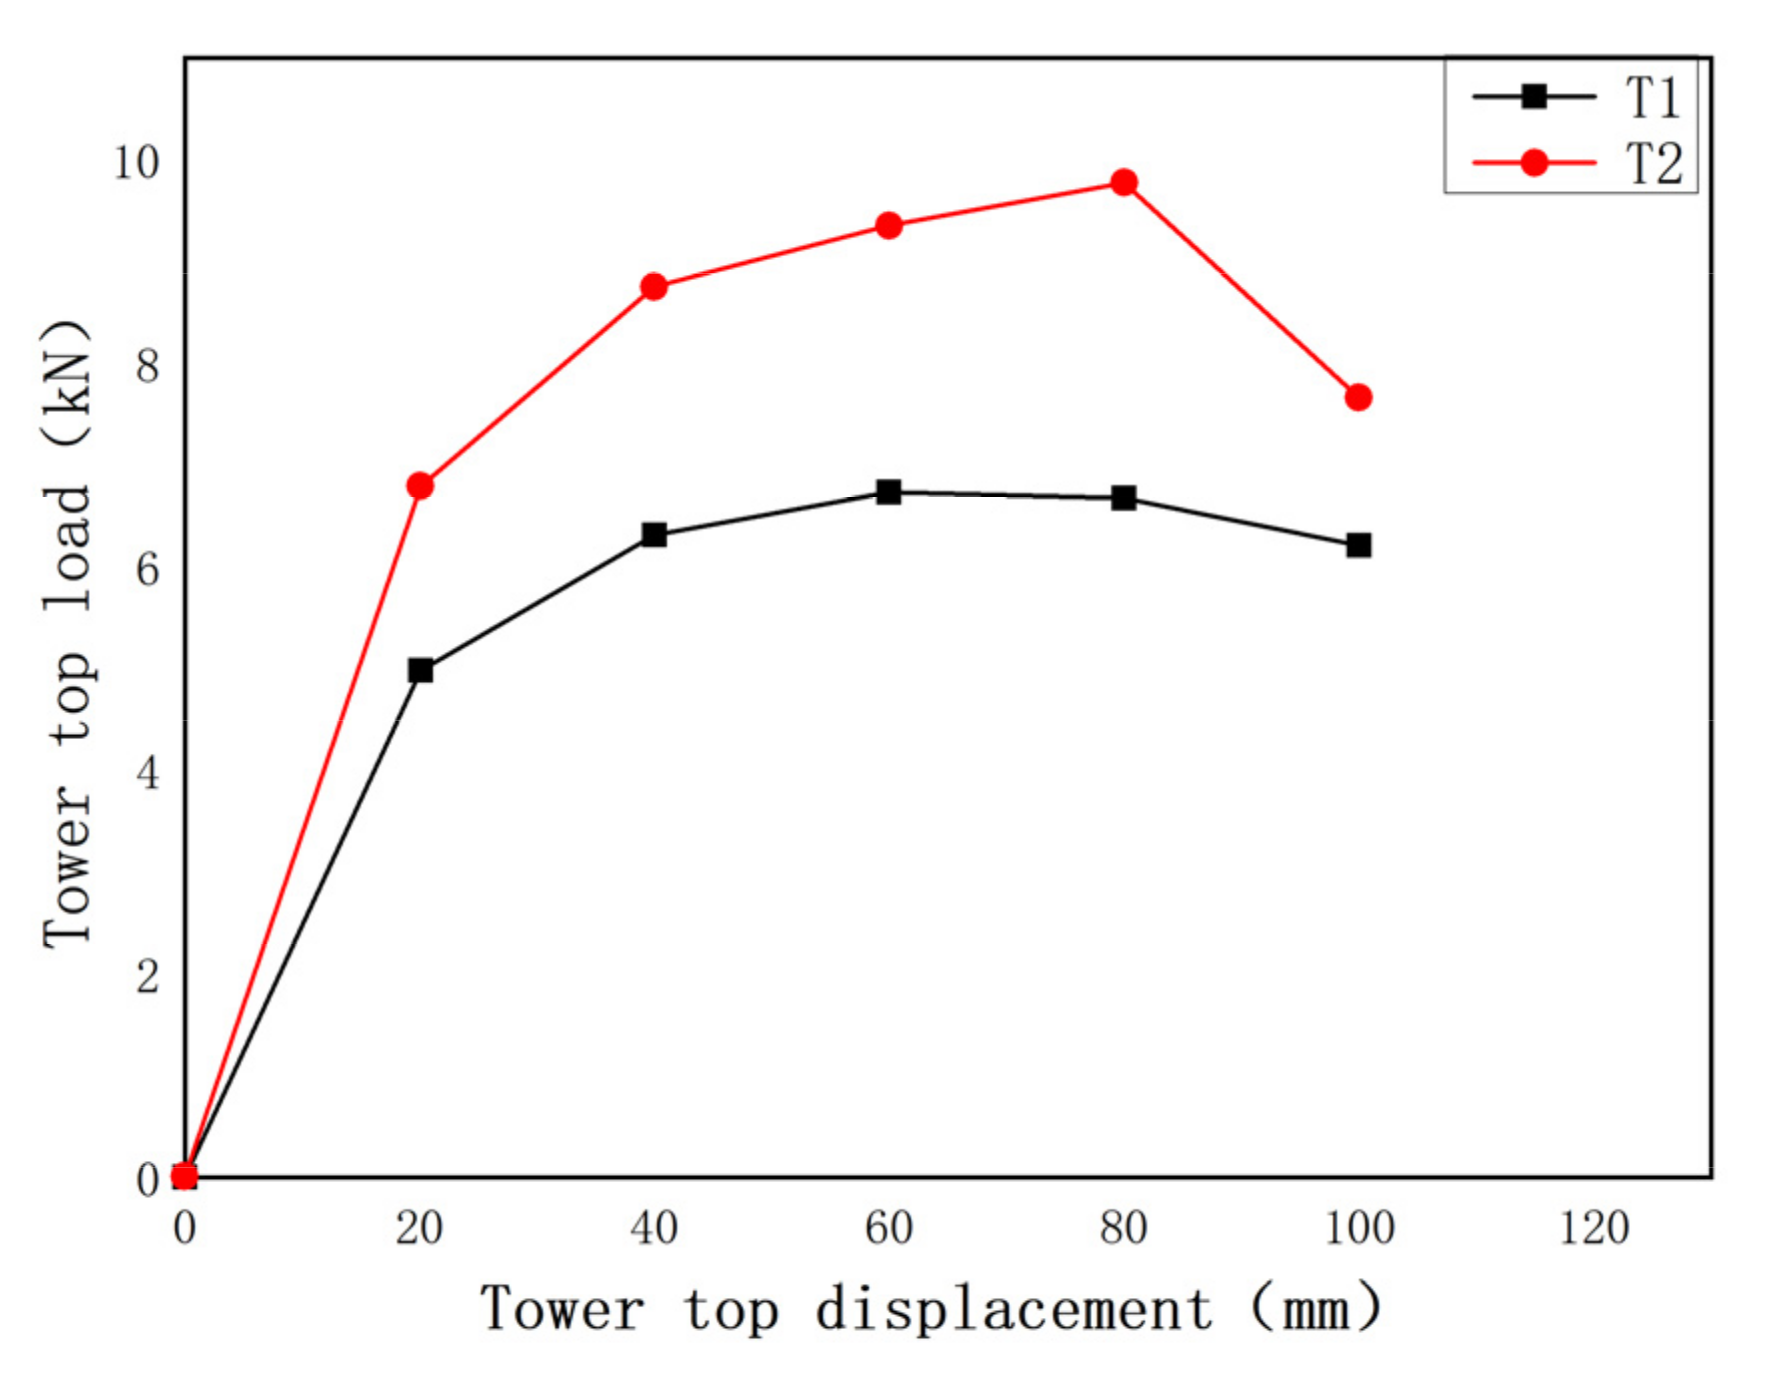
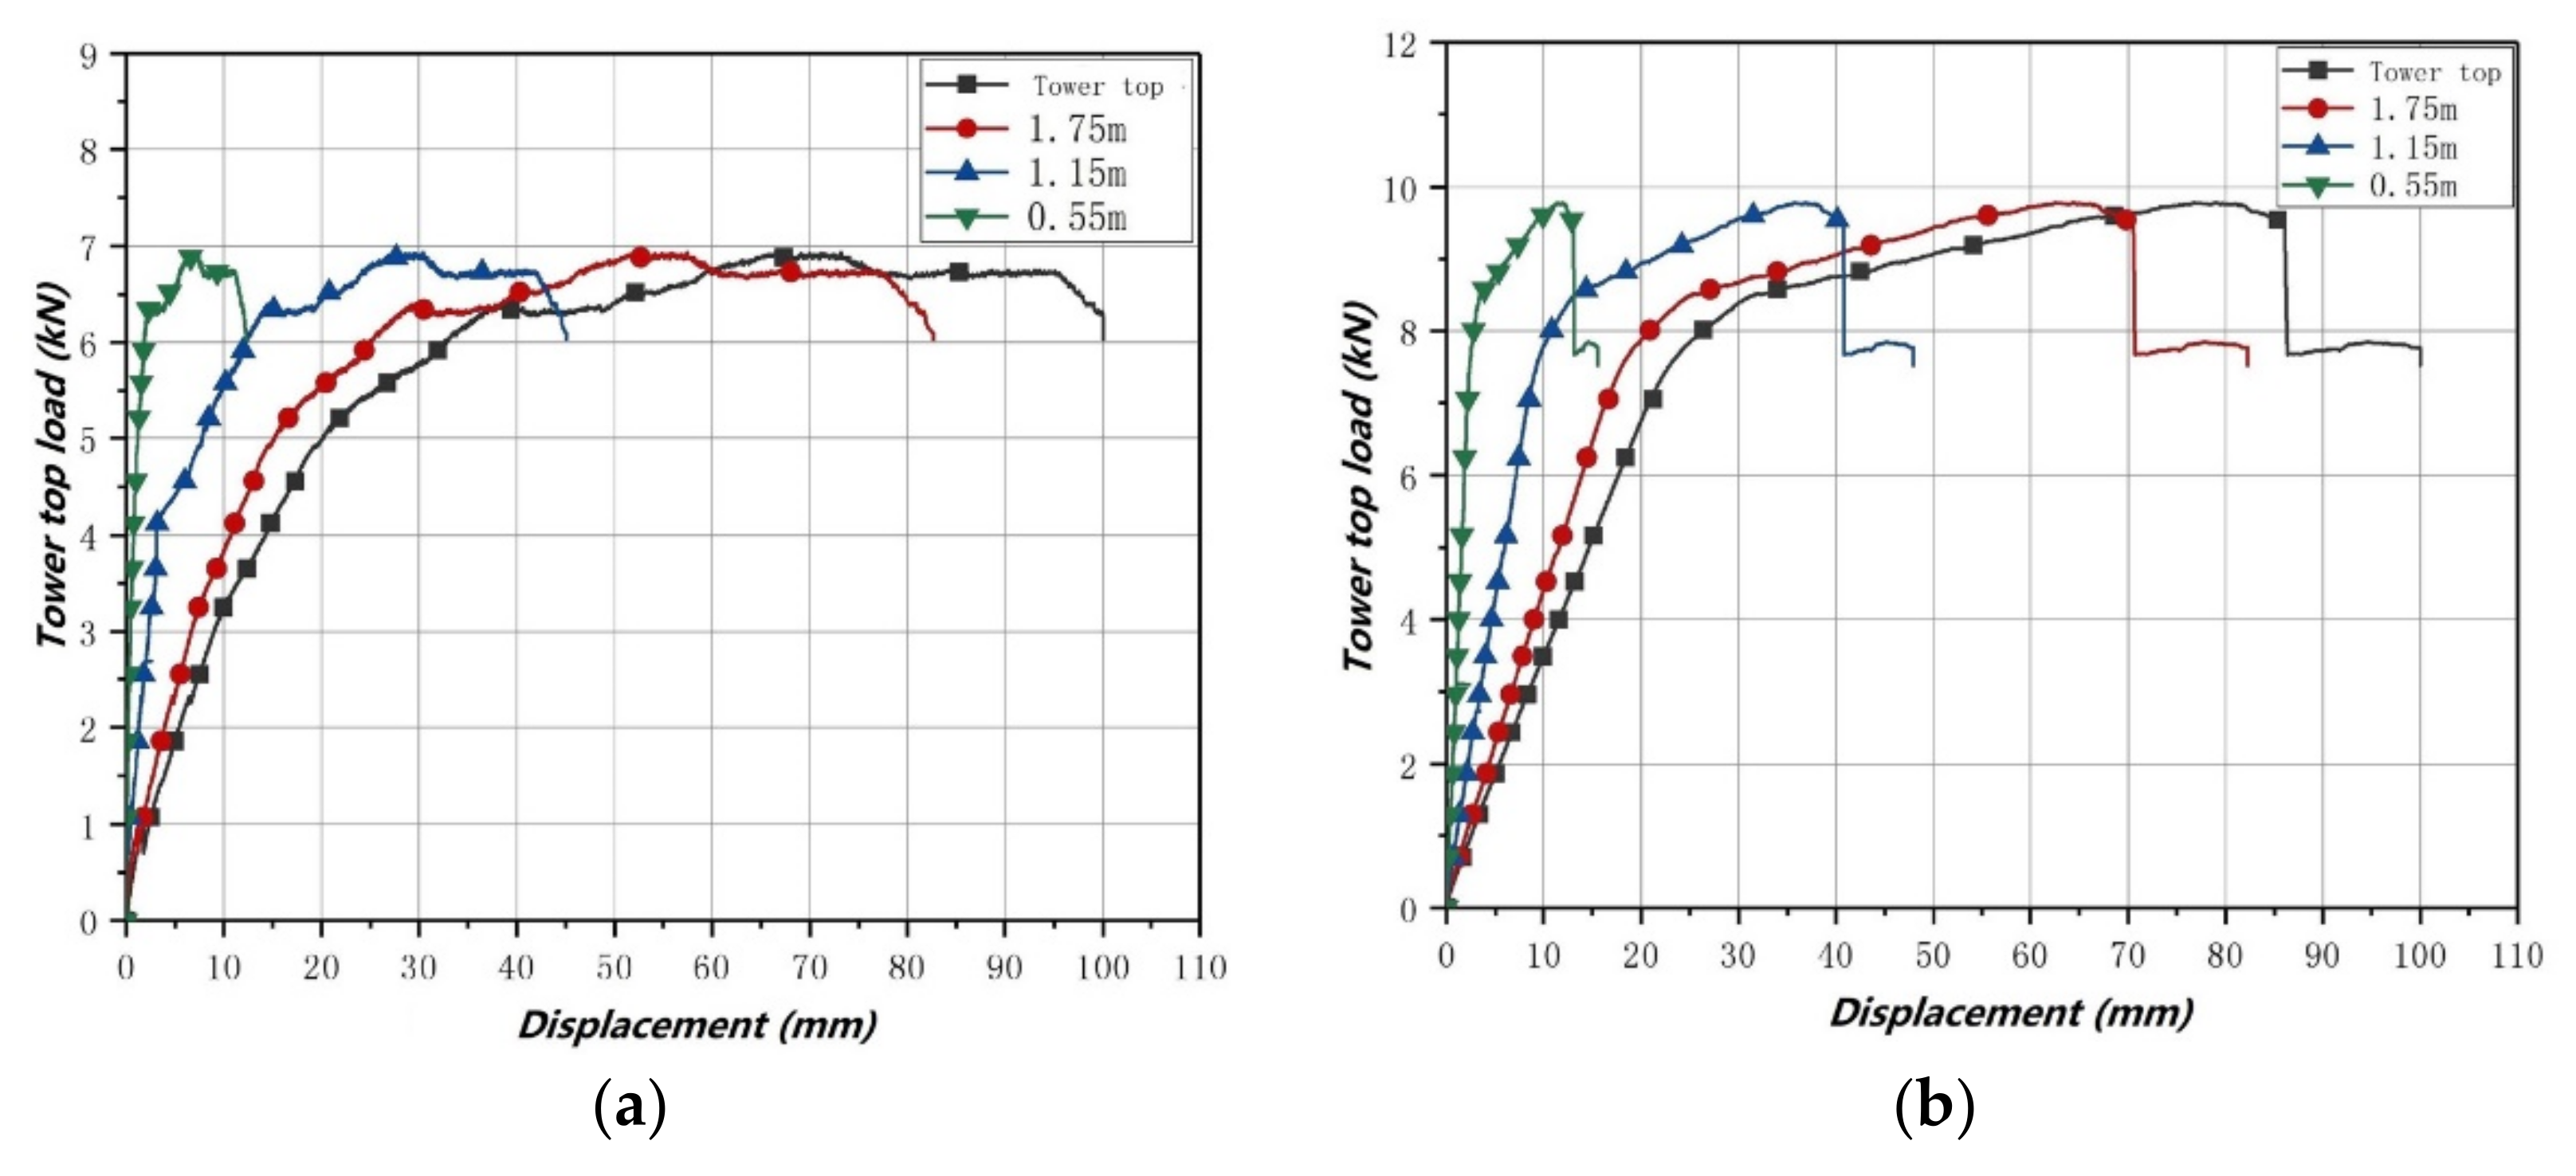
3.1. Tower Top Load-Displacement Curve

The measurement results reflected the main stress characteristics of the test models, such as the ultimate bearing capacity and its corresponding displacement, the development of the load-displacement curve, and the structure’s ductility. The concrete material properties show a certain degree of randomness from both the model level and the structure level, and it was no exception in this experiment. It can be seen from the load-displacement curves that the tangent stiffness, ultimate strength, and peak displacement in the elastic stage, as well as the slope in the descent stage, all exhibit a certain degree of dispersion. However, both the shape and the general law of these curves are consistent, as shown in Figure 5.
Along the tension axis of the tower, a pull-wire displacement gauge with a measuring range of 1000 mm was arranged at the heights of 0.55 m, 1.15 m, and 1.75 m, respectively. Displacement values were measured at the point where the horizontal load acted on the top of the tower. The displacement changes of each component of the tower body during the experiment were monitored using these displacement data. The load-displacement curves at various heights of the tower body were obtained using the load on the top of the tower, as illustrated in Figure 6 below.

3.2. Tower Top Displacement-Strain Curve

A resistance strain gauge was attached to the concrete surface at heights of 0.2 m, 0.4 m, 0.6 m, 0.8 m, and 1.0 m, respectively, in the axial direction at the compression and tension sides of the tower body to measure the strain of the tower. Strain gauges 1, 2, 3, 4, and 5 were attached on the tension side, while strain gauges 7, 8, 9, 10, and 11 were on the compression side to monitor changes in the concrete strain of the tower body during the loading process. Figure 7 shows the tower top displacement and concrete strain curves under the horizontal load.
It is evident from Figure 7 that the concrete strain of test pieces T1 and T2 exhibits similar development laws at different heights, but it shows obvious discreteness in terms of specific values. As the distance between the measuring point and the bottom of the test pieces decreases, the concrete elongation of the tower increases. The maximum compressive strain of the tower is 2750, and the maximum tensile strain is 2600, both of which occur in the plastic hinge area at the bottom. It is because the test pieces deform largely and fast in the plastic hinge area, and all of their deformations are concentrated in this area. During this experiment, it was found that the tension in the upper and middle parts of the test parts was throughout the elastic range and did not enter the plastic phase. The tower is similar to a cantilever beam structure, so its windward surface at the bottom is most likely to be damaged. As the load increases, the damage spreads to the lower and lateral concrete along both sides of the foundation steel ring.
Compared to prior tower studies, this study added adequate air-entraining agents in the concrete tower. The air-entraining agent caused many separate tiny microbubbles that remained stable in the concrete mixture, preventing crack expansion. As a result, it can be employed as a “buffer valve” to minimize and postpone the destruction of cement paste due to various physical and chemical expansions, lessen the stress concentration at the endpoints of microcracks in cement paste, and prevent crack formation and expansion. On the other hand, the tiny bubbles are extremely elastic and have plenty of space for deformation. Stress concentration can develop when the interface of these bubbles is exposed to an external force. They can still release this stress to avoid damage to the interface and keep the concrete from shrinking and cracking.

3.3. Reinforcement Strain Measurement

A total of 10 longitudinally tensioned reinforcements were distributed on each group of model tower walls, with the loading direction from west to east. During the experiment, a total of 34 strain measuring points were arranged to monitor the changes in reinforcement strain. Five strain measuring points were set at heights of 0.2 m, 0.4 m, 0.6 m, 0.8 m, and 1.0 m, respectively, on the longitudinal reinforcement with the greatest stress in the tension and compression zones. In the tension zone, the strain gauges were 1-A, 1-B, 1-C, 1-D, and 1-E, while in the compression zone, the strain gauges were 6-A, 6-B, 6-C, 6-D, and 6-E. Figure 8 depicts their strain changes.
The steel bars in the tension zone yielded before the test pieces were broken, as evident from Figure 8, suggesting that the reinforcing bars have good ductility within the range of plastic failure. When the steel bars in the tension zone reach their yield strength, those in the compression zone do not reach. According to the stress state, the tower top displacement-reinforcement strain curve is divided into three stages.
  • The first stage is the elastic stage, where the friction between the longitudinal reinforcement and the concrete interface, as well as the stress on the longitudinal reinforcement, are both small.
  • The second stage is the plastic stage, where the concrete tower is subjected to shear force due to the unilateral shear force generated by the overturning moment when the tower top bears the horizontal dynamic load. The reinforcement strain, especially the longitudinal reinforcement strain at the crack, increases significantly, indicating that the stress is primarily caused by bending.
  • The third stage is the longitudinal reinforcement plastic failure and the increase in its cracks. The neutral axis travels upwards as the cracks on the concrete tower’s surface continue to expand, increasing the tension zone and narrowing the compression zone. The reinforcement strain increases abruptly and finally fails after reaching the yield point. This phenomenon is similar to the research findings of Xue et al. [30]. During our experiment, it was found that the longitudinal reinforcement strain on the top and in the middle of the test pieces is all in the elastic range and does not enter the plastic stage.
In this paper, the material strain rate was defined as the value of the reinforcement strain change per unit time when the steel bar yielded for the first time. On the other hand, the material strain rate was computed using the maximum reinforcement strain rate measured during the experiment for the steel bar that had not yielded. The reinforcement strain rates of the test pieces at different positions under static loading were obtained using the reinforcement strain data, as shown in Figure 9. The reinforcement strain rate steadily decreases as the distance between the reinforcement strain measuring point and the bottom of the test pieces increases, with its maximum value occurring in the bottom plastic hinge area. This is because the test pieces are large and deform rapidly in the hinge region of the plastic, and almost all of their deformation is concentrated in this region. The longitudinal armature stresses in the upper and middle parts of the test parts were all in the elastic range during the experiment and did not enter the plastic phase.
In conclusion, forces are transferred more adequately in time and space between various materials within the test pieces under static loading in normal conditions. The transfer is temporally and spatially confined to variable degrees as the loading rate increases; that is, the forces can only be transferred in a limited area, narrowing the deformation area between the components and reducing the test pieces’ deformability.

3.4. Tower Failure Mode and Damage Mode

3.4.1. Crack Initiation and Failure Mode of Concrete Tower

Concrete is a brittle material with many non-connected, irregularly-distributed microcracks. The microcracks on the concrete tower expand under external loads and may connect to form macrocracks, eventually causing the concrete tower model to fail. An AOS Technologies AG S-Motion high-speed camera system and a real-time data measuring device were utilized to record the crack initiation, expansion, coalescence, and failure when an external load was applied to the concrete tower model. Since the damage to T1 and T2 components is similar, this article will only address T1 components. Under one-way loads, the main crack initiates at the height of 0.35 m in the tension zone, with a width of 0.04 mm, and the stress concentrates, as illustrated in Figure 10 and Figure 11. The top displacement of the corresponding tower is 4.38 mm. As indicated in Figure 10a, the crack depth on the surface of the tension zone is roughly 1/5 of the wall thickness, and the corresponding tower top load is 1.65 kN. This crack is a splitting crack at an angle of 30° to the horizontal direction. Concrete collapses as vertical and longitudinal cracks emerge on the compression side.
The corresponding load is 3.26 kN when the tower top displacement reaches 10 mm, and the second and third main cracks appear, as shown in Figure 10b,c. As illustrated in Figure 10d–f, the displacement mutation area expands upwards and enters the stage of high-speed growth, during which more cracks initiate in the tension zone within the range of 0.02–1.58 m—the last main crack forms at the height of 1.13 m with a width of 0.09 mm. The tower top displacement is 62.72 mm, and the tower top load is 6.813 kN. No new main cracks appear when the load is increased to 0.4–0.5 Pu. The cracks are spaced stably and uniformly. The previous cracks in the tension zone extend to the compression edge with increasing width and enter the stage of instability failure.
Secondary cracks with a smaller width appear locally inside the test pieces. On the one hand, these secondary cracks weaken the bonding stress between concrete and steel bars, increasing reinforcement strain unevenness; on the other hand, they increase concrete deformation between the main cracks, reducing the width of the main cracks to some extent. More secondary cracks appear as the reinforcement stress increases. The main cracks widen rapidly as the applied load approaches its ultimate value, crushing the concrete and causing the steel bar to attain its yield strength and fail. Figure 12 depicts the crack distribution diagrams for test pieces T1 and T2. The cracks are evenly spaced, and their evolution matches expectations, as evident from the figure. The crack width on the reinforced concrete tower’s surface reaches the maximum at the height of 0.4 m from the bottom of the tension zone and then reduces as the distance from the height of 0.4 m increases. The cracks developed steadily by this point, indicating that the reinforced concrete tower had yielded. The load-displacement curve enters the descent stage as the load continues. Finally, at the bottom of the test pieces, it exhibits the bending failure characteristics of concrete crushing in the compression zone and concrete yielding in the tension zone. The above crack initiation and failure mode are close to those of Jin’s concrete tower test [31], and the crack initiation and failure mode accord with the characteristics of bending failure of the cantilever beam.

3.4.2. Damage Mode

The two test pieces were separately loaded as indicated in the experimental scheme, and the evolution of the surface damage of the reinforced concrete tower was divided into four stages: initial initiation, steady growth, high-speed growth, and instability failure.
  • Initial initiation stage: Friction between the aggregates or between the aggregate and cement occurs as the load is applied, considerably preventing the initiation and expansion of cracks. In other words, the test pieces do not crack because the stress within the tower node combinations is less than the concrete cracking stress.
  • Stable growth stage: A few cracks occur as the load increases. New cracks appear as the aggregate and cement or aggregates gradually separate, and the test pieces undergo elastoplastic deformation. The cracks between the aggregates or between the aggregate and cement at the crack tip spread over as the external load increases, and the cracks on the tower’s surface widen. Still, massive aggregates inside the test pieces prevent the cracks from expanding, which is called the bridging effect. The tower’s longitudinal reinforcement is bent and severely deformed. Centrally symmetrical bending cracks emerge on both sides of the tower.
  • High-speed growth stage: Many aggregates are completely cracked around the crack tip. Existing cracks widen, and new cracks form on the tower’s surface. The cracks are connected to form interlaced diagonal cracks as the bridging effect fails because the main diagonal tensile stress in the core area exceeds the concrete tensile strength. As a result, the reinforcement continues to deform and gradually yields.
  • Instability failure stage: The bearing capacity of the test pieces does not increase as the load approaches its maximum value. Despite this, their deformation continues to worsen, as seen by the wider and longer cracks at the bottom of the test pieces. The internal reinforcement’s plastic strain increases, resulting in more cracks, and the concrete in the tower’s plastic hinge area is crushed and peeled off. The tower is displaced horizontally, the cracks extend to both sides, and the reinforcement enters the yielding stage. The load-displacement curve enters the descent stage as the load continues until it fails.

4. Conclusions

This study explored the complex load-bearing mechanism of the reinforced concrete tower of large wind turbines through a structural model test. The failure bearing capacity of two reinforced concrete tower models was determined, and the damage process of towers and steel bars with increasing loads was analyzed, leading to the following conclusions:
  • The concrete strain in the compression zone of the reinforced concrete tower at various heights increases as the horizontal load on the loading device of the MTS electro-hydraulic servo loading system increases. The concrete becomes crushed and destroyed to the bottom of the tower when it reaches its peak. The structural failure of the tower is an extreme-point instability failure, which means it generally occurs all of a sudden. The weakest part of the structure becomes crushed first, causing the entire structure to deform sharply. Finally, the whole structure loses its load-bearing capacity.
  • The bottom plastic hinge area of both test pieces reaches its maximum tensile strain, while the middle and top parts remain intact. The tower models deform similarly to a rigid body rotating around the bottom plastic hinge area until it collapses. The component’s ultimate bearing capacity is 8.894 kN. Plastic hinges are all generated at geometrical discontinuities. Once these plastic hinges expand over the entire cross-section, the wind turbine tower will become unstable. Therefore, attention should be paid to this position in the design.
  • Internal reinforcement stress can be divided into three stages as external loads increase. In the first stage, the reinforcement and the concrete rub against each other and deform similarly, and the stress is small. In the second stage, due to the overturning moment under horizontal dynamic loads, the top of the tower produces unilateral shear, the concrete cracks, and the reinforcement strain increases significantly because of the bending stress. The reinforcement reaches its yield point under extreme load and fails in the third stage.

Author Contributions

Conceptualization, X.X. and W.X.; methodology, R.L.; software, J.L. (Jinchang Liang); validation, W.X. and J.L. (Jinchang Liang); formal analysis, W.X. and J.L. (Jinchang Liang); investigation, W.X.; resources, X.X.; data curation, R.L. and J.L. (Jun Li); writing—original draft preparation, W.X.; writing—review and editing, X.X. and J.L. (Jinchang Liang); visualization, W.X. and R.L.; supervision, L.J.; project administration, X.X.; funding acquisition, X.X. All authors have read and agreed to the published version of the manuscript.

Funding

This research was funded by the National Natural Science Foundation of China (Grant No. 51979109), Henan Provincial Key Research, Development and Promotion Project (Grant No. 192102310015), Henan Science and Technology Innovation Talent Program (Grant No. 174200510020), and Henan Provincial University Science and Technology Innovation Team Support Program (Grant No. 19IRTSTHN030). These supports are gratefully acknowledged and greatly appreciated.

Institutional Review Board Statement

Not applicable.

Informed Consent Statement

Not applicable.

Data Availability Statement

Not applicable.

Conflicts of Interest

The authors declare no conflict of interest.

References

  1. Vargas, S.A.; Esteves, G.R.T.; Maçaira, P.M.; Bastos, B.Q.; Oliveira, F.L.C.; Souza, R.C. Wind power generation: A review and a research agenda. J. Clean. Prod. 2019, 218, 850–870. [Google Scholar] [CrossRef]
  2. Zhang, T. Design and Research on Jumbo Size and High Tower Structure of Offshore Wind Turbine. Master’s Thesis, Dalian Maritime University, Dalian, China, 2020. [Google Scholar]
  3. Zhang, H.; David, J.; McCalley, J.; Jackman, J. Cost-production impact of increasing wind turbine tower height. In Proceedings of the 7th International Conference on Energy Sustainability and 11th Fuel Cell Science, Engineering and Technology Conference, Minneapolis, MN, USA, 24–26 August 2013. [Google Scholar]
  4. Lantz, E.; Roberts, O.; Nunemaker, J.; Edgar, D.; Dykes, K.; Scott, G. Increasing Wind Turbine Tower Heights: Opportunities and Challenges; National Renewable Energy Laboratory (NREL): Denver, CO, USA, 2019. [Google Scholar] [CrossRef] [Green Version]
  5. Li, D. Structure Analysis and Optimization of Reinforced Concrete Tower. Master’s Thesis, Chongqing University, Chongqing, China, 2018. [Google Scholar]
  6. Li, S.; Zhu, L.; Yao, X. Summary of research on reinforced concrete tower structure of horizontal axis wind turbine. In Proceedings of the China High-Rise Structure Academic Exchange Conference, Zhengzhou, China, 30 August–4 September 2014. [Google Scholar]
  7. Seidel, M. Experiences with two of the world’s largest wind turbine towers. In Proceedings of the 2003 European Wind Energy Conference and Exhibition, Madrid, Spain, 16–19 June 2003. [Google Scholar]
  8. Quilligan, A.; O’Connor, A.; Pakrashi, V. Fragility analysis of steel and concrete wind turbine towers. Eng. Struct. 2012, 36, 270–282. [Google Scholar] [CrossRef]
  9. Brughuis, F.J. Advanced tower solutions for large wind turbines and extreme tower heights. In Proceedings of the 2003 European Wind Energy Conference and Exhibition, Madrid, Spain, 16–19 June 2003. [Google Scholar]
  10. Singh, A.N. Concrete construction for wind energy towers. Indian Concr. J. 2007, 81, 43–49. [Google Scholar]
  11. Way, A.C.; van Zijl, G.P.A.G. A study on the design and material costs of tall wind turbine towers in South Africa. J. S. Afr. Inst. Civ. Eng. 2015, 57, 45–54. [Google Scholar] [CrossRef] [Green Version]
  12. Lyu, W.; Zhu, F.; Lu, B.; Shi, W.; Zhang, J.; He, X.; Qing, S. Experimental study on shear mechanism of perfobond connectors in wind turbines foundation. Eng. Mech. 2018, 35, 127–138. [Google Scholar] [CrossRef]
  13. Chen, D.; Zha, X.; Li, S.; Yu, M.; Xu, L. Experimental study on co-working of inner and outer steel part in concrete-filled steel tube tower frame with inner stiffening parts under tension. J. Build. Struct. 2017, 38, 485–492+501. [Google Scholar] [CrossRef]
  14. Li, B.; Yang, X.; Gao, C. Experimental research and comparative analysis on seismic performance of wind turbine frustum tower drum and latticed tower. J. Build. Struct. 2013, 34, 161–166. [Google Scholar] [CrossRef]
  15. Jin, T.; Wang, X.; Hu, M. Analysis on Causes of Cracking of Centrifugal Fan Impeller. Fluid. Mach. 1999, 27, 37–40. [Google Scholar]
  16. Zhang, D. Test and Analysis of Prestressed Concrete Wind Turbine Tower Model. Master’s Thesis, Shanghai Jiaotong University, Shanghai, China, 2015. [Google Scholar]
  17. Zhang, J.; Shi, F.; Xiang, J.; Zeng, Y.; Song, X. Contact analysis between steel and concrete in wind turbine foundation. Acta Energ. Sol. Sin. 2015, 36, 763–768. [Google Scholar]
  18. Wang, D.; Fan, G.; Zhang, H. Dynamic behaviors of reinforced concrete columns under multi-dimensional dynamic loadings. J. Vib. Shock. 2016, 35, 35–41. [Google Scholar] [CrossRef]
  19. Patil, A.; Jung, S.; Kwon, O.S. Structural performance of a parked wind turbine tower subjected to strong ground motions. Eng. Struct. 2016, 120, 92–102. [Google Scholar] [CrossRef]
  20. Liu, M.; Wang, G.; Zhang, D. Mechanical principle of reinforced concrete planar frame structures in fire. J. Build. Struct. 2020, 41, 94–101. [Google Scholar] [CrossRef]
  21. Tang, Z.; Huang, J. A Finite Element Modeling Method for a Fan Main Bearing. Constr. Des. Proj. 2019, 136–137. [Google Scholar] [CrossRef]
  22. Vries, E. Concrete-steel hybrid tower from ATS. Renew. Energy World 2009, 12, 109–111. [Google Scholar]
  23. Walia, D.; Schiinemann, P.; Kuhl, M.; Adam, F.; Hartmann, H.; Großmann, J.; Ritschel, U. Prestressed ultra high performance concrete members for a TLP substructure for floating wind turbines. In Proceedings of the 27th International Ocean and Polar Engineering Conference, San Francisco, CA, USA, 25–30 June 2017. [Google Scholar]
  24. Vernardos, S.M.; Gantes, C.J.; Badogiannis, E.G.; Lignos, X.A. Experimental and numerical investigation of steel-grout-steel sandwich shells for wind turbine towers. J. Constr. Steel. Res. 2021, 184, 106815. [Google Scholar] [CrossRef]
  25. Ma, H.; Zhang, D. Seismic response of a prestressed concrete wind turbine tower. Int. J. Civ. Eng. 2016, 14, 561–571. [Google Scholar] [CrossRef]
  26. Lan, Y.; Li, Y.; Ren, W.; Huang, X.; Wang, Y. Research on Design Method of Steel-Concrete Hybrid Tower for Wind Turbines. Ship Eng. 2020, 42, 254–259+272. [Google Scholar] [CrossRef]
  27. Hu, D.; Deng, L.; Zeng, L. Study on the Aerodynamic Performance of Floating Offshore Wind Turbine Considering the Tower Shadow Effect. Processes 2021, 9, 1047. [Google Scholar] [CrossRef]
  28. Tang, X.; Liao, L.; Huang, B.; Li, C. Tensile Damage Study of Wind Turbine Tower Material Q345 Based on an Acoustic Emission Method. Materials 2021, 14, 2120. [Google Scholar] [CrossRef]
  29. De Lana, J.A.; Júnior, P.A.A.M.; Magalhães, C.A.; Magalhães, A.L.M.A.; de Andrade Junior, A.C.; de Barros Ribeiro, M.S. Behavior study of prestressed concrete wind-turbine tower in circular cross-section. Eng. Struct. 2021, 227, 111403. [Google Scholar] [CrossRef]
  30. Xue, W.; Yu, P.; Liu, S.; Hu, X. Study on the Details of Vertical Connecting Reinforcement in Double Composite Shear Wall. Constr. Technol. 2018, 47, 25–29. [Google Scholar]
  31. Jin, T. Experimental Study on the Whole Process of Nonlinear Stress of Reinforced Concrete Wind Power Tower. Master’s Thesis, Tongji University, Shanghai, China, 2009. [Google Scholar] [CrossRef]
Figure 1. The geometric dimensions and reinforcement of the test pieces (unit: mm). (a) Facade; (b) 1-1 profile; (c) 2-2 profile.
Sustainability 14 04410 g001
Figure 2. Longitudinal reinforcement strain test plan.
Sustainability 14 04410 g002
Figure 3. Tower strain and displacement test plan. (a) Tower strain test plan; (b) Displacement test plan.
Sustainability 14 04410 g003
Figure 4. (a) Simulated horizontal loading of the steel roof member of the tower top; (b) Buried tower top loading device; (c) Schematic diagram of loading and testing systems.
Sustainability 14 04410 g004
Figure 5. Curves of tower top load and tower top displacement.
Sustainability 14 04410 g005
Figure 6. Displacement and tower top load curves at different heights. (a) Test piece T1; (b) Test piece T2.
Sustainability 14 04410 g006
Figure 7. The relationship between the strain of the concrete tower tube and the displacement of the tower top. (a) The strain development of the tower tube in the compression zone of the test pieces; (b) The strain development of the tower tube in the compression zone of the test pieces.
Sustainability 14 04410 g007
Figure 8. The relationship between the strain of the steel bar and the displacement of the tower top. (a) The strain development of the steel bar in the tension zone of the test pieces; (b) The strain development of the steel bar in the compression zone of the test pieces.
Sustainability 14 04410 g008
Figure 9. Variation curve of reinforcement strain rate.
Sustainability 14 04410 g009
Figure 10. Cracks of the test piece T1 in the tension zone. (a) Top crack distribution map; (b) Upper part crack distribution map; (c) Middle crack distribution map; (d) Lower middle part crack distribution map; (e) Bottom crack distribution map; (f) Root segment crack distribution map.
Sustainability 14 04410 g010
Figure 11. Cracks of the test piece T2 in the tension zone. (a) Top crack distribution map; (b) Upper part crack distribution map; (c) Middle crack distribution map; (d) Lower middle part crack distribution map; (e) Bottom crack distribution map; (f) Root segment crack distribution map.
Sustainability 14 04410 g011
Figure 12. Crack distribution of two test pieces. (a) Crack distribution on the tensile surface of test piece T1; (b) Crack distribution on the compression surface of test piece T1; (c) Crack distribution on the tensile surface of test piece T2; (d) Crack distribution on the compression surface of test piece T2. In the figure, the red lines indicate the crack, the red numbers indicate the sequence in which the cracks begin to appear, the black lines indicate the outline of the test pieces, and the black numbers (unit: cm) indicate the height.
Sustainability 14 04410 g012
Table 1. Parameters of the test pieces.
fc/(N/mm2)fy/(N/mm2)fu/(N/mm2)Ec/(N/mm2)Es/(N/mm2)ρs/%ρv/%
32.5633540030,000200,00021.5
fc is the compressive strength of cubic concrete; fy is the actually measured yield strength of longitudinal reinforcement; fu is the actually measured ultimate strength of longitudinal reinforcement; Ec and Es are the elastic modulus of concrete and longitudinal reinforcement; ρs and ρv are the longitudinal reinforcement ratio and reinforcement ratio per unit volume, respectively.
Publisher’s Note: MDPI stays neutral with regard to jurisdictional claims in published maps and institutional affiliations.

