Article

Forecasting the Effect of Migrants’ Remittances on Household Expenditure: COVID-19 Impact

1
Library of Henan Institute of Science and Technology, Xinxiang 453003, China
2
School of Economics, Fujian Normal University, Fuzhou 350117, China
3
Department of Marketing, Sumy State University, 40007 Sumy, Ukraine
*
Author to whom correspondence should be addressed.
Sustainability 2022, 14(7), 4361; https://doi.org/10.3390/su14074361
Submission received: 18 February 2022 / Revised: 20 March 2022 / Accepted: 31 March 2022 / Published: 6 April 2022

Abstract

:
The unexpected pandemic has provoked changes in all economic sectors worldwide. COVID-19 has had a direct and indirect effect on countries’ development. Thus, the pandemic limits the movements of labour forces among countries, restricting migrants’ remittances. In addition, it provokes the reorientation of consumer behaviour and changes in household expenditure. For developing countries, migrant remittances are one of the core drivers for improving household wellbeing. Therefore, the paper aims to analyse how the COVID-19 pandemic has affected household expenditure in Ukraine, as being representative of a developing country. For this purpose, the data series were compiled for 2010 to the second quarter of 2021. The data sources were as follows: Ministry of Finance of Ukraine, The World Bank, and the State Statistics Service of Ukraine. The core variables were as follows: migrants’ remittances and expenditure of households by the types. The following methods were applied to achieve the paper’s aims: the Dickey–Fuller Test Unit Root and the ARIMA model. The findings confirmed that COVID-19 has changed the structure of household expenditure in Ukraine. Considering the forecast of household expenditure until 2026, it was shown that due to changes in migrants’ remittances, household expenditure in all categories tends to increase. The forecasted findings concluded that household expenditure on transport had the most significant growth due to changing migrants’ remittances.

1. Introduction

The COVID-19 pandemic has provoked changes and transformations in all sectors related to the world globalisation process, including consumer behaviour. Considering the World Bank Report in 2019 (the beginning of COVID-19), global migrants’ remittances into developing countries are approaching USD 550 billion, which significantly outweighs direct foreign investments [1]. In 2020, the global migrants’ remittances decreased to the historical minimum by USD 110.00 bln [2].
Considering the official analytic reports [3,4], in Ukraine, from 2010 to 2020, migrant remittances significantly exceeded the volume of foreign investment in the country. The most significant gap between the migrants’ remittances and inflows of foreign investment in Ukraine was recorded in 2014—7.7 times—and the gap increased significantly during the pandemic. As of 2020, the gap amounted to USD 8,880.36 million, compared to 2019—3190.00 million USD. The dynamic of migrants’ remittances to Ukraine and foreign direct investment for 2010–2021 is presented in Figure 1.
It should be noted that political conflict in Ukraine (2014), running the DFCTA, and free movement between Ukraine and EU countries (2018) provoked step-by-step changes to the structure of the migrant labour force and, as a consequence, to the structure of migrants’ remittances to Ukraine. Thus, Figure 2 confirms that the rapid decline in migrants’ remittances to Ukraine from Russia after the 2014 invasion of Ukraine. The remittances declined from 40% in 2014 to 9.8% in 2018. However, the migrants’ remittances to Ukraine from Poland and Chechia had rapidly grown after 2014, and the second wave of growth was after 2018. Thus, the migrants’ remittances to Ukraine increased: from Poland, from 0.5% (2014) to 33.6% (2018); from Chechia, from 0.5% (2014) to 7.6% (2018). At the same time, the migrants’ remittances to Ukraine were declining for the 2020–2021 period (COVID-19 time), excluding Poland.
It is noted that migrants’ remittances are the core forces for improving the wellbeing of the household in developing countries. Mostly, the received money from migrants was spent by the households for the satisfaction of their daily needs. Thus, the limitation of the labour force movement due to COVID-19 could lead to declining migrants’ remittances. Thus, considering Figure 1, the migrants’ remittances declined by 7% in 2021 (the year with COVID-19) compared to the 2020 year. Consequently, it provokes a negative effect on households’ wellbeing and, in the long-term period, the slowing of the country’s economic development, particularly in developing countries. The households’ direct earnings to the first aid needs, excluding the long-term spending. In this case, it is actual to estimate the pandemic’s impact on households’ expenditure.
The paper has five sections: Section 1—explanation of the reason to analyse the pandemic impact on households’ expenditure; Section 2—describing the scientific background on analysis of COVID-19 impact on the migrants’ remittances, household consumption and expenditure, and economic growth; Section 3—explanations for the methods that were applied for achieving the paper’s aim; Section 4—empirical justification and explanation of the pandemic impact on households’ expenditure; Section 5—describing the findings and comparison with the previous results, analysis of the government policy for recovering due to the pandemic, and identifying the further research direction.

2. Literature Review

Considering the world experts’ assessment, the increase in migrant remittances allows a decline in poverty and supports the payment balance and national economic growth. At the same time, the pandemic COVID-19 provoked the shaping issues in that process.

2.1. COVID-19 Impact on the Migrants’ Remittances and Economic Growth

The studies [5,6,7,8,9,10,11,12,13] confirmed that migrants are one of the core elements of the country’s labour forces. In addition, the highly qualified migrants positively affect the countries’ economic growth [7,8], innovation development [9,10,11,12,13,14,15,16,17,18], and competitiveness globally.
Meyer D. and Shera A. [19] highlighted that the share of migrant remittances in GDP in developing countries increases and could be more than 10%. Considering the Ministry of Finance of Ukraine and World Bank [1,20], the migrant remittances share an interval from 5% to 8%.
Meyer D. and Shera A. [19] analysed six countries (Albania, Bulgaria, Macedonia, Moldova, Romania, and Bosnia and Herzegovina) with the highest migrant remittances. Based on the panel data, Meyer D. and Shera A. [19] confirmed the positive, statistically significant impact of migrant remittances on the economic growth of the selected countries. For this purpose, Meyer D. and Shera A. applied Ordinary Least Square Methods with Fixed and Random Effects). GDP per capita was chosen as the dependent variable, and the following indicators were selected as independent (describing the economic development of the country):
  • The share of remittances from abroad in the country’s GDP;
  • Gross capital formation (% of GDP);
  • Final consumption expenditure of households (% of GDP);
  • School enrolment ratio (% of GDP);
  • Balance of payments of the country;
  • Population growth index;
  • Real effective exchange rate.
The paper [21], based on the example of Nigeria, using the Generalised Method of Moment, confirmed the positive statistically significant impact of migrant remittances on the country’s economic growth indicators: consumption, investment, imports, and GDP.
Nwaogu U. G. and Ryan M. J. [22] analysed 35 African countries and 35 Latin America and the Caribbean. Using the Dynamic Spatial-Lag Model, Nwaogu U. G. and Ryan M. J. [22] justified similar results [21]. However, they eliminated the other factors from the model. Benhamou Z. A. and Cassin L. [23] confirmed the hypothesis of the relationship between remittances, export diversification, education coverage, and CO2 emissions for the 22 largest recipients of remittances from 1986 to 2017. Benhamou Z. A. and Cassin L. used the Unit Root Test; Westerlund and Edgerton cointegration analysis with structural gaps; Cup-FM and CUP-BC approaches for estimating long-term relationships; and the Generalised Quantile Regression Method. The findings concluded that economic growth provokes growing anthropogenic pressure on the environment. However, the growth of migrants’ remittances leads to declining CO2 emissions. The studies [24,25] confirmed that migrants affect economic growth and green economic development. In addition, the experts declared that COVID-19 restricts Sustainable Development Goals (SDGs). Firstly, pandemics influenced social, economic, and ecological development [26,27,28,29].
Banjara S., Karki S., and Dumre A. [30] analysed the impact of migrant remittances on economic development in Nepal. Nepal is one of the world leaders in the export of labour recourses. Thus, in the 2017–2018 years, the share of migrant remittances in the country’s GDP was 25%. The findings of the paper [30] confirmed a positive statistically significant effect of migrant remittances on the human capital index and financial development of the country. At the same time, their negative impact on labour productivity and international trade in Nepal has been empirically confirmed.
Using ARDL modelling, Zobair S. [31] analysed the impact of migrant remittances on economic growth in Bangladesh. The data for analysis were generated from the World Data Bank for 1976–2017 years. The findings [31] proved the positive impact of foreign direct investment on the country’s economic development. At the same time, the findings confirmed the negative statistically significant impact of foreign aid and migrant remittances on GDP per capita. An increase in migrant remittances by 1% leads to a decrease in GDP per capita by 0.072% (level of statistical significance—5%). Zobair S. emphasised that it was primarily because family members who received remittances from abroad reduced their economic activity. Ultimately, it provoked a reduction in labour supply to developing countries. In most cases, funds received from abroad are used to meet daily needs and are not considered as investment capital [31] in the long term.
Lacheheb Z. and Ismail N. [32] analysed the economic indicators of 93 countries divided into low- and middle-income countries for the 2009–2017 year. The empirical results [32] confirmed the negative statistically significant impact of remittances on economic growth. For this purpose, Lacheheb Z. and Ismail [32] applied SYS-GMM-modelling.
The results in the paper [33] empirically confirmed the negative impact of COVID-19 on the dynamics of economic growth in Latin and Central America. The pandemic provoked restrictions on the movement of labour resources, which resulted in a decrease in the inflow of remittances from abroad. As a result, it could provoke an increase in poverty in the analysed countries [33]. In addition, considering the forecasting after COVID-19, migrants’ remittances could decline by 14%, and Salvador and Nicaragua could feel the most significant economic negative consequences. In Salvador, poverty will increase by 6% due to the changes in migrants’ remittances, and in Guatemala, it will increase by 1%. The opposite effect of COVID-19 impacts on migrants’ remittances for Samoa was proved in the paper [34]. Considering the findings, COVID-19 has increased remittances to Samoa from Australia and New Zealand, and at the same time, remittances from the United States to the country significantly decreased. To test the study’s hypotheses, [34] used the tools of VEC modelling.
In the example of Nepal, Chaudhary A. [35] empirically confirmed that the growth of the share of remittances from abroad in the country’s GDP has a positive effect on economic growth. Forecasting results [35] confirmed that pandemic spreading would provoke a decrease in the share of remittances in GDP from 25% to 75%, and it will reduce the forecasted GDP growth in the range of 6.68–5.3%. At the same time, Chaudhary A. [35] highlighted that the pandemic’s consequences were more tangible at the microlevel than at the macrolevel. The studies [36,37,38] confirmed the negative impact of quarantine restrictions on economic and social development during pandemics.
Tut D. [39] investigated the impact of the COVID-19 pandemic on FinTech consumers’ use of payments. Tru D. noted that COVID-19 provoked the acceleration of the penetration of FinTech platforms for online payments. The number of mobile banking transactions increased by 54%, and at the same time, the use of physical payment cards was significantly reduced. Tru D. underlined that COVID-19 provided an increase in the level of consumers’ digital inclusion. The findings in [40] justified that the crucial risks for Southeast Asia (caused by COVID-19) were the slowdown in economic growth, trade resumption, and rising unemployment.
Canuto O. [41] concluded that the coronavirus had slowed globalisation and boosted the transition from a traditional to a digital economy. Withers M., Henderson S., and Shivakoti R. [42] confirmed that COVID-19 provoked in South Asia’s international money transfer system shocks. It had been a catalyst for a reduction in foreign exchange earnings from abroad, increasing unemployment and declining economic wellbeing of households. The findings of casual analysis determined that COVID-19 led to a slowdown in GDP growth in South Asia [43]. Aidi W. and Karingi S. noted that remittances from abroad were the basis for ensuring an acceptable level of wellbeing for African households. According to official statistical reports, they observed the following:
  • One in five people in Africa sends or receives remittances from abroad;
  • The share of remittances from abroad in GDP is almost 10% in six African countries;
  • In 2020, African countries received almost USD 78 billion in remittances from abroad [44].
The short-and long-term forecasting results showed that the service and industry sectors would feel the most significant negative impact of COVID-19. Using the ARIMA model, the study [45] forecasted the remittances from abroad for two scenarios: the pandemic will be escalated; the pandemic will stop. Thus, if the pandemic continues, remittances from abroad will be significantly reduced, negatively affecting the countries’ economic development (Bangladesh, Pakistan, and Sri Lanka).

2.2. COVID-19 Impact on Household Consumption and Expenditure

Using a regression model with a fixed effect, Anoba A. and Olaoluwa A. [46] analysed the changes in final household consumption due to COVID-19 in Canada. The empirical results showed that daily consumption in Canada decreased by 7.22% after COVID-19. The most considerable reductions in consumption after implementing quarantine restrictions were in the provinces of Alberta, Newfoundland, and British Columbia (9.83%, 8.03%, and 7.71%, respectively). Furthermore, Quebec, Saskatchewan, and New Brunswick had the smallest decline in household consumption—5.4%, 5.4%, 5.94%, and 5.98%, respectively. Surico P., Känzig D., and Hoke S. H. analysed consumer behaviour in the UK before and during the pandemic. Thus, they identified the increase in inequalities between consumption and household income. The household incomes fell by an average of 30% during the pandemic, and consumer spending by British households fell by an average of 40–50%. The study [47] confirmed that quarantine restrictions had caused fluctuations in American households’ cost and final consumption. In the first half of March 2020, households increased total expenditure by more than 40% in almost all categories of goods/services. The second half of March 2020 (acceleration of the spread of COVID-19) recorded a decrease in total costs by 25–30%. However, household spending on food and food supplies increased. A similar conclusion was obtained by [48] for Ireland. For this purpose, the data were generated from the Household Budget Survey (HBS), which was developed by the Сentral Statistics Office (CSO). On the contrary, from the mentioned above studies, the scientist in the paper [48] analysed three scenarios:
  • Return to the “new normality” with constant physical and social distancing;
  • Blocking the “next wave” of the pandemic;
  • The rapid development of the vaccine, which will return to everyday economic and social life.
The results confirmed that household consumption could decrease by 12–20% compared to before the pandemic. At the same time, the revenues from the payment of indirect taxes by households could decrease by 19–32% [48].
The study [49] analysed the heterogeneity of the COVID-19 impact on household consumption and expenditure and the business sector. According to the results, there has been a sharp reduction in spending among the high-income population, especially in regions with a high level of COVID-19 infection. Accordingly, this trend has led to a decrease in the income of small enterprises in high-income regions. As a result, these companies laid off some workers, leading to massive job losses, especially among low-paid workers in high-income areas. High-wage workers had a “V-shaped” recession that lasted several weeks, while low-wage workers suffered much more significant losses. It should be noted that the introduction of government policy on financial assistance to low-income households has provoked an increase in consumer spending.
The results of the systematisation of scientific achievements on this issue showed the direct impact of COVID-19 on the migrants’ remittances and consumer spending of households. At the same time, this impact is diversified for developing and developed countries. Thus, the paper aims to forecast the effect of migrants’ remittances on household expenditure due to the COVID-19 impact. Considering mentioned above, the following hypotheses was checked.
Hypothesis 1:
COVID-19 had impact on the decline in household expenditure.
Hypothesis 2:
Themigrants’ remittanceshad the compensation mechanism fromthe decline in household expenditure due to COVID-19.

3. Materials and Methods

ARIMA modelling was applied to forecast the effect of migrant remittances on household expenditure due to the COVID-19 impact. It allowed retrospective analyses and forecast scenarios based on time series data. Considering the findings [50,51], in general, the ARIMA-model could be written as follows (Equation (1)).
a Y t = i = 1 n γ i a Y t 1 + ε t + j = 1 m β j a δ t j , δ t ~ N 0 , η t 2
Transforming model (1), its short record is described as follows:
γ X ( 1 X ) a Y t = β X δ t
where γ   and   β are polynomials of n and m degrees, X denotes the lag operator ( X j Y t = Y t j , X j δ t j , j = 0 , ± 1 , ), and a denotes the operator of successive differences ( Y t = Y t 1 Y t = 1 X Y t , 2 Y t = 2 Y t + 1 Y t = ( 1 X ) 2 Y t , ).
The core stages of ARIMA-modelling are as follows:
1.
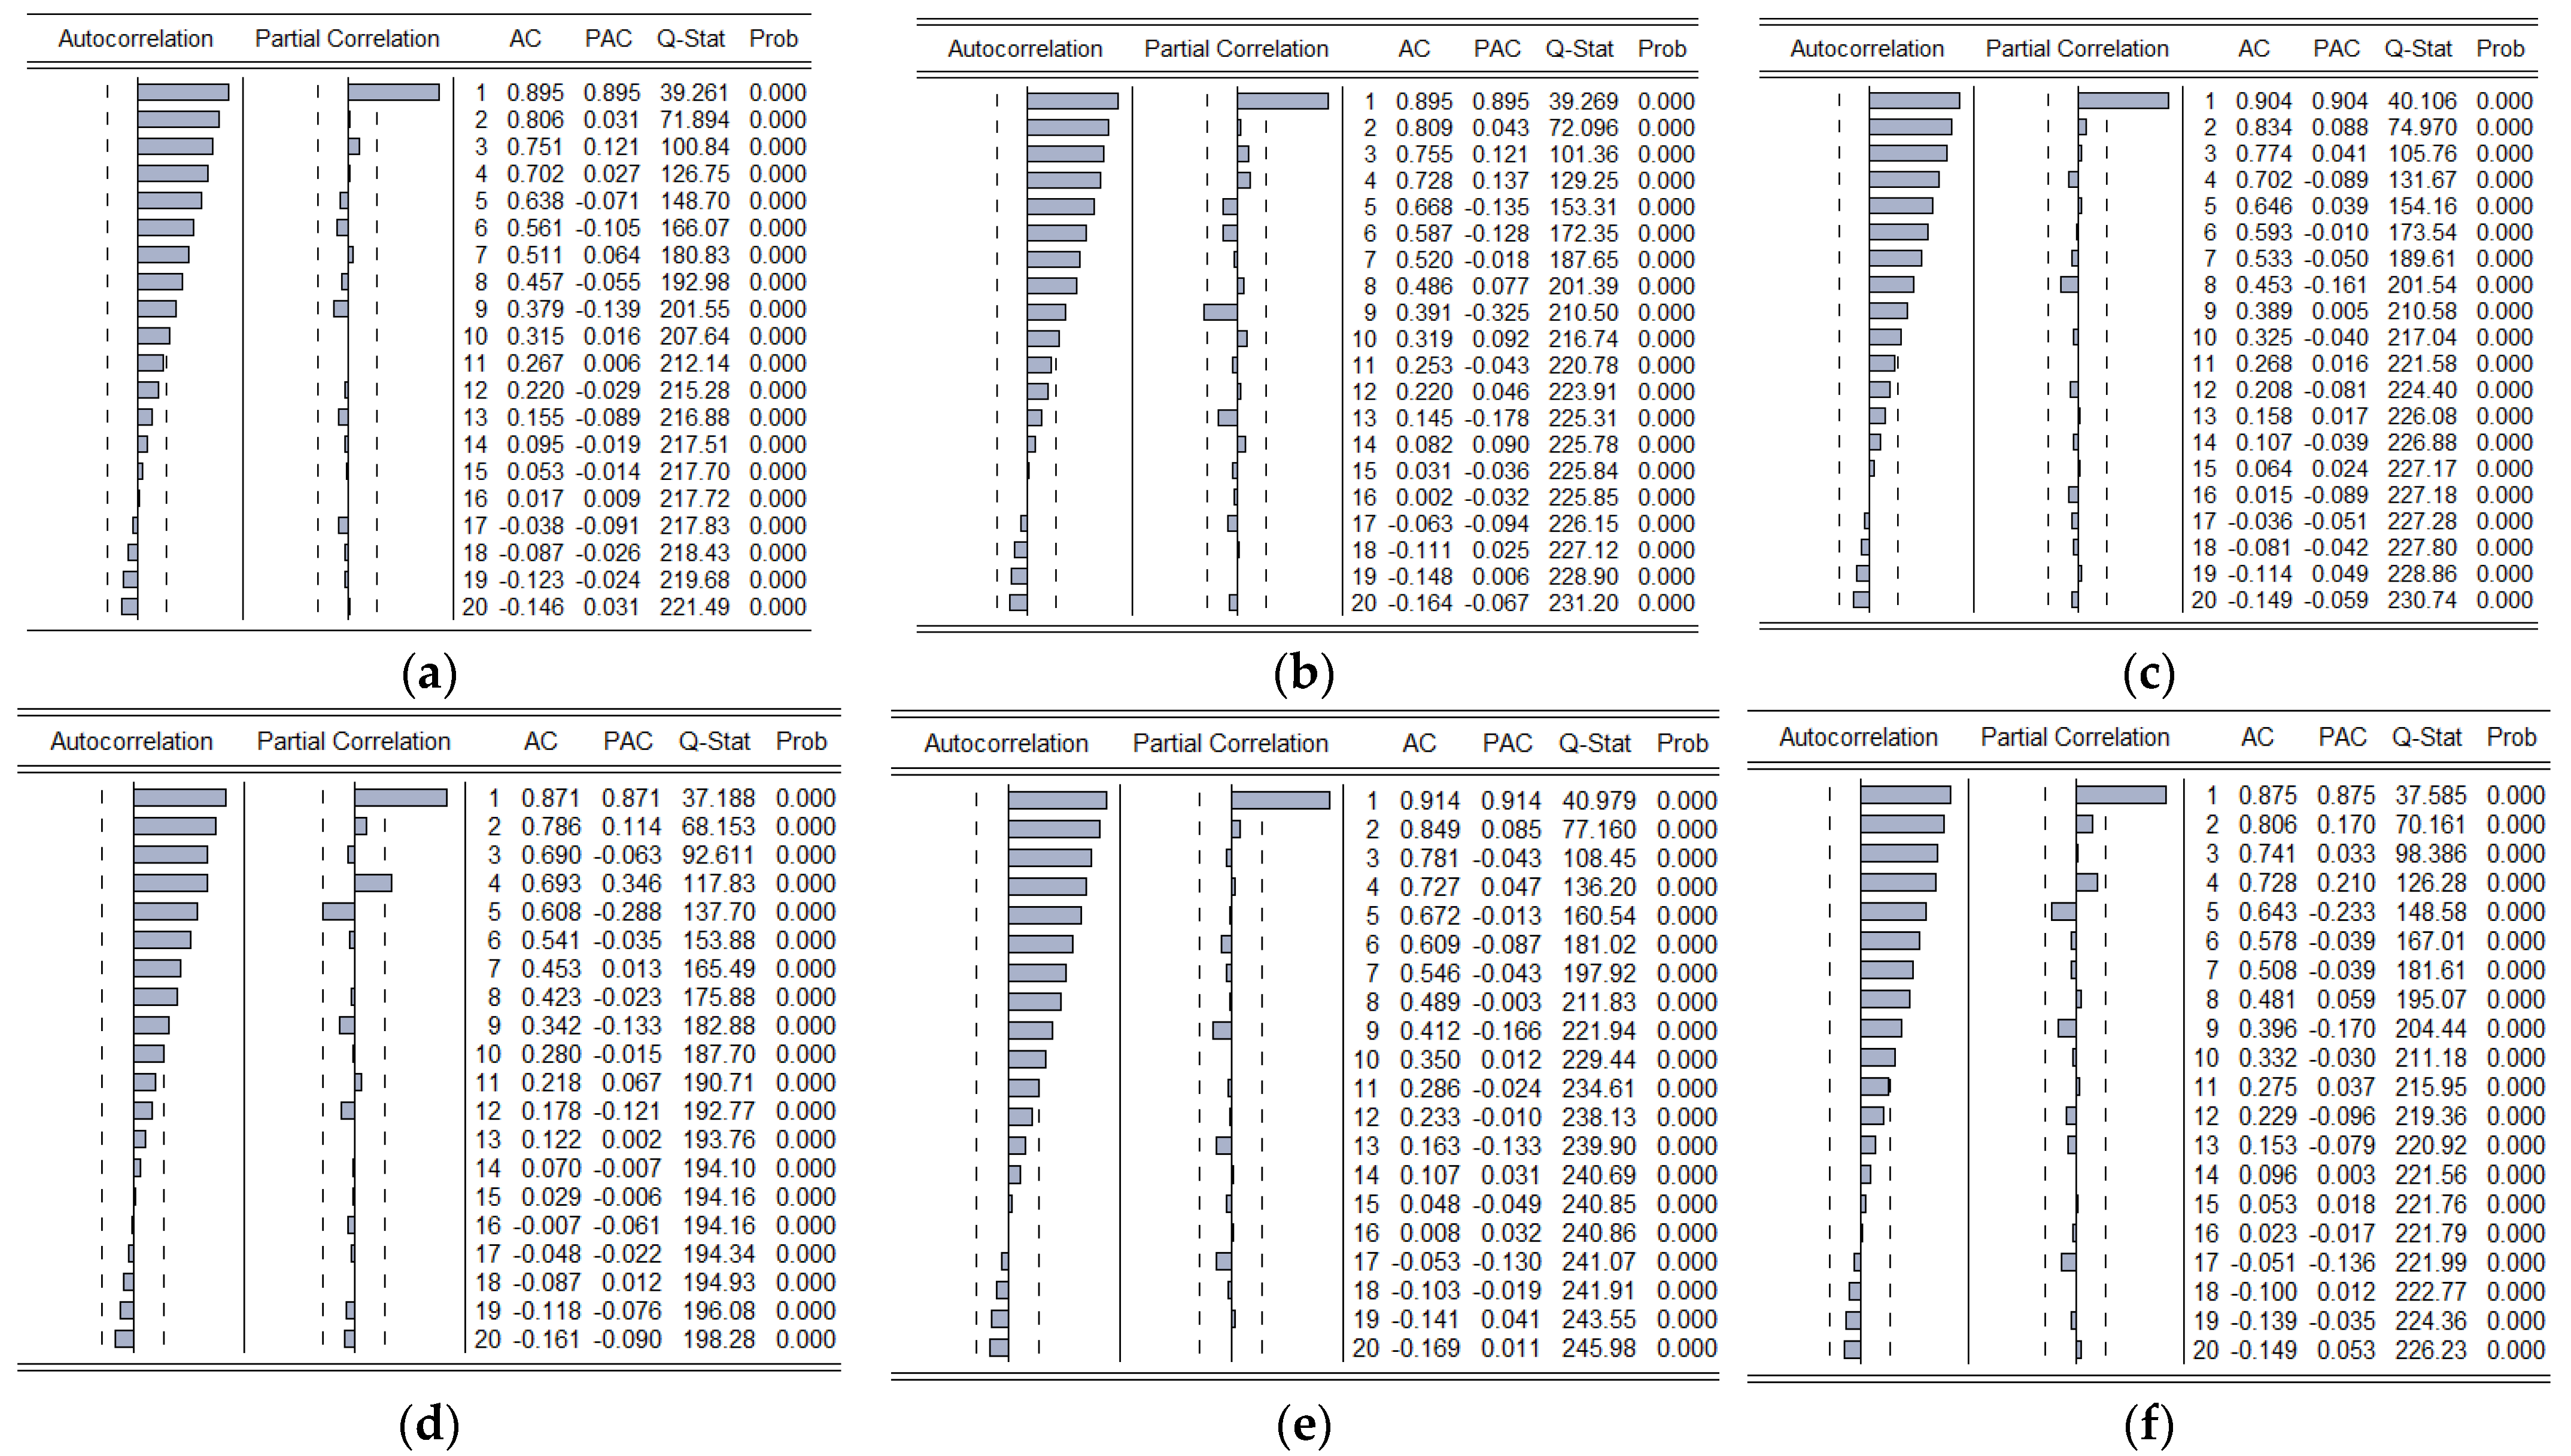
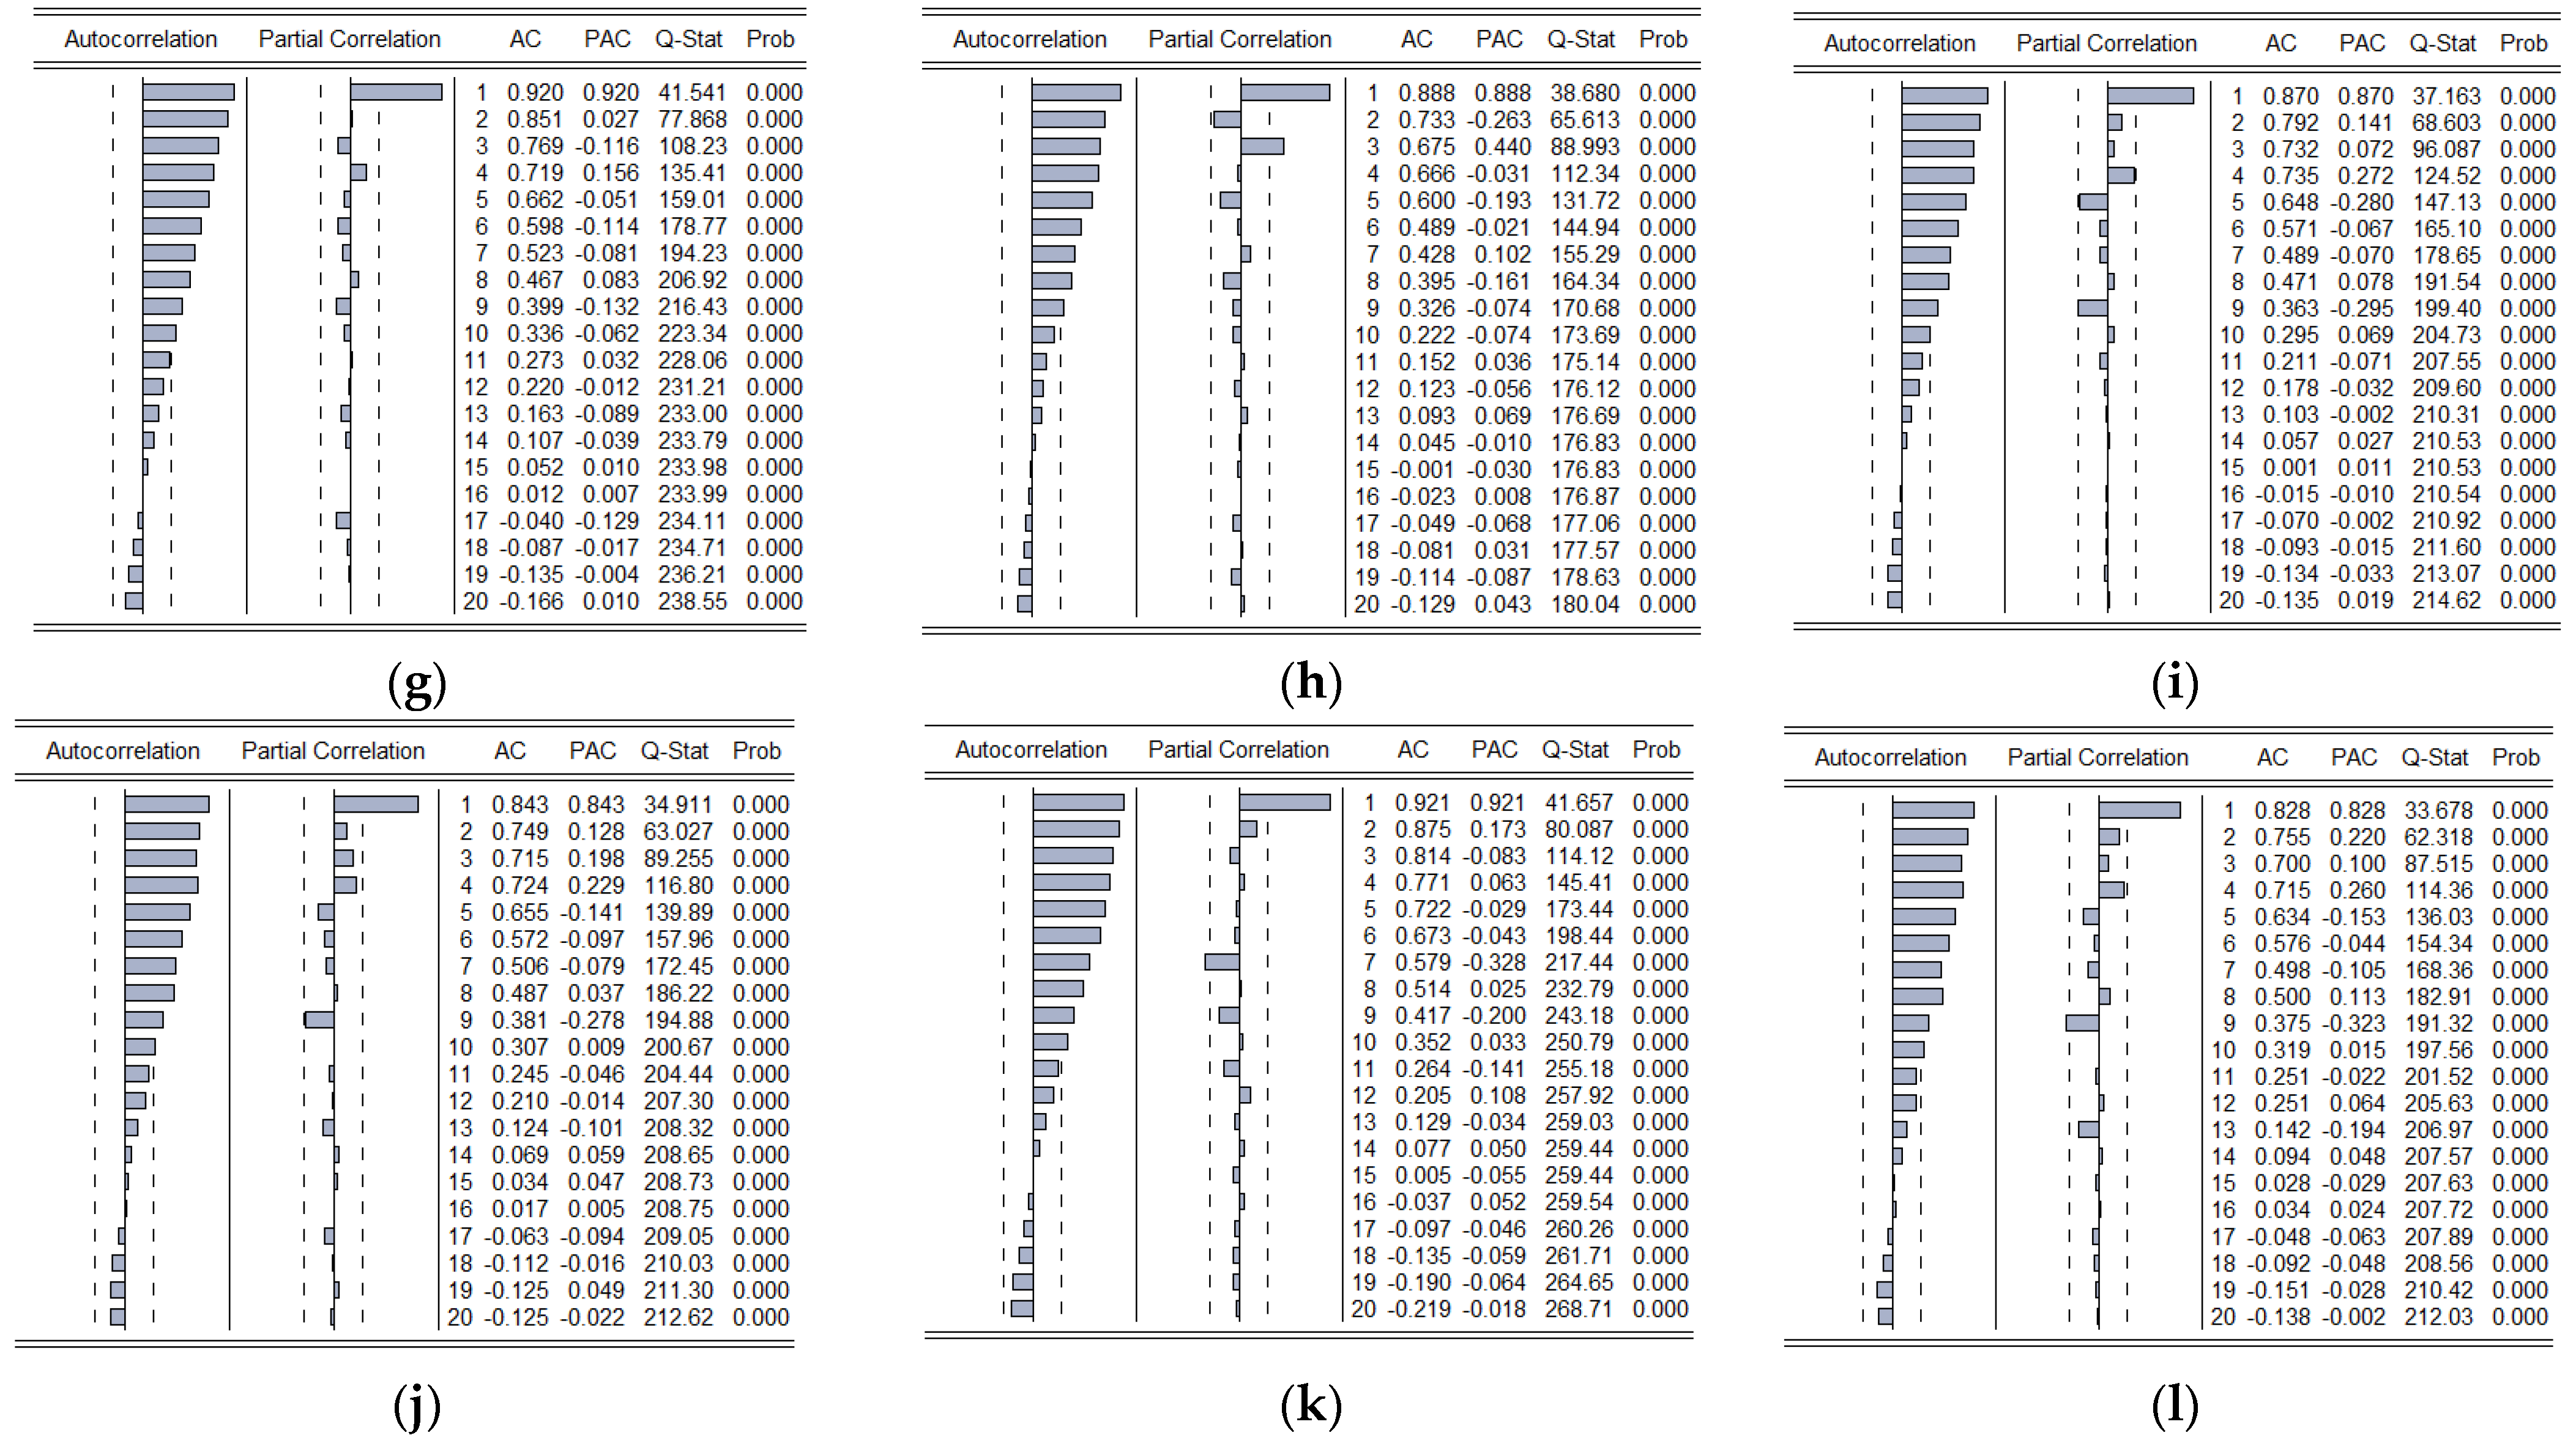
It is developing the model that meets all the defined conditions of the study. The results of the evaluation of the autocorrelation (ACF) and partial autocorrelation (PACF) functions were the basis for determining the degree of integration (a), the value of the order of the autoregression operators (n), and the moving average (m);
2.
Assessment of model parameters using regression analysis (least squares method, maximum likelihood);
3.
Verification of the developed forecasting model (estimation of model residues δ t ) for adequacy;
4.
Developing forecasting scenarios using the formed ARIMA model.
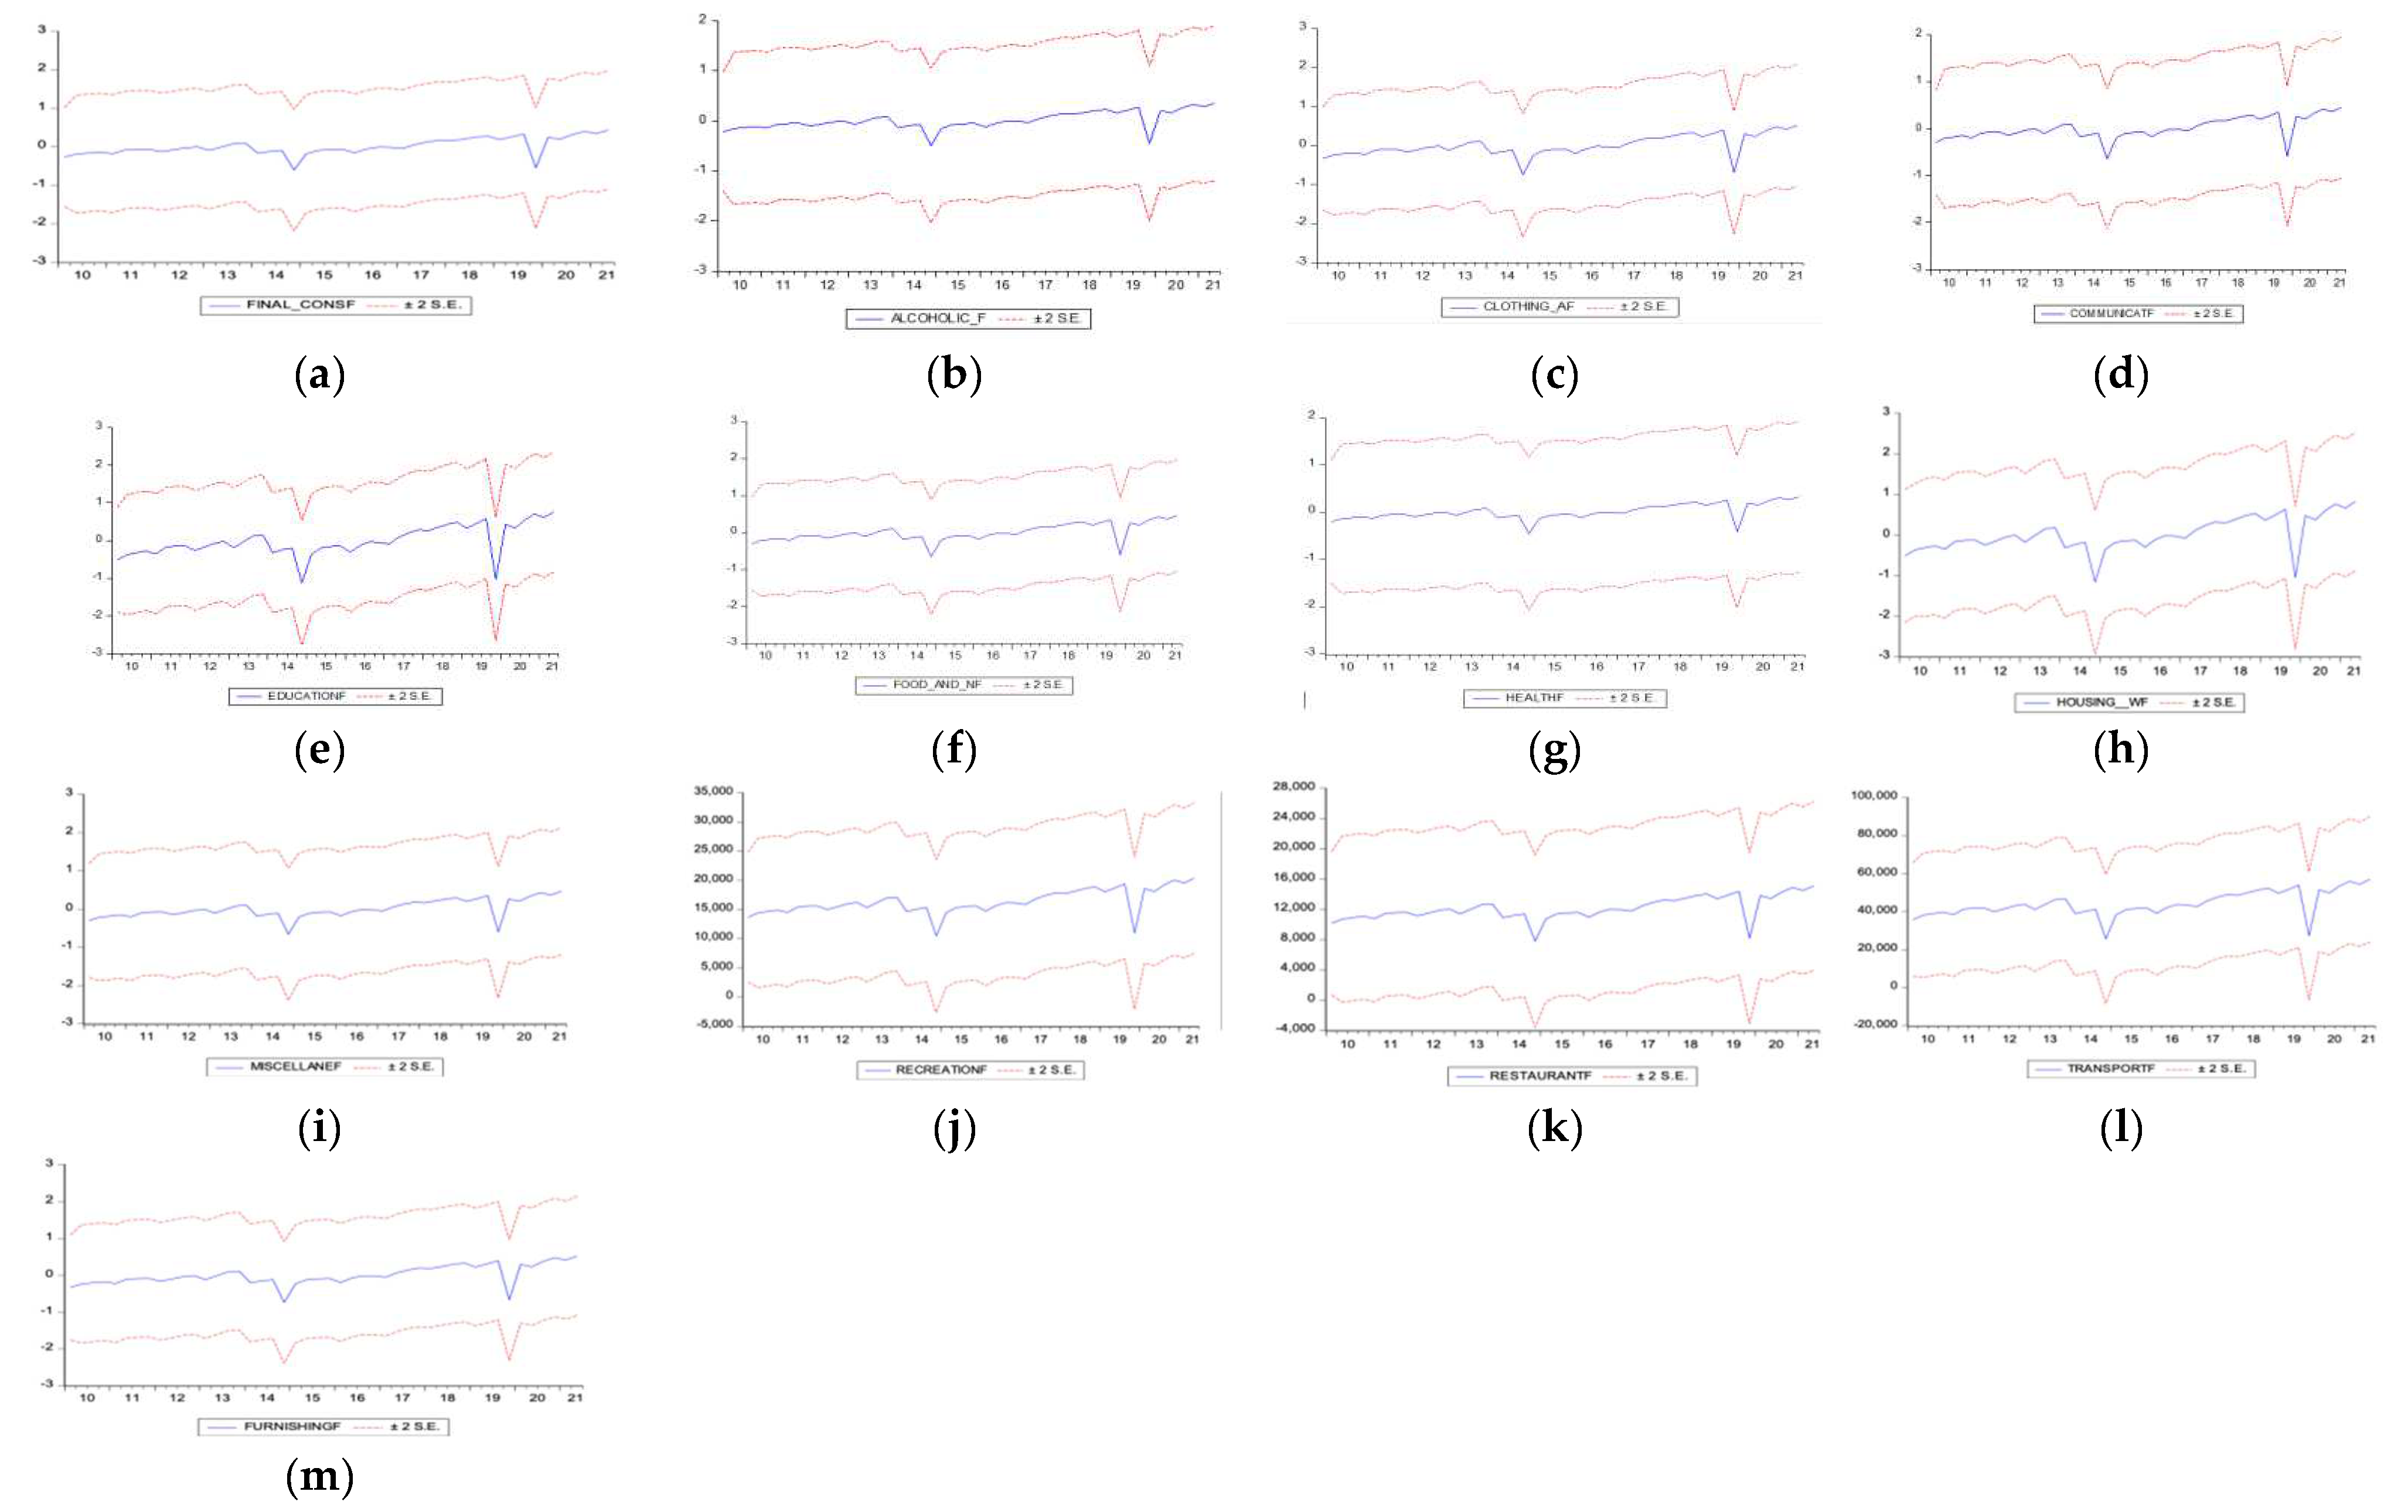
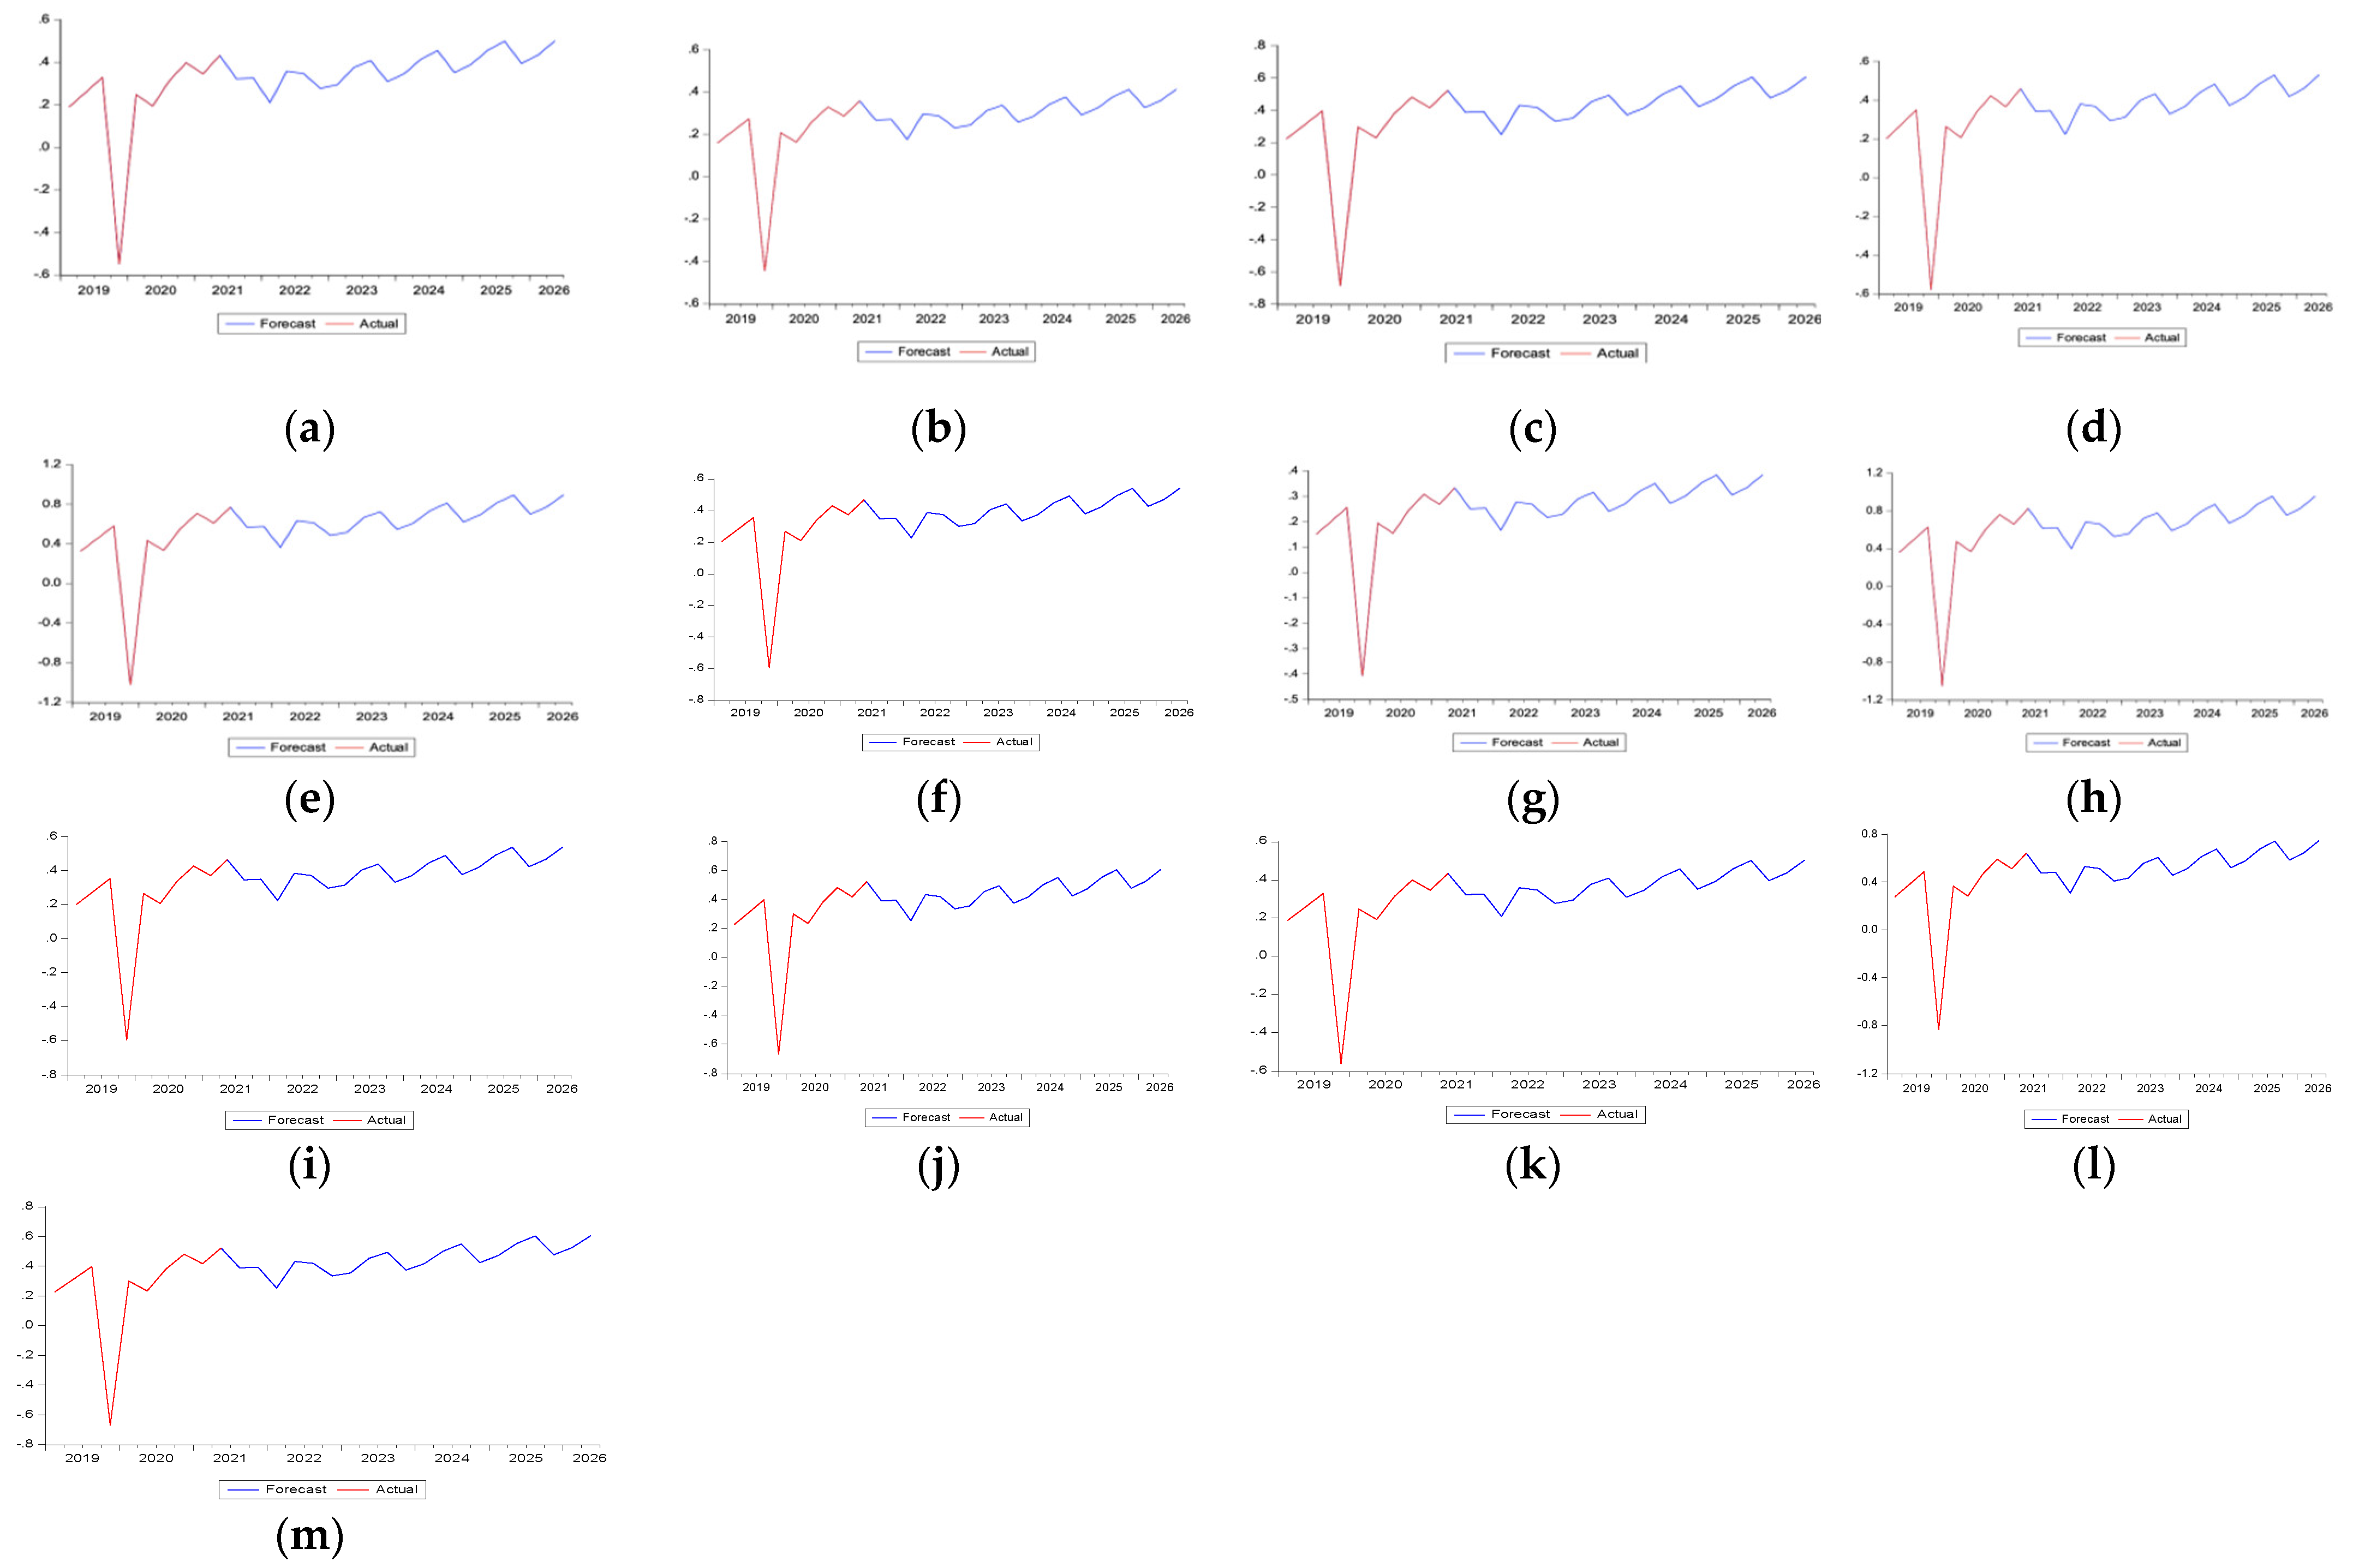
The autoregressive research model for forecasting final consumption (for each of the categories) of households could be written as follows.
ln F C i , t = c + φ ln FC i ,   t 1 + β o P R t + β 1 P R t 1 + ε t
F C i , t denotes the final consumption in period t (i-th category of household consumption), P R denotes migrants remittances, ε t denotes standard error; and φ and β denote the searching parameters.
The operational decisions at the macrolevel and microlevel require the qualitative forecasting of the relevant indicators without a detailed analysis of the vast range of factors. It was because collecting data for developing a multifactor regression model could require a lot of time and resources that do not match the desired result. In addition, the necessary conditions are the available time horizon of the data and their periodicity of measurement. In this case, the ARIMA model is the most appropriate forecasting method based on the time series. The ARIMA model enables a decline in forecasting error compared to standard multifactor regression models. Under this investigation, the dependent variable was final consumption in period t (i-th category of household consumption) and independent variable—migrants remittances. One theoretical limitation of using the ARIMA model is that time series should be stationary. Thus, the Dickey–Fuller Test Unit Root is a necessary procedure for checking time series for stationarity.
A correlogram chart was constructed to test the time series for stationarity, and the Dickey–Fuller Test Unit Root test was applied. The operator of successive differences is used to convert the time series from non-stationary to stationary.
The data were formed from the World Bank, the Ministry of Finance of Ukraine, and the State Statistics Service. The study period was from 2010 to the second quarter of 2021. The systematisation of variables and sources of information is presented in Table 1.
Table 2 contains the findings of descriptive statistics of the variables. For the calculation, Stata and EViews were used.
According to the results for 2010–2021 years, on average, the lowest amount of household expenditure was spent on education 5246.7 million USD, and the most significant 170,075.7 million USD was spent for food. It should be noted that household spending on health during the pandemic is gradually increasing, and expenditure on restaurants and hotels travel is declining.
The coefficient of variation was higher than 10% (Table 3); this means that the group is scattered and heterogeneous. It allowed the confirmation of rapid changes in the data—household spending. Thus, the value of variation coefficient is shown in Table 3.
Thus, the findings confirmed that household expenditure declined due the COVID-19. It allowed the confirmation of H1.

4. Results

Considering the mentioned above methodology, the first step is stationarity checking the data using the ADF-test. Table 4 and Figure A1 (Appendix A) showed the findings of checking the data stationarity for the model (2).
The findings (Table 4) of McKinnon τ-statistics of the time series of household expenditure on alcohol/tobacco (−0.87) and clothing/footwear (0.83) at the level are more than the absolute values of the critical level of 5%. It allows us to conclude that data are at the level and is non-stationary. The results of the Hannan–Rissanen procedure indicate the diverse nature of the process and the presence of a unit root in the time series and its non-stationarity. ACF decreases gradually from 0.904 for household expenditure on communication to a negative value after 16 lag, and household expenditure on education decreases from 0.871 to a negative value after 15 lag (Figure A1a). On the other hand, PACF is the maximum at the first level with values of 0.90 and 0.87, respectively, but has a fluctuating nature of lag changes, which does not correspond to the basic properties of ARMA processes.
The McKinnon τ-statistics of the Dickie–Fuller tests for the data series in the first differences are less than the absolute values of the critical level of 5%. It allows us to confirm that data are stationary for household expenditure on alcohol and tobacco (−10.6 z) and clothing/footwear (−3.55).
Choreography (Figure A1c,d) and results of ADF-testing of household expenditure on communication and education indicate the existence of a unit root in time series (Table 3). For the first differences of McKinnon’s τ-statistics (−10.60—household spending on communication; −3.55—household spending on education), the Dickie–Fuller tests are less than the absolute values of the critical level of 5% (−3.52 and −3.53, respectively). The household communication and education expenditure data are stationary in the first differences.
The ACF and PACF graphs (Figure A1c,d) show the fluctuating nature of lag changes in household food and furniture expenditure, which does not meet the essential characteristics of ARMA processes and is non-stationary. According to the Dickie–Fuller test, converting the time series into its first differences reduced the absolute value of McKinnon’s τ-statistics for household food expenditure from −0.57 to −8.91, for household furniture expenditure from −0.31 to −17.75, and test probability (p-value) up to 0.00. It indicates that the time series in the first differences is stationary.
The findings confirmed that, at those levels, the household expenditures on health and utility bills have an integration order of 1, and in the first, the differences are stationary. In particular, the McKinnon τ-statistics of the Dickey–Fuller tests in the first differences are less than the absolute values of the critical level of 5%.
It should be noted that findings indicate the unit root in the time series of household expenditure on other categories of goods/services and recreation/culture. For the series in the first differences of McKinnon’s τ-statistics (0.27—household expenditure on other categories of goods/services; −0.44—household expenditure on recreation/culture), Dicky–Fuller tests are less than the absolute values of the critical level of 5% (−3.53 for both types of expenditure). Thus, household expenditure on other goods/services and recreation/culture are stationary in the first differences.
Choreography and results of ADF-testing of household expenditure on restaurants/hotels and transport indicate the unit root in the time series. For the time series in the first differences of McKinnon’s τ-statistics (−2.71—household expenditure on restaurants/hotels; −3.05—household expenditure on transport), Dickie–Fuller tests are less than the absolute values of the critical level of 5% (−3.52 and −3.54, respectively). Thus, household expenditure on restaurants/hotels and transport is stationary in the first differences.
The next step is forecasting final consumption before and during the pandemic, and it was realised using the ARIMA model. The results of forecasting changes in final consumption are presented in Table 5 and Figure A2 and Figure A3 (Appendix B).
Thus, the findings in Table 5 allowed the confirmation of H2, in which the migrants’ remittances had the compensation mechanism from declining of household expenditure due to COVID-19.
At the next stage, the scenarios of the changes were developed for each category of households’ expenditure, considering the periods before the beginning and during COVID-19 (analysis of retrospective data from 2010 to the second quarter of 2021).
The systematisation of empirical results of forecasting (Table 5) of household expenditure until 2026 showed that due to changes in migrants’ remittances, household expenditure in all categories tended to increase. The forecasting findings allowed us to conclude that the household expenditure on transport had the most considerable growth due to the changing migrants’ remittances. A change in the standard deviation of migrants’ remittances by 1 point led to changes in the standard deviation of household expenditure by the following amounts:
  • Education—0.40;
  • Utility bills—0.40;
  • Transport—0.33;
  • Clothing and footwear—0.27;
  • Furniture—0.27;
  • Recreation and culture—0.27;
  • Food—0.24;
  • Other categories of goods and services—0.24;
  • Restaurants and hotels—0.23;
  • Communication—0.23;
  • Alcohol and tobacco products—0.18;
  • Health care—0.17.
The average coefficient of determination for the models is 60%. During 2022–2026, significant fluctuations in household expenditure are forecast for all categories.
It should be noted that according to the forecast, COVID-19 will provoke a change in the structure of household expenditure. Thus, Ukrainian consumers are characterised by pessimistic expectations about the country’s future economic development. Because of this, households direct their income to current needs and consumption, which makes it impossible to accumulate savings. At the same time, the increase in revenues from abroad allows the Ukrainians to increase spending on education (0.40), travel and transport (0.33), as well as clothing and footwear (0.27). It reduces the growing demand for more expensive goods, including durables, travel, restaurants and hotels, real estate, and more.

5. Discussion and Conclusions

Thus, the forecasting findings confirmed that COVID-19 provokes the changes in the migrants’ remittances. Consequently, it leads to changes in the structure of the households’ expenditure in Ukraine. Based on the findings [5,23,31,32], which justified that migrants’ remittances affect economic growth, it could be concluded that in the long-term perspective, COVID-19 could limit the economic growth of the country. Noting that the similar hypothesis that COVID-19 limits economic development was empirically justified in the studies [33]. At the same time, the findings confirmed the increase in households’ expenditure on education and utility bills. The share of expenditure on culture and restaurants declined, noting that similar results were obtained for the case of Britain, USA, and South Africa [45,47,48,49]. In addition, the vast range of investigations confirmed that small and medium enterprises felt the most significant suffering from COVID-19 [49]. In this case, it could be necessary to analyse COVID-19 in the business sector in Ukraine for further directions.
It was noted that the Ukrainian government implemented the mechanism for supporting households due to the pandemic and motivating vaccinations. Thus, the government-run program provided revenue for vaccinated people. This money could be spent on sport, culture (cinema, theatres, and concerts) and books. On one side, it motivates the Ukrainians to become vaccinated, and on another side, it supports the service and culture industry, which mostly suffered due to the pandemic. However, the experience of EU countries and USA showed that their government developed the program for supporting business sectors. Thus, it should be necessary to analyse the best practice and options to implement them in Ukrainian practice.

Author Contributions

Conceptualisation, L.Z., Y.C., O.L. and T.P.; methodology, L.Z., Y.C., O.L. and T.P.; formal analysis, L.Z., Y.C., O.L. and T.P.; investigation, L.Z., Y.C., O.L. and T.P.; writing—original draft preparation, L.Z., Y.C., O.L. and T.P.; writing—review and editing, L.Z., Y.C., O.L. and T.P.; visualisation, L.Z., Y.C., O.L. and T.P. All authors have read and agreed to the published version of the manuscript.

Funding

This research was funded by the grants from the Ministry of Education and Science of Ukraine: «Economic and mathematical modelling and forecasting, development of methodological and methodological principles of creating a roadmap for reforming the health care system in Ukraine taking into account behavioural, social, economic and legal determinants» (decree from 16 April 2021 No 434, Agreement BF/24-2021).

Institutional Review Board Statement

Not applicable.

Informed Consent Statement

Not applicable.

Data Availability Statement

Not applicable.

Acknowledgments

The authors are very grateful to the anonymous referees for their helpful comments and constructive suggestions.

Conflicts of Interest

The authors declare no conflict of interest.

Appendix A

Figure A1. The chorograms of ADF testing of all types of households’ expenditure. (a)—expenditure on alcoholic beverages, tobaccos, and narcotics; (b)—expenditure of households on clothing and footwear; (c)—expenditure of households on communication; (d)—expenditure of households on education; (e)—expenditure of households on food and non-alcoholic beverages; (f)—expenditure of households on furnishings, household equipment, and routine maintenance of the house; (g)—expenditure of households on health; (h)—expenditure of households on utility bills; (i)—expenditure of households on miscellaneous goods and services; (j)—expenditure of households on recreation and culture; (k)—expenditure of households on restaurants and hotels; (l)—expenditure of households on transport.
Sustainability 14 04361 g0a1aSustainability 14 04361 g0a1b

Appendix B

Figure A2. The graphs of the final consumption and households’ expenditure based on the assessment model by the types before and during COVID-19. (a)—final consumption; (b)—expenditure on alcoholic beverages, tobaccos, and narcotics; (c)—expenditure of households on clothing and footwear; (d)—expenditure of households on communication; (e)—expenditure of households on education; (f)—expenditure of households on food and non-alcoholic beverages; (g)—expenditure of households on health; (h)—expenditure of households on utility bills; (i)—expenditure of households on miscellaneous goods and services; (j)—expenditure of households on recreation and culture; (k)—expenditure of households on restaurants and hotels; (l)—expenditure of households on transport; (m)—expenditure of households on furnishings, household equipment, and routine maintenance of the house.
Sustainability 14 04361 g0a2
Figure A3. Forecasting graphs of the final consumption and households’ expenditure based on the assessment model by 2026. (a)—final consumption; (b)—expenditure on alcoholic beverages, tobaccos, and narcotics; (c)—expenditure of households on clothing and footwear; (d)—expenditure of households on communication; (e)—expenditure of households on education; (f)—expenditure of households on food and non-alcoholic beverages; (g)—expenditure of households on health; (h)—expenditure of households on utility bills; (i)—expenditure of households on miscellaneous goods and services; (j)—expenditure of households on recreation and culture; (k)—expenditure of households on restaurants and hotels; (l)—expenditure of households on transport; (m)—expenditure of households on furnishings, household equipment, and routine maintenance of the house.
Sustainability 14 04361 g0a3

References

  1. Plaza, S.; Ratha, D.; De, S.; Kim, E.J.; Seshan, G.; Yameogo, N.D. Migration and Remittances: Recent Developments and OutLook. Migration and Development Brief; World Bank: Washington, DC, USA, 2019; Volume 31. [Google Scholar]
  2. Bisong, A.; Ahairwe, P.E.; Njoroge, E. The Impact of COVID-19 on Remittances for Development in Africa. Maastricht: European Centre for Development Policy Management. Available online: https://ecdpm.org/wp-content/uploads/Impact-COVID-19-remittances-development-Africa-ECDPM-discussion-paper-269-May-2020.pdf (accessed on 13 January 2022).
  3. Money Transfers to Ukraine. Available online: https://index.minfin.com.ua/ua/economy/transfer/2021/ (accessed on 13 January 2022).
  4. Foreign Direct Investment. Available online: https://index.minfin.com.ua/ua/economy/fdi/2020/ (accessed on 13 January 2022).
  5. Bardy, R.; Rubens, A.; Eberle, P. Soft Skills and Job Opportunities of Migrants: Systemic Relationships in the Labor Market. Bus. Ethic Leadersh. 2017, 1, 5–21. [Google Scholar] [CrossRef] [Green Version]
  6. Butkus, M.; Maciulyte-Sniukiene, A.; Matuzeviciute, K.; Davidaviciene, V. Society’s attitudes towards impact of immigration: Case of EU countries. Mark. Manag. Innov. 2018, 1, 338–352. [Google Scholar] [CrossRef]
  7. Pudryk, D.; Legenkyi, M.; Alioshkina, L. Innovation development and migration: Panel data approach. Mark. Manag. Innov. 2021, 1, 336–347. [Google Scholar] [CrossRef]
  8. Borella, C.A. Fake News, Immigration, and Opinion Polarisation. SocioEcon. Chall. 2017, 1, 59–72. [Google Scholar] [CrossRef] [Green Version]
  9. Sina, I.; Sannikova, A.; Sajjad, F. Brand of European Higher Education Institution as a Key Factor for Foreign Students. Mark. Manag. Innov. 2020, 3, 181–194. [Google Scholar] [CrossRef]
  10. Vorontsova, A.; Mayboroda, T.; Lieonov, H. Innovation management in education: Impact on socio-labour relations in the national economy. Mark. Manag. Innov. 2020, 3, 346–357. [Google Scholar] [CrossRef]
  11. Khomenko, L.; Saher, L.; Polcyn, J. Analysis of The Marketing Activities In The Blood Service: Bibliometric Analysis. Health Econ. Manag. Rev. 2020, 1, 20–36. [Google Scholar] [CrossRef]
  12. Ahmed, S.K.; Khan, M.M.; Khan, R.A.; Mujtaba, B.G. The Relationship Between Social Capital and Psychological Well-Being: The Mediating Role of Internet Marketing. Mark. Manag. Innov. 2020, 1, 40–53. [Google Scholar] [CrossRef]
  13. Didenko, I.; Volik, K.; Vasylieva, T.; Lyeonov, S.; Antoniuk, N. Migration, environment, and country safety: Analysis of touchpoints. In Proceedings of the 5th International Conference on Energy, Environmental and Information System (ICENIS 2020), Kota Semarang, Indonesia, 12–13 August 2020; Volume 202, p. 03028. [Google Scholar] [CrossRef]
  14. Chowdhury, A.; Fiscal, M. Policy and Forecasting Real GDP. Financial Mark. Inst. Risks 2021, 5, 5–13. [Google Scholar] [CrossRef]
  15. Bondarenko, A.; Zakharkina, L.; Syhyda, L.; Saher, L. The Economic and Marketing Attractiveness of Countries: Measurement and Positioning in Terms of Economic Security. Int. J. Sustain. Dev. Plan. 2020, 15, 439–449. [Google Scholar] [CrossRef]
  16. Kuzmenko, O.V.; Smiianov, V.A.; Rudenko, L.A.; Kashcha, M.O.; Vasilyeva, T.A.; Kolomiiets, S.V.; Antoniuk, N.A. Impact of Vaccination on the COVID-19 Pandemic: Bibliometric Analysis and Cross Country Forecasting by Fourier Series. Wiadomości Lek. 2021, 74, 2359–2367. [Google Scholar] [CrossRef]
  17. Poghosyan, K.; Tovmasyan, G. Modelling and Forecasting Domestic Tourism. Case Study from Armenia. Socioecon. Chall. 2021, 5, 96–110. [Google Scholar] [CrossRef]
  18. Kostetskyi, P. Does Digitalization Lead to Better Transparency: Bibliometric Approach. Bus. Ethic Leadersh. 2021, 5, 102–107. [Google Scholar] [CrossRef]
  19. Meyer, D.; Shera, A. The impact of remittances on economic growth: An econometric model. EconomiA 2017, 18, 147–155. [Google Scholar] [CrossRef] [Green Version]
  20. World Development Indicators. Available online: https://databank.worldbank.org/reports.aspx?source=2&series=NY.GDP.MKTP.CD&country=# (accessed on 15 January 2022).
  21. Olusuyi, A.E.; Adedayo, A.O.; Agbolade, G.B.; Ebun, A.F. Dynamic impact of remittance on economic growth in Nigeria. J. Account. Financ. Manag. 2017, 3, 26–38. [Google Scholar]
  22. Nwaogu, U.G.; Ryan, M.J. FDI, Foreign Aid, Remittance and Economic Growth in Developing Countries. Rev. Dev. Econ. 2015, 19, 100–115. [Google Scholar] [CrossRef]
  23. Benhamou, Z.A.; Cassin, L. The impact of remittances on savings, capital and economic growth in small emerging countries. Econ. Model. 2021, 94, 789–803. [Google Scholar] [CrossRef]
  24. Sotnyk, I.; Shvets, I.; Momotiuk, L.; Chortok, Y.; Donetsk National Technical University (Ukraine); National Academy of Statistics, Accounting and Auditing. Management of renewable energy innovative development in Ukrainian households: Problems of financial support. Mark. Manag. Innov. 2018, 4, 150–160. [Google Scholar] [CrossRef]
  25. El Amri, A.; Boutti, R.; Oulfarsi, S.; Rodhain, F.; Bouzahir, B. Carbon financial markets underlying climate risk management, pricing and forecasting: Fundamental analysis. Financ. Mark. Inst. Risks 2020, 4, 31–44. [Google Scholar] [CrossRef]
  26. Dalevska, N.; Khobta, V.; Kwilinski, A.; Kravchenko, S. A model for estimating social and economic indicators of sustainable development. Entrep. Sustain. Issues 2019, 6, 1839–1860. [Google Scholar] [CrossRef]
  27. Kwilinski, A.; Tkachenko, V.; Kuzior, A. Transparent Cognitive Technologies to Ensure Sustainable Society Development. J. Secur. Sustain. Issues 2019, 9, 561–570. [Google Scholar] [CrossRef]
  28. Kharazishvili, Y.; Kwilinski, A.; Grishnova, O.; Dzwigol, H. Social Safety of Society for Developing Countries to Meet Sustainable Development Standards: Indicators, Level, Strategic Benchmarks (with Calculations Based on the Case Study of Ukraine). Sustainability 2020, 12, 8953. [Google Scholar] [CrossRef]
  29. Arefieva, O.; Polous, O.; Arefiev, S.; Tytykalo, V.; Kwilinski, A. Managing sustainable development by human capital reproduction in the system of company’s organizational behavior. IOP Conf. Ser. Earth Environ. Sci. 2021, 628, 012039. [Google Scholar] [CrossRef]
  30. Banjara, S.; Karki, S.; Dumre, A. Assessment of remittance and its impacts on economic growth in Nepal. Arch. Agric. Environ. Sci. 2020, 5, 61–66. [Google Scholar] [CrossRef]
  31. Zobair, S.A.M.; Uddin, M. Nexus between foreign direct investment, foreign aid, foreign remittance and economic growth in Bangladesh: Analysis of association. IIUC Stud. 2021, 16, 77–98. [Google Scholar] [CrossRef]
  32. Lacheheb, Z.; Ismail, N.W. The Impact of Remittance on Economic Growth in Low and Middle Income Countries. Int. J. Acad. Res. Econ. Manag. Sci. 2020, 9, 61–70. [Google Scholar] [CrossRef]
  33. Caruso, G.D.; Cucagna, M.E.; Ladronis, J. The distributional impacts of the reduction in remittances in Central America in COVID-19 times. Res. Soc. Strat. Mobil. 2021, 71, 100567. [Google Scholar] [CrossRef]
  34. Chen, H.; Chand, S.S.; Singh, B. Impact of COVID-19 on Remittance Inflows to Samoa. Asian Econ. Lett. 2020, 1, 17894. [Google Scholar] [CrossRef]
  35. Chaudhary, A. COVID-19, Remittance Inflow, and Economic Growth Rate in Nepal. Tribhuvan Univ. J. 2020, 34, 69–80. [Google Scholar] [CrossRef]
  36. Smiianov, V.A.; Vasilyeva, T.A.; Chygryn, O.Y.; Rubanov, P.M.; Mayboroda, T.M. Socio-Economic Patterns of Labor Market Functioning in the Public Health: Challenges Connected with COVID-19. Wiadomości Lek. 2020, 73, 2181–2187. [Google Scholar] [CrossRef]
  37. Kuzmenko, O.; Vasylieva, T.; Vojtovič, S.; Chygryn, O.; Snieška, V. Why do regions differ in vulnerability to СOVID-19? Spatial nonlinear modeling of social and economic patterns. Econ. Sociol. 2020, 13, 318–340. [Google Scholar] [CrossRef]
  38. Vasilyeva, T.; Kuzmenko, O.; Kuryłowicz, M.; Letunovska, N. Neural network modeling of the economic and social development trajectory transformation due to quarantine restrictions during COVID-19. Econ. Sociol. 2021, 14, 313–330. [Google Scholar] [CrossRef] [PubMed]
  39. Tut, D. FinTech and the COVID-19 Pandemic: Evidence from Electronic Payment Systems. 2020, pp. 1–16. Available online: https://ssrn.com/abstract=3660987 (accessed on 10 January 2022). [CrossRef]
  40. Chong, T.T.L.; Li, X.; Yip, C. The impact of COVID-19 on ASEAN. Econ. Political Stud. 2020, 9, 166–185. [Google Scholar] [CrossRef]
  41. Canuto, O. The Impact of Coronavirus on the Global Economy. Available online: https://media.africaportal.org/documents/Impact_of_the_coronavirus_on_global_economy.pdf (accessed on 10 January 2022).
  42. Withers, M.; Henderson, S.; Shivakoti, R. International Migration, Remittances and COVID-19: Economic Implications and Policy Options for South Asia. J. Asian Public Policy 2021, 14, 1–16. [Google Scholar] [CrossRef]
  43. Islam, M.; Jannat, A.; Al Rafi, D.; Aruga, K. Potential Economic Impacts of the COVID-19 Pandemic on South Asian Economies: A Review. World 2020, 1, 283–299. [Google Scholar] [CrossRef]
  44. Aidi, W.; Karingi, S. Impact of the Covid-19 on Remittances and Economic Growth in Africa: Theoretical Framework and Em-pirical Evidences. Available online: https://www.gtap.agecon.purdue.edu/resources/res_display.asp?RecordID=6376 (accessed on 9 January 2022).
  45. Majumder, S.; Rahman, M.; Layla, F.; Abedin, M.Z. Forecasting the Impact of COVID-19 on Remittance Inflows in Selected South Asian Countries 2020. Available online: https://ssrn.com/abstract=3648937 (accessed on 9 January 2022). [CrossRef]
  46. Anoba, A.; Olaoluwa, A. Changes in Consumption During the COVID-19 Pandemic in Canada. Available online: https://137.122.9.185/bitstream/10393/42441/1/Abibat%20Anoba.pdf (accessed on 9 February 2022).
  47. Baker, S.R.; Farrokhnia, R.A.; Meyer, S.; Pagel, M.; Yannelis, C. How Does Household Spending Respond to an Epidemic? Consaumption during the 2020 COVID-19 Pandemic. Rev. Asset Pricing Stud. 2020, 10, 834–862. [Google Scholar] [CrossRef]
  48. Coffey, C.; Doorley, K.; O’Toole, C.; Roantree, B. The Effect of the COVID-19 Pandemic on Consumption and Indirect Tax in Ireland: (No. 2021/3) Budget Perspectives 2020; The Economic and Social Research Institute: Dublin, Ireland, 2020. [Google Scholar] [CrossRef]
  49. Chetty, R.; Friedman, J.N.; Hendren, N.; Stepner, M. How Did COVID-19 and Stabilisation Policies Affect Spending and Employment? A New Real-Time Economic Tracker Based on Private Sector Data; National Bureau of Economic Research: Cambridge, MA, USA, 2020; pp. 1–109. [Google Scholar]
  50. Krukov, Y.; Chernyagin, D. An Arima model for forecasting a values of network traffic. J. Inf. Technol. Comput. Syst. 2011, 2, 41–49. [Google Scholar]
  51. Us, Y.; Pimonenko, T.; Lyulyov, O. Energy efficiency profiles in developing the free-carbon economy: On the example of Ukraine and the V4 countries. Energy Policy J. 2020, 23, 49–66. [Google Scholar] [CrossRef]
Figure 1. Dynamics of migrants’ remittances to Ukraine and foreign direct investment, 2010–2021. Sources: compiled by the authors based on [3,4].
Sustainability 14 04361 g001
Figure 2. The structure of migrants’ remittances to Ukraine by country, 2013–2021. Note: circle—2014—is the start of the political conflict in Ukraine; circle—2018—free movement between Ukraine and EU countries. Sources: compiled by the authors based on [3].
Sustainability 14 04361 g002
Table 1. Variables and sources.
VariablesIndicatorsSources
Migrants’ remittancesPRMinistry of Finance of Ukraine
Final consumption expenditure of householdsFCThe World Bank
Expenditure on alcoholic beverages, tobaccos and narcoticsFC1State Statistics Service of Ukraine
Expenditure of households on clothing and footwearFC2
Expenditure of households on communicationFC3
Expenditure of households on educationFC4
Expenditure of households on food and non-alcoholic beveragesFC5
Expenditure of households on furnishings, household equipment and routine maintenance of the houseFC6
Expenditure of households on healthFC7
Expenditure of households on utility billsFC8
Expenditure of households on miscellaneous goods and servicesFC9
Expenditure of households on recreation and cultureFC10
Expenditure of households on restaurants and hotelsFC11
Expenditure of households on transportFC12
Table 2. The findings of descriptive statistics of the variables.
VariablesMeanMedianMaximumMinimumStd. Dev.SkewnessKurtosisJarque–BeraProbability
PR2100.61965.03453.0147.0701.1−0.33.51.30.5
FC427,770.3348,809.5910,471.0145,971.0225,236.60.72.14.90.1
FC131,752.725,151.568,409.09207.017,100.30.72.24.60.1
FC221,417.917,891.043,297.07712.010,032.80.62.14.50.1
FC311,751.09987.524,678.04337.05963.60.72.34.30.1
FC45246.74422.511,716.02651.02620.81.02.87.90.0
FC5170,075.7142,067.0362,975.053,926.093,410.60.62.04.70.1
FC616,682.013,768.536,217.05464.08251.70.72.34.30.1
FC723,534.219,042.555,601.06979.014,246.80.72.25.00.1
FC855,463.042,826.5149,726.022,638.032,844.01.23.512.10.0
FC919,426.115,766.041,317.07561.09394.00.82.45.20.1
FC1016,256.413,893.033,789.06044.07867.40.62.34.10.1
FC1112,085.89655.525,561.03896.06959.00.51.84.80.1
FC1244,078.937,769.084,456.012,837.020,105.90.52.13.40.2
Table 3. The findings of variation coefficient of the variables.
Type of ExpenditureVariation Coefficient, %Type of ExpenditureVariation Coefficient, %
FC114.06FC713.05
FC212.30FC819.24
FC313.54FC914.33
FC418.25FC1017.34
FC511.54FC1113.18
FC614.99FC1215.94
Table 4. The findings of stationarity checking using ADF-test.
VariablesLevelτ-stat.Sign. LevelProb.HypothesisConclusion
FC1at level4.18−2.931.00H0x
1st diff.−8.36−3.520.00Ha+
FC2at level−0.87−3.520.95H0x
1st diff.−10.60−3.520.00Ha+
FC3at level−0.87−3.520.95H0x
1st diff.−10.60−3.520.00Ha+
FC4at level0.83−3.531.00H0x
1st diff.−3.55−3.530.05Ha+
FC5at level−0.57−3.520.98H0x
1st diff.−8.91−3.520.00Ha+
FC6at level−0.31−3.520.99H0x
1st diff.−17.75−3.520.00Ha+
FC7at level0.23−3.521.00H0x
1st diff.−10.08−3.520.00Ha+
FC8at level0.64−3.521.00H0x
1st diff.−7.84−3.520.00Ha+
FC9at level0.27−3.531.00H0x
1st diff.−4.95−3.530.00Ha+
FC10at level−0.45−3.530.98H0x
1st diff.−4.76−3.530.00Ha+
FC11at level−2.71−3.510.24H0x
1st diff.−8.12−3.520.00Ha+
FC12at level−3.05−3.540.13H0x
1st diff.−4.48−3.530.01Ha+
Notes: H0—confirmation of the null hypothesis; Ha—confirmation of the alternative hypothesis; x —not stationary; + —stationary; τ-stat.—McKinnon’s τ-statistics; Sign. Level—critical test value at 5% significance level; Prob.—Probability. Source: calculated by the authors.
Table 5. The forecasting findings of final consumption and households’ expenditure before and during the pandemic.
VariableCoefficient
(1)(2)(3)(4)(5)(6)(7)(8)(9)(10)(11)(12)(13)
PR0.220.170.270.230.400.230.170.400.240.270.220.330.27
C0.010.010.000.01−0.010.010.01−0.010.010.010.010.000.01
MA(1)0.700.830.640.930.620.930.730.620.540.600.620.470.55
SIGMASQ0.340.300.360.250.370.250.340.370.450.420.390.460.42
R-squared0.660.700.630.740.620.740.650.620.540.570.610.530.57
Adjusted R-squared0.630.680.610.720.590.720.630.590.510.540.580.500.54
F-statistic26.7332.2024.0140.0422.9740.0425.9722.9716.4918.8321.5115.7818.66
Prob(F-statistic)0.000.000.000.000.000.000.000.000.000.000.000.000.00
Akaike info criterion1.941.822.002.002.031.911.962.382.222.152.072.242.15
Schwarz criterion2.101.982.202.002.192.072.122.542.382.312.232.402.31
Hannan-Quinn criteria.2.001.882.102.002.091.972.022.442.282.212.132.302.21
Durbin-Watson stat0.810.641.100.801.450.810.700.881.191.210.991.361.15
(1)—final consumption; (2)—expenditure on alcoholic beverages, tobaccos and narcotics; (3)—expenditure of households on clothing and footwear; (4)—expenditure of households on communication; (5)—expenditure of households on education; (6)—expenditure of households on food and non-alcoholic beverages; (7)—expenditure of households on health; (8)—expenditure of households on utility bills; (9)—expenditure of households on miscellaneous goods and services; (10)—expenditure of households on recreation and culture; (11)—expenditure of households on restaurants and hotels; (12)—expenditure of households on transport; (13)—expenditure of households on furnishings, household equipment and routine maintenance of the house. Source: calculated by the authors.
Publisher’s Note: MDPI stays neutral with regard to jurisdictional claims in published maps and institutional affiliations.

