Article

Study on the Effect of Amorphous Silica from Waste Granite Powder on the Strength Development of Cement-Treated Clay for Soft Ground Improvement

1
Department of Civil and Environmental Engineering, Hiroshima University, 1-4-1 Kagamiyama, Higashi Hiroshima, Hiroshima 739-8527, Japan
2
School of Science and Engineering, Kokushikan University, 4-28-1 Setagaya, Setagaya-Ku, Tokyo 154-8515, Japan
*
Author to whom correspondence should be addressed.
Sustainability 2022, 14(7), 4073; https://doi.org/10.3390/su14074073
Submission received: 9 March 2022 / Revised: 22 March 2022 / Accepted: 24 March 2022 / Published: 29 March 2022
(This article belongs to the Topic Solid Waste Management)

Abstract

:
Granite powder (stone powder), a waste product generated from stone quarries, is increasingly being reused in cement-treated clays. The particle size of stone powders affects the cement-clay reaction by either increasing or reducing the unconfined compressive strength (UCS). This study investigated this phenomenon by separating stone powder from the same batch at the quarry into five particle sizes (A, B, C, D and E: 106–75 µm, 40–75 µm, 20–40 µm, <20 µm and 106–<1 µm, respectively). Flow value, fall cone, UCS and thermogravimetry-differential thermal analysis (TG-DTA), X-ray fluorescence, electrical conductivity and NaOH digestion tests were conducted. It was discovered that stone powder had an amorphization rate of up to 1.45% (14.5 mg/g of amorphous silica); hence, it was pozzolanic. However, the amorphousness varied with the particle size of the material in the order of D > E > C > B > A, which translated into UCS variation in the same order. Stone powders D and E played two roles in UCS development, i.e., nucleation of cementitious products and reaction with Ca(OH)2 to increase the UCS higher than the control sample. Linear regression equations determined the minimum concentration of amorphous silica for a UCS increment as 9.4 mg/g.

1. Introduction

Large volumes of waste (stone powder) are generated at stone quarries from rocks during the production of crushed rock aggregates used in concrete production or for architectural ornaments. In Japan, India and the United States, the amounts of crushed rock aggregates produced per year are 390, 200 and 175 million tons, respectively [1,2,3]. In China, the demand for stone ornaments was 1.5 billion square meters in 2018, and it is still growing [4]. Of the total produced, 25% of the quarried rock comprises stone powder [2,5,6], which is often discarded in open ponds; this practice is environmentally unfriendly [7,8,9]. Korea produces about 7.5 million tons of stone powder annually [10], while about 4 billion tons of stone powder have accumulated in the United States [3]. Establishing a suitable use for stone powder in the geotechnical engineering industry will reduce the need for storage and mitigate the negative impacts of its disposal.
The particle size of stone powder and mineralogical origin of the parent rock, such as granite, limestone or basalt, determines its reusability in construction materials. For example, coarse sizes (>75 µm) are reused in concrete [10,11] or mortar [8] or sandcrete blocks [12], while fine sizes (<75 µm) are used as partial cement replacements [7,13,14] or included in roof tiles [15]. In these studies, either the durability [5,13] or the strength of concrete [10,11], mortar [8] or tiles [15] was enhanced. The construction industry’s carbon footprint can also be reduced by about 8.6% if stone powder is used in alkali-activated slag [14]. These studies clarify the benefits of using stone powder in the concrete or tile industry and the mechanisms resulting in these benefits. However, the differences in strength development in soils, concrete and tiles necessitate discussing the mechanisms essential for strength improvement in cement-treated clays.
Coarse stone powder is used in soil improvement to increase the soil’s maximum dry density, angle of friction, California Bearing Ratio, shear strength, unconfined compressive strength (UCS) and permeability coefficient. Stone powder also reduces the soil’s Atterberg limits, optimum moisture content, free swelling capacity and clay soil compressibility [2,16,17,18,19,20,21,22,23]. Due to its hydraulic characteristics, stone powder is used as a filter layer [24] or filling material to construct pavements [25]. These studies relied on only the physical, hydraulic and mechanical properties of stone powder to improve soils, with no use of chemical binders. In cases where significant cohesion of soils was lost due to stone powder addition, the shear or UCS was reduced [2,17,25]. This situation necessitates chemical binders such as cement to maintain cohesion. The use of stone powder in cement-treated clays reduces the amount of cement used and improves the UCS of composites [26], which is good for the environment and construction industry. The UCS increment in cement, clay and stone powder composites is attributed to calcium silicate hydrate (CSH) and calcium aluminate hydrate [2] grain gradation, cementation and the skeleton effect [9]. However, it is unclear whether stone powder contributed to the formation of these cementitious products. Our previous paper [26] investigated the role of the stone powder particle size in improving dredged clays, which are also waste materials. Even though the stone powder was from the same batch, when it was separated, the UCS of cement-treated clay varied with the stone powder particle size in the order of highest to lowest as follows: <20 µm, <1–106 µm, 20–40 µm, 40–75 µm. The specific surface area (SSA) of stone powder was also an influential factor, whereby the larger the SSA, the higher the UCS exhibited. Still, the SSA, similar to clay and cement, led to interference in the cement–clay reaction as observed in the microstructure, and hence reduced UCS. Additionally, the physical properties of cement-treated clay, such as the void ratio, liquid limit and density, were investigated but found not to significantly affect the UCS at a given stone powder and cement content. This is because the composites containing various stone powder sizes possessed similar properties at the same stone powder content. Yet, it is still not clear whether the chemical properties of stone powder also influence the UCS development of cement-treated clay–stone powder composites, which is the primary focus of this paper.
Granite stone powder reacts with Ca(OH)2 to form a CSH gel of Ca/Si ratio 0.6–1.0, which indicates its pozzolanic reactivity [27]. Moreover, grinding inert materials containing silica into finer particles leads to the formation of amorphous silica through mechanochemical structural changes in silica [28,29,30,31]. Since there is a critical particle size (9 µm) for quartz to turn into amorphous silica [28], stone powder from the same batch possesses a different pozzolanic reactivity [26]. As shown in Equation (1), a pozzolanic reaction involves amorphous silica consuming calcium hydroxide formed during cement hydration to form CSH, thus increasing the cement-treated clay strength. Therefore, it is necessary to investigate the concentrations of amorphous silica in stone powder and its effect on UCS.
Ca ( OH ) 2 + SiO 2 ( CaO ) ( SiO 2 ) ( H 2 O )
Understanding the mechanisms of UCS development should help inform geotechnical engineers of the effective reuse of waste stone powder for soil improvement, which improves the environmental sustainability of the construction industry. Therefore, the present study explained the mechanisms resulting in UCS differences in cement-treated clay containing stone powder of various particle sizes. Physical parameters—namely, the liquid limit and flow value of cement-treated clay, the chemical composition of stone powder (including its amorphous silica concentration), pozzolanic reactivity and particle size variation—were determined. Thermal parameters such as the chemically bound water and calcium hydroxide contents were also assessed to confirm the chemical reactions between cement-clay pastes and stone powder.

Estimation of Strength for Cement-Treated Soils

Studies to determine the strength of cement-treated soils have listed the water, cement and soil type as the factors determining the strength of cement-treated soil (Japan Cement Association, 2007; Horpibulsuk et al., 2011; Chian et al., 2016; Mitchell et al., 1974; Tang et al., 2001; Lorenzo and Bergado, 2004; Kida et al., 1977; Omine et al., 1998; Liu et al., 2008; Consoli et al., 2016; Tsuchida and Tang, 2015) [32]. Most studies consider the pore distribution as the cause of strength variation [32,33,34]. Yamashita et al. developed an equation based on the pore distribution of clay and various sand contents and concluded that the sand content has no relationship with UCS [32]. Contrary to these findings, at the same water-to-cement ratio, the strength of cement-treated clay with various stone powder particle sizes varied in further research [26], which necessitates an investigation into the chemical properties of stone powder.

2. Materials and Methods

2.1. Materials

The materials used for sample preparation were stone powder obtained from granite rocks located in the Chugoku region of Japan, ordinary Portland cement, Tokuyama Port clay, commercial clay, micro mica (MK300, Co-op Chemical Japan, Tokyo, Japan) and distilled water. The physical compositions of these materials are described in the present section, while the chemical compositions are discussed in Section 2.4.4.

2.1.1. Tokuyama Clay

This study’s clay mineral was Tokuyama clay, dredged from Tokuyama Port in the Yamaguchi Prefecture, Japan. This marine clay was chosen because it is waste material and due to its wide use in research [26,32,35,36,37,38] in Japan; therefore, there are lots of data for reference. The dredged marine clay of Tokuyama Port is odorless and has a dark-greenish color. It exhibited a liquid limit of 93.2%, plastic limit of 45.7% and plasticity index of 47.5%. According to the JGS 0131 system of classifying fine-grained soils, this marine-dredged clay is classified as high-plasticity clay. The soft clay’s natural water content is 125–127% [38], which is higher than its liquid limit. Due to the high natural water content, the cement-treated clay samples’ water content had to be estimated using the liquid limit. The soft ’clay’s specific gravity was 2.68 g/cm3 and it exhibited a particle size range of <1 to 75 µm, with a median-diameter (D50) of 12 µm.

2.1.2. Commercial Clay

The commercial clay was dry with a moisture content of 0%. It exhibited a liquid limit of 32.16%, plastic limit of 25.91% and plasticity index of 6.26%. The clay’s specific gravity was 2.66 g/cm3, and it exhibited a particle size range of <1 to 75 µm, with a median-diameter (D50) of 15 µm. According to the JGS 0131 system of classifying fine-grained soils, this clay is classified as a low-plasticity clay.

2.1.3. Stone Powder

The stone powder used in this research comprised five types (A, B, C, D and E), obtained by wet-sieving the granite stone powder (Type E) from the nearby quarry, as explained in Section 2.2.
The stone powder received from the quarry is referred to as Type E (<1 to 106 µm). The stone powder was non-plastic with a specific gravity of 2.69 g/cm3 and a loss on ignition at 1000 °C of 0.89%. It was a fine-grained material with maximum and minimum particle sizes of 106 µm and <1 µm, respectively, and a D50 of 28 µm.
Type A stone powder was a non-plastic material, where 100% of the particles were larger in diameter than 75 µm but smaller than 250 µm. Its D50 was 75 µm and its specific gravity was 2.63 g/cm3.
Type B stone powder was a non-plastic material with a specific density of 2.62 g/cm3 and a loss on ignition at 1000 °C of 1.01%. Its particle size ranged from 40 to 75 µm, making it a typical silt, with a D50 of 49 µm.
Type C stone powder was also non-plastic with a specific density of 2.62 g/cm3 and a loss on ignition at 1000 °C of 1.27%. Its particle size ranged from 20 to 40 µm, making it a typical silt, with a D50 of 32 µm.
Type D stone powder was a fine powder with a liquid limit of 38.6%, plastic limit of 28.9% and plasticity index of 9.85%. Its particle size ranged from <1 to 20 µm, with a D50 of 9 µm; 67% of the particles were silt, while 33% were clay-sized particles, as determined by JGS 0131 [39]. The specific density was 2.62 g/cm3 and the loss on ignition at 1000 °C was 1.96%.

2.1.4. Micro Mica

Micro mica (MK 300), a non-swelling synthetic mica obtained from Co-op Chemical Japan, was used as a reference inert material with physical properties similar to those of natural mica and mean particle diameter similar to that of Type D stone powder. Its particle size ranged from 1 to 75 µm with a D50 of 14 µm and a specific density of 2.7 g/cm3. The major elemental composition was as follows: silicon 58.3%, magnesium 26.3%, fluorine 10.1% and potassium 9.0%. Micro mica exhibited a liquid limit of 43.99%, plastic limit of 39.66% and plasticity index of 4.34%.

2.1.5. Portland Cement

The Portland cement used in this research had a specific gravity of 3.14 g/cm3. The cement exhibited a D50 of 19 µm and 98% of its particles were finer than 75 µm.

2.2. Stone Powder Separation

Stone powder Type E, as received from a nearby quarry, was separated by wet-sieving through 75 µm, 40 µm and 20 µm sieves to retain materials on the respective sieves, as well as those finer than 20 µm. This process resulted in four size classes in addition to category E (containing the full size spectrum): A (>75 µm), B (40–75 µm), C (20–40 µm) and D (<20 µm).

2.3. Preparation of Cement-Treated Clay Composites

To simulate a deep mixing method, the stone powder or micro mica was mixed with cement and refrigerated in distilled water for 10 min; the result was mixed with refrigerated Tokuyama or commercial clay for 30 min [26]. A control sample containing clay, cement and water was also prepared for reference purposes. The compositions of the composites are shown in Table 1 and Table 2, where Case 1 and Case 1c represent Tokuyama and commercial clay, respectively. In the equations below, C* is the cement content of the dry mass of clay, while C is the cement content of the combined dry mass of clay and stone powder or micro mica. SP is the sand content, M is the micro mica content and ρ is the density of the composite. The water content of the samples was 1.5 times the liquid limit (LL) of Tokuyama or commercial clay mixed with stone powder. C*, C, SP, M and W were determined according to Equations (2)–(5). m cement , m clay   , m stone   powder and m   micro   mica are the masses (kg) of cement, Tokuyama or commercial clay, stone powder and micro mica, respectively.
C * = m cement m cement + m clay × 100   %
C = m cement m cement + m clay + m stone   powder   or   micro   mica × 100   %
S P = m stone   powder m stone   powder + m clay × 100   %
M = m micro   mica m micro   mica + m clay × 100   %
The freshly mixed composites were subjected to flow value tests and UCS tests after 1, 3, 7 and 28 days of curing. The UCS test samples were poured into Ø 50 mm × H 100 mm summit molds, lightly tapped, wrapped with polyethylene and submerged in distilled water at 20 °C for curing.

2.4. Physical, Mechanical, Chemical and Thermal Tests

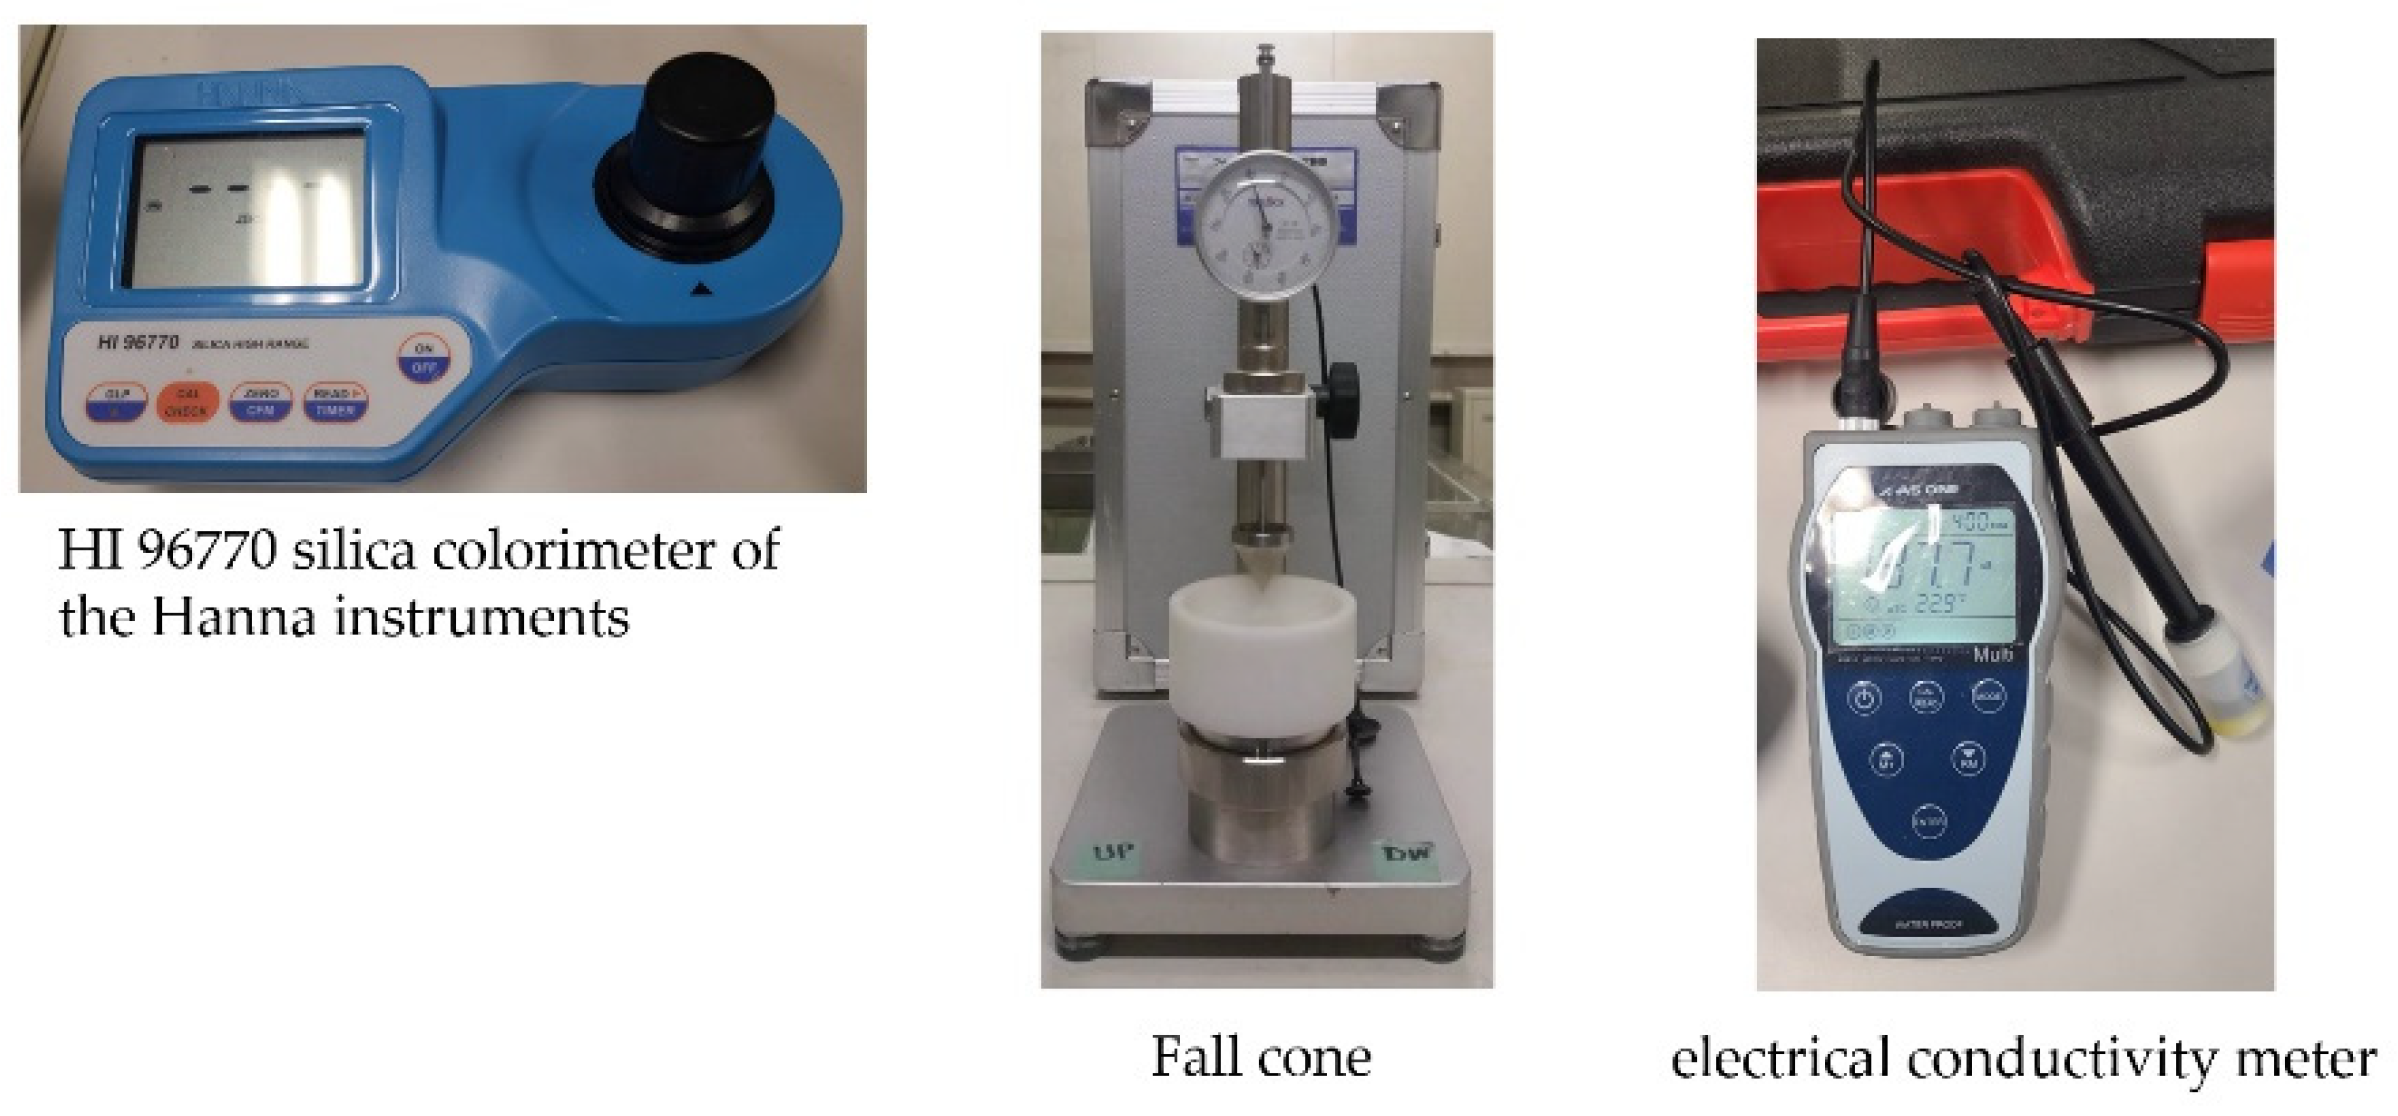
2.4.1. Flow Value Test

The flow value tests were conducted using a cylinder of dimensions Ø 80 mm × H 80 mm according to methods described by Arlyn et al. [37]. The cylinder was filled with the cement-treated clay and was then raised vertically to allow the clay to flow out freely. The diameter of the flowed treated clay, corresponding to the cement-treated clay’s flow value, was measured after one minute.

2.4.2. Fall Cone Test

According to the Japan standard, fall cone tests were performed for both cement-treated and untreated samples (JGS 0142-2009) [40] using the apparatus shown in Figure A1. The penetration depth adopted to determine the LL was 11.5 mm. Untreated samples were prepared by mixing stone powder (SP) = 30% with Tokuyama clay. Cement-treated samples were then prepared by adding cement (C*) = 15% to the samples, to determine the water content. A control sample of Tokuyama clay that neither contained cement nor stone powder was also measured.

2.4.3. Unconfined Compression Strength Test

Samples cured for 1, 3, 7 and 28 days were subjected to UCS tests at a constant strain rate of 1 mm per minute as set out by JGS 0511 [41]. Three samples were tested for each curing time and the results were accepted if the standard deviation between three specimens with the same mix proportion did not exceed 10% of the mean strength.

2.4.4. Chemical Element Composition

The materials’ elemental compositions were determined by XRF analysis of materials pulverized to particle sizes < 75 µm. The investigation was conducted using the fundamental parameter analytical method on a Shimadzu EDX-700 machine manufactured by Shimadzu Corporation, Kyoto, Japan.

2.4.5. Pozzolanic Reactivity Determination

The pozzolanic activity of materials was determined chemically using electrical conductivity (EC) analysis on 5 g of material soaked in 200 mL of a saturated calcium hydroxide aqueous solution at 40 °C for 2 min. A material was determined to possess pozzolanic reactivity if the EC change was ≥0.4 mS/cm [42,43,44,45]. Although this is an indirect method for measuring pozzolanic reactivity, it has been popularly used [42,43,44,45] and was chosen for its rapid nature, availability and ease of operation. Its robustness was checked by the direct method of TG-DTA. The electrical conductivity meter is shown in Figure A1.

2.4.6. Amorphous Silica Concentration Measurement via NaOH Digestion

NaOH can extract amorphous silica as well as crystalline silica loosely bound to Al and Fe [46] but shows a poor capability to leach crystalline mineral silicates [47]. Therefore, it was chosen for this analysis. In our work, 100 mg of materials were digested in 100 mL of 0.5 M NaOH through constant heating at 85 °C and shaking over 2 h. The resultant solution was filtered through a 0.22 µm syringe Millipore filter paper manufactured by Merck Millipore, Burlington, MA, USA. The filtrate was subjected to automated molybdate blue determination using a HI 96770 silica colorimeter of Hanna Instruments, USA as is shown in Figure A1. The results were based on an average of two replicate samples. However, the accuracy could not be guaranteed because there was no standard for estimating amorphous silica for soils and stone powder [46].
Amorphous silica extracted from stone powder was in solution form, and therefore, the units reported were mg/L. We used Equation (6) to convert the amorphous silica concentration from mg/L to the mg/g of materials. Subsequently, the rate of amorphization and an equivalent fraction present in 1 m3 of cement-treated clay–stone powder or micro mica were calculated using Equations (7)–(9), respectively.
SiO 2   ( mg / g ) = SiO 2 ( mg / L ) ×   V   ( L ) mass of material   ( g )
Here V = volume of NaOH solution
rate of amorphization = SiO 2 ( mg / g )   1000 ( mg ) × 100   [ % ]
concentration of amorphous silica   ( kg / m 3 ) = SiO 2   ( mg / g ) × m stone powder   ( kg / m 3 )   1000
m stone   powder   ( kg / m 3 ) = S P 1 S P × V { 1.5 LL ( 1 + S P 1 S P ) 1000 ρ w   + [ C * 1 C * × 1 1000 ρ c ] + [ S P 1 S P × 1 1000 ρ s p ] + 1 1000 ρ c l a y }
where m stone   powder   is the mass of stone powder per 1 m3 of cement-treated clay, V = 1 m3 (volume of cement-treated clay) and LL is the liquid limit of Tokuyama clay mixed with stone powder, respectively. SP and C* are the stone powder and cement contents, respectively. ρ w   , ρ c , ρ s p and ρ c l a y are the specific densities of water, cement, stone powder and Tokuyama clay, respectively.

2.4.7. TG-DTA

TG-DTA was conducted on cases 1 and 3, cured for 1, 3, 7 and 28 days using the Shimadzu DTG-60H (Shimadzu Corporation, Kyoto, Japan). The samples were analyzed for their chemically bound water and calcium hydroxide contents. In our work, 10 mm cubes were cut from the core of samples after the UCS test and immediately stored in acetone to stop further chemical reaction for more than 24 h. The cubes were then dried in a vacuum desiccator for 24 h and crushed with a ball mill into fine powder with a maximum particle size of 150 mm. Samples of 50 mg were considered representative [48] and were subjected to the TG-DTA test. Each sample was heated from room temperature to 100 °C at 10 °C/min, kept at 100 °C for 30 min and then heated to 1000 °C at 10 °C/min. The chemically bound water was calculated using Equation (10) while the calcium hydroxide content was calculated using Equations (11) and (12). In all ten calculations, the losses of clay and stone powder were compensated for by subtracting their corresponding values as shown in Equations (S1), (S8) and (S9) (refer to Data Availability Statement).
Chemically bound water = m 0     ( T G   v a l u e ) m 105     ( T G   v a l u e ) m 0     ( T G   v a l u e ) × 100   [ % ]
Calcium hydroxide , Ca ( OH ) 2 ,   in sample ,   C H S P = total   Ca ( OH ) 2 m 0     ( T G   v a l u e ) × 100   [ % ]
Calcium hydroxide , Ca ( OH ) 2 ,   content = C H S P cement content ,   c × 100   [ % ]

3. Results and Discussion

3.1. Liquid Limit and Flow Value

The water content of soil affects the mixing characteristics of cement-treated soil, thereby influencing its strength. In extreme conditions of high water contents, a high after-curing void ratio occurs, while in extreme conditions of low water contents, uneven mixing occurs. Lorenzo et al. confirmed the existence of an optimum moisture content for mixing clay: about 1.10 times base clay’s LL [49]. However, the addition of cement to cement-treated clay leads to an increase in the LL of the clay. Therefore, the LL of cement-treated soils should be considered [35].
In this study, each cement-treated clay–stone powder composite’s LL was determined in relation to the UCS variation with particle size. As seen in the results reported by Kang et al. [35], the cement-treated samples in the present experiment showed higher normalized LL values than untreated samples. The normalized LL values of the cement-treated samples for cases 1, 2, 3, 4, 5 and 6 were 1.29, 1.07, 1.06, 1.14, 1.08 and 0.99, respectively. Meanwhile, the untreated samples showed normalized LL values of 1.00 for Tokuyama clay but 0.84, 0.87, 0.91, 0.94 and 0.84 for Tokuyama clay containing 30% of stone powder types A, B, C, D and E, respectively. In addition, the LL of Tokuyama clay decreased with increasing particle diameter (D50). These reductions were 5.40%, 8.09%, 11.72%, 14.64% and 14.7% for stone powder types A, B, C, D and E, respectively. This behavior was due to a reduction in the proportion of clay-size particles (<5 µm) governing the LL as the particle size of stone powder increased. Polidori et al. reported that the LL and the plastic limit were linearly related to the clay content of the soil [50]. The relationship between normalized LL and D50 for both untreated and cement-treated clay is shown in Equations (13) and (14).
LLSP = 0%, 30%/LLSP = 0%, C* = 0% = −0.0019D50 + 0.9654, R2 = 0.5688 (untreated clay, C* = 0%)
LLSP = 0%, 30%/LLSP = 0%, C* = 0% = −0.0026D50 + 1.1952, R2 = 0.4140 (treated clay, C* = 15%)
There was no significant flow of the cement-treated clay–stone powder composites. The flow values were 82 mm and 83 mm for the samples containing stone powder and without stone powder, respectively.
Yet, the reductions observed in the normalized liquid limits and flow values of cement-treated clay composites compared to the control sample indicated that mixing characteristics did not impact the sample UCS. This is consistent with results reported concerning the effect of stone powder particle size on the workability of cement-treated clay [26].

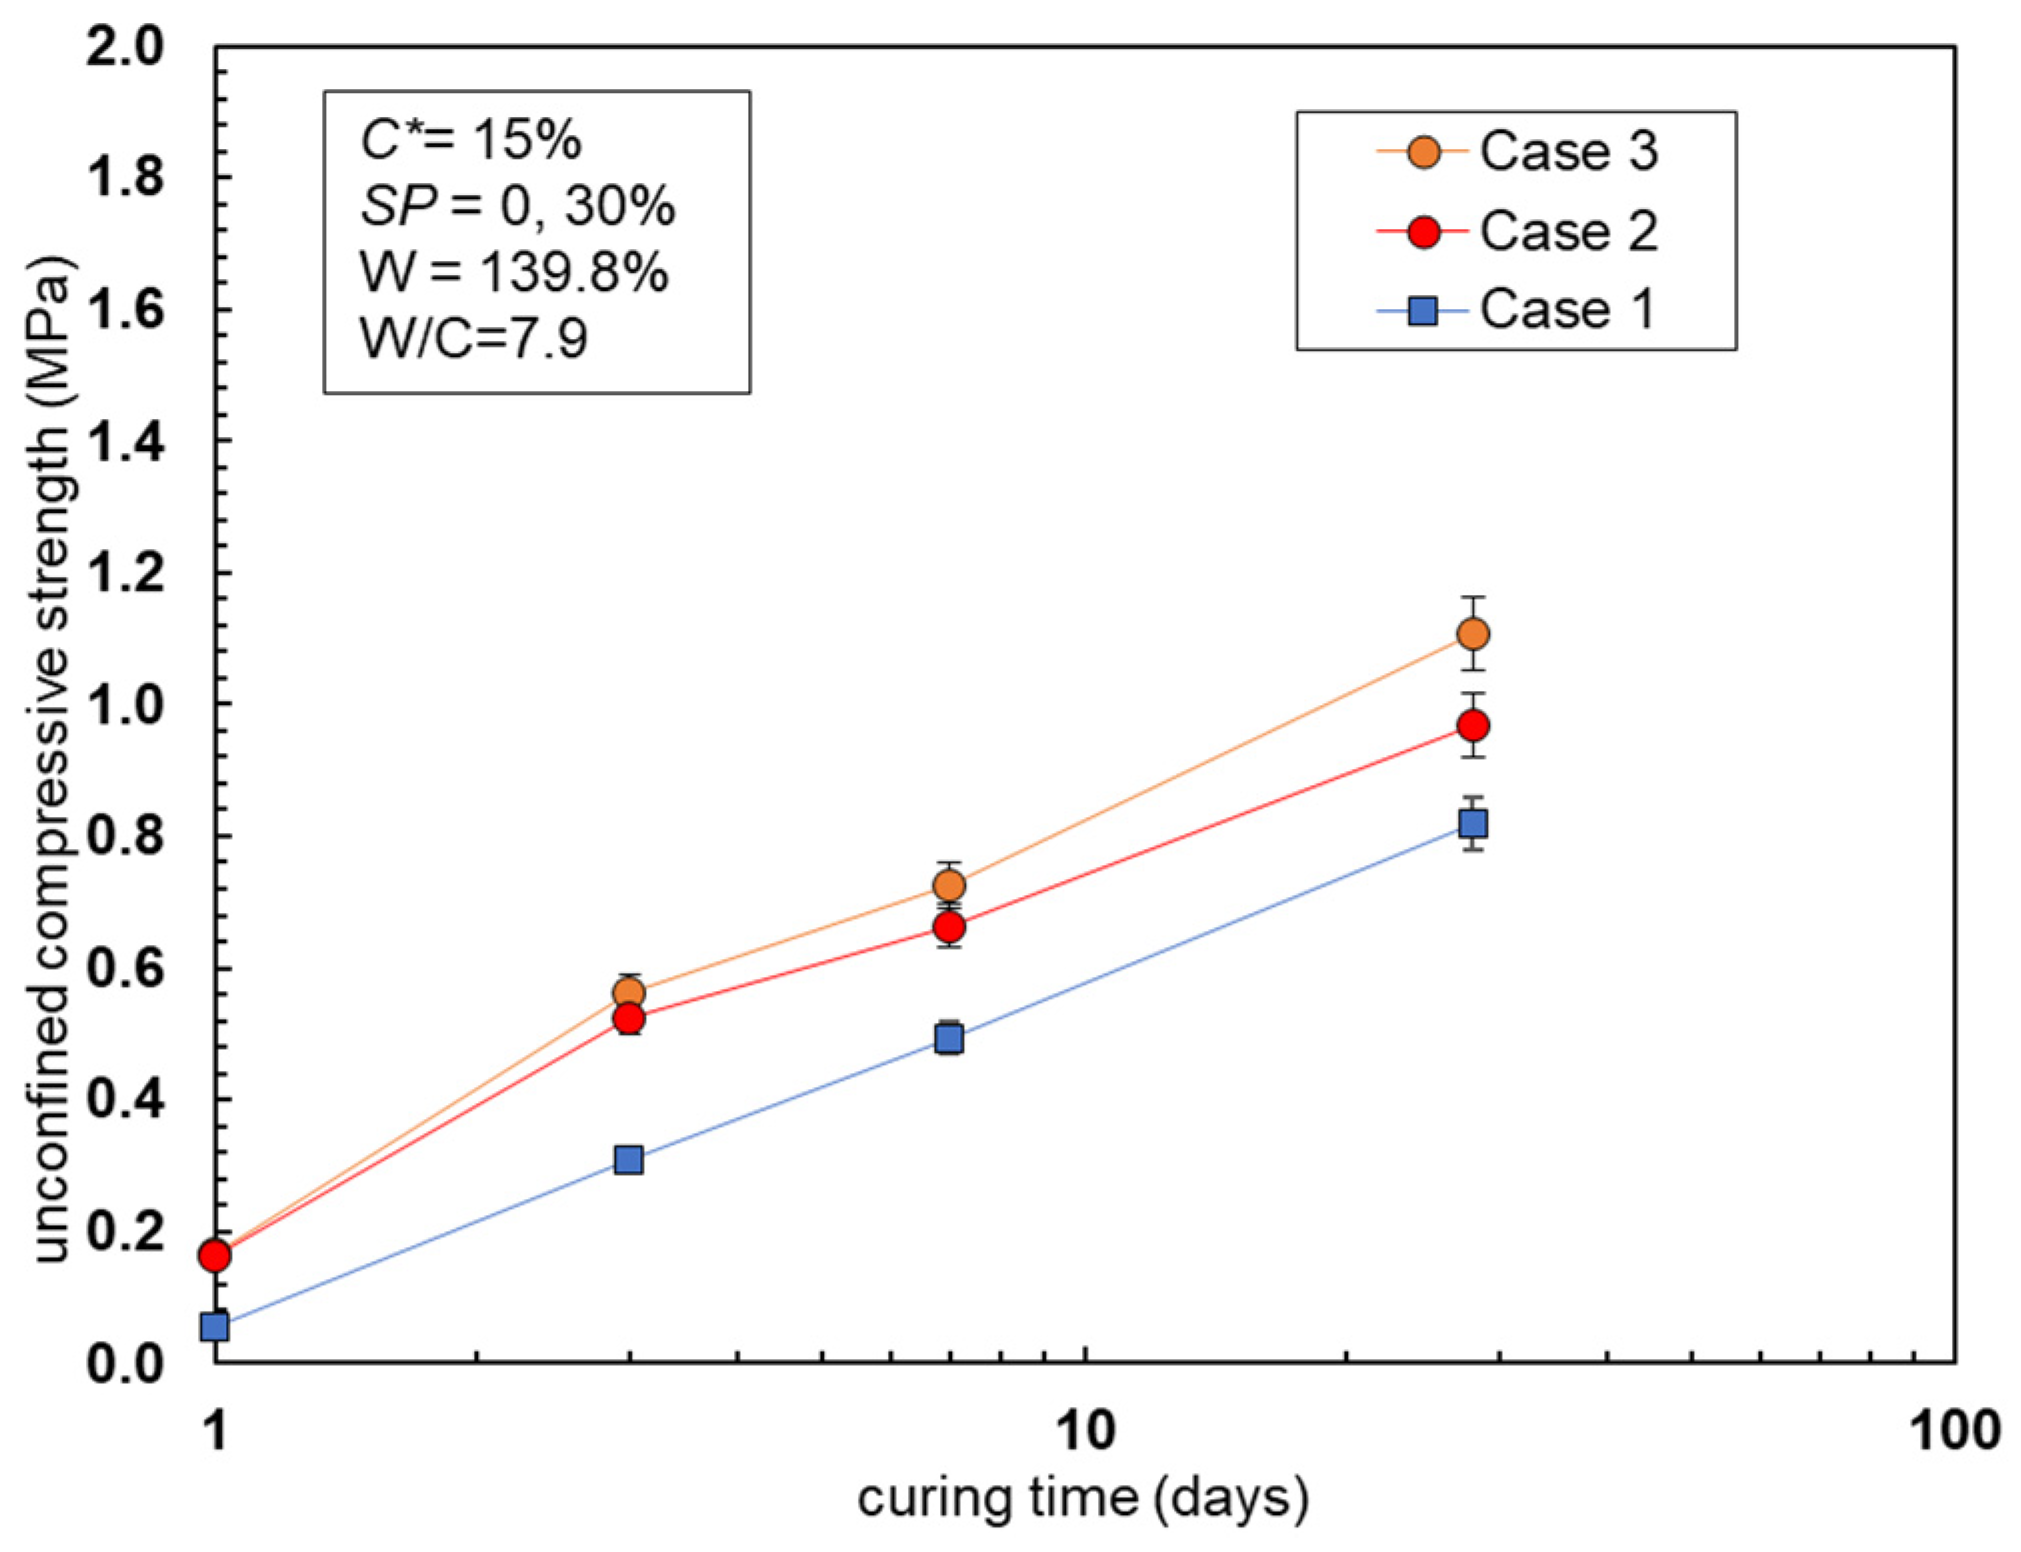
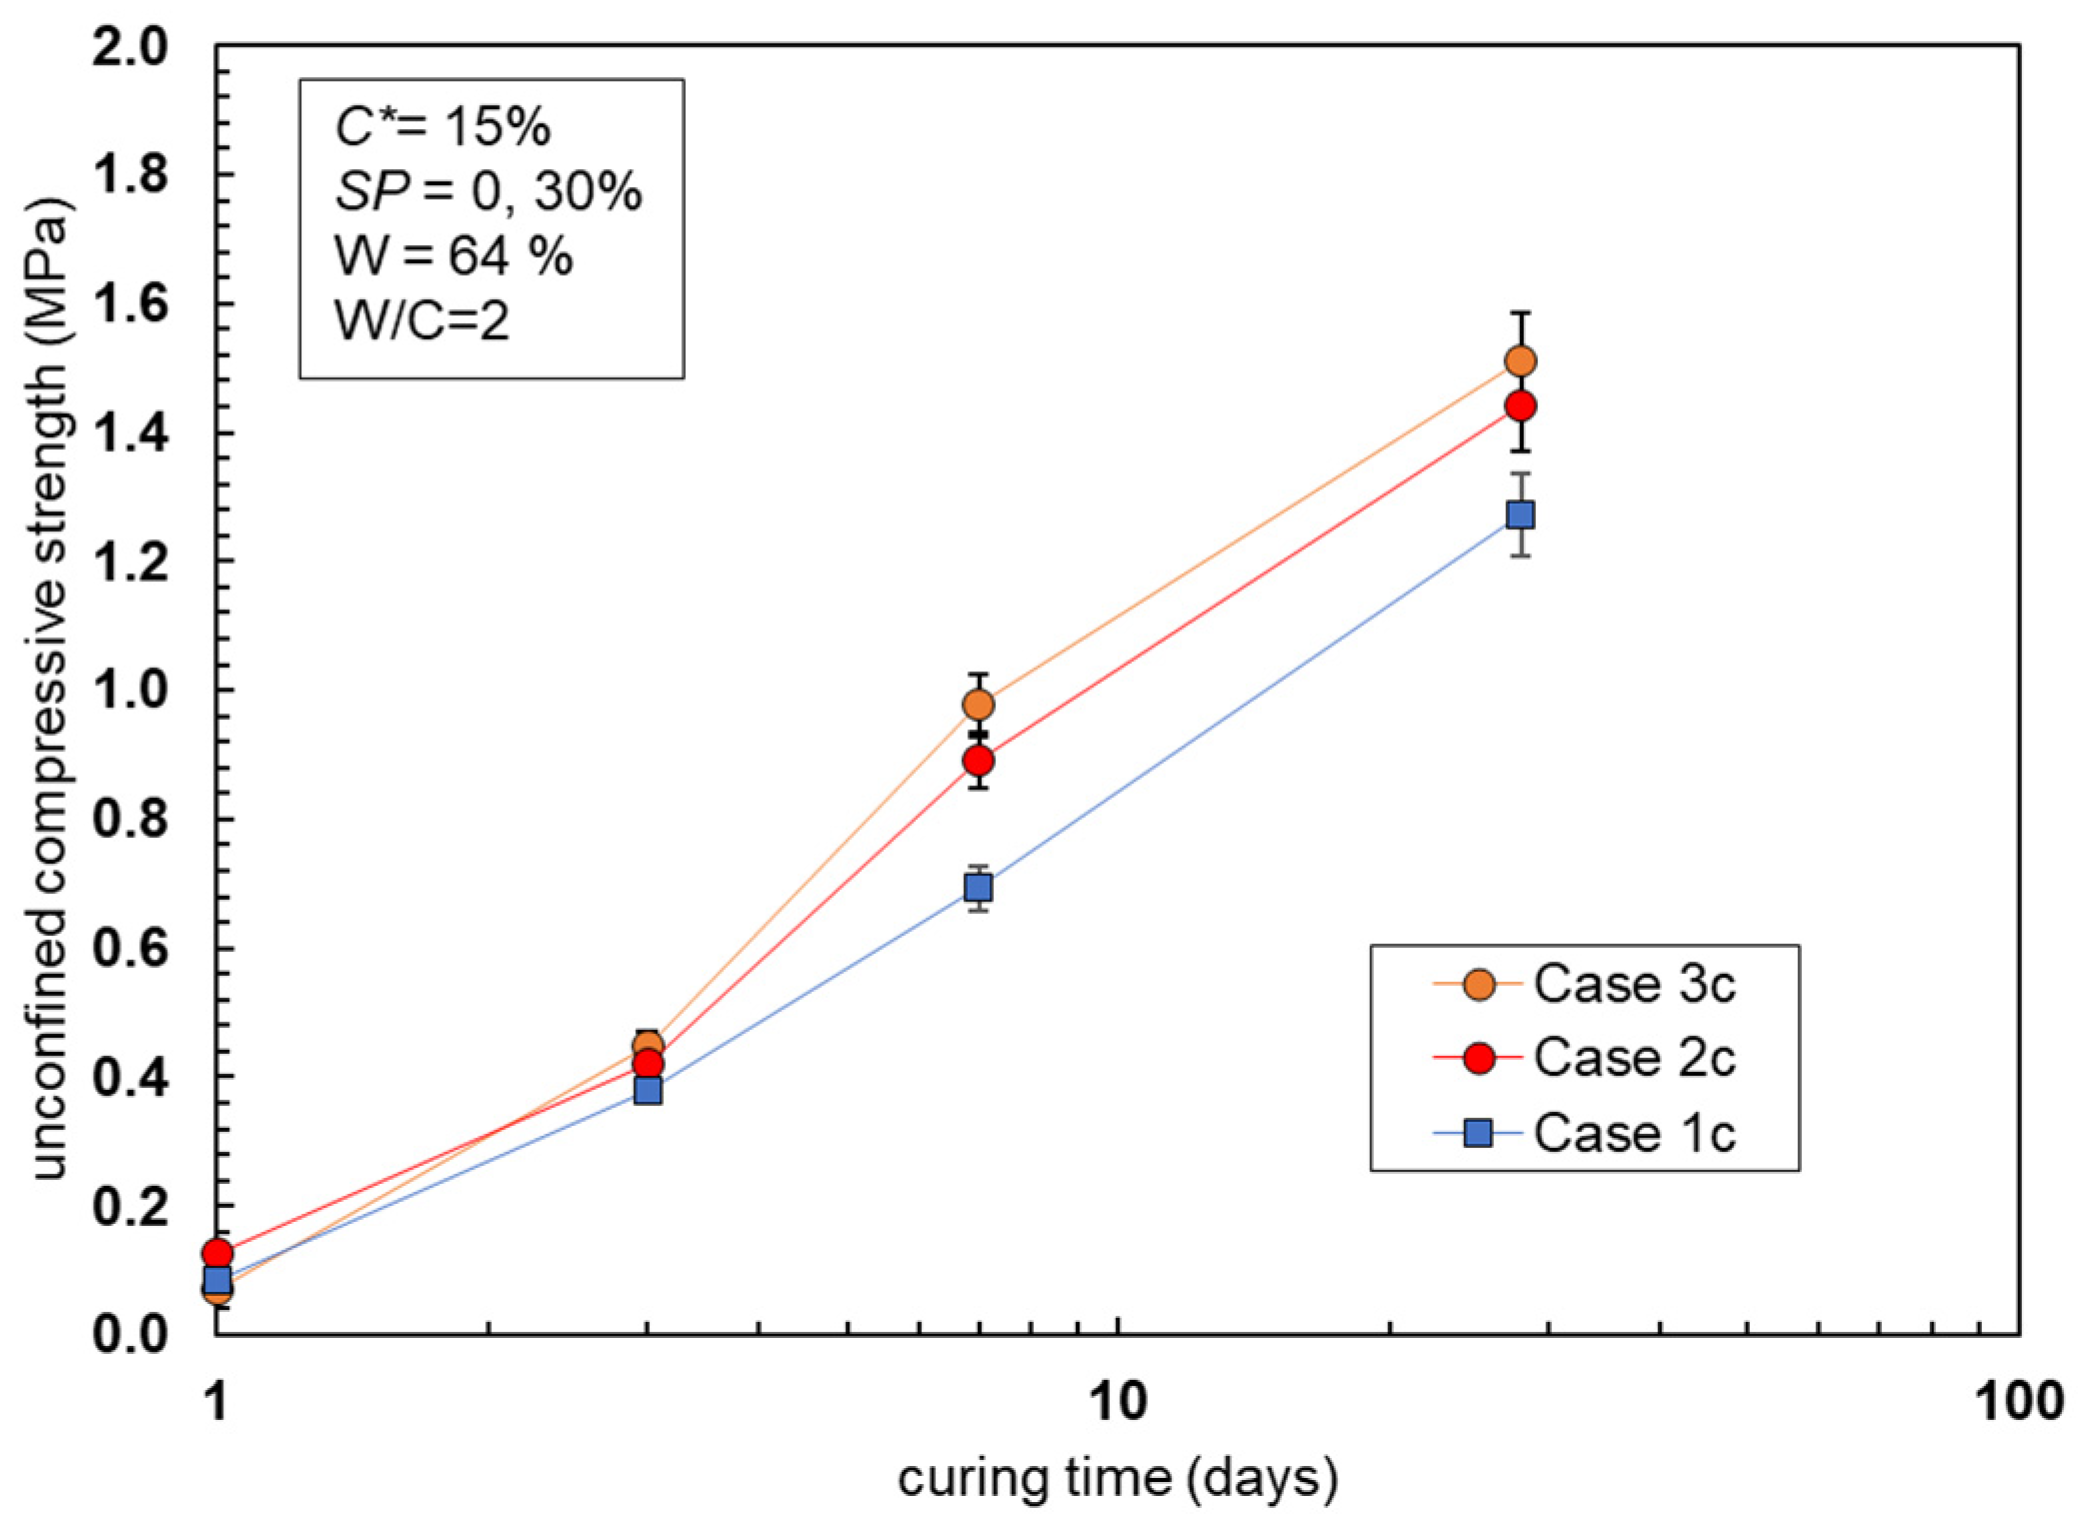
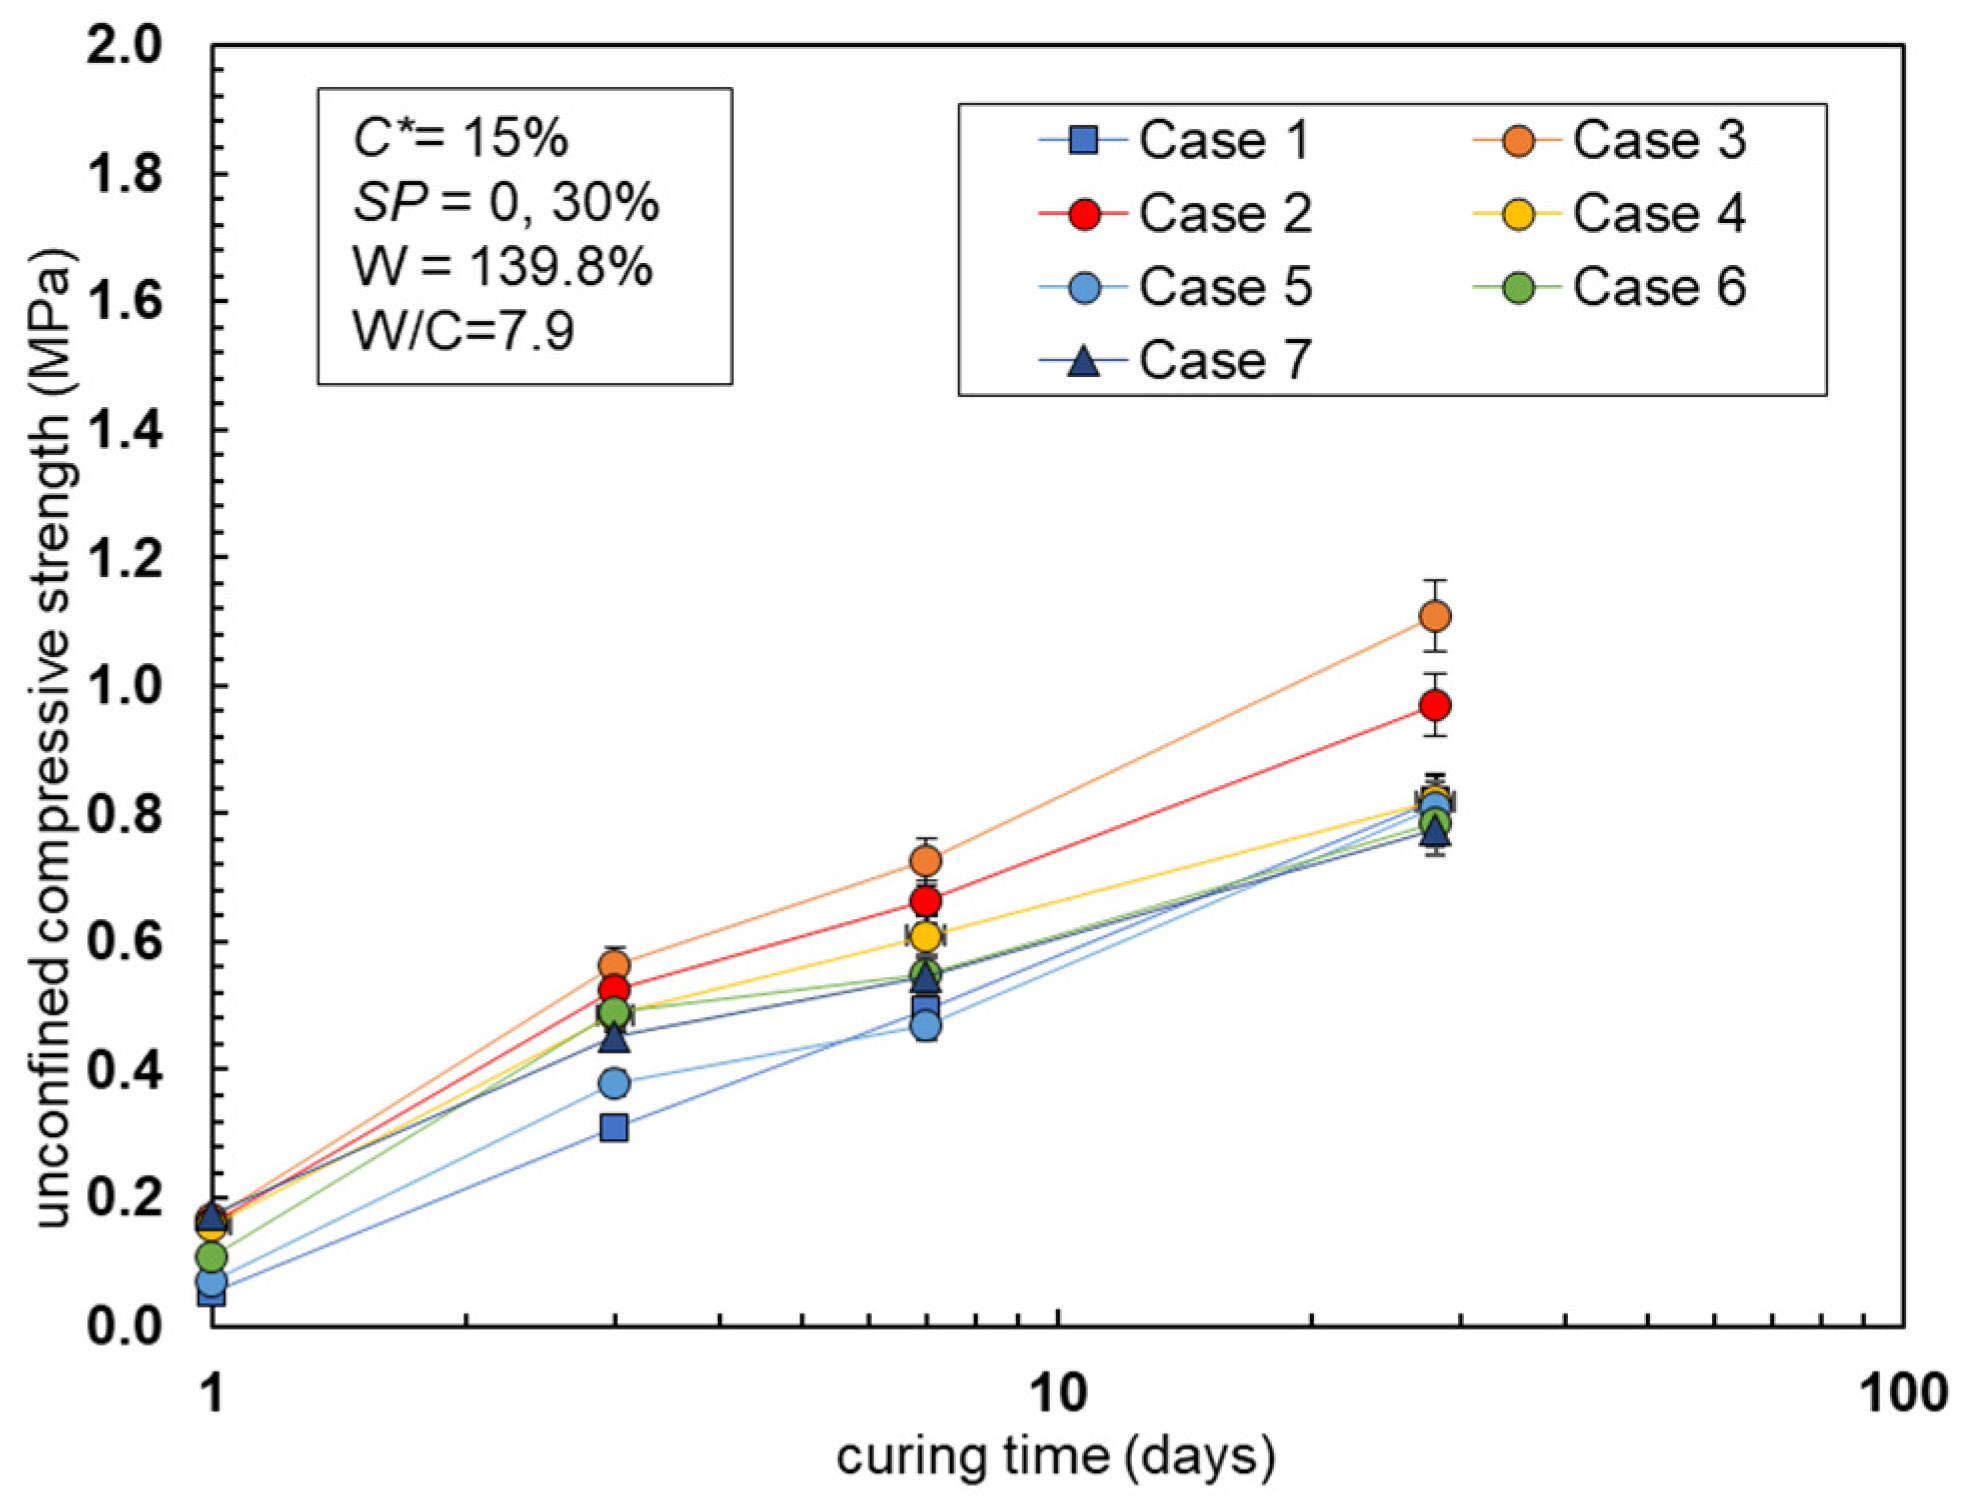
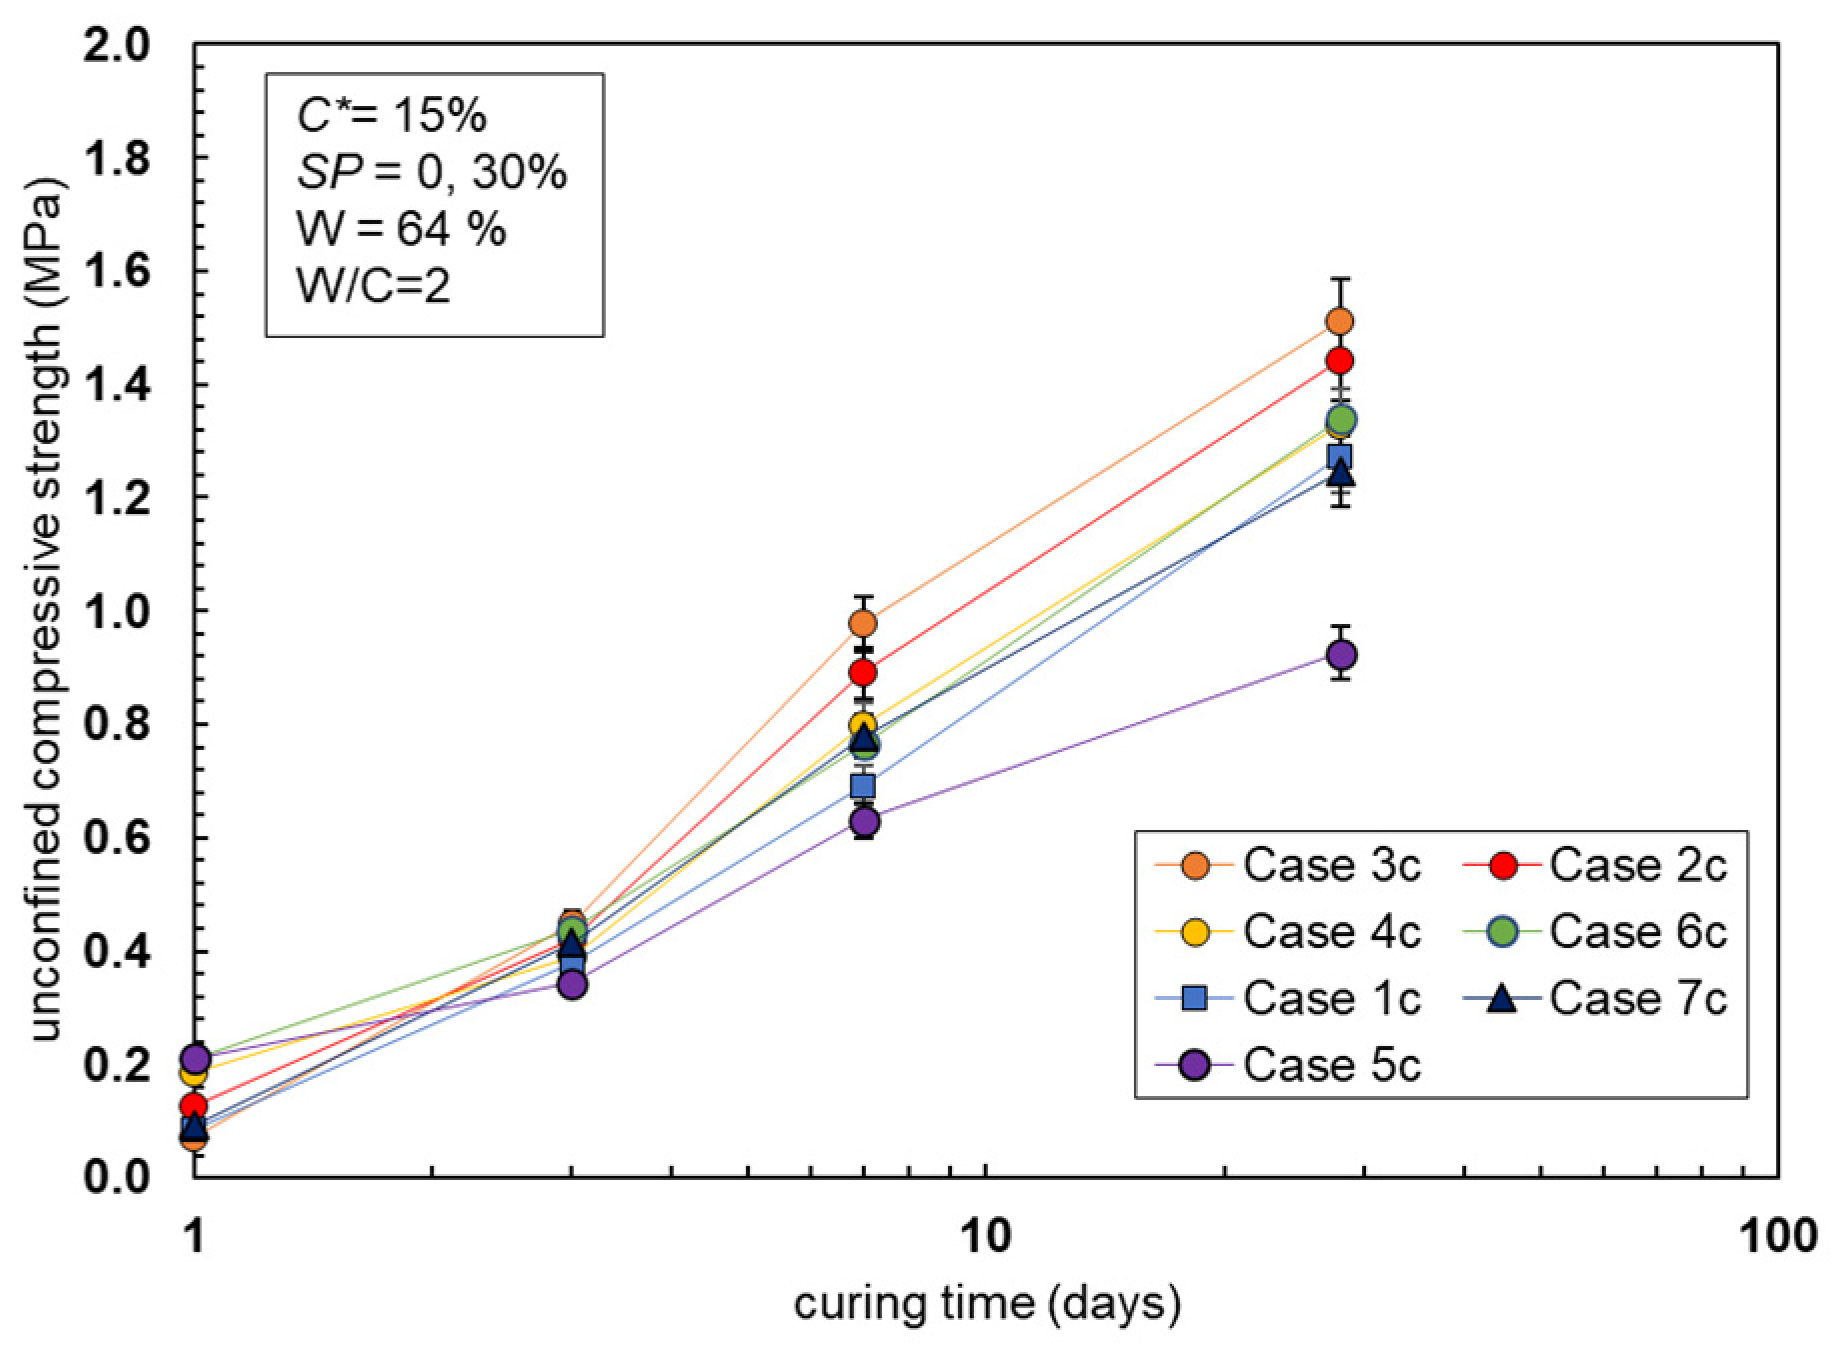
3.2. UCS of Cement-Treated Clay–Stone Powder Composites

Stone powder of sizes <20 µm and 106–<1 µm, used in cases 3 and 2, respectively, are suggested as the most effective particle sizes for improvement in cement-treated clay UCS [26]. Therefore, to decongest the charts and clearly present the benefits of using stone powder and variations in composites due to the stone powder particle size, only cases 1, 2, 3, 1c, 2c and 3c have been presented in Figure 1 and Figure 2 and herein discussed. The UCS development of all the test cases can be found in Figure A3 and Figure A4 in Appendix A. As shown in the Figures, the strength of cement-treated clay was higher at every curing time when the sample contained stone powder. Cases 3 and 3c contained Type D (<20 µm) stone powder and displayed the highest strength, followed by cases 2 and 2c, which contained Type E (106–<1 µm) stone powder; the control sample cases 1 and 1c displayed the lowest strength. This variation in strength among cement-treated clay–stone powder composites implied that the stone powder particle size influenced the composite strength. The higher strength displayed by cement-treated clay–stone powder composites than the control sample implies that 8.02% of the cement used per 1 m3 of treated clay can be saved while achieving a higher strength. Similar results have been reported in cement-treated clays containing 30% stone powder and 26.3% cement [26].

3.3. Relationship between Strength and Chemical Properties of Materials

3.3.1. Elemental Composition

The stone powder consisted mainly of Si, Fe, K and Ca; the elemental proportions varied with the particle size, as shown in Table 3. Any element representing <1% of the sample was considered insignificant, and therefore, not reported. Although no Al was detected in the samples, the sums of Si + Al + Fe were greater than 70%, suggesting pozzolanic reactivity. Although quantitative measurement of elements is necessary, our XRF results provided only qualitative measurement. The XRF results also did not distinguish between amorphous and crystalline phases of silica; hence, we could not directly confirm the materials’ pozzolanic reactivity. Therefore, an EC test to confirm the pozzolanic reactivity of the materials was necessary. An additional procedure was also performed to quantify the amorphous silica in the materials.

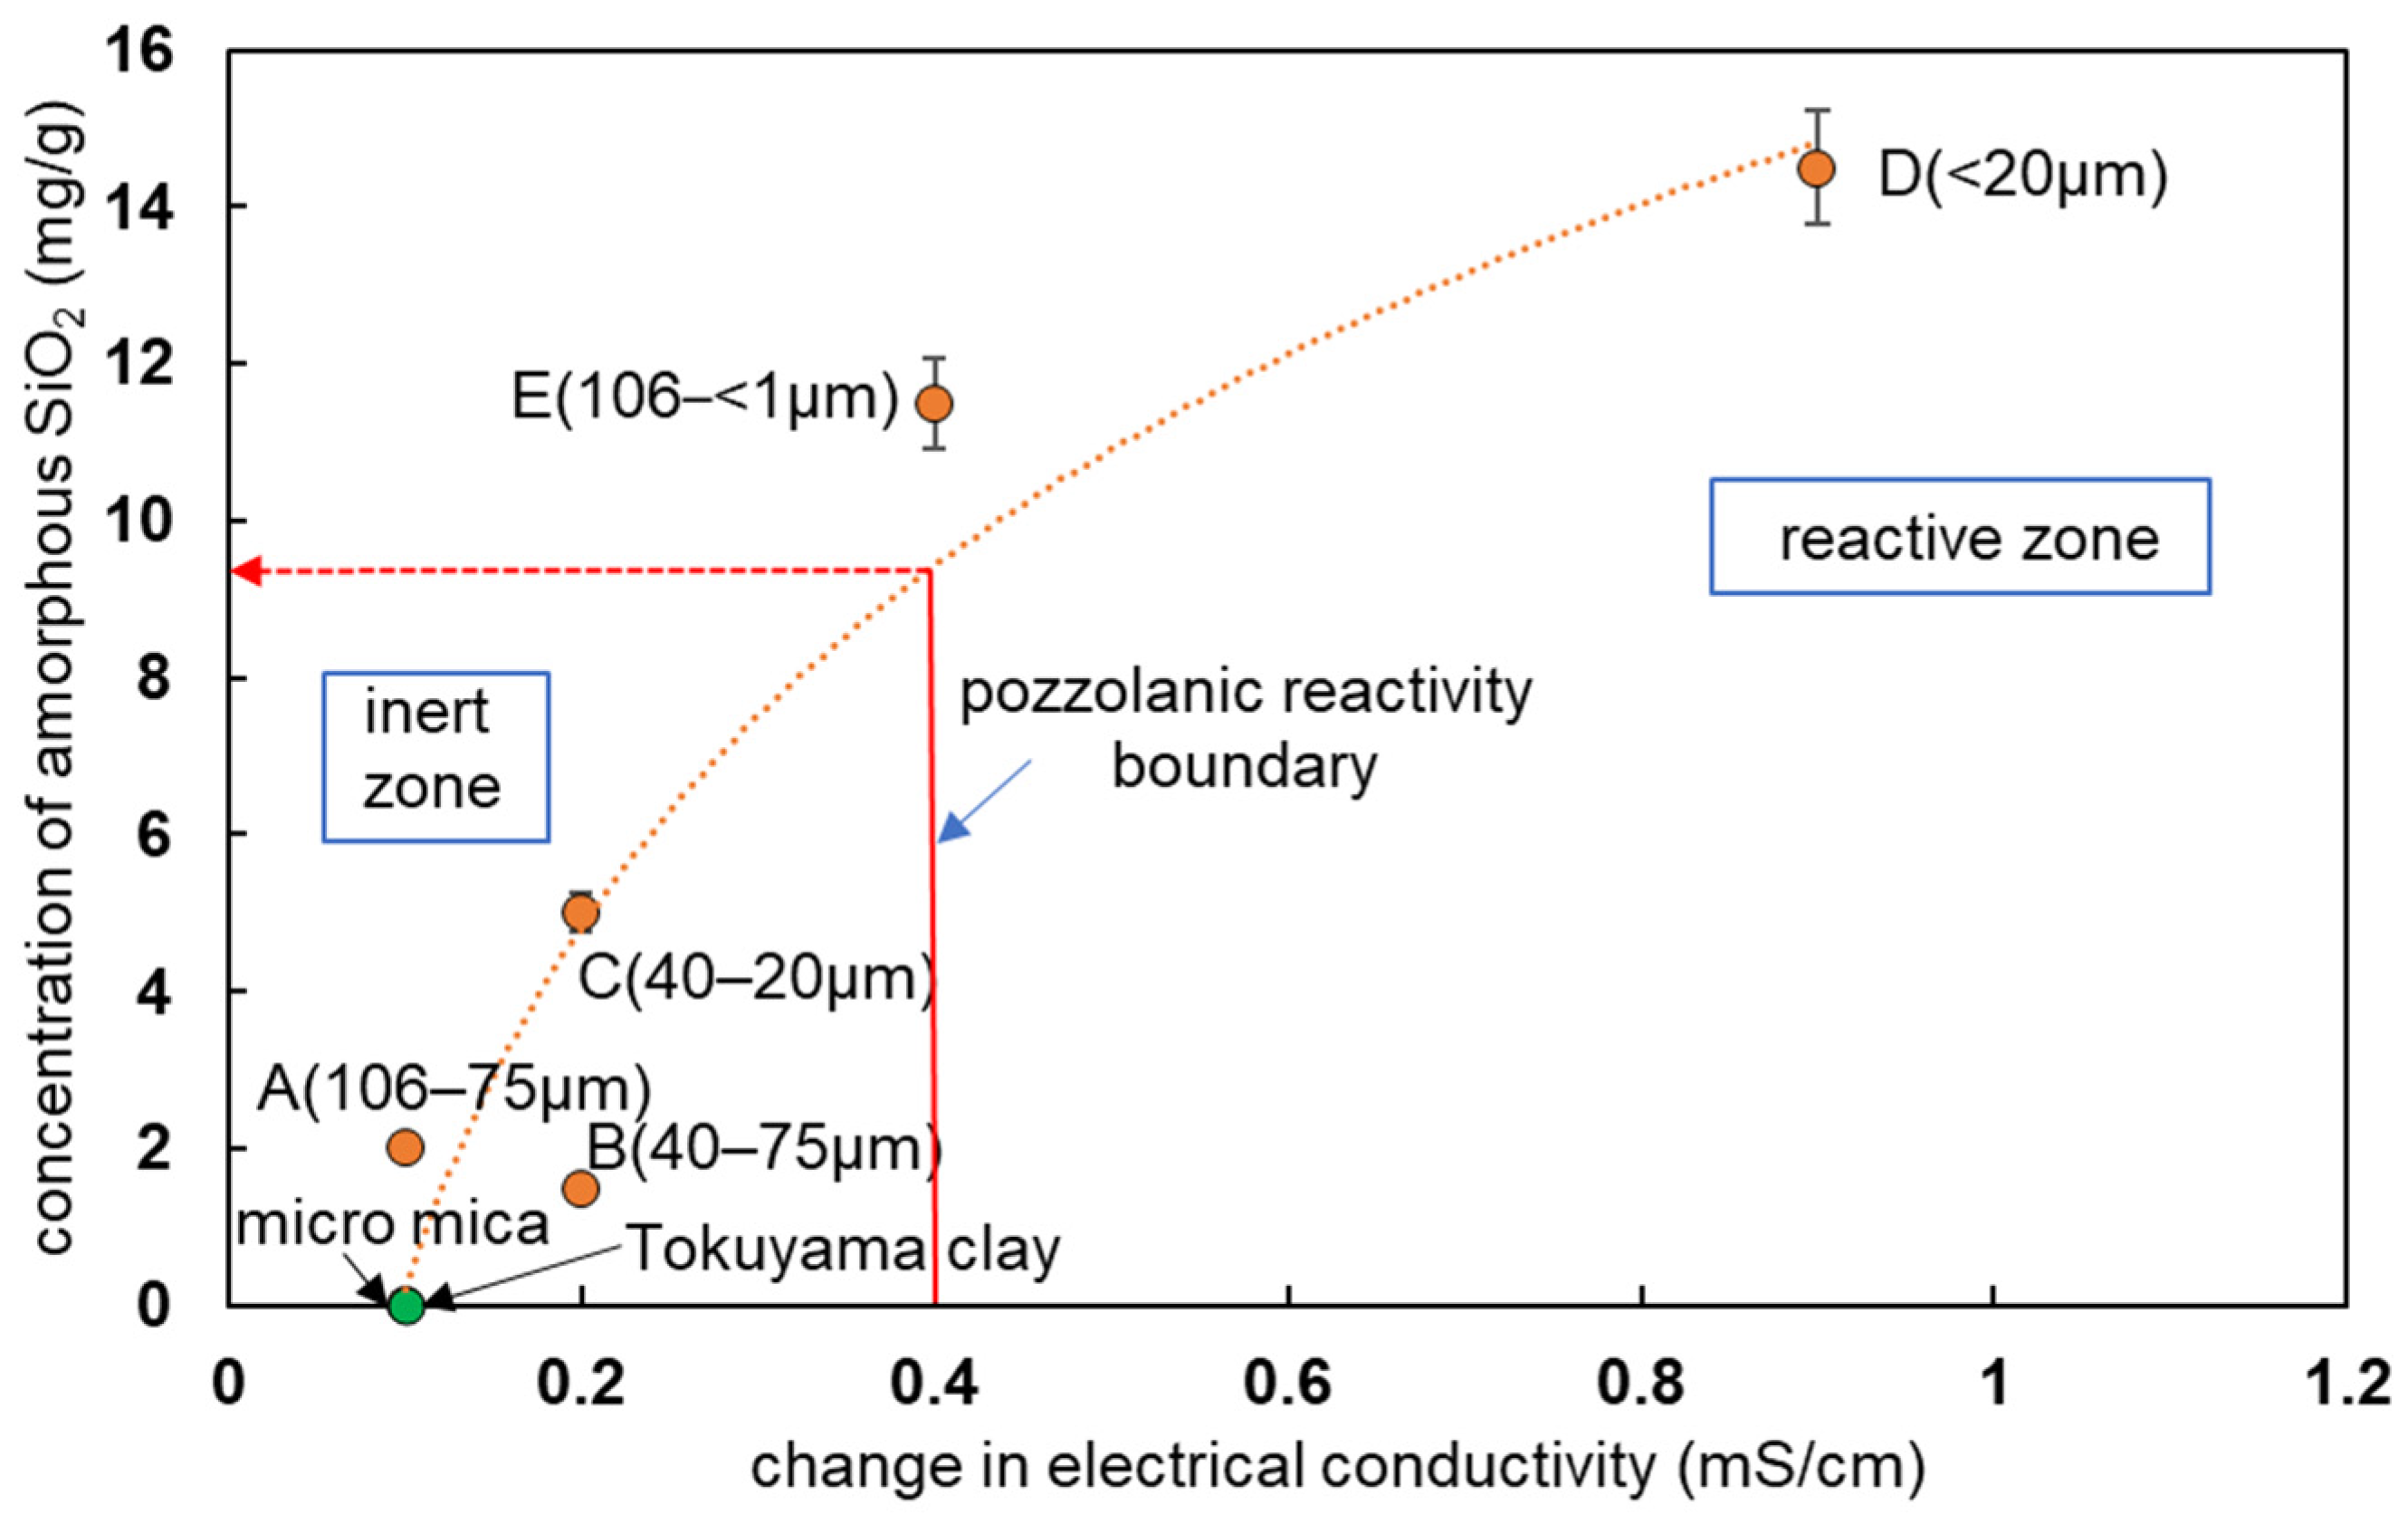
3.3.2. Pozzolanic Reactivity of Materials

Although the XRF results suggested pozzolanic reactivity for all stone powder types, only types D (<20 µm) and E (106–<1 µm) were reactive according to the changes in EC observed (Table 4). The pozzolanic reactivities of quartz [28] and granite residue [29], glass [30], fly ash [51] and bottom ash [52] increase with decreasing particle size. Type D (<20 µm) stone powder showed the most significant such EC change, indicating pozzolanic reactivity. A decrease in particle size led to an increased surface area, which increased the rate of chemical reaction between silica and calcium hydroxide. Since the other stone powder types (A, B and C) were not found to be pozzolanic, the Type D component constituting 42% of Type E must be responsible for Type E’s observed pozzolanic reactivity. This explains the observed trend in strength increment in Section 3.2. However, particle size alone cannot be responsible for pozzolanic reactivity, as made clear by the non-pozzolanic result for micro mica, the particle size of which was similar to that of Type D stone powder.

3.3.3. Amorphous Silica Concentration and Stone Powder Particle Size

Silica (SiO2) exists as a crystalline or amorphous tetrahedron {SiO4}4− in an isolated or polymerized form. The crystalline form is inert while the amorphous silica surface possesses hydroxyl groups (i.e., silanol, Si-OH) that are responsible for its pozzolanic reactivity [53,54]. The silanol groups are a result of reaction with aqueous solutions, as seen in Equation (15). The presence of surface OH increases the rate of reaction by increasing the Si-O-Si bond breakage rate.
Si - O - Si + H 2 O 2 Si - OH
The grinding of rocks causes a mechanochemical transformation of crystalline silica to amorphous silica [28,31,55]. The quantity of silica leached from minerals due to NaOH and Na2CO3 treatment increases with decreasing particle size [47]. Furthermore, Tomozawa reported the dependence of the amorphous silica solubility in water on the particle size [56]. Table 5 indicates that the amorphous silica concentration and hence the amorphization rate in stone powder increased with decreasing particle size. Ostensibly, mechanochemical transformation of crystalline silica of up to 1.45% amorphization occurred during the crushing process of granite rocks at the quarry. Since amorphization increases with a decrease in particle size of crystalline materials [28,29,30,31], it was expected that the amorphous silica concentration would vary with the stone powder particle size. Both Tokuyama clay and micro mica, playing the role of inert material here, contained no amorphous silica. The absence of amorphous silica from Tokuyama clay and commercial clay indicated their non-pozzolanic reactivity and the inability of NaOH to leach crystalline mineral silica from the clays.

3.3.4. Relationship between Amorphous SiO2 Concentration and Pozzolanic Reactivity

As mentioned in Section 3.3.3, amorphous silica possesses Si-OH groups on its surface. These Si-OH groups react with calcium hydroxide solution according to Equation (16). The complete hydrolysis of SiO4 leads to the formation of silicic acid as well as silicate and polysilicate species, consequently precipitating to form insoluble CSH [54]. As these reactions proceed, the hydroxyl ion concentration decreases. This decrease results in an EC reduction, the magnitude of which indicates pozzolanic reactivity [44].
2 Si - OH + Ca ( OH ) 2   Ca ( SiO ) 2 + 2 H 2 O  
As shown in Figure 3, the EC change was higher for materials exhibiting higher amorphous SiO2 concentrations. The relationship between the amorphous silica concentration and change in electrical conductivity is determined using Equation (17), where y is the amorphous silica concentration (mg/g) and x is the change in EC (mS/cm).
y = 6.6506 I n ( x ) + 15.52 ,   R 2 = 0.908
Theoretically, the pozzolanic reactivity of a material is indicated by a change in EC of ≥0.4 mS/cm; therefore, using Equation (17), 9.4 mg/g of amorphous silica per mass of material was calculated to be the minimum requirement for pozzolanic reactivity to occur. A boundary for pozzolanic reactivity was, therefore, generated at the abscissa (0.4) and the ordinate.

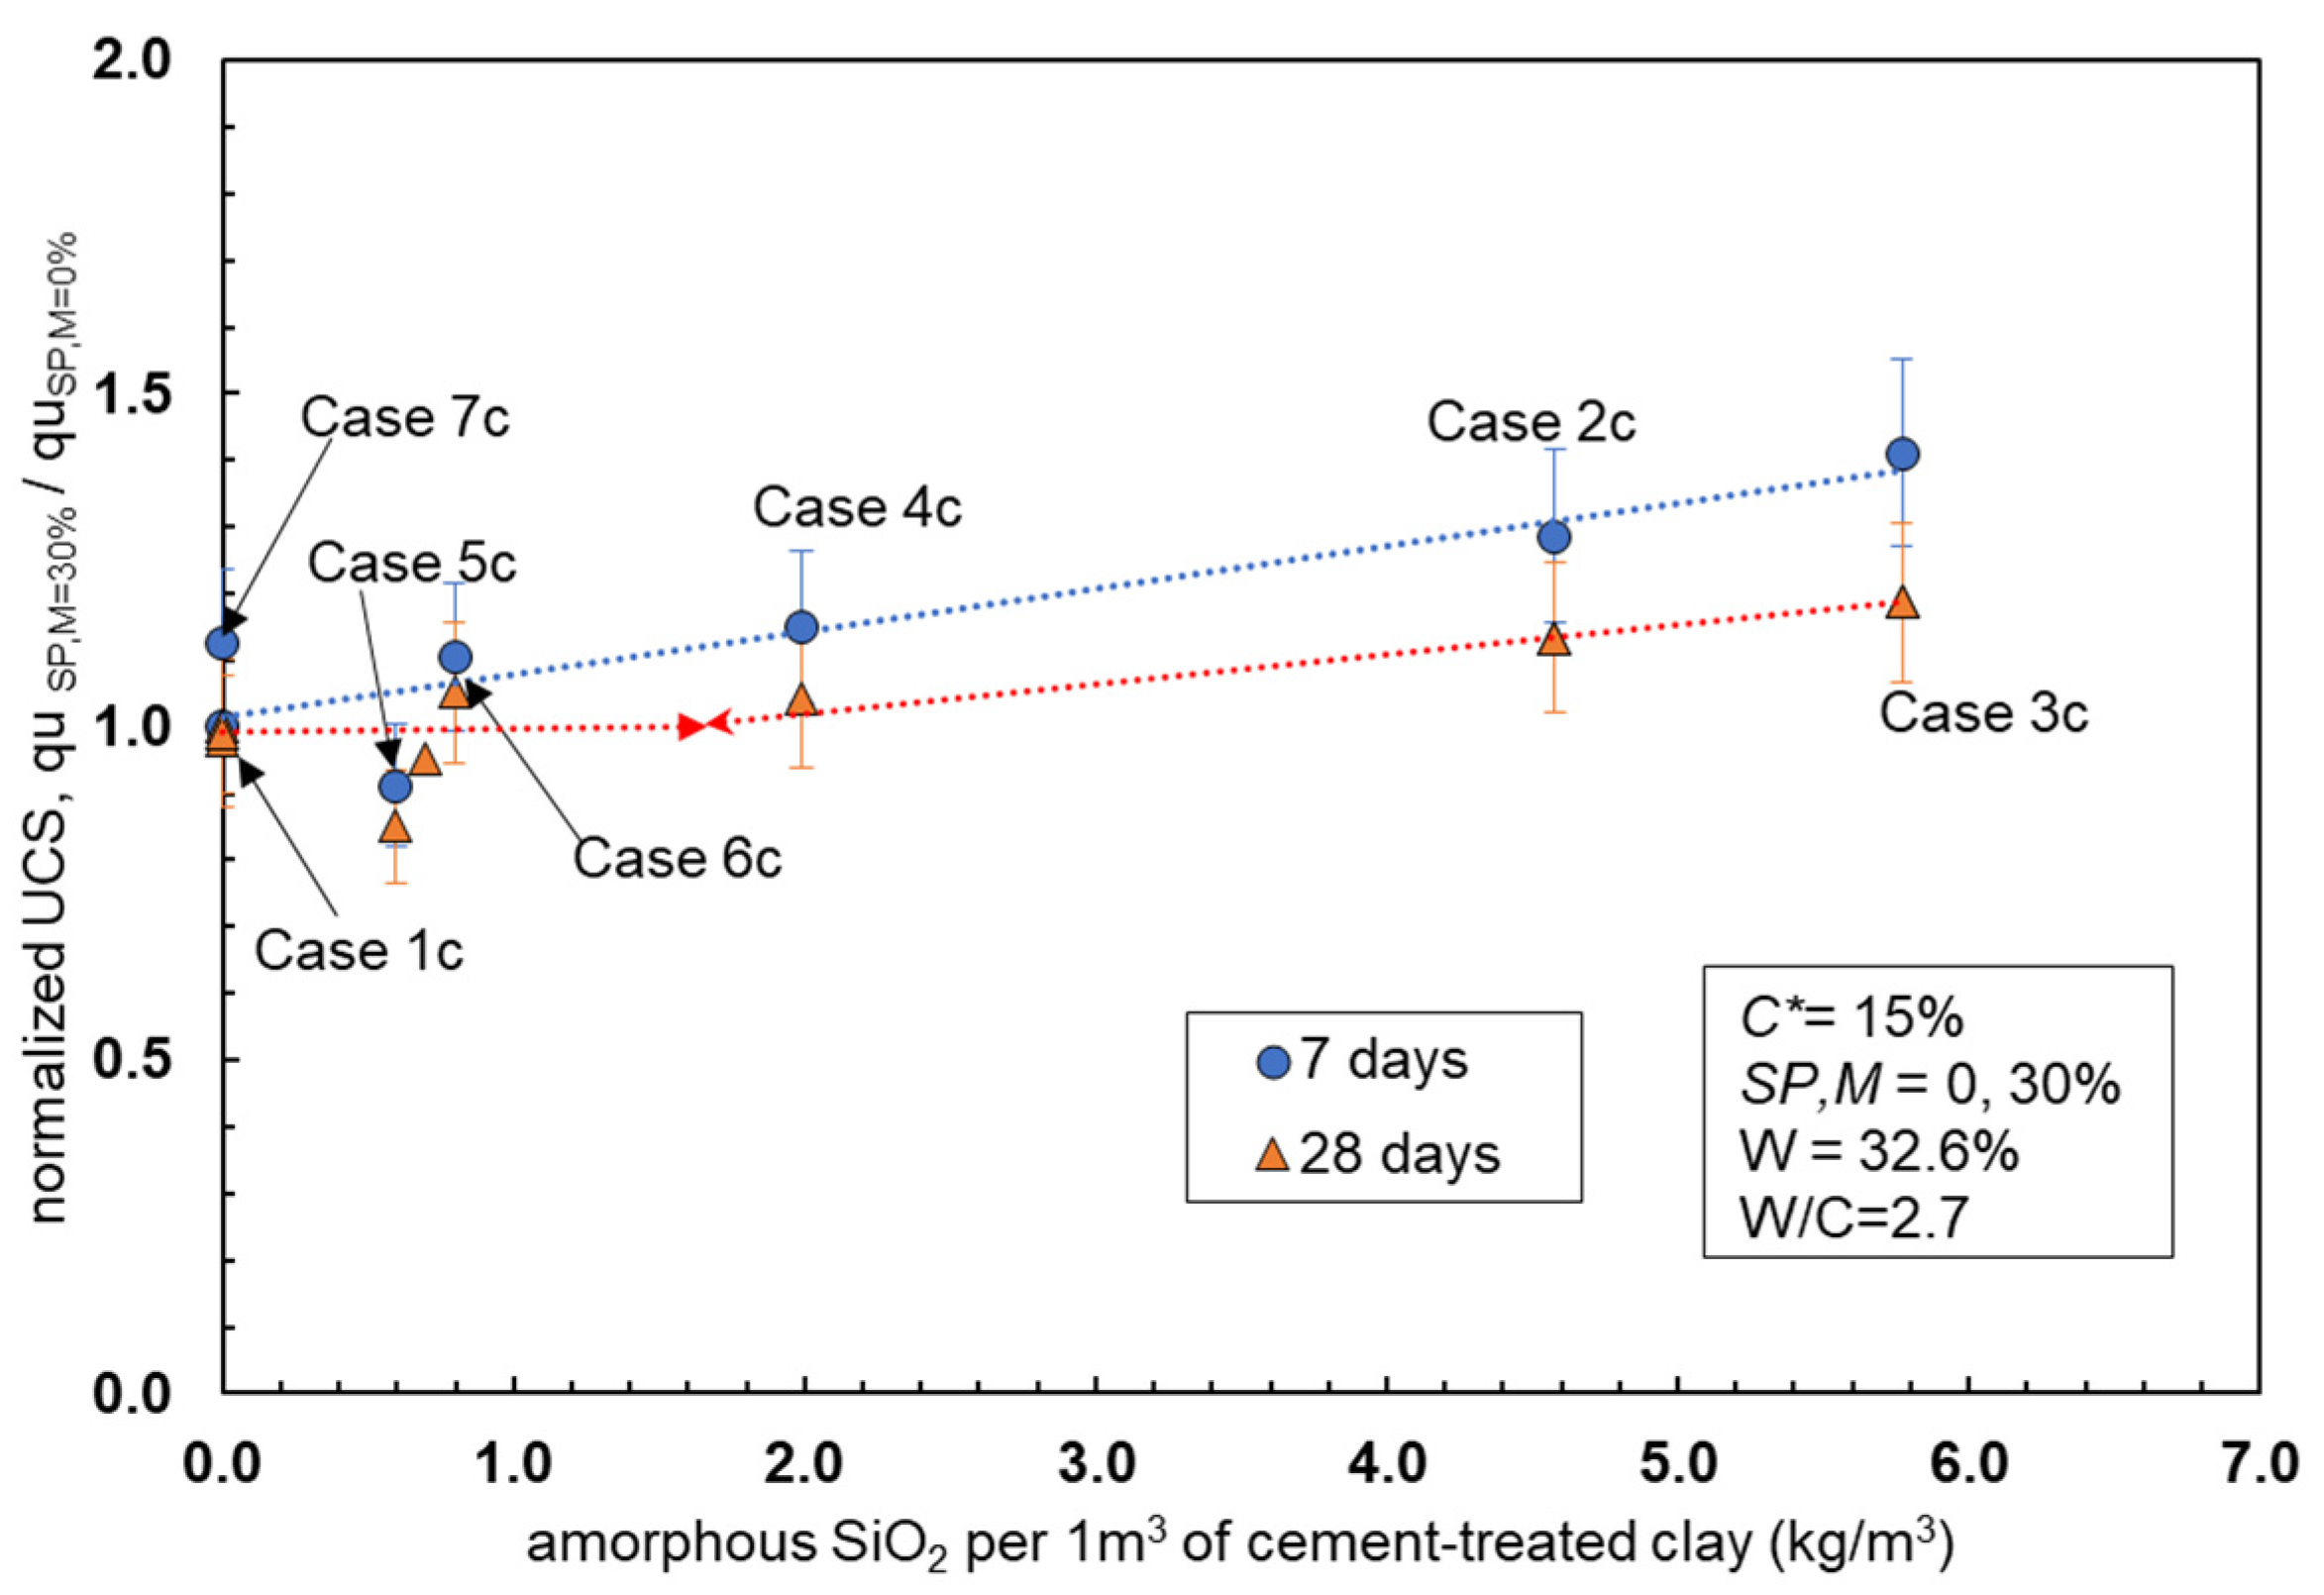
3.3.5. Relationship between Amorphous SiO2 Concentration and UCS

The normalized UCS increased with an increasing amorphous silica concentration, as shown in Figure 4 and Figure 5. It has been reported that the strength of fly ash increases with increasing amorphous silica and free lime contents due to the consequent increase in pozzolanic reactivity [51]. CSH formed from the pozzolanic reaction between amorphous silica and calcium hydroxide released by cement hydration is known to govern the strength of soil cement [57]. A pozzolanic reaction between materials and calcium hydroxide produced by the hydration of Portland cement begins after 3.87 days [58]. In the present research, the higher strength in cement-treated clay composites containing non-reactive materials as compared to cases 1 and 1c observed at seven days was due to the incomplete manifestation of the pozzolanic reaction effect. The linear relationship between the amorphous silica concentration and the normalized UCS of cement-treated clay composites at seven days is described by Equations (18) and (19), where a is the concentration of amorphous silica.
N o r m a l i s e d   U C S = q u S P , M = 30 % q u S P , M = 0 % = 0.1380 a + 1.0296 ,   R 2 = 0.8721   Tokuyama   Clay
N o r m a l i s e d   U C S = q u S P , M = 30 % q u S P , M = 0 % = 0.0643 a + 1.015 ,   R 2 = 0.7928   Commercial   Clay
In contrast, at 28 days, an increase in strength as compared to cases 1 and 1c was observed only in those composites containing pozzolanic reactive materials (cases 2, 2c, 3 and 3c), with reactivity increasing with increasing curing time. Therefore, the relationship between the amorphous silica concentration and normalized UCS of cement-treated clay composites at 28 days is described by Equations (18) and (19).
N o r m a l i s e d   U C S = q u S P , M = 30 % q u S P , M = 0 % = 0.1139 a + 0.9409 ,   R 2 = 0.9023   Tokuyama   Clay
N o r m a l i s e d   U C S = q u S P , M = 30 % q u S P , M = 0 % = 0.0387 a + 0.9592 ,   R 2 = 0.676   Commercial   Clay
As shown in Figure 6 and Figure 7, the measured UCS agreed well with the calculated UCS, and therefore, the relationship between the UCS of cement-treated clay–stone powder composites and amorphous silica can be described by linear regressions 16, 17, 18 and 19.

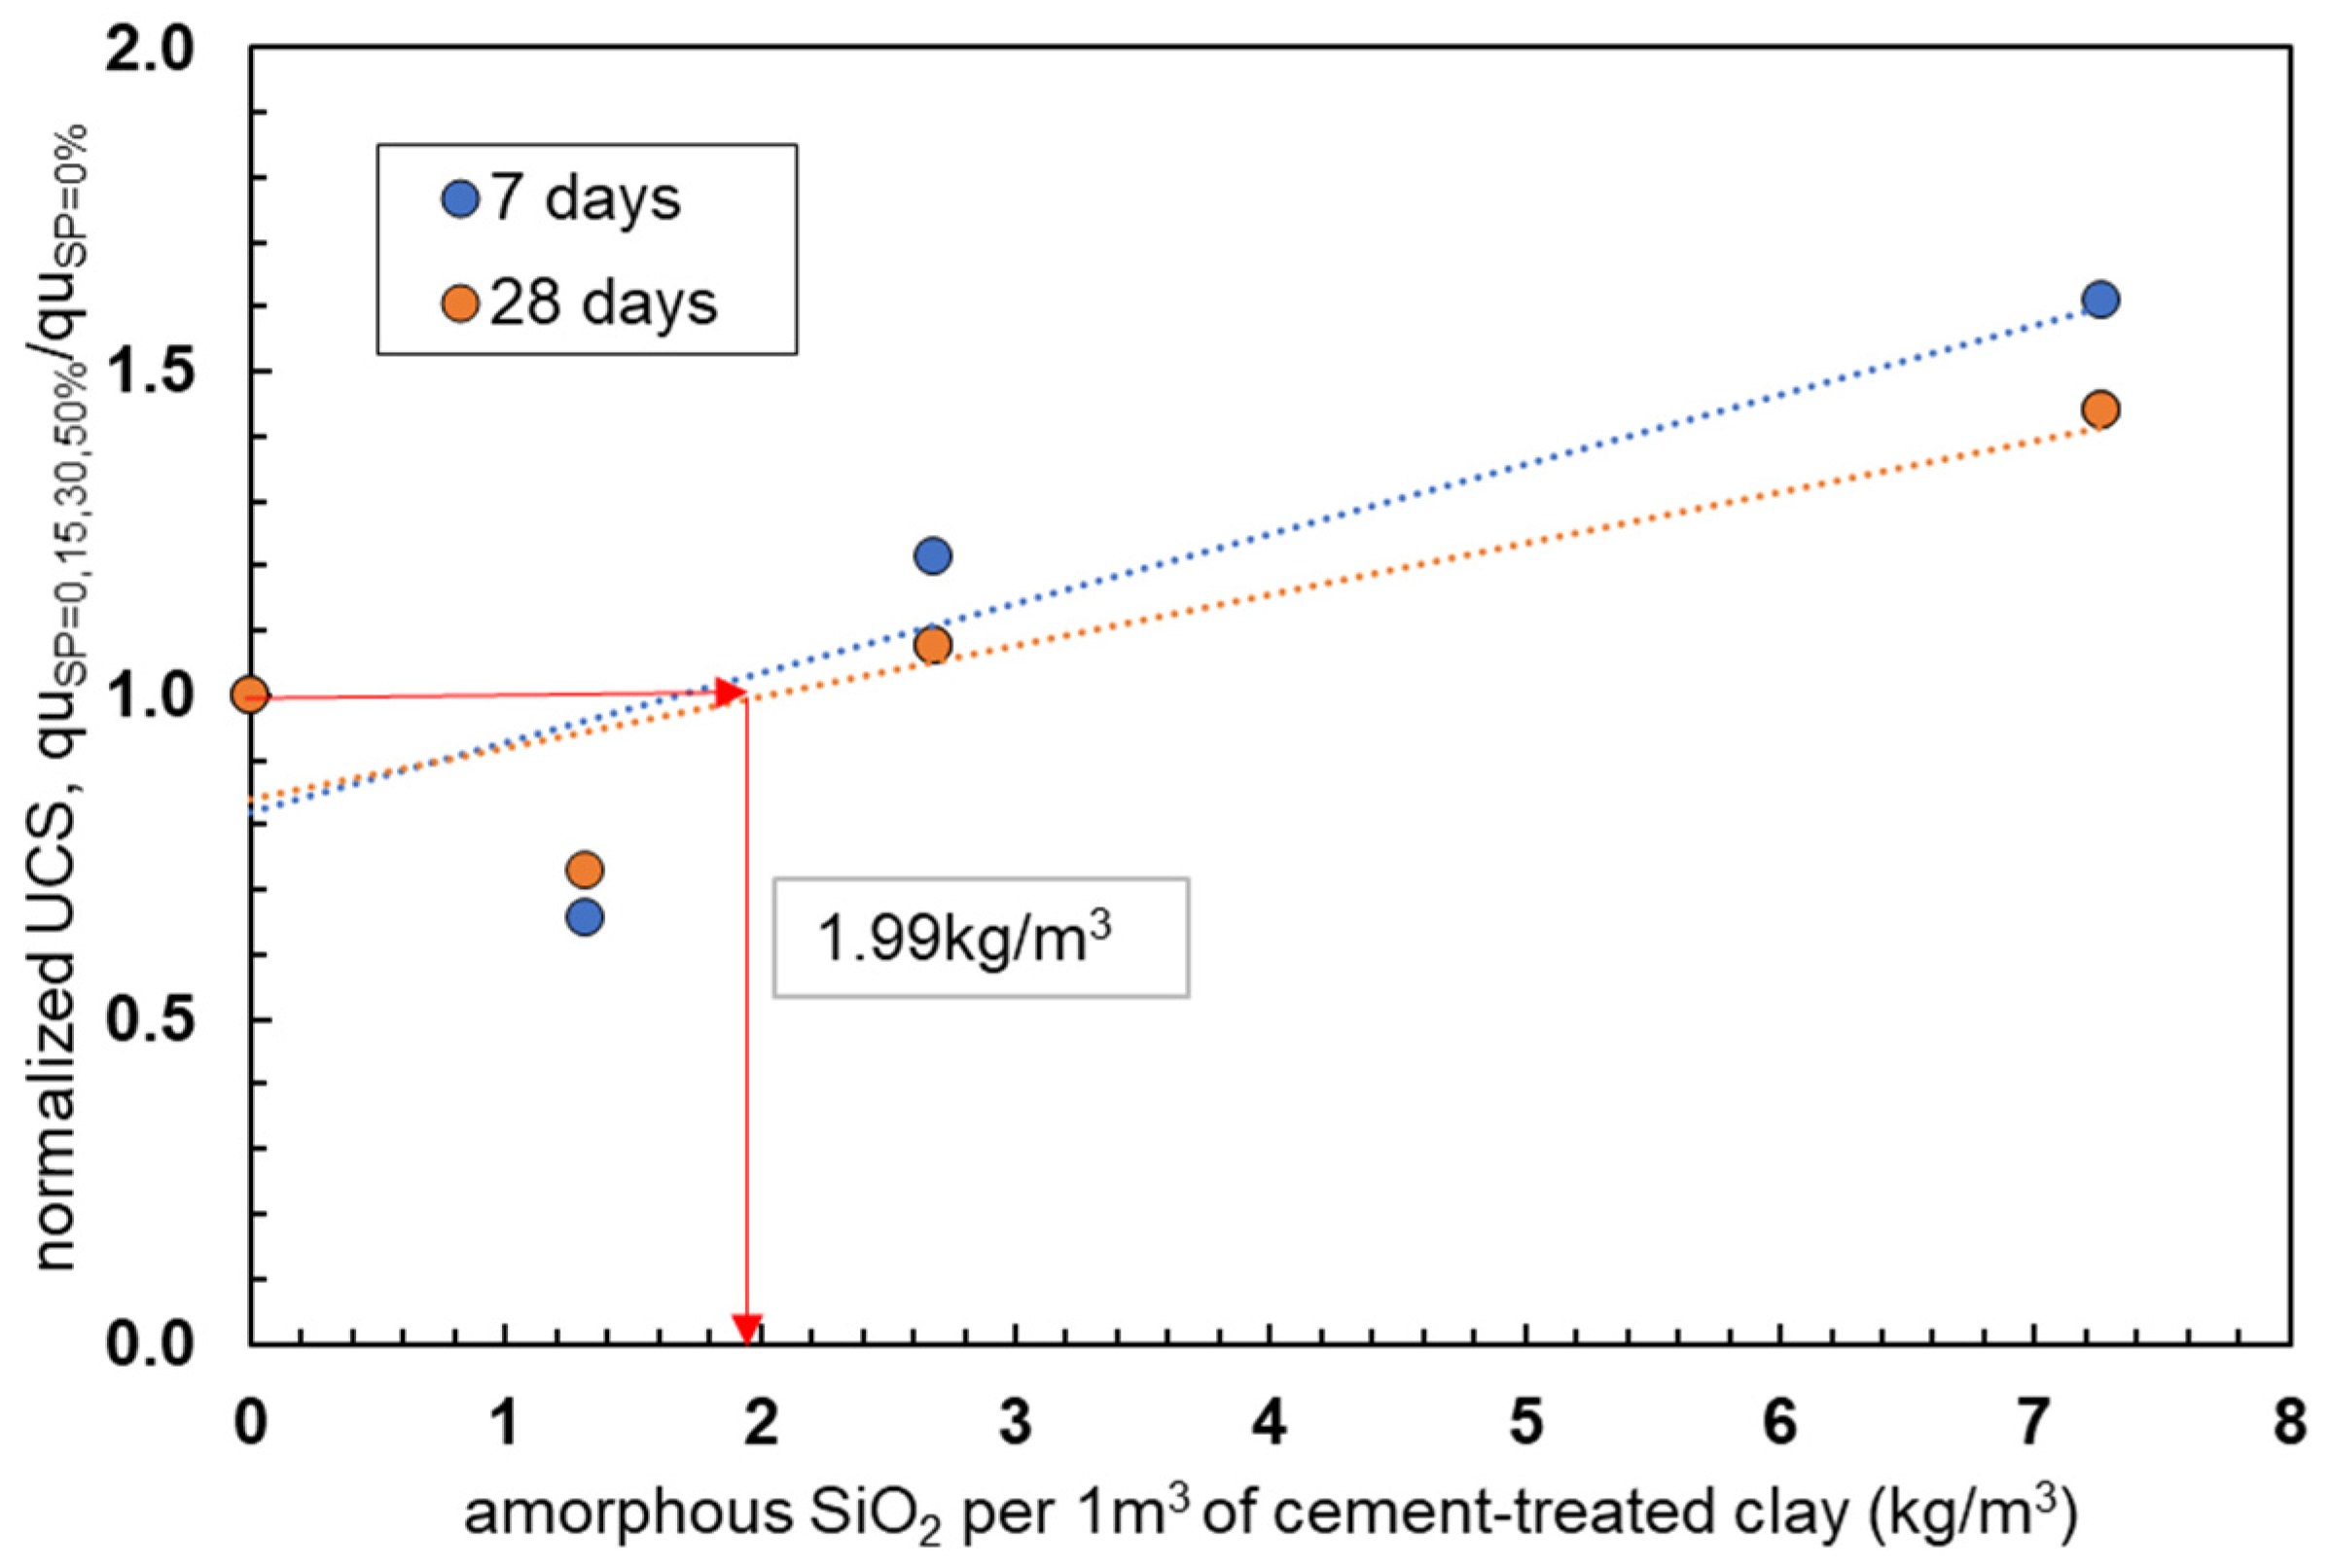
3.3.6. Concentration of Amorphous Silica Required for Strength Improvement

Using Figure 4 and Figure 5, the minimum concentration of amorphous silica required for strength improvement was determined at the point of intersection between an extrapolated line for cases containing inert stone powder and regression line for cases containing reactive stone powder. The inert cases were 1, 4, 5 and 6 for Tokuyama clay and 1c, 4c, 5c and 6c for commercial clay while the reactive cases were 2 and 3 for Tokuyama clay and 2c and 3c for commercial clay. Since the lines met at point (1.7, 0.98), the minimum concentration of amorphous silica required for strength improvement was determined to be 1.7 kg/m3 of cement-treated clay composite. This value is equivalent to the calculated value obtained if we used the value 9.4 mg/g from Section 3.3.4 to compute the minimum amorphous silica concentration per cubic meter of cement-treated clay. As such, the slight increase in UCS of case 4c observed in Figure 5 originated because it contained 1.99 kg/m3 of amorphous silica.
We applied results from our previous paper [26], where the content of stone powder D was increased by 0%, 15%, 30% and 50%, which implied an increase in the amorphous silica concentration, as shown in Table 6. As shown in Figure 8, we further clarified that the minimum amount of stone powder for strength improvement is 1.99 kg/m3. The linear regression lines describe the relationship between the UCS and amorphous silica concentration for 7 and 28 days, as shown in Equations (22) and (23).
q u s p = 0 , 15 , 30 , 50 % q u S P = 0 % = 0.1071 a + 0.8206 ,   R 2 = 0.7189
q u s p = 0 , 15 , 30 , 50 % q u S P = 0 % = 0.079 a + 0.8404 ,   R 2 = 0.7189

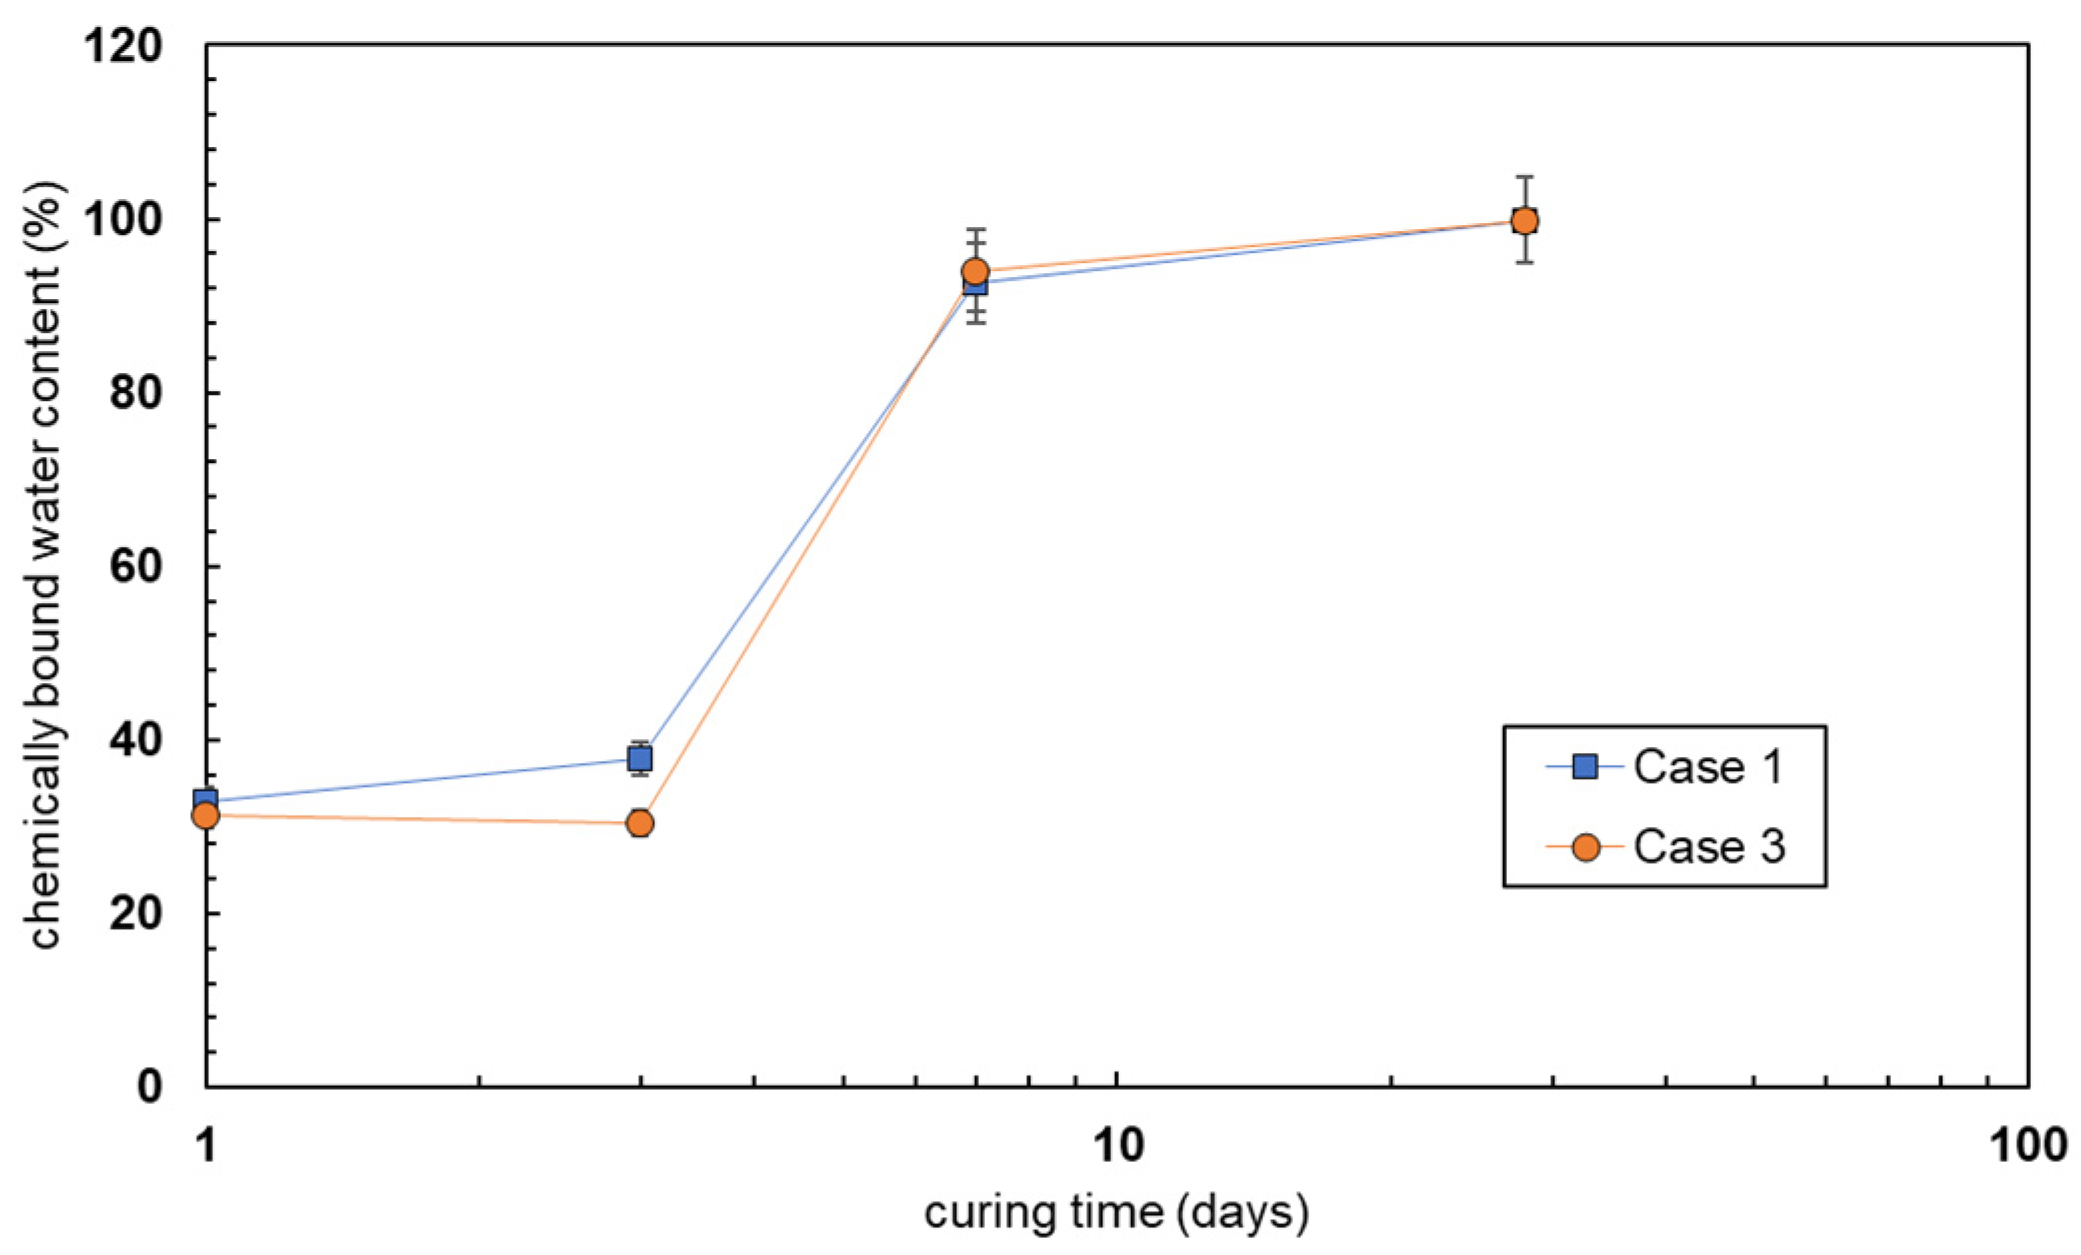
3.3.7. Chemically Bound Water and Calcium Hydroxide Content

As shown in Figure 9, the chemically bound water content of case 1 (control sample) is the same as for case 3 (containing stone powder D). The lower bound water in case 3 at three days is due to the preferential reaction of calcium hydroxide with stone powder D instead of its reaction with the C3A and C4AF phases of cement, which contribute to water binding. Similar results were reported in silica fume activity in concrete [59,60].
In Figure 10, the calcium hydroxide content of case 1 increases with an increase in curing time while that of case 3 decreases at three and seven days and then increases at seven days. On days one and three, the calcium hydroxide content of case 3 is higher than that of case 1 and becomes significantly lower at day 28. For days one and three, stone powder accelerated cement hydration [61,62,63], which led to the production of higher contents of calcium hydroxide in case 3 as compared to case 1. As pozzolanic reactivity began to occur, the calcium hydroxide content in case 3 lowered until its value was lower than that of case 1 at 28 days.

4. Conclusions

This study investigated the chemical and thermal factors influencing the UCS of cement-treated clay–stone powder composites prepared using waste granite rock powder and two clay types. The cement-treated clay–stone powder composites were subjected to physical, mechanical and thermal tests such as flow value, fall cone, UCS and TG-DTA tests. Chemical tests were performed on stone powders of different particle sizes and on micro mica (an inert material): XRF to determine the chemical composition, EC tests to determine the pozzolanic reactivity and NaOH digestion tests to determine the amorphous silica concentration. The studied stone powder improved the UCS of cement-treated clay. However, the strength improvement depended on the size of the stone powder particles. Stone powders D (particle size <20 µm) and E (106–<1 µm) increased the strength of the composite, while powders A (>75 µm), B (40–75 µm) and C (20–40 µm) slightly reduced the strength compared toward that of the control sample without stone powder. The strength improvement in stone powder (Type E) obtained from the quarry was attributed to its Type D component, which constituted 42% of Type E stone powder. Neither the LL nor flow value influenced the strength of cement-treated clay–stone powder composites. However, the pozzolanic reactivity and amorphous silica concentration, which both varied with the stone powder particle size, were found to influence the strength of cement-treated clay–stone powder composites. Stone powders D (<20 µm) and E (<1–106 µm) contained 14.5 mg/g and 11.5 mg/g of amorphous silica, respectively. Their pozzolanic reactivity was independently confirmed, explaining their ability to improve the strength of cement-treated clay. A linear regression relationship between the UCS of the composites and amorphous silica was established. In our work, 9.4 mg/g of amorphous silica was determined to be the minimum amount required for an increment in UCS to occur. TG-DTA results also confirmed the reduction in calcium hydroxide in composites containing stone powder as compared to the control sample. The nucleation and pozzolanic reactivity roles played by stone powder were also confirmed. Since the pozzolanic reactivity of the stone powder resulted from the crushing of rocks at the quarry, it is possible to reuse the material without pre-treatment. This implies that granite quarrying industries in Japan can supply the silt size particles of stone powder to geotechnical engineering projects involving the improvement of dredged clays using cement. Hence, the Basic Act for Establishing a Sound Material-Cycle Society in Japan should be revised to incorporate the reuse of granite stone powder, which substantially contributes to meeting Goal 12 of the Sustainable Development Goals (SDGs).
In this study, powder from granite rocks of igneous origin was used. Studies on powders from rocks of different origins, such as sedimentary and metamorphic, should next be conducted to promote the reuse of stone powder in the production of eco-friendly cement-based geomaterials.

Author Contributions

J.N., conceptualization, methodology, investigation, data curation and writing. T.H., methodology, validation, resources, supervision and writing—review and editing. M.I., validation, supervision and writing—review and editing. All authors have read and agreed to the published version of the manuscript.

Funding

This research was partially funded by the Japan Society for the Promotion of Science Kakenhi Grant-in-Aid for Scientific Research (B) (19H02239).

Institutional Review Board Statement

Not applicable.

Informed Consent Statement

Not applicable.

Data Availability Statement

The supplementary information on how to calculate the chemically bound water and calcium hydroxide contents can be downloaded at: https://doi.org/10.5281/zenodo.6339709. Supplementary Material: Study on the effect of amorphous silica from waste granite powder on the strength development of cement-treated clay–stone powder composites, Equations (S1)–(S12).

Acknowledgments

The authors gratefully acknowledge the guidance and academic support offered by Ryota Hashimoto of the Graduate School of Advanced Science and Engineering, Hiroshima University.

Conflicts of Interest

The authors declare no conflict of interest.

Appendix A

Figure A1. Photographs of stone powder.
Sustainability 14 04073 g0a1
Figure A2. Photographs showing certain test equipment.
Sustainability 14 04073 g0a2
Figure A3. Unconfined compressive strength versus curing time of cement-treated clay–stone powder composites (Tokuyama clay—all cases).
Sustainability 14 04073 g0a3
Figure A4. Unconfined compressive strength versus curing time of cement-treated clay–stone powder composites (commercial clay—all cases).
Sustainability 14 04073 g0a4

References

  1. Kokubu, K.; Sogo, S.; Kawano, H.; Noguchi, T. “Commitee Report: JCI-TC054A, Technical Committee on Aggregate Qualities and Effective Use of Poor Quality Aggregates”, Tokyo. Available online: https://www.jci-net.or.jp/j/jci/study/tcr/tcr2007/54Akotuzai.pdf (accessed on 20 March 2019).
  2. Nayak, S.; Sarvade, P.G. Effect of Cement and Quarry Dust on Shear Strength and Hydraulic Characteristics of Lithomargic Clay. Geotech. Geol. Eng. 2011, 30, 419–430. [Google Scholar] [CrossRef]
  3. US DOT. User Guidelines for Waste and By-Product Materials in Pavement Construction; US DOT: Washington, DC, USA, 1998. Available online: https://www.fhwa.dot.gov/publications/research/infrastructure/structures/97148/toc.cfm (accessed on 20 March 2019).
  4. Bai, S.; Elwert, T.; Jia, S.; Wang, Q.; Liu, T.; Yao, R. Methodologies for evaluating sawability of ornamental granite and relation modeling combining sawability with environmental impacts: An application in a stone industrial park of China. J. Clean. Prod. 2020, 246, 119004. [Google Scholar] [CrossRef]
  5. Ho, D.; Sheinn, A.; Ng, C.; Tam, C. The use of quarry dust for SCC applications. Cem. Concr. Res. 2002, 32, 505–511. [Google Scholar] [CrossRef]
  6. Galetakis, M.; Soultana, A. A review on the utilisation of quarry and ornamental stone industry fine by-products in the construction sector. Constr. Build. Mater. 2016, 102, 769–781. [Google Scholar] [CrossRef]
  7. Ramos, T.; Matos, A.M.; Schmidt, B.; Rio, J.; Sousa-Coutinho, J. Granitic quarry sludge waste in mortar: Effect on strength and durability. Constr. Build. Mater. 2013, 47, 1001–1009. [Google Scholar] [CrossRef]
  8. Mármol, I.; Ballester, P.; Cerro, S.; Monrós, G.; Morales, J.; Sánchez, L. Use of granite sludge wastes for the production of coloured cement-based mortars. Cem. Concr. Compos. 2010, 32, 617–622. [Google Scholar] [CrossRef]
  9. Xiao, Z.-Y.; Xu, W. Assessment of strength development in cemented coastal silt admixed granite powder. Constr. Build. Mater. 2019, 206, 470–482. [Google Scholar] [CrossRef]
  10. Ferrotto, M.F.; Asteris, P.G.; Borg, R.P.; Cavaleri, L. Strategies for Waste Recycling: The Mechanical Performance of Concrete Based on Limestone and Plastic Waste. Sustainability 2022, 14, 1706. [Google Scholar] [CrossRef]
  11. Elseknidy, M.H.; Salmiaton, A.; Shafizah, I.N. A Study on Mechanical Properties of Concrete Incorporating Aluminum Dross, Fly Ash, and Quarry Dust. Sustainability 2020, 12, 9230. [Google Scholar] [CrossRef]
  12. Sojobi, A.; Awolusi, T.; Aina, G.; Oke, O.; Oladokun, M.; Oguntayo, D. Ternary and quaternary blends as partial replacement of cement to produce hollow sandcrete blocks. Heliyon 2021, 7, e07227. [Google Scholar] [CrossRef]
  13. Medina, G.; del Bosque, I.S.; Frías, M.; de Rojas, M.S.; Medina, C. Durability of new recycled granite quarry dust-bearing cements. Constr. Build. Mater. 2018, 187, 414–425. [Google Scholar] [CrossRef]
  14. Gao, X.; Yuan, B.; Yu, Q.; Brouwers, H. Characterization and application of municipal solid waste incineration (MSWI) bottom ash and waste granite powder in alkali activated slag. J. Clean. Prod. 2017, 164, 410–419. [Google Scholar] [CrossRef] [Green Version]
  15. Torres, P.M.C.; Fernandes, H.; Olhero, S.; Ferreira, J.M.F. Incorporation of wastes from granite rock cutting and polishing industries to produce roof tiles. J. Eur. Ceram. Soc. 2009, 29, 23–30. [Google Scholar] [CrossRef]
  16. Suits, L.D.; Sheahan, T.; Soosan, T.; Sridharan, A.; Jose, B.; Abraham, B. Utilization of Quarry Dust to Improve the Geotechnical Properties of Soils in Highway Construction. Geotech. Test. J. 2005, 28, 391–400. [Google Scholar] [CrossRef]
  17. Sridharan, A.; Soosan, T.G.; Jose, B.T.; Abraham, B.M. Shear strength studies on soil-quarry dust mixtures. Geotech. Geol. Eng. 2006, 24, 1163–1179. [Google Scholar] [CrossRef]
  18. Okagbue, C.; Onyeobi, T. Potential of marble dust to stabilise red tropical soils for road construction. Eng. Geol. 1999, 53, 371–380. [Google Scholar] [CrossRef]
  19. Al-joulani, N. Effect of Stone Powder and Lime on Strength, Compaction and CBR Properties of Fine Soils. Jordan J. Civ. Eng. 2012, 6, 1–16. Available online: https://www.iiste.org/Journals/index.php/JJCE/article/view/17982 (accessed on 1 June 2019).
  20. Ene, E.; Okagbue, C. Some basic geotechnical properties of expansive soil modified using pyroclastic dust. Eng. Geol. 2009, 107, 61–65. [Google Scholar] [CrossRef]
  21. Pastor, J.L.; Tomás, R.; Cano, M.; Riquelme, A.; Gutiérrez, E. Evaluation of the Improvement Effect of Limestone Powder Waste in the Stabilization of Swelling Clayey Soil. Sustainability 2019, 11, 679. [Google Scholar] [CrossRef] [Green Version]
  22. Abdulrasool, A.S. Strength Improvement of Clay Soil by Using Stone Powder. J. Eng. 2015, 21, 72–84. [Google Scholar]
  23. Cakuru, M.; Tenywa, K.R.; Jjuuko, S. Strength Assessment of Quarry Dust Treated Soil—Reclaimed Asphalt Pavement (Rap) Mixture Strength Assessment of Quarry Dust Treated Soil—Reclaimed Asphalt Pavement (Rap) Mixture. In Advances in Transportation Geotechnics IV; Springer: Cham, Switzerland, 2022; Volume 164, pp. 619–629. [Google Scholar] [CrossRef]
  24. Zhang, Y.; Korkiala-Tanttu, L.K.; Gustavsson, H.; Miksic, A. Assessment for Sustainable Use of Quarry Fines as Pavement Construction Materials: Part I—Description of Basic Quarry Fine Properties. Materials 2019, 12, 1209. [Google Scholar] [CrossRef] [PubMed] [Green Version]
  25. Song, Y.-S.; Kim, K.-S.; Woo, K.-S. Stability of embankments constructed from soil mixed with stone dust in quarry reclamation. Environ. Earth Sci. 2011, 67, 285–292. [Google Scholar] [CrossRef]
  26. Nakayenga, J.; Cikmit, A.A.; Tsuchida, T.; Hata, T. Influence of stone powder content and particle size on the strength of cement-treated clay. Constr. Build. Mater. 2021, 305, 124710. [Google Scholar] [CrossRef]
  27. Medina, G.; del Bosque, I.S.; Frías, M.; de Rojas, M.S.; Medina, C. Mineralogical study of granite waste in a pozzolan/Ca(OH)2 system: Influence of the activation process. Appl. Clay Sci. 2017, 135, 362–371. [Google Scholar] [CrossRef]
  28. Benezet, J.; Benhassaine, A. Grinding and pozzolanic reativity of quartz powders. Powder Technol. 1999, 105, 167–171. [Google Scholar] [CrossRef]
  29. Barbosa, J.M.; de Carvalho, J.M.F.; do Carmo e Silva, K.D.; Peixoto, R.A.F.; Brigolini, G.J.S. Influence of grinding on the pozzolanic activity of granite residue. REM-Int. Eng. J. 2019, 72, 395–404. [Google Scholar] [CrossRef] [Green Version]
  30. Mirzahosseini, M.; Riding, K.A. Influence of different particle sizes on reactivity of finely ground glass as supplementary cementitious material (SCM). Cem. Concr. Compos. 2015, 56, 95–105. [Google Scholar] [CrossRef]
  31. Palaniandy, S.; Azizli, K.A.M.; Hussin, H.; Hashim, S.F.S. Study on mechanochemical effect of silica for short grinding period. Int. J. Miner. Process. 2007, 82, 195–202. [Google Scholar] [CrossRef]
  32. Yamashita, E.A.; Cikmit, A.G.; Kang, O.T.; Kalim, P.; Tsuchida, T. The effect of sand content on strength development of cement-treated soil with different initial water content. In Proceedings of the 28th International Ocean and Polar Engineering Conference, Sapporo, Japan, 10–15 June 2018. [Google Scholar]
  33. Tsuchida, T.; Tang, Y.X. Estimation of compressive strength of cement-treated marine clays with different initial water contents. Soils Found. 2015, 55, 359–374. [Google Scholar] [CrossRef] [Green Version]
  34. Chian, S.C.; Chim, Y.Q.; Wong, J.W. Influence of sand impurities in cement-treated clays. Géotechnique 2017, 67, 31–41. [Google Scholar] [CrossRef]
  35. Kang, G.; Tsuchida, T.; Tang, T.; Kalim, T. Consistency measurement of cement-treated marine clay using fall cone test and Casagrande liquid limit test. Soils Found. 2017, 57, 802–814. [Google Scholar] [CrossRef]
  36. Kang, G.; Cikmit, A.A.; Tsuchida, T.; Honda, H.; Kim, Y.-S. Strength development and microstructural characteristics of soft dredged clay stabilized with basic oxygen furnace steel slag. Constr. Build. Mater. 2019, 203, 501–513. [Google Scholar] [CrossRef]
  37. Cikmit, A.A.; Tsuchida, T.; Kang, G.; Hashimoto, R.; Honda, H. Particle-size effect of basic oxygen furnace steel slag in stabilization of dredged marine clay. Soils Found. 2019, 59, 1385–1398. [Google Scholar] [CrossRef]
  38. Cikmit, A.A.; Tsuchida, T.; Hashimoto, R.; Honda, H.; Kang, G.; Sogawa, K. Expansion characteristic of steel slag mixed with soft clay. Constr. Build. Mater. 2019, 227, 116799. [Google Scholar] [CrossRef]
  39. Japanese Geotechnical Society. JGS 0131 Test method for particle size distribution of soils (JIS A1204). In Laboratory Testing Standards of Geomaterials Vol.1; Japanese Geotechnical Society: Tokyo, Japan, 2015. [Google Scholar]
  40. Japanese Geotechnical Society. JGS 0142 Test method for liquid limit of soils by the fall cone. In Laboratory Testing Standards of Geomaterials Table of Contents Vol.3; Japanese Geotechnical Society: Tokyo, Japan, 2017. [Google Scholar]
  41. Japanese Geotechnical Society. JGS 0511 Method for unconfined compression test of soils (JIS A1216). In Laboratory Testing Standards of Geomaterials Vol.1; Japanese Geotechnical Society: Tokyo, Japan, 2015. [Google Scholar]
  42. Velázquez, S.; Monzó, J.M.; Borrachero, M.V.; Payá, J. Assessment of Pozzolanic Activity Using Methods Based on the Measurement of Electrical Conductivity of Suspensions of Portland Cement and Pozzolan. Materials 2014, 7, 7533–7547. [Google Scholar] [CrossRef] [Green Version]
  43. Cedrim, F.A.; Silva, G.A.D.O.E.; Santos, T.A.; Ribeiro, D.V. Pozzolanicity Evaluation of Mineral Additions by Electrical Conductivity Measurements. Mater. Sci. Forum 2016, 881, 239–244. [Google Scholar] [CrossRef]
  44. Luxán, M.; Madruga, F.; Saavedra, J. Rapid evaluation of pozzolanic activity of natural products by conductivity measurement. Cem. Concr. Res. 1989, 19, 63–68. [Google Scholar] [CrossRef]
  45. Maximilien, S.; Péra, J.; Chabannet, M. Study of the Reactivity of Clinkers. Cem. Concr. Res. 1997, 27, 63–73. [Google Scholar] [CrossRef]
  46. Saccone, L.; Conley, D.J.; Koning, E.; Sauer, D.; Sommer, M.; Kaczorek, D.; Blecker, S.W.; Kelly, E.F. Assessing the extraction and quantification of amorphous silica in soils of forest and grassland ecosystems. Eur. J. Soil Sci. 2007, 58, 1446–1459. [Google Scholar] [CrossRef]
  47. Krausse, G.L.; Schelske, C.L.; Davis, C.O. Comparison of three wet-alkaline methods of digestion of biogenic silica in water. Freshw. Biol. 1983, 13, 73–81. [Google Scholar] [CrossRef] [Green Version]
  48. Ho, L.S.; Nakarai, K.; Eguchi, K.; Sasaki, T.; Morioka, M. Strength development of cement-treated sand using different cement types cured at different temperatures. MATEC Web Conf. 2018, 195, 01006. [Google Scholar] [CrossRef] [Green Version]
  49. Suits, L.D.; Sheahan, T.; Lorenzo, G.; Bergado, D.; Soralump, S. New and Economical Mixing Method of Cement-Admixed Clay for DMM Application. Geotech. Test. J. 2006, 29, 54–63. [Google Scholar] [CrossRef]
  50. Polidori, E. Relationship Between the Atterberg Limits and Clay Content. Soils Found. 2007, 47, 887–896. [Google Scholar] [CrossRef] [Green Version]
  51. Sivapullaiah, P.V.; Prashanth, J.P.; Sridharan, A.; Narayana, B.V. Reactive silica and strength of fly ashes. Geotech. Geol. Eng. 1998, 16, 239–250. [Google Scholar] [CrossRef]
  52. Kim, Y.-T.; Do, T.-H. Effect of bottom ash particle size on strength development in composite geomaterial. Eng. Geol. 2012, 139–140, 85–91. [Google Scholar] [CrossRef]
  53. Zhuravlev, L.T. The surface chemistry of amorphous silica. Zhuravlev model. Colloids Surf. A Physicochem. Eng. Asp. 2000, 173, 1–38. [Google Scholar] [CrossRef] [Green Version]
  54. Armelao, L.; Bassan, A.; Bertoncello, R.; Biscontin, G.; Daolio, S.; Glisenti, A. Silica glass interaction with calcium hydroxide: A surface chemistry approach. J. Cult. Herit. 2000, 1, 375–384. [Google Scholar] [CrossRef]
  55. Filio, J.M.; Sugiyama, K.; Saito, F.; Waseda, Y. Effect of Dry Grinding on the Structures and Physical Properties of Pyrophyllite and Talc by a Planetary Ball Mill. Int. J. Soc. Mater. Eng. Resour. 1993, 1, 140–147. [Google Scholar] [CrossRef]
  56. Tomozawa, M. Amorphous silica. Silicon-Based Mater. Devices 2001, 1, 127–154. [Google Scholar] [CrossRef]
  57. Xing, H.; Yang, X.; Xu, C.; Ye, G. Strength characteristics and mechanisms of salt-rich soil–cement. Eng. Geol. 2009, 103, 33–38. [Google Scholar] [CrossRef]
  58. Torres, M.L.; Garcia-Ruiz, P.A. Lightweight pozzolanic materials used in mortars: Evaluation of their influence on density, mechanical strength and water absorption. Cem. Concr. Compos. 2009, 31, 114–119. [Google Scholar] [CrossRef]
  59. Papadakis, V.G. Effect of fly ash on Portland cement systems. Cem. Concr. Res. 1999, 29, 1727–1736. [Google Scholar] [CrossRef]
  60. Papadakis, V.G. Experimental investigation and theoretical modeling of silica fume activity in concrete. Cem. Concr. Res. 1999, 29, 79–86. [Google Scholar] [CrossRef]
  61. Bentz, D.; Ardani, A.; Barrett, T.; Jones, S.; Lootens, D.; Peltz, M.A.; Sato, T.; Stutzman, P.E.; Tanesi, J.; Weiss, W.J. Multi-scale investigation of the performance of limestone in concrete. Constr. Build. Mater. 2015, 75, 1–10. [Google Scholar] [CrossRef] [Green Version]
  62. Bentz, D. Activation energies of high-volume fly ash ternary blends: Hydration and setting. Cem. Concr. Compos. 2014, 53, 214–223. [Google Scholar] [CrossRef]
  63. Bentz, D.P.; Ferraris, C.F.; Jones, S.Z.; Lootens, D.; Zunino, F. Limestone and silica powder replacements for cement: Early-age performance. Cem. Concr. Compos. 2017, 78, 43–56. [Google Scholar] [CrossRef] [Green Version]
Figure 1. Unconfined compression strength versus curing time of cement-treated clay–stone powder composites (Tokuyama clay).
Sustainability 14 04073 g001
Figure 2. Unconfined compressive strength versus curing time of cement-treated clay–stone powder composites (commercial clay).
Sustainability 14 04073 g002
Figure 3. Relationship between amorphous SiO2 concentration and change in electrical conductivity of materials.
Sustainability 14 04073 g003
Figure 4. Relationship between amorphous SiO2 concentration and normalized unconfined compression strength of cement-treated Tokuyama clay.
Sustainability 14 04073 g004
Figure 5. Relationship between amorphous SiO2 concentration and normalized unconfined compression strength of cement-treated commercial clay.
Sustainability 14 04073 g005
Figure 6. Comparison of the measured UCS and UCS calculated from Equations (18) and (20).
Sustainability 14 04073 g006
Figure 7. Comparison of the measured UCS and UCS calculated from Equations (19) and (21).
Sustainability 14 04073 g007
Figure 8. Relationship between the increase in amorphous SiO2 concentration of stone powder D and normalized unconfined compression strength of cement-treated Tokuyama clay.
Sustainability 14 04073 g008
Figure 9. Calcium hydroxide content of Cases 1 and 3 versus curing time.
Sustainability 14 04073 g009
Figure 10. Calcium hydroxide content of Cases 1 and 3 versus curing time.
Sustainability 14 04073 g010
Table 1. Composition of the cement-treated clay composites (Tokuyama clay).
CaseTokuyama Clay Content (%)C* (%)C (%)SP (%)M (%)Stone Powder Type and Size
1100151500Control sample
2701511300E (106–<1 µm)
3701511300D (<20 µm)
4701511300C (20–40 µm)
5701511300B (40–75 µm)
6701511300A (106–75 µm)
7701511030Micro mica
(1–75 µm)
Table 2. Composition of the cement-treated clay composites (commercial clay).
CaseCommercial Clay Content (%)C*
(%)
C
(%)
SP (%)M (%)Stone Powder Type and Size
1c100151500Control sample
2c701511300E (106–<1 µm)
3c701511300D (<20 µm)
4c701511300C (20–40 µm)
5c701511300B (40–75 µm)
6c701511300A (106–75 µm)
7c701511030Micro mica
(1–75 µm)
Table 3. Chemical element compositions of stone powder, micro mica, Tokuyama clay and commercial clay.
Element (%)E
(106–<1 µm)
D
(<20 µm)
C
(20–40 µm)
B
(40–75 µm)
A (106–75 µm)Micro MicaTokuyama
Clay
Commercial Clay
Si71.16774.28169.94266.70868.28553.855.1161.18
K16.715.68716.83614.4619.3529.07.6117.01
Fe7.5485.5637.42213.3926.985-17.7815.80
Ca3.6473.6414.6684.0194.986-4.914.21
Cl------12.9-
Mg-----26.3--
F-----10.1--
Table 4. Pozzolanic reactivity of stone powder, micro mica and Tokuyama clay.
MaterialSize (µm)Change in Electrical Conductivity (∆mS/cm)Reactivity
Stone powder E106–<10.4variable pozzolanicity
Stone powder D<200.9variable pozzolanicity
Stone powder C20–400.2non-pozzolanic
Stone powder B40–750.2non-pozzolanic
Stone powder A106–75 0.1non-pozzolanic
Tokuyama Clay<750.1non-pozzolanic
Micro mica<750.1non-pozzolanic
Table 5. Quantity of amorphous SiO2 digested from stone powder, micro mica, Tokuyama clay and commercial clay.
Amorphous SiO2 per 1 m3 of Cement-Treated Clay Composites (kg/m3)
MaterialSize (µm)Amorphous SiO2 per 1 g of Material (mg/g)Rate of Amorphization (%)TokuyamaCommercial
Stone powder E106–<111.51.152.484.58
Stone powder D<2014.51.453.135.77
Stone powder C20–4050.51.081.99
Stone powder B40–751.50.150.320.60
Stone powder A106–7520.20.430.80
Micro mica<750000
Tokuyama clay<750000
Commercial clay<750000
Table 6. Composition of cement-treated clay–stone powder D composites (extracted from Nakayenga et al. (2021) [31]).
Cement Content, C (%)Stone Powder Content (%)Mass of Stone Powder D (kg/m3)Amorphous Silica Concentration (kg/m3)
2000.000.00
201590.561.31
2030184.362.67
2050500.607.26
Publisher’s Note: MDPI stays neutral with regard to jurisdictional claims in published maps and institutional affiliations.

