1. Introduction
In order to achieve the goals of the Paris climate agreement, a massive expansion of renewable energies will be necessary in the coming years [
1]. This will inevitably lead to more points of contact between people and renewable energy systems. The physical impact of renewable energy technologies (RETs) on a place can be perceived of as an interference with the personal meanings that are associated with that location by individuals. The changes can make the bonds between person and space that are often latent explicit. Disruption and development affect not only the physical aspects of places, but also the social networks that are sources of support to individuals. For the surrounding communities, energy projects can provide benefits, but they can also initiate significant conflicts [
2].
It has been shown that there is a fundamental relationship between the structures of cognitive processes (e.g., memory) and the production of written or verbal discourse [
3]. Place meanings and people–place relations in speech and interaction are dynamically and strategically constructed. Place dynamics can be researched through the discursive research approach, which addresses two features of the person–place bond: (1) The social dimension of place meaning; and (2) The action orientation of everyday discourse [
4]. Studies that use the discursive approach have shown constructions of place-identity features within discourses about intranational migration [
5], environmental threats [
6], and tourism [
7].
In recent years, social media has become integrated into many aspects of our daily language use through the sharing and interaction with online content and through connections between people. Social media has experienced tremendous growth in its user base and has influenced public discourse and communication in society [
8]. One example of social media shaping offline language is one of the German youth words of the year, 2021, which was, “Wednesday”, which was made popular through the meme: “It is Wednesday, my dudes” (according to Rowan [
9], memes may be defined as “sets of images that are normally accompanied by an amusing text that may or may not be directly related to the image”). Furthermore, as platforms for interpersonal exchange, social media content often conveys information about the user’s emotional state, and judgments or evaluations of a certain topic [
10]. Despite the importance that social media has for modern discourse, to the best of the authors’ knowledge, no studies have yet investigated place relationships in the context of RETs on social media. We seek to fill this research gap by examining the potential relationship between the sentiments that are articulated in Instagram content that is related to RETs and places.
Therefore, this article addresses the following research questions: Which places do people associate with RETs on Instagram posts? How is the place connected to the emotions and cognitions towards RETs in Instagram posts?
Previous findings from various disciplines have confirmed that emotions are as important as cognitive information in online and interpersonal communication [
11]. The common goal of both cognitive and affective information is to make an impact on the message receiver. Furthermore, it has been shown that affective information could be transferred through computer-mediated communication [
12]. Investigating the relationship between people and places is a complex study, as many variables are included. The goals of this research are: (1) To increase the understanding of how the place level is used to describe RETs on Instagram; and (2) To analyze the cognitive and emotional words that are linked to the scales of place (from local to global) that describe the RETs on Instagram. The study of people–place relations on Instagram provides insights into both the affective and cognitive factors in the study of the public perception of energy technologies. Online platforms, such as Instagram, allow free social interactions and conversations, and they provide a lens through which to assess the competing visions on different energy-related public issues [
8]. Emotions and cognition-related variables have an explanatory power in relation to energy-related decisions [
13]. Affective reactions to energy technologies influence the way that people look for information, their energy technology preferences, and their behavioral responses to energy projects [
14]. Thus, Instagram can be a driver of the use of renewable energy, and it plays a role not only in shaping the perceptions of various technologies, but also in influencing the intentions of people to use renewable energy sources [
15]. However, so far, only a small number of studies have investigated people–place relationships in the context of the energy transition via online content. To address this research gap, this study aims to increase the understanding of people–place bonds by investigating the relationship between Instagram posts at the place level, and the sentiments that are dependent on different energy infrastructures.
Furthermore, the study highlights how these factors are differentially linked to several scales of place by the words that are used on Instagram. This investigation is particularly relevant for visually focused social media platforms, such as Instagram, since a common criticism of RETs is their negative visual impact on the landscape [
16]. This paper applies the sociocognitive approach (SCA) to the investigation of the language in Instagram posts. An SCA to discourse applies the general theory of social constructionism, which holds that social members construct social reality. Thereby, the mental constructions are understood as mental representations that are implemented by the brain. It is these mental processes that are analyzed in the contemporary advances in the cognitive sciences [
17]. The paper provides insights into individual considerations of RETs on Instagram, which contributes to a better understanding of the emotions and cognitions that are related to RETs at different place levels. Furthermore, the paper provides knowledge into which specific emotions and/or cognitions are linked to a specific renewable energy source, from local to planet place levels.
The remainder of this article is structured as follows: In
Section 2, “Theoretical background”, we address the prevailing theories on renewable energies, place relations, emotions, and cognitions;
Section 3, “Method and Procedures”, explains the methodology that was used to obtain and analyze the data;
Section 4, “Results”, describes the sentiment, content, and mapping analyses of the dataset; and
Section 5, “Finding Overview and Discussion”, presents an overview of the results and the discussion.
3. Method and Procedures
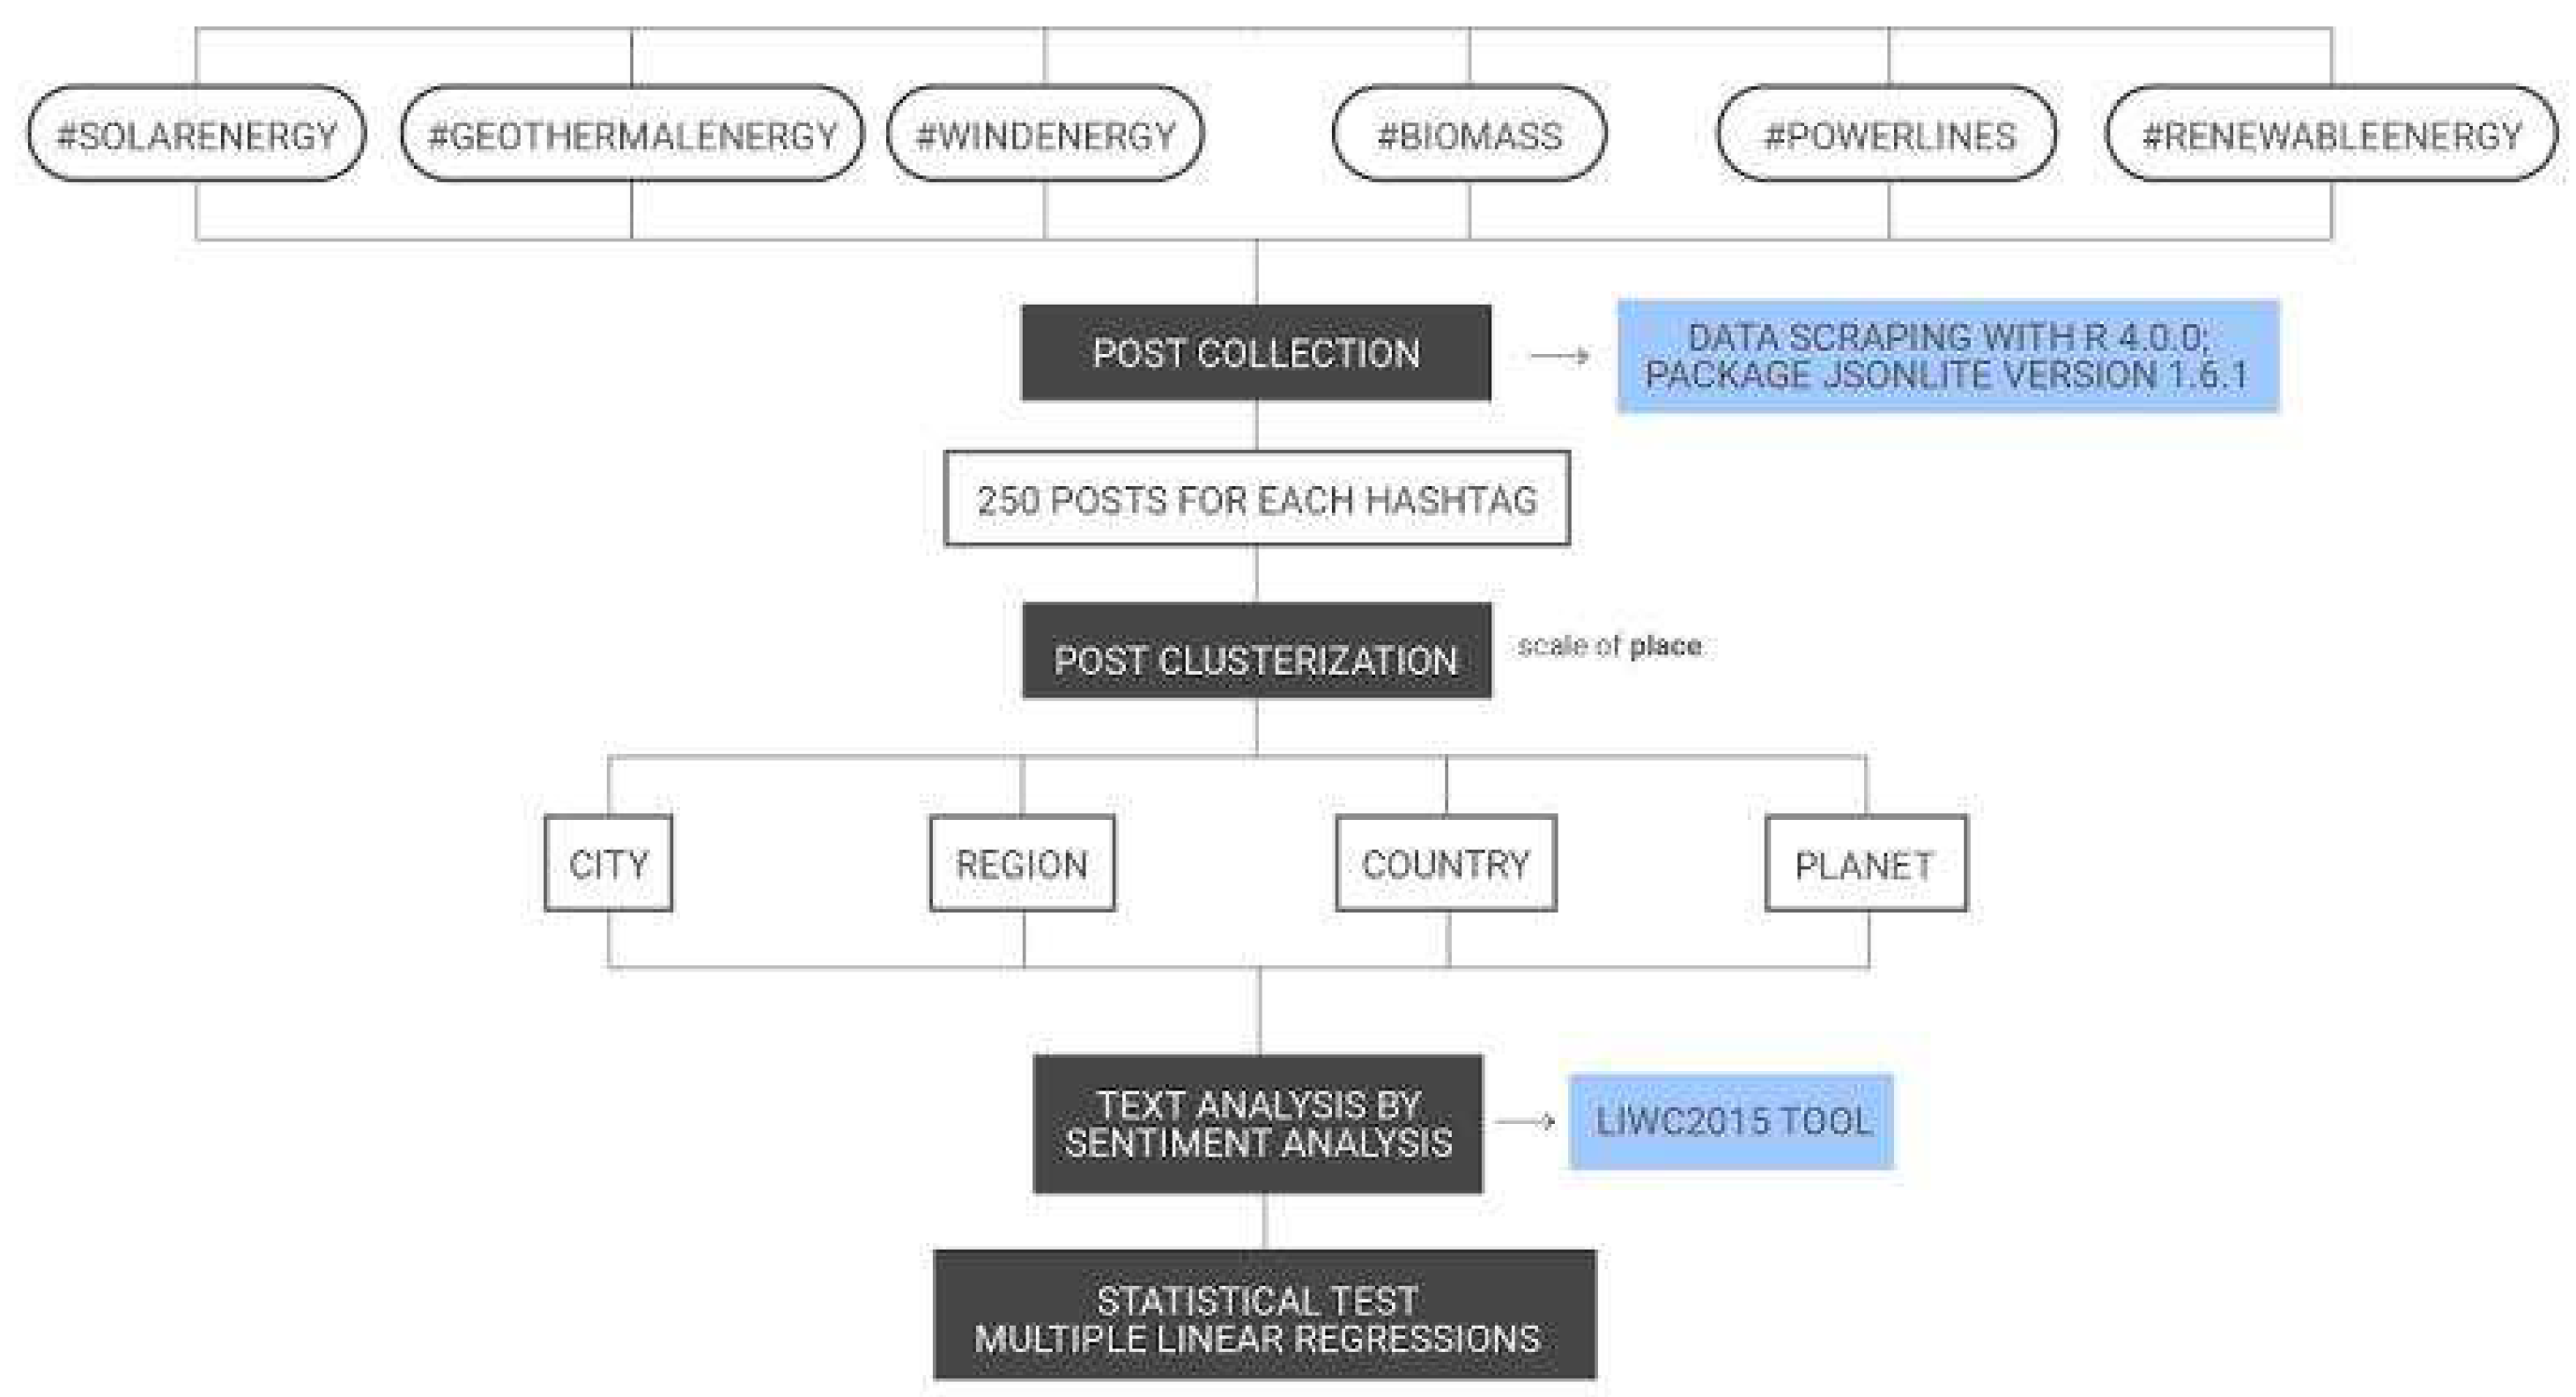
This study provides a summary of the linguistic associations that are elicited by wind, solar, geothermal energies, powerlines, and biomass on Instagram by using the text from captions and hashtags. The central idea is to analyze the words, the places, and their connection, in order to understand how place scales are linked to the respective RETs that are named. The element of analysis can be broken down into a text analysis and the geolocalization of the posts through the mapped places. The method that was used to obtain and analyze the data followed a precise scheme, which is shown in
Figure 1.
First, a total of 250 posts for each selected hashtag were scraped by using R, Version 4.0.0, and the Jsonlite package (Version 1.6.1). The hashtags that were selected were as follows: #windenergy; #solarenergy; #geothermalenergy; #biomass; #powerlines; and #renewableenergy, which resulted in 1500 posts in total. We decided to use these specific RET hashtags (wind, biomass, geothermal, etc.) because they have strong local penetrations, and they have become subjects that are highly considered and discussed by the communities [
42]. The solar hashtag was added because of its broad distribution, even though it is not conflict-related, as are the others. Powerlines are central for energy infrastructure and are often contested, and, thus, they were also included. To gain an overall overview, we integrated the hashtag, #renewableenergy. In the second step, we coded the posts with regard to four place categories (city, region, country, and planet) on the basis of the available information in the hashtags, the place geotags, and the captions. One author categorized all of the posts (1500) into the categories. A second author coded 20% of the posts, for a total of 300 posts, independently from the first author. The inter-rater reliability achieved satisfactory significance (85.7%) between the two coders. If an association was not categorized to the same category by both authors, a discussion ensued to find a common and adequate solution. We repeated this procedure until all of the places were assigned to one category by common accord. At times, the users mentioned several different places (e.g., #Sydney, #Tokyo, #Canada). In these cases, all of the places were coded. In the end, 821 posts mentioned a place. The following sections explain, in detail, all of the steps of the applied method/procedure.
3.1. Data Source: Scraping Data from Instagram Posts
Instagram provides metadata, such as usernames, the time and date of creation, captions, comments (and the user and time information for comments), tags, and likes, as well as location information when users have geotagged their posts. These metadata fields of public posts are publicly available to not only researchers, but also to other Instagram users, corporations, or anyone who accesses Instagram via either the app or third-party tools [
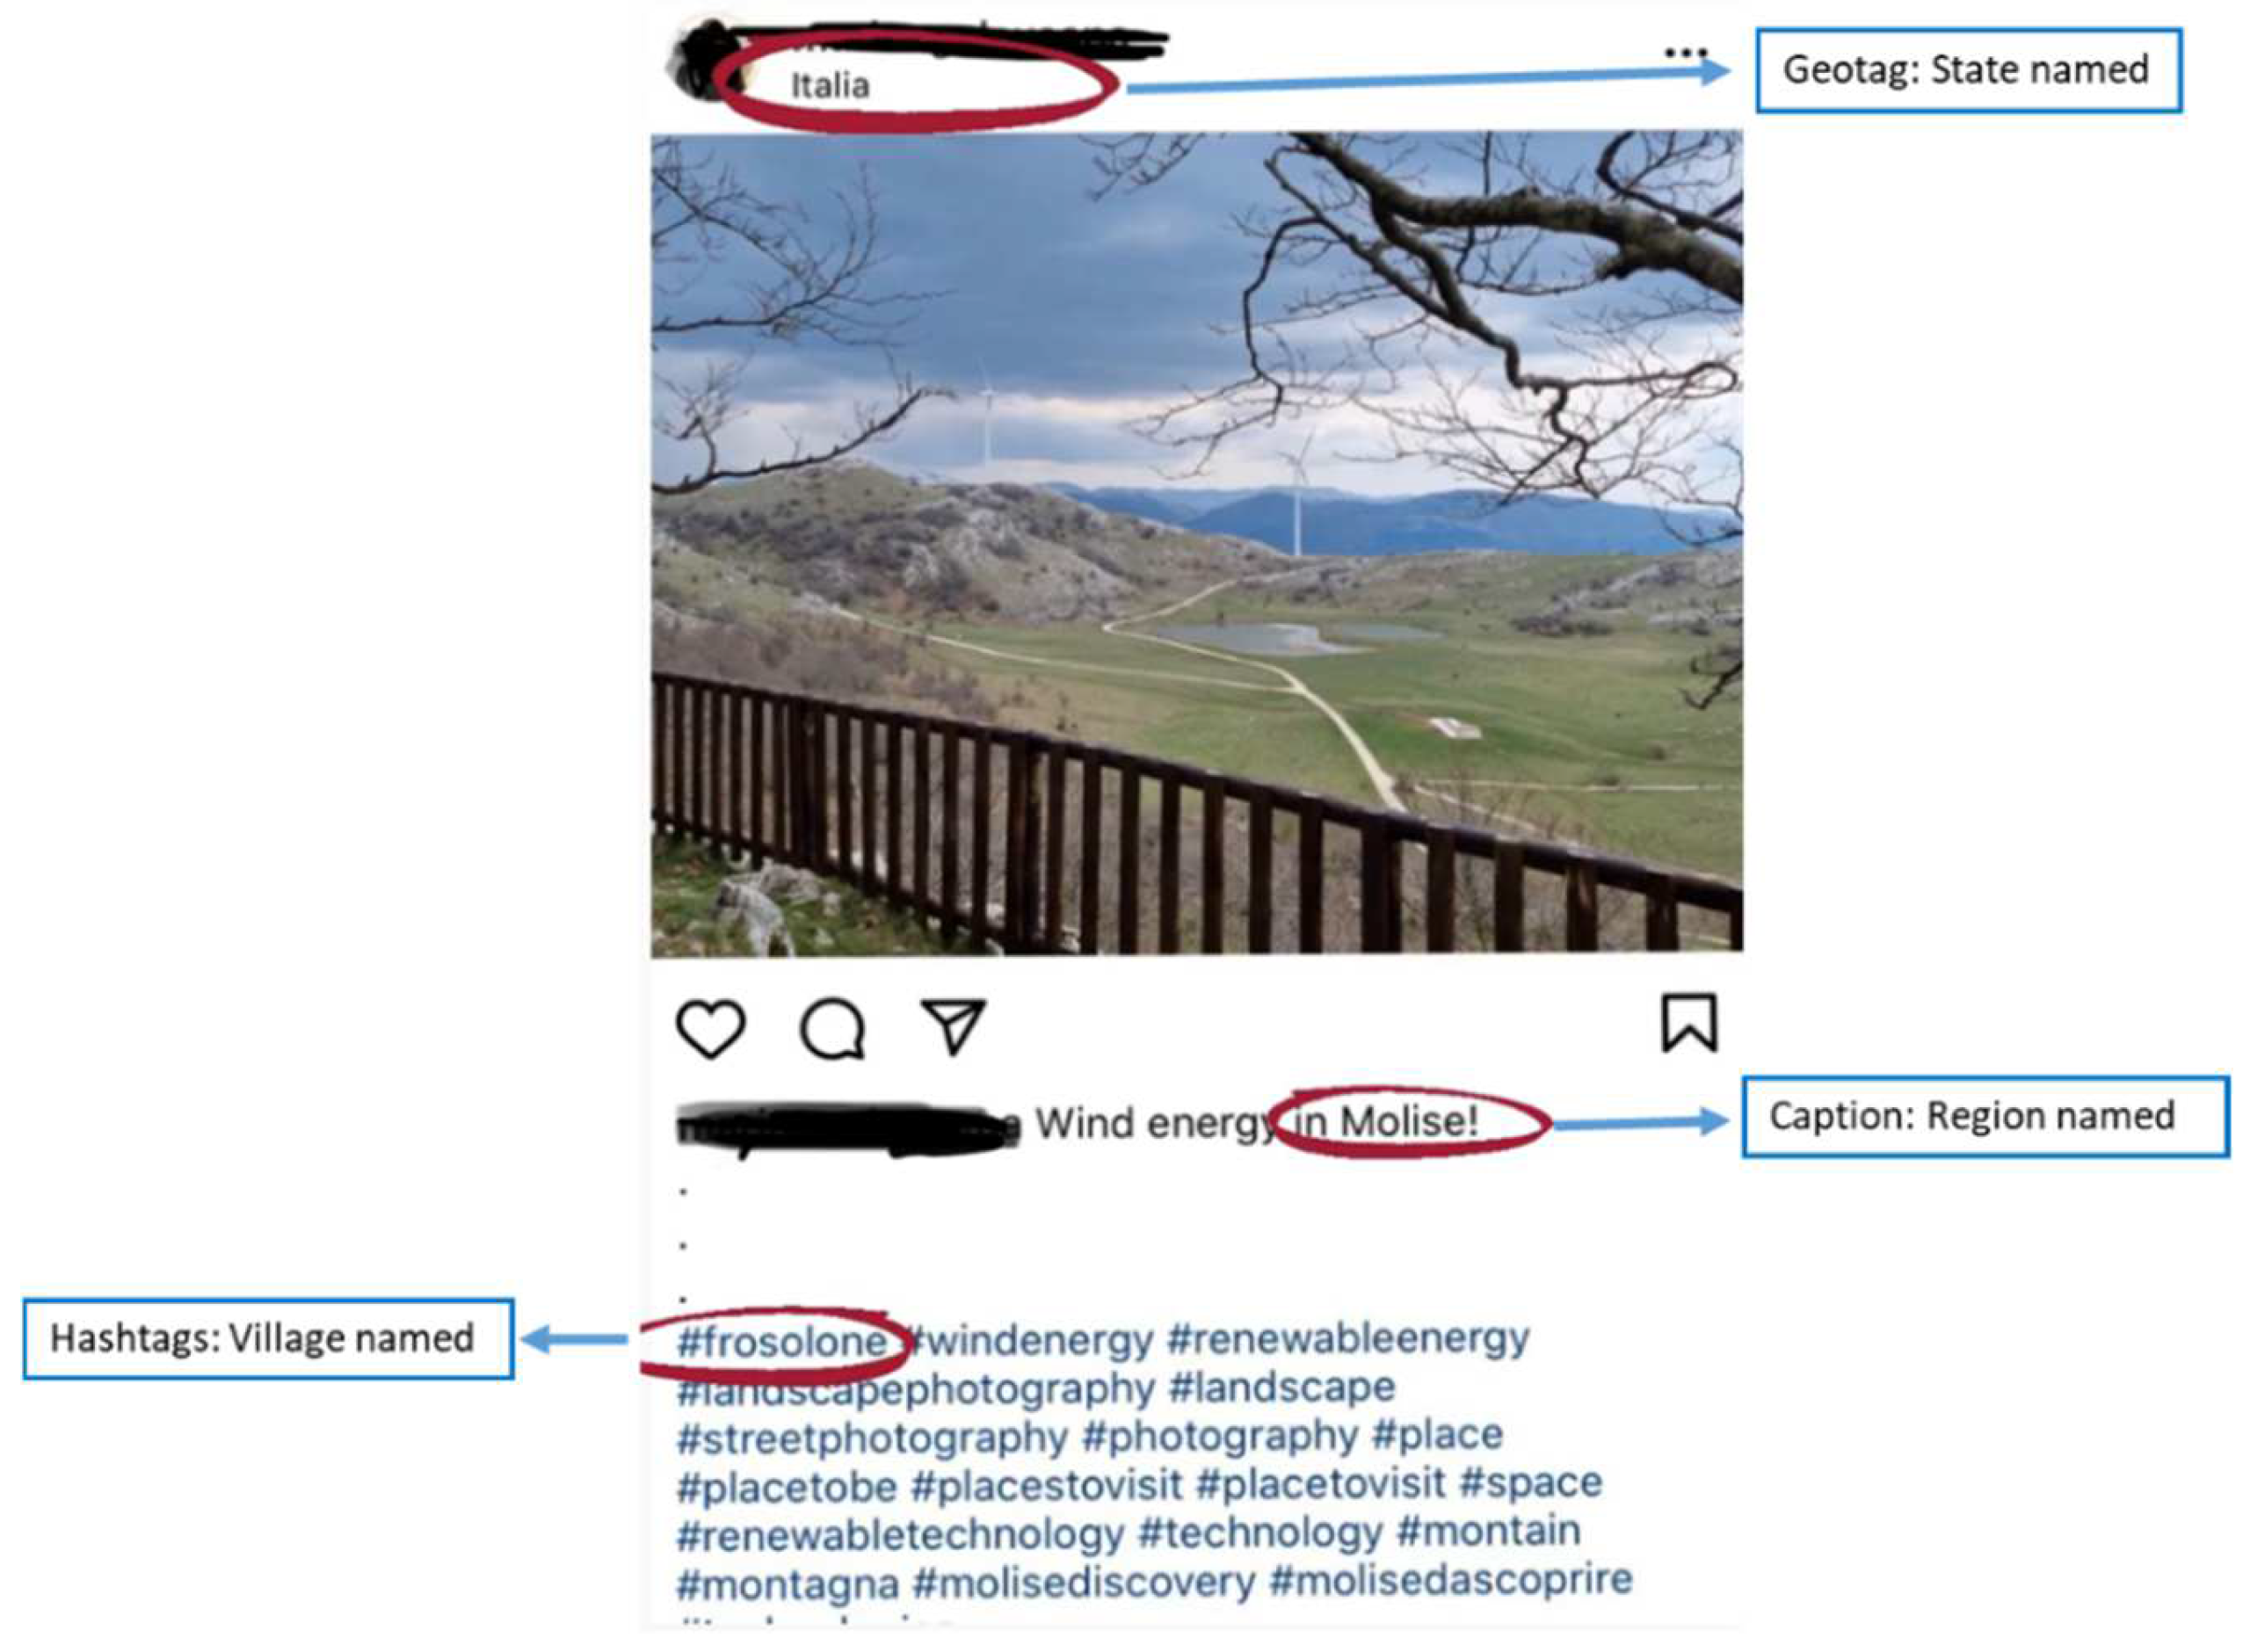
43]. With this data, the present research aims to provide both quantitative and qualitative analyses. The quantitative analysis maps the posts on the basis of the places that are named in the hashtags, captions, and/or geotags. The qualitative analysis investigates the contents of the posts in the captions and hashtags. On Instagram, it is possible to geotag a location from the databases of predefined places, or by naming the location oneself. In either case, coordinates are included in the post along with the location name and an identifier. The information that is considered here is the location that was provided by the user’s geotag (if provided), the caption (if provided), and the hashtag (if provided).
Figure 2 presents an example of an Instagram post and the information that it contains, which includes a picture, an ID name, a place in the geotag, and a caption (which includes the hashtags). Going into more details, the example names three places: a state, a region, and a city. For this reason, it will be included in each of the place category groups. Because of the vast number of Instagram posts, a pragmatic decision was made to limit the number of crawled posts. The 1500 posts (the 250 most recent posts for each hashtag) that were used in this study were scraped from public Instagram accounts (without privacy restrictions) on 17 September 2020. We chose to sample 250 posts for each hashtag because we expected a small effect size (see, for example, [
44]). We performed manual post scraping, which is not feasible over a large number of posts. Instagram restricts the number of posts that can be scraped for free, and it does not allow crawling for specific timeframes. As such, crawling a relatively small number of the most recent posts per hashtag is the next best alternative. Furthermore, data collection by time series would not have been possible considering that the amounts of the daily published posts per hashtag are very different. To achieve the same number of posts per hashtag, the dataset was filtered on the “recent”, and not on the “most popular”, posts at the moment of scraping. The advantages of using Instagram for this research are: (i) The number of words that is used in the caption is unlimited, which is contrary to other platforms (e.g., Twitter), and this an important advantage for the purpose of this research, which is based on the analysis of text. In detail, the length of the 1500 posts is: M = 63.72 and SD = 51.72. The length varies from M = 47.56 for the #powerlines posts, to M = 73.26 for the #windenergy posts. In addition, we have made another validation step by scraping 30% of the posts, for a total of 450 posts. We evaluated them with regard to their lengths. In this case, the length of the posts is: M = 67.8 and SD = 49.15; (ii) Instagram is known for its strong use of hashtags, both as descriptions of pictures/videos, and as search terms for particular topics [
45]. The extensive use of hashtags allows us to study the sets of words that are associated with the RET descriptions; (iii) Instagram, as a web source, has never been used to study RETs. While we are aware of the fact that Instagram is social media for sharing videos and pictures, as well as text, we want to clarify that the analyses of this paper are focused on the analytical procedure of the text, and not on the images. Since this paper focuses on linguistic and mental word associations with regard to RETs, an analysis of the images would not have provided useful insight.
3.2. Mapping the Instagram Post
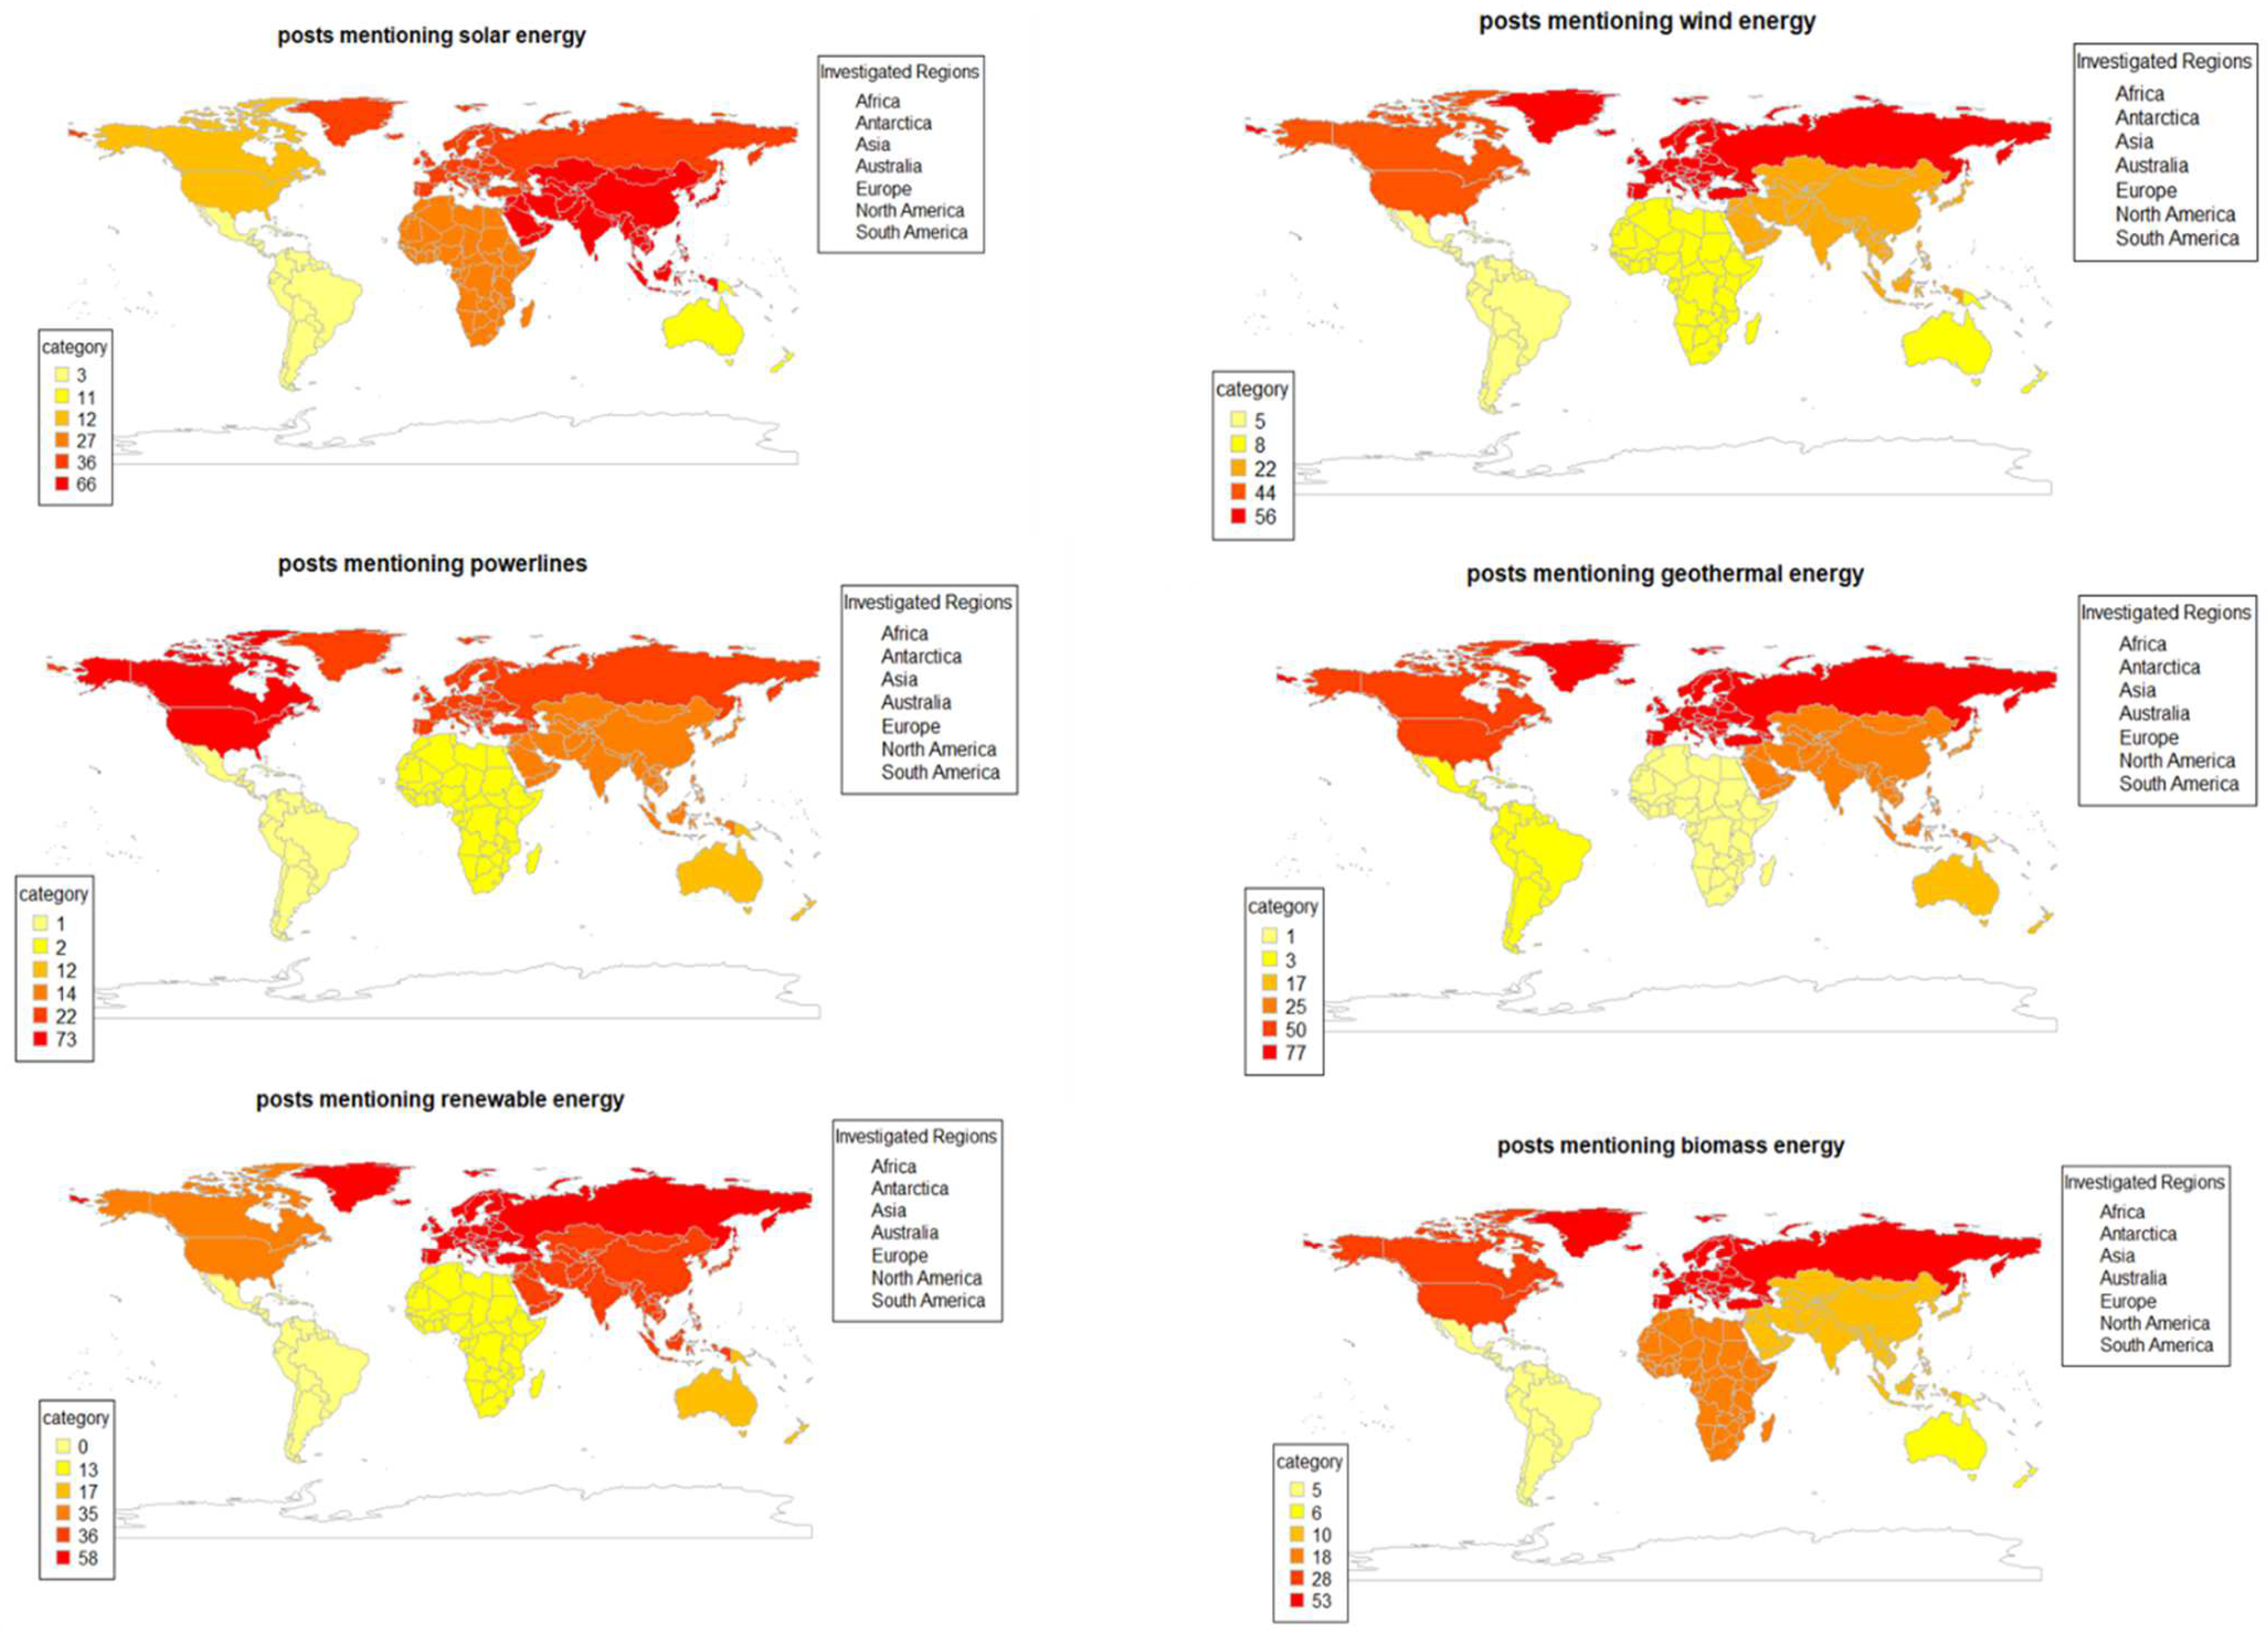
The posts were mapped using the “rworldmap” R package. Thereby, we merged the map by using the region level (which consists of Africa, Australia, Asia, North America, South America, Europe, and Antarctica) with our place-coded dataset. This resulted in six maps, one for each hashtag. The maps show how often a hashtag (e.g., #windenergy) was used in the different regions. For example, in terms of the solar power hashtag, 26 posts mentioned Africa (or places within Africa), 66 mentioned Asia, 12 mentioned North America, 3 mentioned South America, 12 mentioned Australia, and 36 mentioned Europe.
3.3. Sentiment Analysis with LIWC
A sentiment analysis represents a systematic computer-based analysis of written text or speech excerpts for the purpose of extracting the attitude of the author towards specific topics. It provides a fine-grained examination that aims to establish the overall orientation (positive or negative) and intensity (weak or strong) of the sentiments that are expressed by the statements [
46]. The Linguistic Inquiry and Word Count software (LIWC) [
47] is a popular text analysis tool for researchers. It is a lexical method with similarities to other methods, such as PANAS-t, SASA, and SentiWordNet, etc. [
48]. In this research, the LIWC was used for analyzing the hashtag and caption texts of Instagram posts by using the Version 2015 English dictionary. The latest version captures over 86% of the words that people use in writing and speech. The dictionaries of the tool accommodate numbers, punctuation, and even short phrases. This allows the user to read the “Internet slang” language that is common on Twitter, Instagram, and Facebook posts, as well as on SMS (short messaging service). In evaluating the program, the authors of the software analyzed the degree to which language varies across settings and, since 1986, they have been collecting text samples from a variety of studies. The analyses reflect the utterances of over 80,000 writers or speakers, with a total of over 231 million words.
Table 1 illustrates the emotional and cognitive processes that are included in the analyses. The output of the software is the percentages of the total words within a text. The LIWC2015 output was statistically investigated through the multiple linear regression on JASP 0.12.2.0.
4. Results
4.1. Sample Description
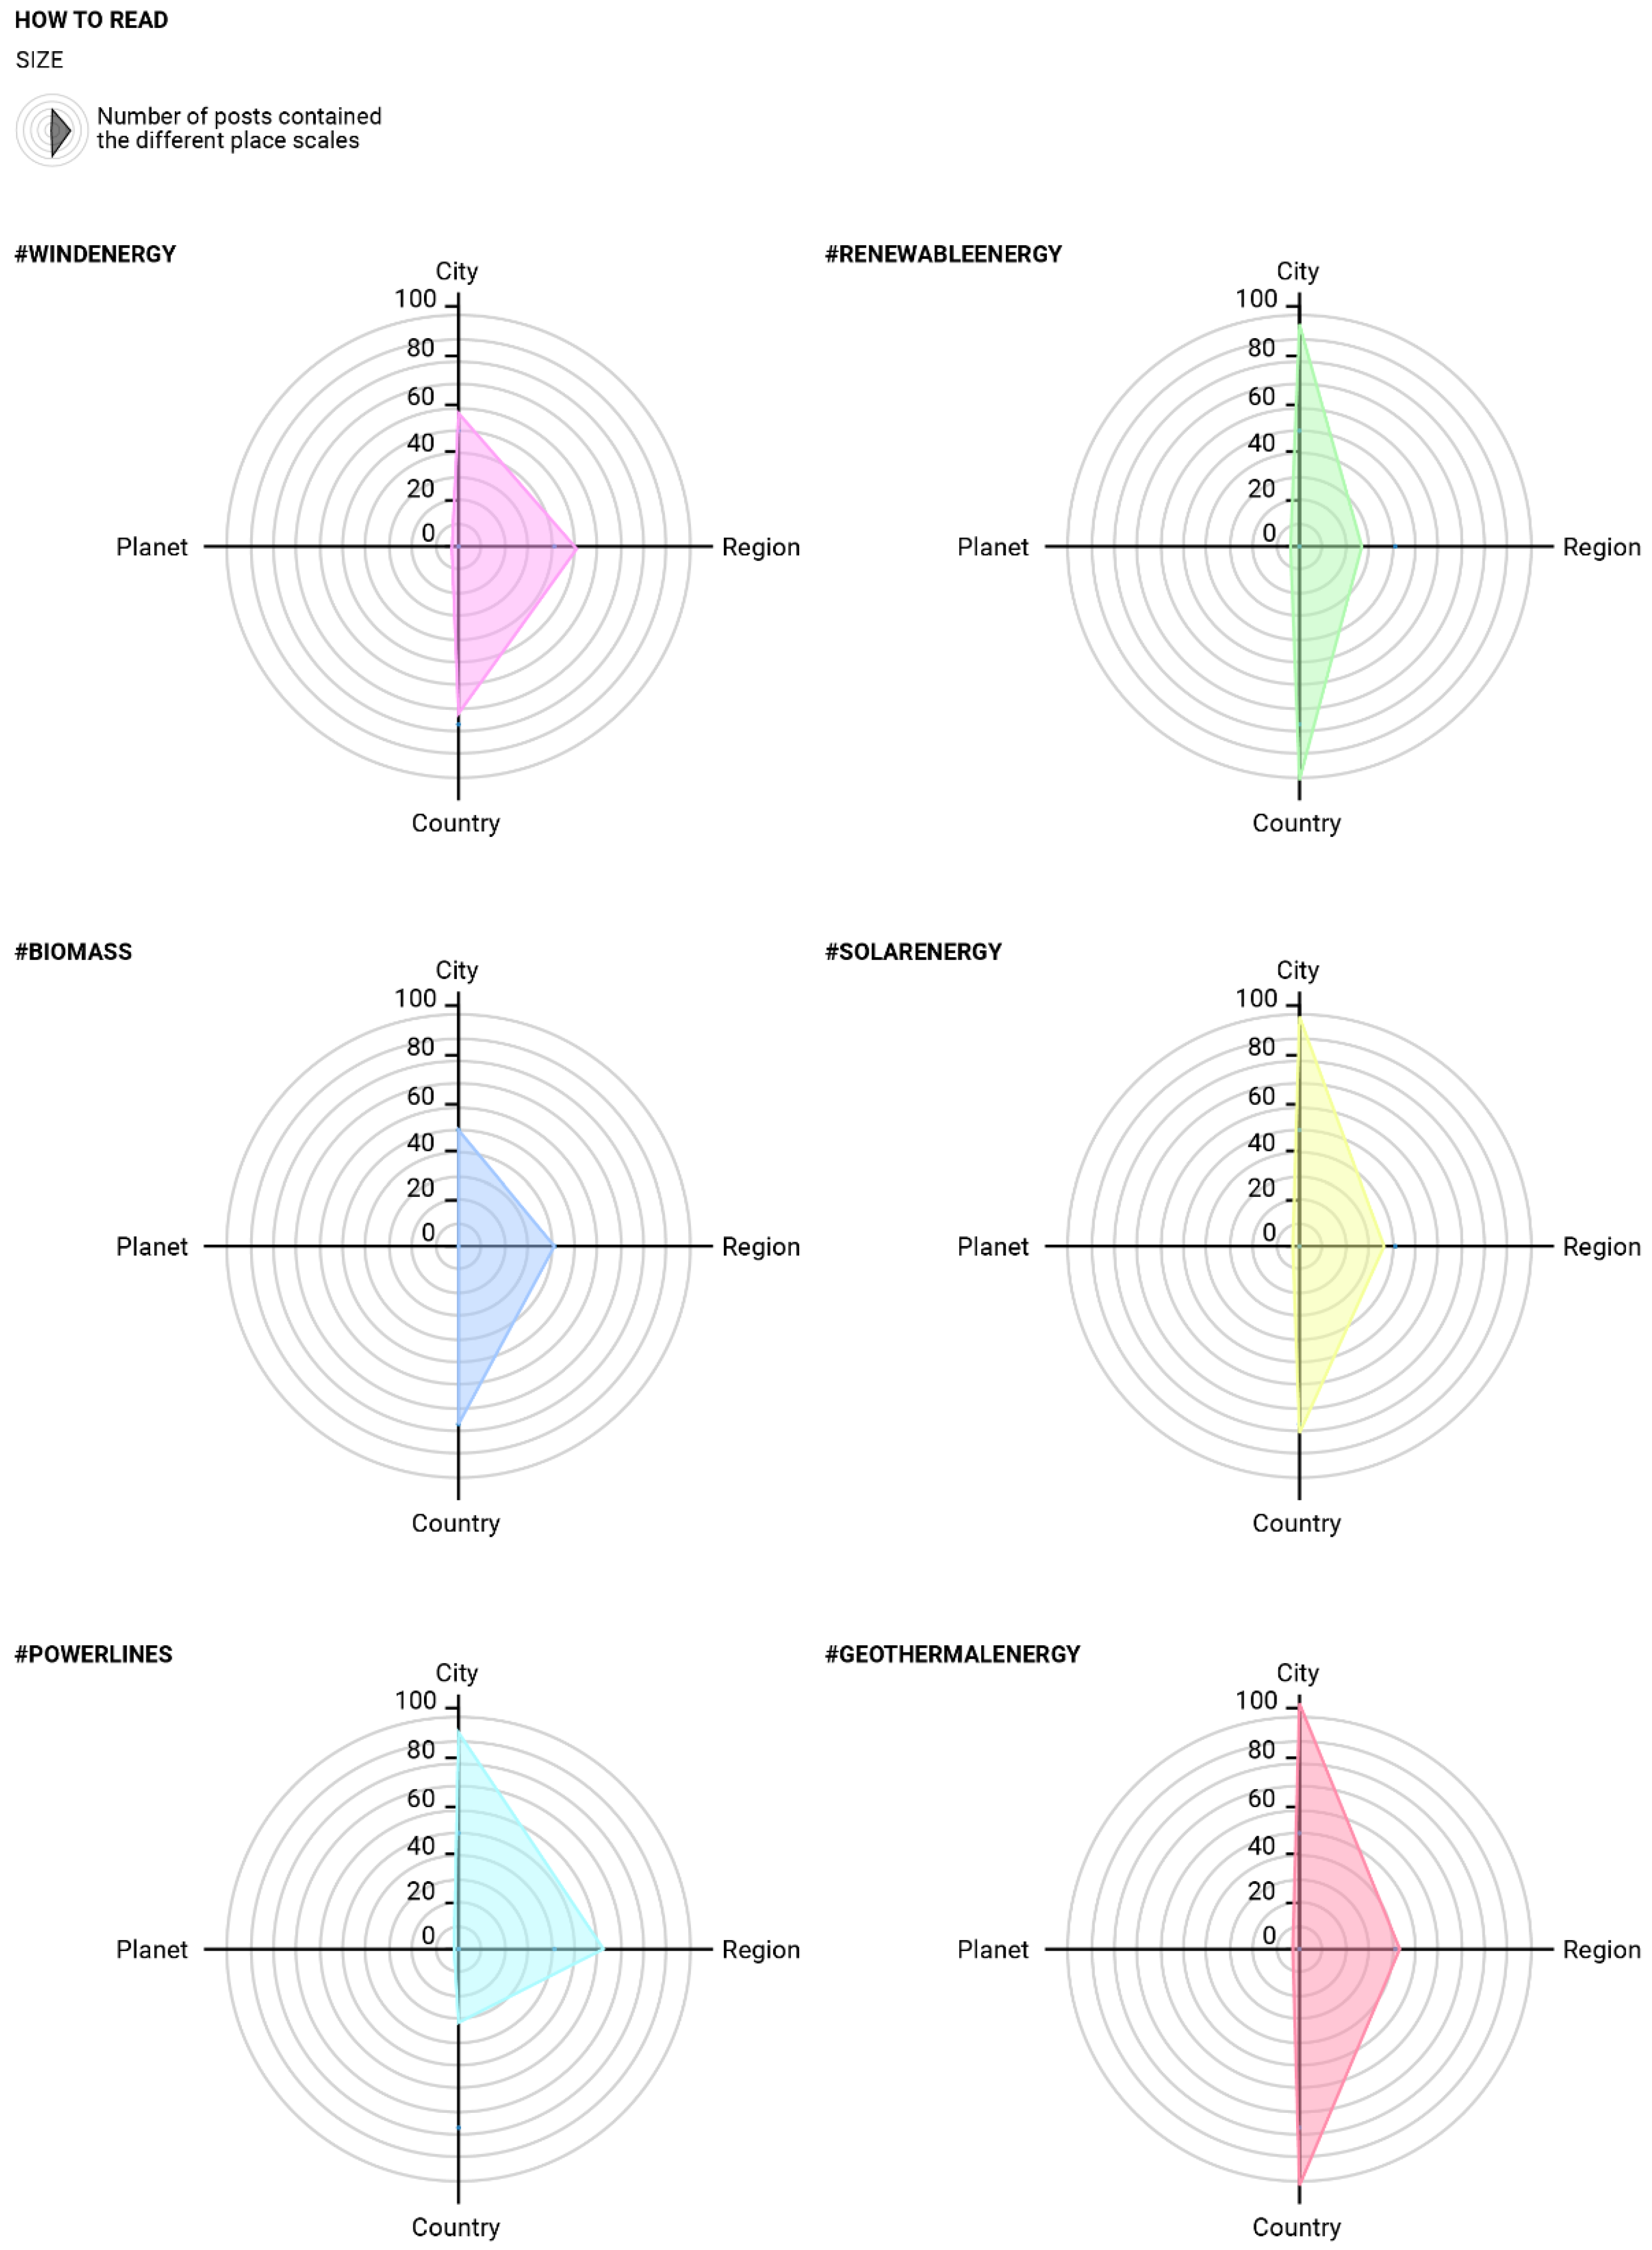
The scraped posts (N = 1500) were divided into four place-scale categories (city, region, country, and planet). After a double coding from the authors (explained in Session 3), the sample was divided as follows.
Figure 3 shows the place scales that were used in the different Instagram hashtags. The highest frequencies of mentions are for: country and city words that occur in #geothermalenergy posts; region words that occur in #powerlines posts; and planet words that occur in #renewableenergy posts. The city and national scales have the highest frequencies in the posts. These data confirm the strong association between RETs and the city and national place scales. “Planet”, instead, is only mentioned in 7 of all 1500 Instagram posts. The construct, “planet”, may elicit an emotional attachment and may evoke fewer mental associations. Region words, as we expected, were less frequently tagged compared to city and country words, and this result is in line with the recent literature that is cited above. Words that refer to places appear in our sample 1244 times.
A visual inspection of the six maps reveals several patterns (see
Figure 4): First, North America and Europe were mentioned more often in Instagram posts about different energy sources, while none of the posts across all of the investigated forms of energy mentioned Antarctica. Notably, the solar energy posts referred to places in North America less often than other energy posts: (places in) North America was mentioned only 12 times, while (places in) Asia was mentioned 66 times. Second, South America is consistently among the least mentioned places, with zero to five mentions, which suggests that discussing energy sources on Instagram is less common in South America than in other regions, despite Brazil ranking third in worldwide Instagram users (Statista, 2021).
4.2. Cluster Analysis in the Instagram Posts
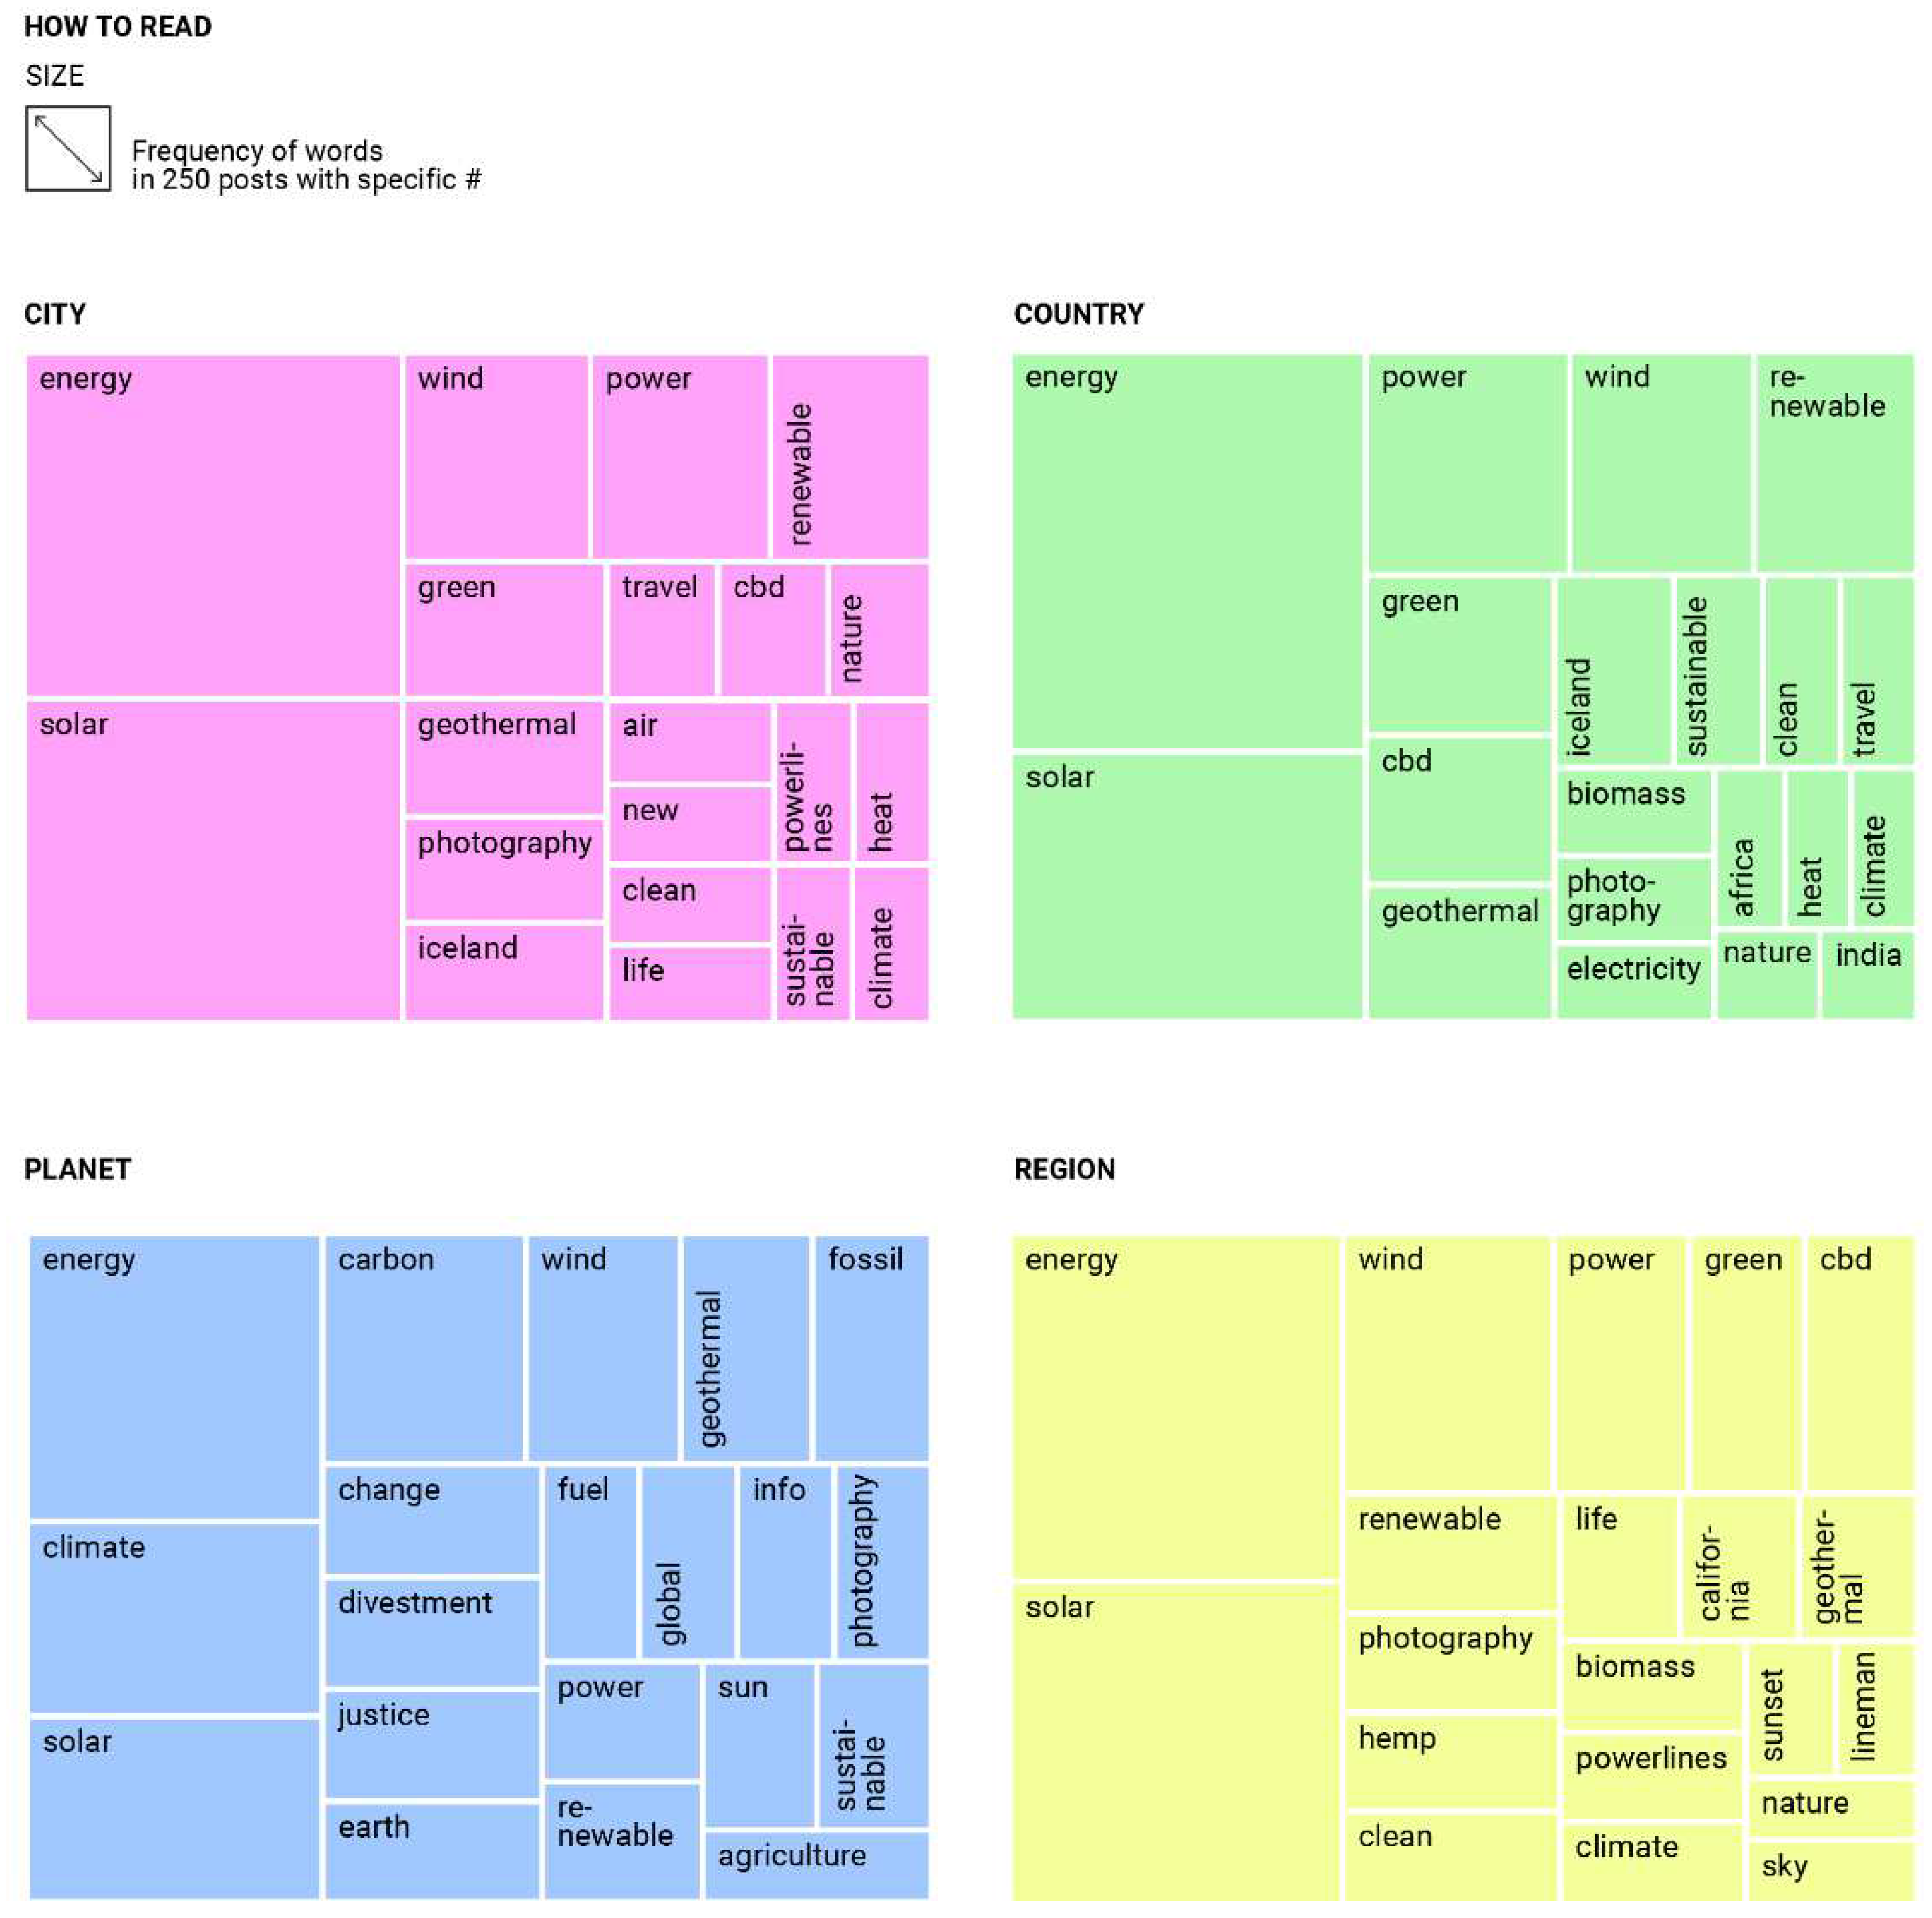
The cluster analysis (see
Figure 5) shows a similar pattern of words in all the places (e.g., “energy”, “clean”, “photography”, etc.). In all the places, there are at least some specific renewable energies that are named. For example, wind, geothermal, powerline, and solar energy words were named in the city posts; solar, wind, and geothermal words were named in the posts with country words; and wind and solar energy words were named in the posts with “planet”. All the renewable energies that are included in the study (geothermal, solar, wind, powerlines, and biomass) are named in the posts with region words. Solar energy has the highest frequency in all the place levels. In the planet block, as was supposed, there are words that are linked to the earth and to climate change. The word, “justice”, also has a high frequency in the planet cluster, which is a result that should be studied in future research. The importance of justice expectations and perceptions is highlighted in the existing acceptance models for RETs [
49]. The environmental justice concerns include distributive and procedural claims, as well as recognition and participation factors [
50]. Environmental justice research has expanded to a more essentially involved field that examines additional layers of the relationship between people and environmental issues [
51]. However, attachment to the planet may mean altogether different things to British or German, or Polish or Lithuanian people, and so on [
32]. In this case, we can emphasize that the construct, “planet”, is linked to the idea of justice, as well as to climate change and health issues. This result should be studied in future research.
4.3. Sentiment Analysis and Multiple Linear Regressions
We conducted a sentiment analysis with all of the words from every post. Five multiple linear regressions were calculated to investigate the associations of the city, region, country, and planet word counts with the affect, positive emotion, negative emotion, cognitive process, and risk variables (see
Table 2). These five multiple linear regressions were performed, first, on the whole sample (N = 1500 posts). The analysis of the sample shows the following results.
One multiple linear regression was calculated to predict the affect by the city, region, country, and planet word counts. The regression model was significant (F (4, 1491) = 4.57, p = 0.001) and accounted for 1% of the variance of the dependent variable. City (β = −0.07, p = 0.009) and planet (β = −0.06, p = 0.03) words were significant predictors of affect. This means that, if city and planet words (1 or several) are mentioned, this is associated with 0.07 (for city) and 0.6 (for planet) decreases in the affect that is used in the captions and hashtags.
A second multiple linear regression was calculated to predict positive emotions by the city, region, country, and planet word counts. The regression model was significant (F (4, 1491) = 4.98, p < 0.001) and accounted for 1% of the variance of the dependent variable. The city (β = −0.05, p = 0.05), region (β = −0.07, p = 0.006), and planet (β = −0.06, p = 0.03) words were significant predictors of positive emotions.
A third multiple linear regression was calculated to predict negative emotions by the city, region, country, and planet word counts. The regression model was significant (F (4, 1491) = 3.59, p = 0.006) and accounted for 1% of the variance of the dependent variable. City (β = −0.06, p = 0.03) and region (β = 0.09, p < 0.001) words were significant predictors of negative emotions.
4.4. Exploratory Findings
In total, five multiple linear regressions were calculated to investigate the effect of the city, region, country, and planet word counts on the affect, positive emotion, negative emotion, cognitive process, and risk variables (see
Table 2). The second step was to break down and analyze each of the five multiple linear regressions according to the hashtags that represent the types of renewable energy.
The following results are based on the #renewableenergy posts. One multiple linear regression was calculated to predict the affect by the city, region, country, and planet word counts. The regression model was significant (F (4, 245) = 6.20, p < 0.001) and accounted for 9% of the variance of the dependent variable. City (β = 0.18, p = 0.01), region (β = −0.22, p < 0.001), and planet (β = −0.12, p = 0.04) words were significant predictors of affect. One multiple linear regression was calculated to predict the positive emotion by the city, region, country, and planet word counts. The regression model was significant (F (4, 245) = 6.72, p < 0.001) and accounted for 10% of the variance of the dependent variable. City (β = 0.19, p = 0.009), region (β = −0.22, p < 0.001), and planet (β = −0.13, p = 0.03) words were significant predictors of affect.
The following results are based on the #biomass posts. One multiple linear regression was calculated to predict negative emotions by the city, region, country, and planet word counts. The regression model was not significant (F (4, 242) = 1.23, p = 0.78) and accounted for 2% of the variance of the dependent variable. Country (β = 0.14, p = 0.02) words were significant predictors of negative emotions.
The following results are based on the #powerlines posts. One multiple linear regression was calculated to predict cognitive processes by the city, region, country, and planet word counts. The regression model was not significant (F (4, 245) = 1.29, p = 0.27) and accounted for 2% of the variance of the dependent variable. Region (β = 0.14, p = 0.04) words were significant predictors of cognitive processes. One multiple linear regression was calculated to predict affect by the city, region, country, and planet word counts. The regression model was significant (F (4, 245) = 5.33, p < 0.001) and accounted for 8% of the variance of the dependent variable. City (β = −0.29, p < 0.001) words were significant predictors of affect. One multiple linear regression was calculated to predict positive emotions by the city, region, country, and planet word counts. The regression model was significant (F (4, 245) = 2.79, p = 0.02) and accounted for 4% of the variance of the dependent variable. City (β = −0.021, p = 0.002) words were significant predictors of positive emotions. One multiple linear regression was calculated to predict negative emotions by the city, region, country, and planet word counts. The regression model was not significant (F (4, 245) = 2.20, p = 0.06) and accounted for 3% of the variance of the dependent variable. City (β = −0.19, p = 0.006) words were significant predictors of negative emotions.
The following results are based on the #geothermalenergy posts. One multiple linear regression was calculated to predict cognitive processes by the city, region, country, and planet word counts. The regression model was not significant (F (4, 244) = 1.86, p = 0.11) and accounted for 3% of the variance of the dependent variable. Country (β = −0.13, p < 0.05) words were significant predictors of cognitive processes. One multiple linear regression was calculated to predict affect by the city, region, country, and planet word counts. The regression model was significant (F (4, 244) = 7.06, p < 0.001) and accounted for 10% of the variance of the dependent variable. City (β = −0.27, p < 0.001) words were significant predictors of affect. One multiple linear regression was calculated to predict positive emotions by the city, region, country, and planet word counts. The regression model was significant (F (4, 244) = 9.89, p < 0.001) and accounted for 14% of the variance of the dependent variable. City (β = −0.030, p < 0.001) words were significant predictors of positive emotions. One multiple linear regression was calculated to predict negative emotions by the city, region, country, and planet word counts. The regression model was significant (F (4, 244) = 9.32, p < 0.001) and accounted for 13% of the variance of the dependent variable. Region (β = 0.33, p < 0.001) words were significant predictors of negative emotions.
5. Finding Overview and Discussion
In this preregistered study, we investigated place-level mentions and how these relate to people’s written language. Specifically, we conducted multiple linear regressions to investigate the associations of the city, region, country, and planet word counts with the sentiments in the Instagram posts’ captions and hashtags. Our findings partially contradict our expectations, although we can partially accept our hypothesis (H1: Different place scales are associated with emotional and cognitive words). Indeed, when looking at the entire sample of all of the investigated hashtags, we found relationships between emotionality and the mentions of cities and regions. However, and contradictory to our hypothesis (H1.1: Instagram posts that include city and region words are more strongly connected to affective words about RETs than posts with country and planet words), mentions of cities and mentions of the planet had about an equal number of negative associations with affect generally. Similarly, when looking at positive emotions, specifically, we found that the mentions of cities, regions, and the planet show negative associations with positive emotions in the text. In other words, when people mentioned places at a small (city or region) or at a very large scale (planet), they also tended to use less positive words in the image captions and hashtags. Notably, this pattern changed when we looked at the use of negative emotions. Here, H1.1 was confirmed: the posts that referred to cities (regions) showed negative (positive) associations with the use of negative words in texts, while the mentions of the planet had no predictive power for negative words. Importantly, while the mentions of cities are related to less positive words, they also are associated with less negative words.
In terms of our expectations with regard to the use of risk-related words (H1.2:
Instagram posts that include country words are more strongly connected to risk words about RETs than posts with city, region, and planet words), we found no effects of the place mentions at all for the entire sample of hashtags. The social media users did not use relatively more risk words for any of the place scales that we investigated in this study. This is in line with prior studies where (acceptance of) renewable energy technologies, such as biogas, are connected to risk perceptions, while place attachment is unconnected [
52]. Similarly, we found no effects for the use of cognitive words (H1.3: Instagram posts that include planet words are more strongly connected to cognitive words about RETs than posts with city, region, and country words) when looking at all of the investigated hashtags together. Importantly, the planet words were only mentioned in a few posts (N = 7). For this, the number of the planet posts are not enough to draw conclusions. One idea could be to collect multiple posts that mention RETs and planet words together in order to have a larger sample, and then perform a sentiment analysis. So far, we can only conclude that, in our sample, there are no strong relations between the Instagram posts, RETs, and “planet”. The construct, “planet”, may evoke fewer mental associations than other the place levels. These results are in line with the “psychological distance” [
23] theory, which argues that the things that are of value to individuals must be close rather than distant. On the other hand, our results are not in line with other studies that claim that people label themselves as “global citizens”, which underlines the importance of the interplay between global and national attachments [
25]. Heise [
53] claims that we need a “sense of planet“ as much as a “sense of place“. As we have already shown in our dataset, the construct, “planet”, evokes more words that are related to climate change or justice topics, rather than words that are strictly related to RETs. We encourage future studies in this direction.
However, as our exploratory analyses show, the effects for the investigated renewable energy infrastructure hashtags differ. Specifically, neither #windenergy nor #solarenergy showed any relationships between the place mentions and the sentiments that were used in the texts and captions. This is somewhat surprising, since wind energy is often criticized by local opponents for its negative impact on the surrounding landscape (e.g., [
54]). On the basis of this finding, one could assume negative emotions in posts that mention smaller places, especially when using a medium that focuses heavily on visuals, such as Instagram. With the current analysis, we are unable to tell why this association does not exist. Wind energy opponents might not use Instagram to make themselves heard, they may use more specific project-related hashtags, or they might rely on other hashtags altogether (e.g., the German wind opposition, at times, does not use the hashtag, “Windkraft” (wind power), but rather, “Vernunftkraft” (power of rationality)). While one could argue that Instagram is a platform that primarily focuses on positive self-presentation and “showing-off” and, as such, it is unsuitable for analyzing energy-related sentiments, we argue that investigations of Instagram for important societal topics are essential. Instagram is no longer a personal social networking site but is one where people are engaged with politics and social movements. For example, the hashtag, #JusticeForGeorgeFloyd, was used over 2 million times, and the hashtag, FridaysForFuture, was used over 1 million times. As such, Instagram is not only a place for self-presentation, but it is also a place to share opinions about, and insights on, societal issues.
In comparison to the solar and wind power hashtags, the analysis for the hashtag for renewable energy generally showed some patterns: the mentions of cities had positive associations with positive emotions, while the mentions of regions and the planet showed negative relations with positive emotions. This difference between the city and region mentions might be due to people viewing renewable energy infrastructure as a solution to the energy needs of cities (e.g., words that were frequently used on the city scale included, “heat”, “new”, “life”, and “sustainable”), while, on the regional level, RETs are associated with the reality of their implementation (e.g., mentions of lineman for the powerlines hashtag). Overall, our findings show that the place scales that are mentioned in the Instagram posts are related to some differences in the post emotionality, and, importantly, our exploratory analyses show that these effects can differ across the different hashtags that are related to RETs.
Place attachment research suggests that, in mobile lives with multiple place attachments, the time that is spent at the different places that are important to us shape our attachments to those particular places [
27]. Different places are important for diverse social, cultural, and emotional reasons, as well as for practical purposes [
18]. Seen in this light, the hypothesis that particular uses of, and particular attachments to, place levels can inform the stakeholder perceptions of RETs seems plausible. This suggests that there are differences in the reactions towards the potential local RET-related changes among diverse stakeholders with specific attachments to those same local places, and that each place level appeals to several emotions and cognitions. However, the available literature does not provide much information to form a clear hypothesis on the relationship between RETs and place on social media platforms. For this reason, this field should be investigated in order to obtain a clearer picture of how these dynamics are expressed on social media. In fact, our hypotheses have been only partially confirmed, and we can conclude that the place–RETs relationship follows different dynamics on Instagram that need to be investigated further.
Limitations and Future Research
The present study has some limitations. First, while we crawled for English hashtags, some posts used multiple languages, and we were only able to analyze the English captions and hashtags. Second, people may, at times, have used hashtags for different reasons, other than to refer to RETs. For example, “CBD” (cannabidiol), was mentioned commonly in the biomass hashtags, and the geothermal energy hashtag is, at times, also used by people visiting Iceland. Third, the LIWC2015 software and the word count techniques are coarse measures of language, are devoid of context, and are unable to interpret subtleties such as irony and sarcasm. Fourth, our independent variables have little explanatory power: on average, they only explained 1% of the outcome variables. This is a strong contrast to our expectations, which were built on the relationship between the sense of place and the emotional and cognitive reactions to RETs. We can hypothesize that the link between places, emotions, cognitions, and RETs on Instagram (and on other social media platforms) follows different structures than those studied so far via different research tools (such as surveys, interviews, focus groups, etc.). To the best of our knowledge, this study is the first to link place-level mentions with affective, cognitive, and risk-related words in the context of energy development on social media. Our analysis mainly focused on testing the patterns of the emotions and cognitions in relation to the place levels, which required numerous separate regression analyses. Because of the early stage of this form of analysis, we refrained from a more conservative approach to test the patterns (e.g., reducing the alpha level). Ideally, this research is a first step towards a more intense study that will include social media and other sources, such as mass media, newspapers, etc. Understanding the social dynamics on Instagram has practical implications. For example, companies and developers can use the interface, with the expected values, geographic span, and expression of emotions/cognitions, in order to disseminate a message and make users aware. The identification of a user’s restricted social circle will move marketing campaigns, social movements, developers, etc., away from simply segmenting by demographics and psychographics, towards, instead, conveying their message by segmenting along social network structures. As with any data source, social media analysis presents both opportunities and challenges. One major critique of social media data is that the data are not generalizable outside of the platforms from which they originate [
55]. However, scholars (e.g., [
56]) argue that, while social media data have empirical limitations, the data retain integrity if they are strongly linked to theoretical concepts. Thus, research that starts with clear theoretical assumptions and concepts can create relevant information about social processes, regardless of the degree to which the data are representative of a larger population [
55].


 ,
, 


