Article

Fuzzy AHP-Based Design Performance Index for Evaluation of Ferries

Department of Engineering Mechanics, KTH Royal Institute of Technology, 11428 Stockholm, Sweden
*
Author to whom correspondence should be addressed.
Sustainability 2022, 14(6), 3680; https://doi.org/10.3390/su14063680
Submission received: 10 February 2022 / Revised: 10 March 2022 / Accepted: 15 March 2022 / Published: 21 March 2022

Abstract

:
Within waterborne public transportation (WPT), one often observes a mismatch between the operational requirements and ferry characteristics. A method to holistically evaluate ferries with respect to local requirements could lead to tailored procurement and targeted refurbishment of existing fleet. In this study, we develop a structure for operational requirements and use it as a basis for a ferry evaluation methodology. The requirements’ structure follows a three-level hierarchy starting from broad vessel design to mandatory requirements to performance requirements. The performance requirements are based on the three pillars of sustainability, aided by commuter surveys carried out in Stockholm ferries, interviews with public transport providers (PTP) and previous literature. The evaluation of the ferry is performed using analytic hierarchic process (AHP) to convert the PTP’s subjective preferences and ferry performance into a single dimensionless index. Rules for quantification of performance metrics including social performance are proposed. The uncertainties associated with AHP are addressed by employing fuzzy AHP based on extent analysis and fuzzy AHP in combination with particle swarm optimization. Two applications including performance assessment of existing ferries and assembly of a modular ferry are discussed. The method can lead to objective decision making in ferry evaluation, potentially leading to a more efficient WPT.

1. Introduction

Waterborne public transportation (WPT) has been gaining popularity as a mode to complement the existing public transportation network, due to challenges of growing congestion and pollution in cities. Its implementation has been proven successful in many cities including Amsterdam and Sydney, which have an integrated multimodal transport network [1]. Further, WPT is perceived as a sustainable and environmentally friendly transport mode [2] that is economical, safe, versatile, reliable and energy efficient [3] offering high satisfaction levels among commuters [4] and stimulating economic growth and waterfront development [5].
Despite the positive perception and advantages, we observe a reluctance from the public transport providers (PTP) in adopting WPT [6]. One of the core challenges is inefficient ferries leading to poor competitiveness with alternate modes [7], and difficulty in scheduling due to a mixed fleet [8] leading to poor multi-modal integration and reliability issues [9]. For example, Camay, Zielinski et al. [5] observe that ferries are at a disadvantage with other modes, due to lower frequency, long travel times and high cost of operations. Further, the PTPs have an unfavourable view on WPT and perceive ferries to be environmentally unsustainable, and they find it difficult to procure tailored vessels. The quest often results in either opting for an alternate mode, denying the service or employing an inefficient vessel, which further reinforces their negative perception [10]. These factors deter the PTPs, leading to low development budgets, which further reinforces WPT’s current state as observed in the low patronage shares across cities [11].
Easy accessibility to efficient ferries could be the key to changing this perception. An efficient ferry can lead to lower costs and a higher energy efficiency which may ease funding constraints, create opportunities to better integrate in a multi-modal scheme and motivate political and local legislative action as an answer to challenges identified by Bignon and Pojani [7]. This requires tailoring the ferry towards local operational requirements. The requirements should encompass all stakeholder expectations and have a standard form. This step is crucial in bringing uniformity in definitions between different PTPs and avoiding multiple interpretations of requirements by different parties. The current state of the art for operational requirements relies on ship design methodologies such as design spiral [12], ship synthesis [13] and system-based ship design [14]. However, these do not holistically consider metrics such as social performance, and considerations are limited to travel time and fares, providing an incomplete picture of commuter perception [
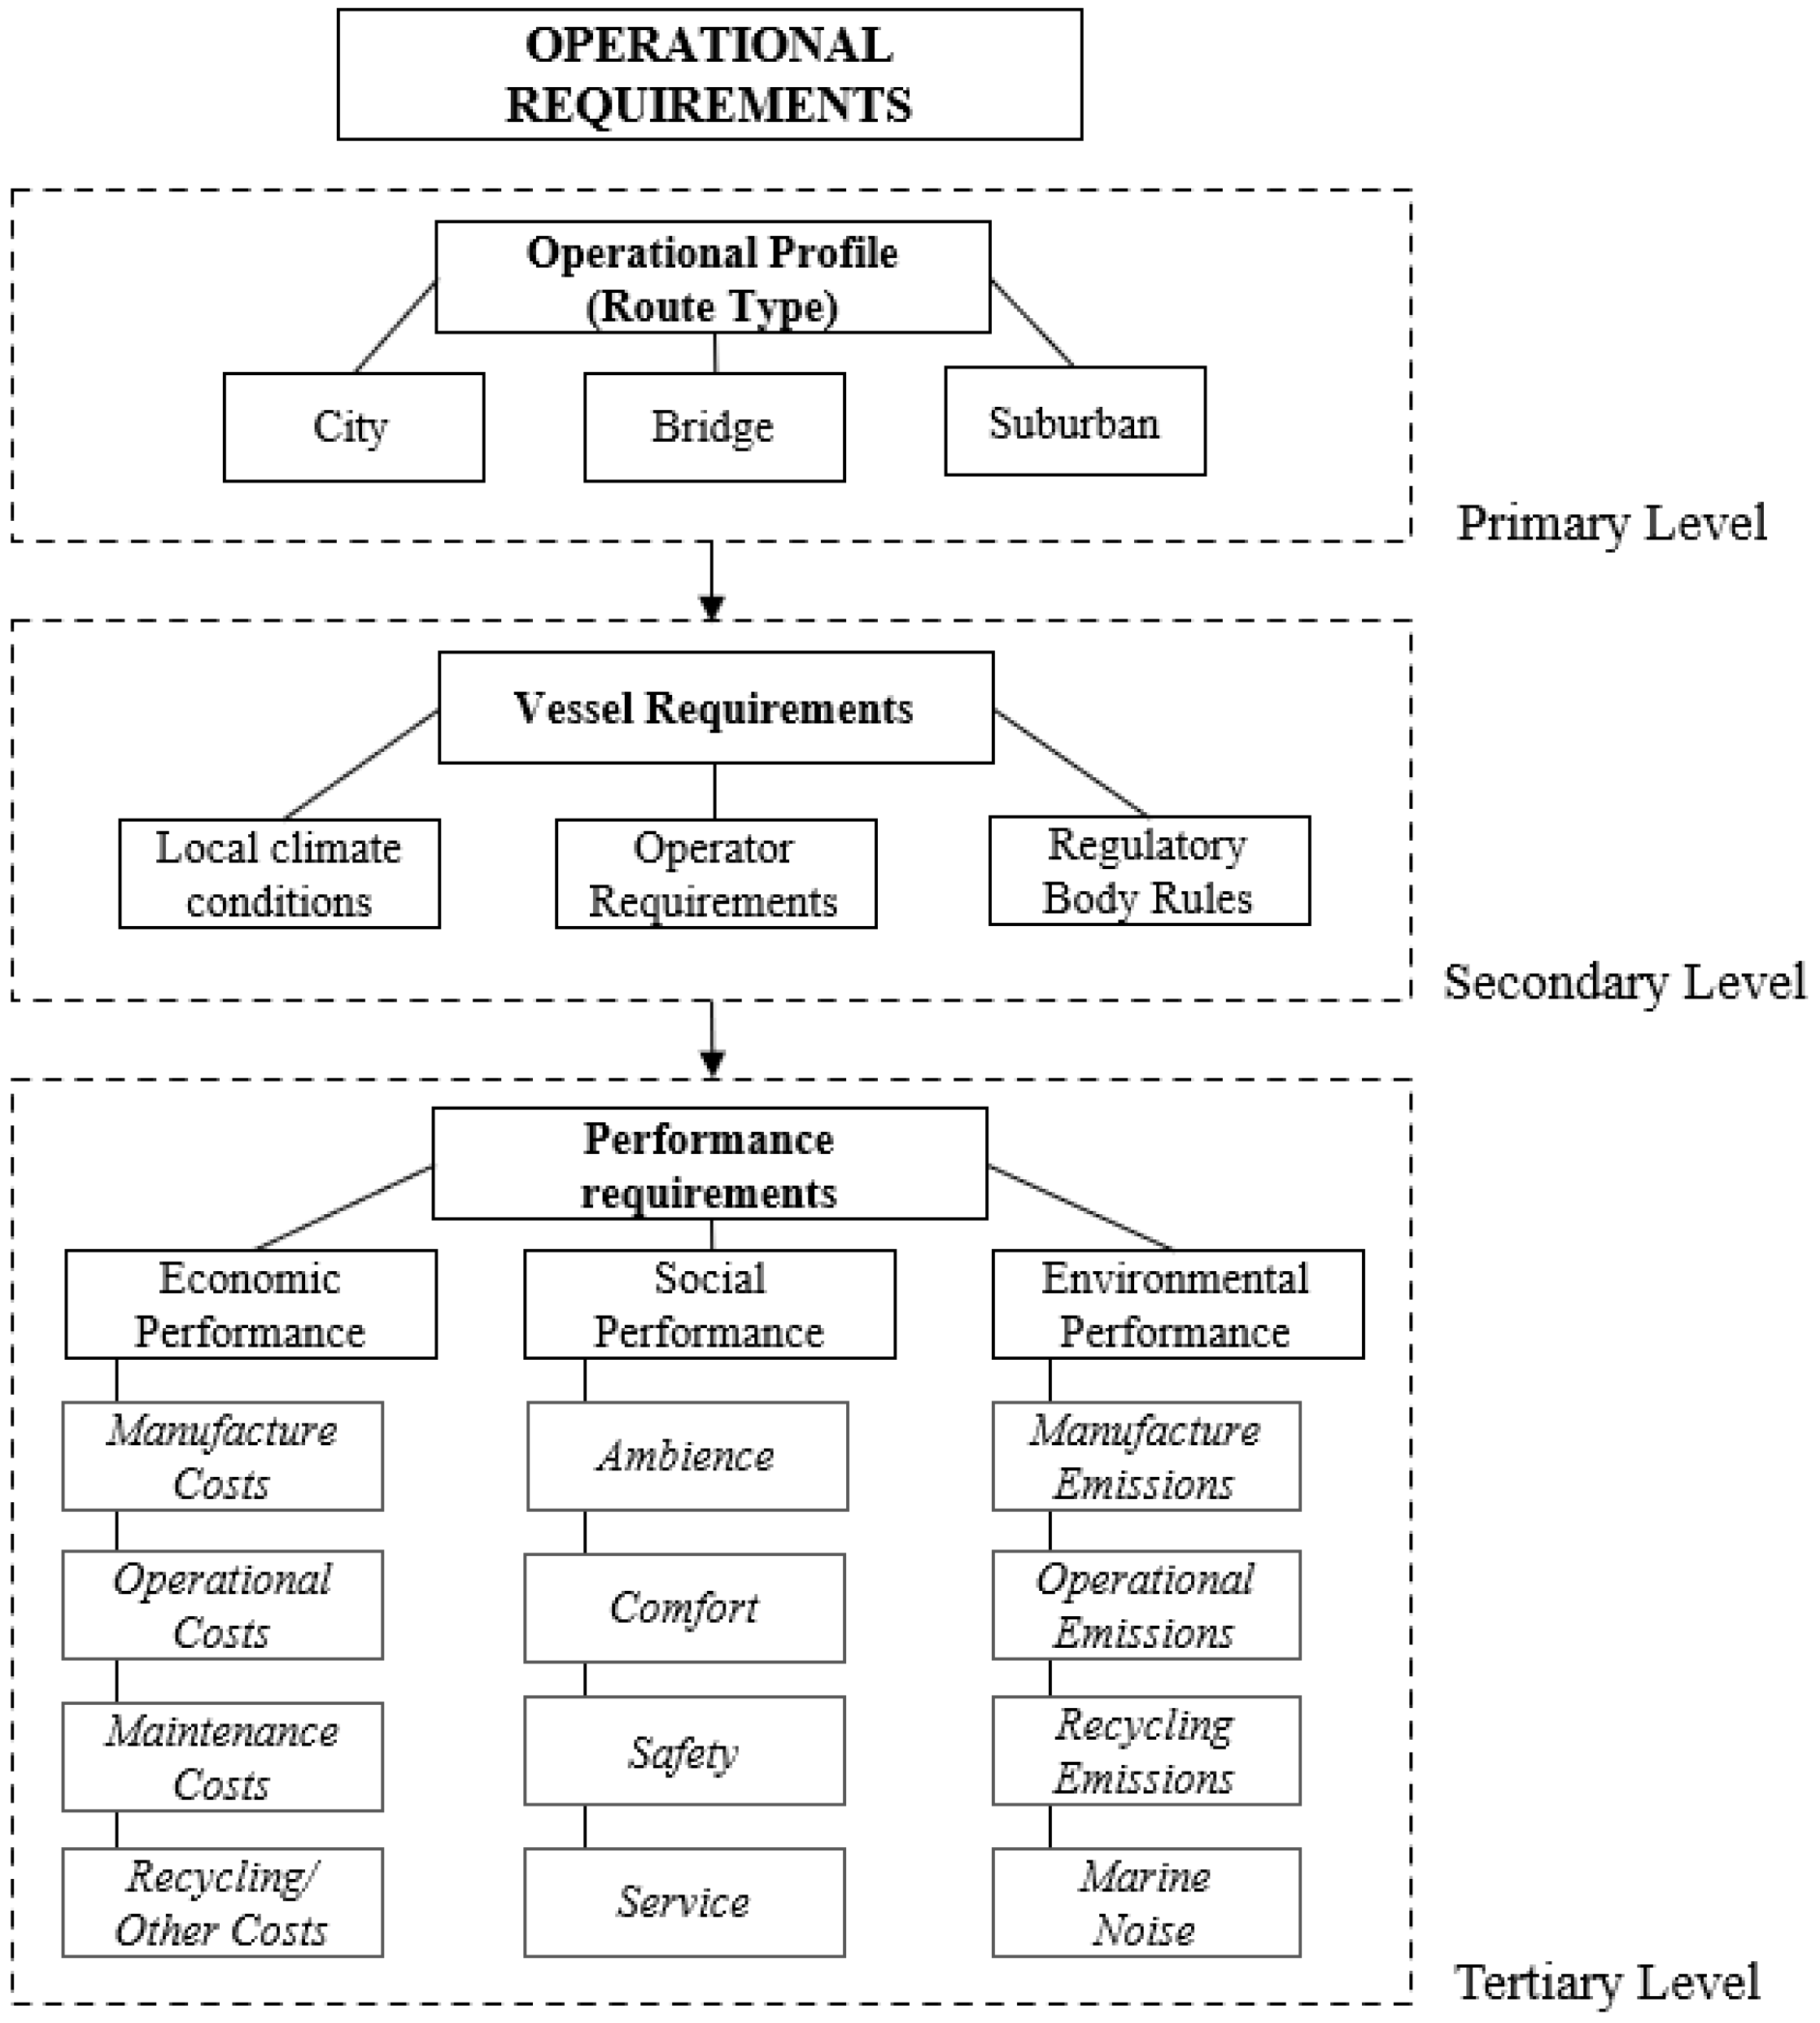
15]. Any attitudinal data are the PTP’s responsibility to communicate, adding an element of subjectivity in communicating requirements. This motivates the study’s first aim to propose a standard structure for operational requirements.
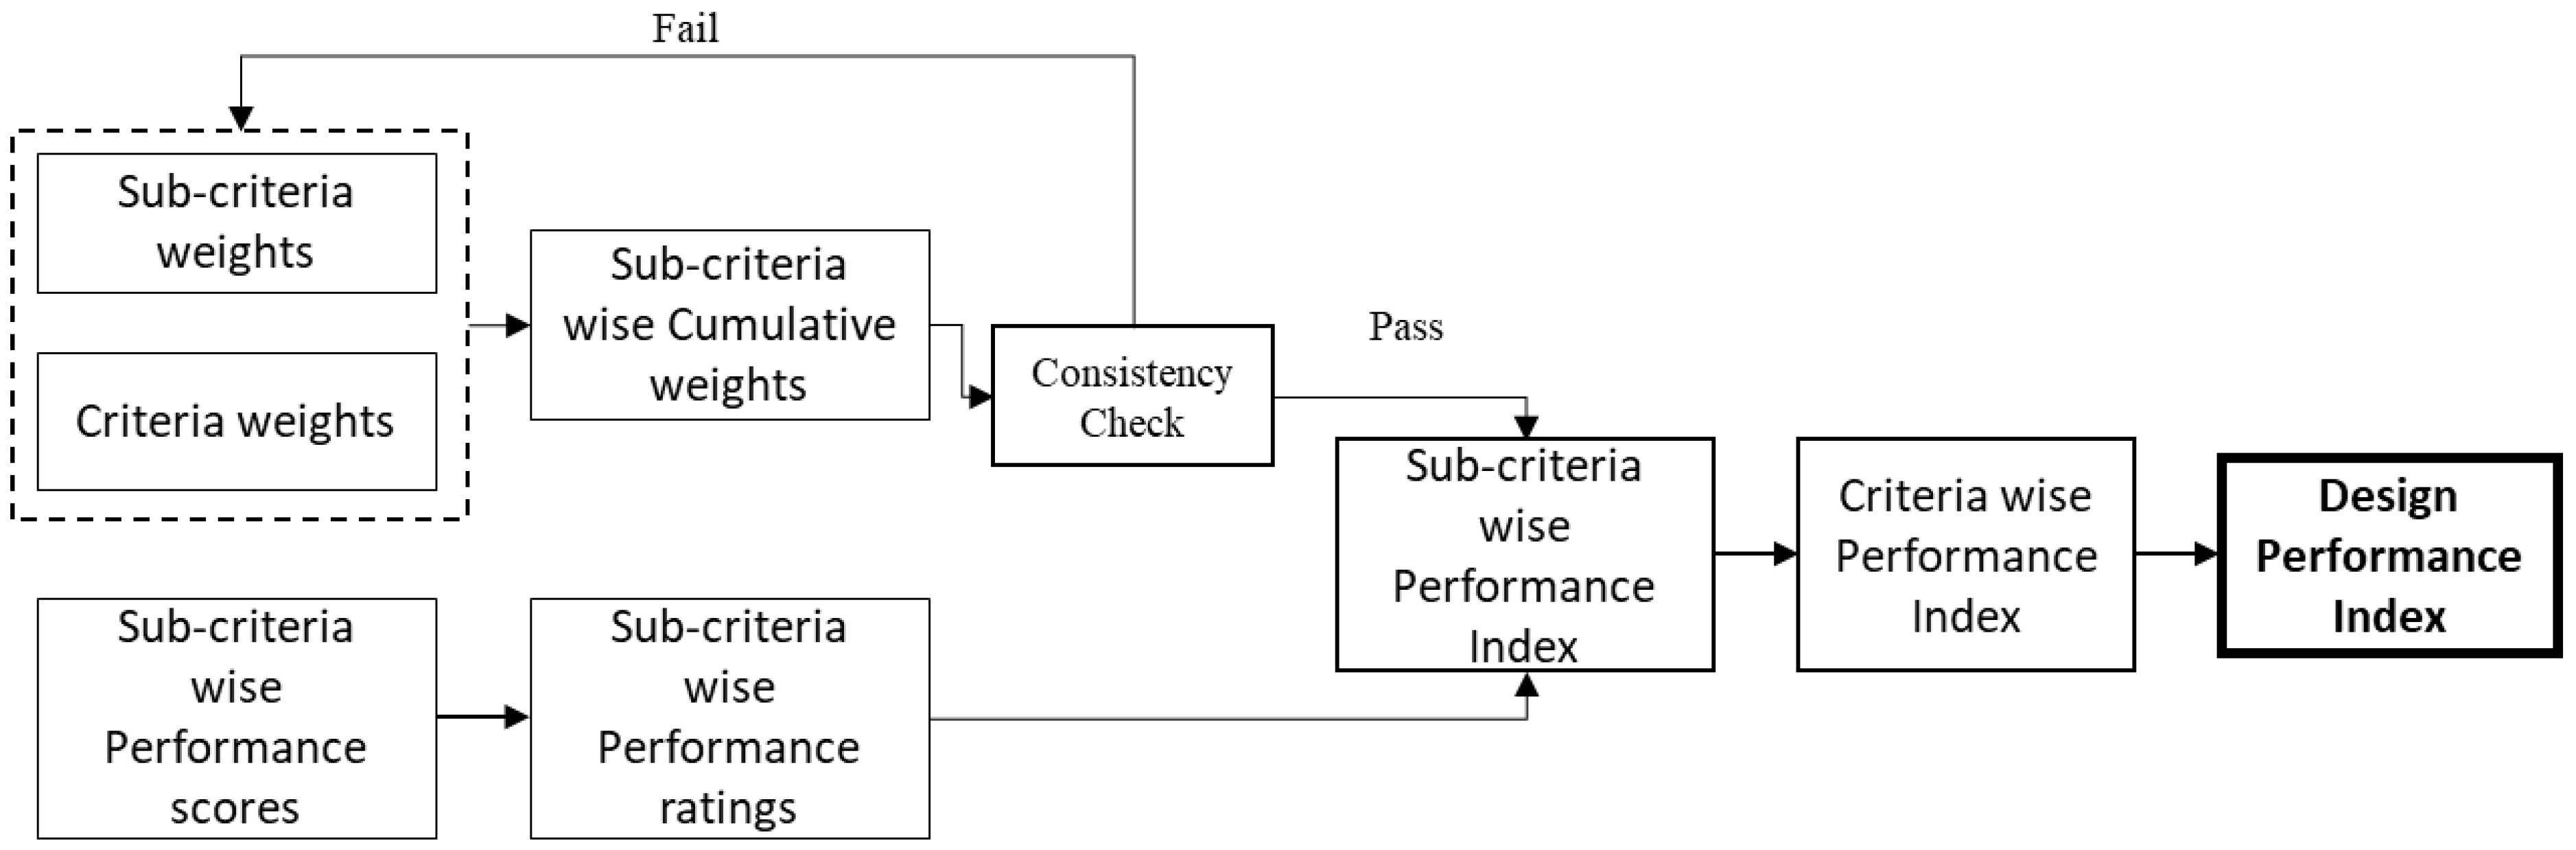
The framework for the evaluation of a ferry with respect to the proposed operational requirements defines our second aim. The evaluation scenario falls under a classic multicriteria decision making (MCDM) problem. In the literature, there are many approaches discussed. Among these, ELECTRE (elimination and choice expressing reality), PROMETHEE (Preference Ranking Organization Method for the Enrichment of Evaluations), TOPSIS (Technique for Order of Preference by Similarity to Ideal Solution), WSM (weighted sum model), REMBRANDT (Ratio Estimation in Magnitudes or deci-Bells to Rate Alternatives which are Non-DominaTed), VIKOR (VIseKriterijumska Optimizacija i Kompromisno Rešenje) and analytic hierarchic process (AHP) are widely used within the transport sector [16]. We choose AHP [17] for its simplicity in implementation and widely found industrial applications. It can handle both factual (objective, quantitative) as well as judgmental (subjective, qualitative) information while highlighting the alternative’s strengths and weaknesses. It uses utility functions under multi-attribute utility theory to aggregate multiple criteria into a single dimensionless index typically in the range 0–1 [18]. Such an index makes assessment objective. We term the holistic evaluation of a ferry as its design performance index (DPI).
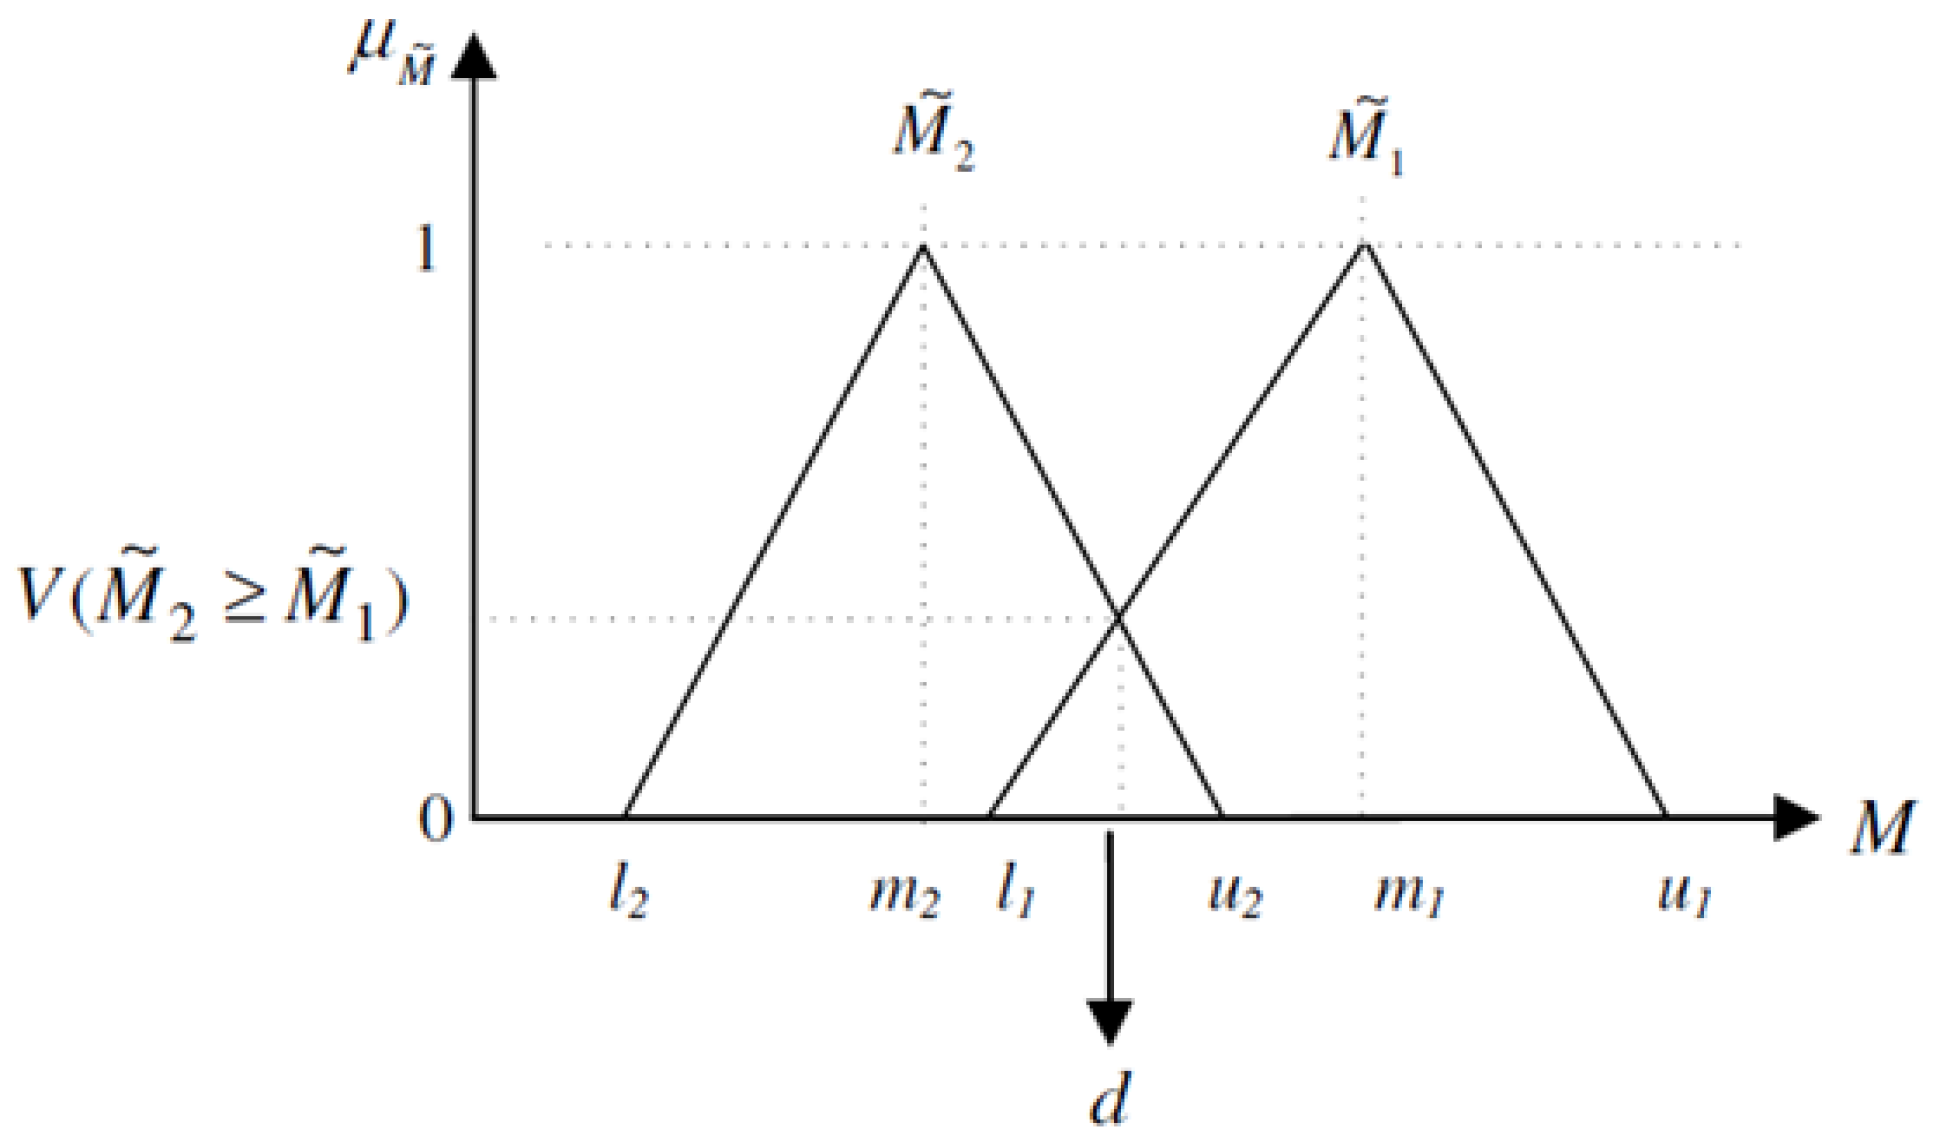
Utility functions help segregate performance values based on the criteria’s preference in comparison with others through pairwise comparisons of criteria. Through the assignment of discrete numeric values (0–9), crisp weights are assigned to different criteria. However, this can be a source of imprecisions and uncertainties if the decision maker is reluctant or unsure about placing an exact value on relative importance, due to incomplete, unquantifiable or non-obtainable information [19]. Further, even if preferences are scored correctly, there is a risk of the aggregation being misunderstood with reference to the decision maker’s intentions [20]. These uncertainties can be addressed by using a fuzzy set to describe criteria preferences. Correspondingly, weights derived from fuzzy AHP methods with extent analysis [21] and Javanbarg, Scawthorn et al. [22]’s method with particle swarm optimization are compared and discussed. Contemporary studies using fuzzy AHP in the marine sector include the following: Jung, Kim et al. [23]’s study on the driving factors in low cost freight carriers in Korea; Hart, Adebiyi et al. [24]’s study on ferry commuter preferences in Lagos; Kim, Lee et al. [25]’s assessment of the operational efficiency considering safety factors in Korea.
The operational requirement’s structure and evaluation methodology introduced in this paper can benchmark ferry designs, leading to a reduction in ambiguity on subjective interpretations of good design and allowing PTPs to actively participate in the procurement process. We first develop the operational requirements structure as a three-level hierarchy. Then, the methodology of the evaluation method is outlined including a quantification framework for operational requirements criteria. Next, the uncertainties associated with AHP are discussed and addressed through fuzzy AHP methods. Finally, two applications of the method including evaluation of existing ferries and assembly of a modular ferry are discussed.

2. Research Method

We first define the operational requirement’s structure and then use it as a basis for developing a ferry evaluation methodology using fuzzy AHP.

2.1. Operational Requirements Structure

The operational requirements must incorporate material, technological, economic, legal, environmental and human-related considerations that change with time [26]. They should also reflect the differences that arise from regional, cultural, population density, geographical and regulatory diversity [27]. However, one needs to avoid unnecessary requirements and manage complexity by defining appropriate system boundaries [28]. In our case, the system boundaries are defined by the PTP’s expectations when they go to procure a ferry. Broadly, they need to communicate (a) the route characteristics and the expected number of passengers, (b) the vessel particulars (size, speed) and (c) the vessel’s performance (costs, emissions, and commuter preferences) (Interested readers may refer to Appendix A for energy and emission comparisons with alternate modes).
These 3 points correspond to three hierarchically arranged levels in the proposed operational requirement’s structure shown in Figure 1. These system level requirements are developed partly by the concurrent process [28]. The first level characterizes broad ferry design defined by the route type. Three route types were identified after studying 26 global cities having WPT systems [1]. Their respective definitions [29], summarized in Table 1 describe the ferry’s broad design. E.g., route type A ferries are typically high-speed hulls with side entrances and passenger mobility. Route type B ferries are typically double-ender vessels with entrances at ends and large passenger volume. Route type C ferries typically need energy efficient hulls and GA tailored towards comfort.
The second level of the requirements are synonymous with the mission requirements in the design spiral method [12]. The corresponding requirements found there are grouped into local climate conditions, operator requirements and regulatory-body rules. These encompass all the information needed for preliminary ship design. Local climate conditions encompass environmental variables such as (a) wave conditions, (b) current, (c) ice, (d) tides and (e) wind. Operator requirements include all requests by the operator based on their local assessment of stakeholder needs. Regulatory-body rules cover all regulations issued by (a) classification societies, (b) government agencies and (c) legislative authorities. Most contemporary structures of operational requirements used by PTPs are defined up to the secondary level.
Additionally, we propose a tertiary level that evaluates performance against economic, social, and environmental criteria corresponding to the three pillars of sustainability [30]. In choosing respective sub-criteria, sacred expectations defined by Stenius, Garme [10] towards the future of WPT are taken as a basis. These are (a) increasing the efficiency of WPT to make it attractive for passengers, (b) year-round operability (c) environmental sustainability.
The first expectation corresponds to social performance. To identify passenger preferences, we performed a distributed survey (Appendix B) on line 80 ferries in Stockholm and identified service, comfort and productivity as three primary satisfaction metrics [4]. Further sub-metrics were identified under each of these metrics (described under social sub-criteria in Section 2.1). In our current definition, we included ‘productivity’ under a broader term—ambience—and clubbed it along with cleanliness and outdoor access. Further, discussions with PTP led to the introduction of a fourth metric—safety—considering its influence on passenger’s social perception when selecting boat use [31]. These 4 sub-criteria describe the social performance.
The second sacred expectation corresponds to economic performance from a life cycle perspective including manufacturing, operational, maintenance and recycling/other costs, identified in consultation with PTPs. The third sacred expectation corresponds to environmental criteria from a life cycle perspective, assessed in terms of manufacturing, operational and recycling emissions, developed through discussions with subject experts. Additionally, marine noise, is included as a sub-criteria considering its influence on marine fauna [32]. Table 2 shows descriptions of the 12 performance evaluation sub-criteria.

2.2. Ferry Evaluation Method

The methodology for using the operational requirement’s structure to evaluate ferries is developed in this section. The evaluation consists of 5 standard steps resulting in a DPI that benchmarks alternatives against economic, social, and environmental performance. The first two steps correspond to the primary and secondary levels of the operational requirements structure.
Step 1: Problem objective and route type.
Route type, estimated commuter volume, vessel size and capacity are chosen.
Step 2: Vessel requirements.
Requirements set by the environment, operator, and regulatory bodies.
The evaluated vessels must meet these minimum requirements to be considered for performance evaluation. If one is designing a new vessel, the first two steps represent the requirements that the shipbuilder must fulfil. In steps 3–5 we adopt AHP for evaluating the alternatives against the tertiary level of operational requirements. The process is outlined in Figure 2.
Step 3: Weight assignment to performance criteria.
In practice, the 3 performance criteria and the 12 constituent sub-criteria may not hold equal importance. This difference is addressed by assigning intensity of importance on a scale of 1–9 following the rules described in Table 3 using pairwise comparisons between criteria/sub criteria. An n x n judgement matrix consisting of n ( n 1 ) / 2 pairwise comparisons is built, where n is the number of criteria/sub-criteria in a level. In our case, we obtain 4 judgement matrices: one for the performance criteria and three for the sub-criteria under each criterion. The structure of the judgment matrix is expressed as,
A = [   Criteria   1 Criteria   2 Criteria   n Criteria   1 1 α β Criteria   2 1 α 1       1       1 Criteria   n 1 β 1 ]
The matrix in Equation (1) shows that criteria 1 is β times more important than criteria n . The lower and upper triangles of the matrix are reciprocal, and the diagonals are equal.
Following Zahedi [33], respective weights are calculated by expressing Equation (1) as,
A ^ = [ w 1 / w 1 w 1 / w n w n / w 1 w n / w n ]
If matrix [ A ^ ] in Equation (2) has rank 1, then,
A ^ × W ^ = λ ^ m a x × W ^
where, W ^ is the right eigen vector of A ^ and λ ^ m a x is the largest eigen value of A ^ . λ ^ m a x n and λ ^ m a x   n is a sign that matrix [ A ^ ] is consistent [17]. Correspondingly, the consistency index and consistency ratio are formulated as,
C . I . = λ ^ m a x n n 1
C . R . = C . I . R . I .
where R.I. is the average index of randomly generated weights. C.R. < 0.1 is a sign of informed judgements and taken as a guidepost during pairwise comparisons [34].
The weights for the performance criteria are designated as primary weights [ W m ] and secondary weights [ w i m ] for the sub-criteria. The cumulative weight for each sub-criterion is the product of its secondary weight and the primary weight of its overlying criterion as,
Z i = W m   ·   w i m
where, m = E, S and V stand for economic, social, and environmental criteria and i represents economic (1 to 4), social (5 to 8) and (9 to 12) environmental sub-criteria.
Step 4: Performance evaluation of alternatives (Quantification of requirements).
The goal of performance evaluation is objective assessment. Correspondingly, we propose rules for quantification of performance criteria and sub-criteria on a scale of 0–1 signifying least to most favourable performance. This ensures uniformity in units and scales of values across sub-criteria.

2.2.1. Economic Sub Criteria

For design alternative j evaluated against economic sub-criteria [ C i = 1   t o   4 E ], performance scores x i E j are calculated on a yearly basis in a common currency. For non-recurring costs such as manufacturing cost, maintenance cost and recycling cost, the performance value is divided by the vessel’s design service life (Tj). To ensure room for unknown alternatives and to have ratings > 1, the performance scores are divided by 1.2 times (accounts for forecasting uncertainties in the transport sector [35]) the value of the most expensive alternative and converted into performance ratings [ y i E j ], expressed as,
y i = 2 E j = 1 x i E j max j = 1   to   N ( 1.2 x i E j )
y i = 1 , 3 , 4 E j = 1 x i E j / T j max j = 1   to   N ( 1.2 x i E j / T j )
where N is the number of alternatives that are being compared.

2.2.2. Social Sub-Criteria

For evaluating social performance sub-criteria [ C i = 5   t o   8 S ], we developed guidelines based on passenger preference surveys carried out in Stockholm, the details of which can be found in [4]. Table 4 summarises social performance criteria along with rough default values developed in consultation with vessel operators.
Under ambience, the study found ability to see outdoors boosted perception similar to findings in [36]. Ferry operators on line 80 were of the perception that commuters liked the potential for outdoor access even if entry is restricted. The study also found cleanliness to be a very important part of perception [4].
Under comfort, availability of seating was found to be more important than seating quality, yet both were significant. Overcrowding was found to be a deterrent in studies in Queensland [37] and Stockholm [10]. Amenities such as food and drink were found to have a positive perception through on-board interviews with commuters during surveys, which were seconded by the vessel operators. Lastly, ship motions’ association with comfort are defined by IMO guidelines [38] and included.
Under safety, 6 safety dimensions were identified in [39] for ferries. Of these, firefighting equipment, rescue equipment, vessel construction, communication equipment and crew member availability were found relevant from a commuter’s perspective.
Under service, the surveys found punctuality, accessibility for the disabled to be important drivers [4]. Further, arrangements for carrying bikes was found to be important in some cities [1]. The importance of travel time and information systems on board were noted through interviews with PTPs and commuters during surveys.
The sub-criteria performance score scores x i S j are calculated by averaging the total of dimension scores for each sub-criterion as,
x i S j = f = 1 F x i f S j F
where F is the number of dimensions.
The performance ratings are expressed as,
y i S j = x i S j 10

2.2.3. Environmental Sub-Criteria

For evaluating environmental criteria, the performance scores x i V j for emissions sub-criteria C i = 9   t o   11 V are evaluated in grams per nautical mile and marine noise C i = 12 V in decibels. For the sub-criteria, an upper emission limit U L e m i and an upper noise limit U L n o i = 70 dB [40] are assumed, over which performance scores are assigned as 0. The rating y i V j for the jth alternative is expressed as,
E m i i = 9 , 10 , 11 V j = U L e m i x i V j U L e m i
y i = 9 , 10 , 11 V j = U L e m i x i V j / T j N M U L e m i 0                         E m i i = 9 , 10 , 11 V j 0 E m i i = 9 , 10 , 11 V j < 0
The noise performance rating is expressed as,
y i = 12 V j = U L n o i x i V j U L n o i
Step 5: Evaluation of DPIs.
The cumulative weights of criteria from step 3 and performance ratings of alternatives from step 4 are multiplied to evaluate the DPI ( Y j ) for the jth alternative as,
D P I = Y j . = i = 1 12 Z i × y i M = E / S / V j
Economic, social, and environmental performance indices are calculated by summations over respective sub-criteria as,
Y j ,   E C O n = i = 1 4 w i E × y i M = E j
Y j ,   S O C n = i = 5 8 w i S × y i M = S j
Y j ,   E N V n = i = 9 12 w i V × y i M = V j
These indices rank the alternatives which allows objective decision making for PTPs.

2.3. Fuzzy AHP: Treatment of Uncertainties

AHP relies on human input for crisp judgements as seen in Equation (1)). The inherent disadvantage of not being able to handle uncertainties arising from inadequate mapping of the decision maker’s preference due to reluctance or incomplete information can lead to a wrong assignment of weights, leading to the selection of an inefficient ferry. On the other hand, using linguistic metrics representing an interval may inspire decision makers to make more confident judgements [22]. Such an adaptation of AHP that incorporates the inherent uncertainties due to unquantifiable, incomplete and non-obtainable information can be addressed by using fuzzy sets in pairwise comparisons [41].
There are a few fuzzy AHP (FAHP) approaches discussed in the literature, beginning with the Van Laarhoven and Pedrycz [42] approach, which compared fuzzy ratios described by triangular membership functions. The work was extended by Buckley [43], who used trapezoidal membership functions to derive fuzzy priorities. Chang [21] introduced a new approach using extent analysis (EA) to deduce synthetic extent values of pairwise comparisons. This method has been widely used and preferred for its simplicity in application [44]. Limitations with other contemporary FAHP approaches are that fuzzy priorities represented as fuzzy numbers/sets can lead to an overlap over a large range, resulting in an irrational outcome of final fuzzy scores [45].
A more robust method over existing methods is fuzzy preference programming proposed by Mikhailov [46]. The method derives optimal crisp priorities based on α-cuts decomposition of the fuzzy judgements into interval comparisons. However, a significant disadvantage is the mathematical complexity for practical applications [44]. To overcome the mathematical complexity, one may apply a nonlinear optimization routine such as particle swarm optimization (PSO) to derive exact priorities from fuzzy comparison judgements [22]. This approach also caters for uncertainties associated with missing information in pairwise judgements, which may be the case when PTPs are unable to decide relative importance.
We use Chang [21]’s extent analysis (FAHP-EA) and Javanbarg, Scawthorn [22]’s FAHP-PSO approach and compare them with crisp weights derived from Saaty [17]. FAHP-EA approach presents the advantage of easy implementation while FAHP-PSO incorporates uncertainties better. The methodology for converting fuzzy scores into weights for both methods can be found in Appendix C.

3. Results

The weights calculated using the two fuzzy AHP approaches are compared first. Then, two applications of the method are discussed. First, we compare three ferries and identify respective strengths and weaknesses. Next, we explore modular ferry assembly.

3.1. Weight Calculation Using a Fuzzy AHP Approach

Sample input for intensities of importance for criteria and sub-criteria. The survey to record this input is shown in Appendix D in the form of a user-friendly graphical user interface (GUI).
A k e y = ( 1 1 / 3 1 / 6 3 1 1 / 4 6 4 1 ) ;   A e c o = ( 1 5 6 9 1 / 5 1 4 6 1 / 6 1 / 4 1 2 1 / 9 1 / 6 1 / 2 1 ) A s o c = ( 1 3 4 6 1 / 3 1 2 4 1 / 4 1 / 2 1 2 1 / 6 1 / 4 1 / 2 1 ) ; A e n v = ( 1 2 4 9 1 / 2 1 3 5 1 / 4 1 / 3 1 3 1 / 9 1 / 5 1 / 3 1 )
These are converted to a fuzzy pairwise comparison for FAHP-EA’s input following rules in Table 5, as shown in Table 6. Similarly, they are converted to fuzzy inputs for FAHP-PSO following Wang, Chu et al. [47]’s formulation in Table 5 (not shown here).
In Table 7, Table 8, Table 9 and Table 10 the CR fall under 0.1 indicating consistency. Further, the consistency indices λ P (Equation (A18)) for the choices under the FAHP-PSO approach falls between 0 and 1, representing consistency.
From Table 7, we observe a nearly similar prediction of weights between crisp AHP and FAHP approaches. The consistency index for FAHP-PSO indicates good prediction quality. Based on the choices in Equation (18), environmental performance is most important and economic performance is least important.
For economic performance in Table 8,we observe the problem Wang, Chu et al. [47] highlight as a limitation with extent analysis that when two triangular fuzzy numbers do not intersect, there may be a zero degree of possibility, leading to a zero assignment to weight [49] as observed here with maintenance and recycling/other cost receiving the value 0. Since it is unreasonable to omit sub-criteria in the evaluation of alternatives, the method cannot be relied upon, as also observed by Tyagi, Kumar [50]. The FAHP-PSO approach on the other hand predicts robust weights indicated by a 0 value for the consistency index.
Similarly, Table 9 and Table 10 compare predicted weights for social and environmental sub-criteria.
To compare the three methods, we plot the standard deviations of the 3 methods from the median in Figure 3, Figure 4, Figure 5 and Figure 6. We see that the FAHP-PSO approach performs the best which is confirmed by the low consistency index values.
In conclusion to this section, we note that using a fuzzy approach is advantageous in increasing the robustness in decision making. We observe that the FAHP-PSO method performs the best and predictions made by FAHP-EA method has the risk of predicting unreasonable weights. In the next section, we see the proposed method’s applications.

3.2. Evaluation of Ferries in Operation

It is of interest for the PTPs to assess their operational fleet in identifying its strengths and weaknesses to target refurbishments and upgrades. In this example, three existing ferries on line 80 in Stockholm are evaluated and compared. Ferry 1 is an electric ferry with an aluminium hull. Ferry 2 is an old diesel-powered vessel constructed with steel. Ferry 3 is a new diesel-powered ferry with scrubbers and a composite hull. The criteria weights are referenced from Table 7, Table 8, Table 9 and Table 10. Ferries’ performance scores can be found in Appendix E. The performance scores are converted into ratings following Equations (7) and (8) for economic performance and Equations (12) and (13) for environmental performance. The social performance is estimated using the guidelines introduced in Table 4.
The ferry DPIs and criteria-wise DPIs are shown in Figure 7a. They indicate that Ferry-1 is the best performer with a DPI of 0.71, while Ferry 2 is the worst performer with DPI of 0.4. From a decision-making perspective, the tool makes the selection process objective and highlights respective strengths and weaknesses. Here, for example, environmental performance is the strength of Ferry 1 while social performance is the strength of Ferry 2 and 3. We can conduct a break-down study of social performance as shown in Figure 7b. We notice that service and comfort are weak performers (index < 0.5) while ambience and safety are strengths for Ferry 2. Service and comfort may be further broken down to identify weaknesses at a greater resolution. Such information can justify and drive targeted refurbishment.
Since the weight preferences evolve over time, the same method can be used at different phases of the ferry’s life, resulting in different insights. The same methodology may be used for evaluating second-hand ferries and new ferry concepts. Next, we look at demonstrating a more complex application: the assembly of a modular ferry.

3.3. Assembly of a Modular Ferry

For demonstrating the application, a modular commuter ferry concept [29,51] shown in Figure 8a is used. The ferry is envisaged as an assembly of five functionally independent modules where the superstructure module is further divided into four submodule types X, Y, Z and E such that there are two of each. In total, the superstructure has eight submodules. The hierarchy is visualized in Figure 8a. Each module and submodule type represents a space that may be fulfilled by multiple design alternatives. For example, Figure 8c shows different alternatives for sub-module type Z. The challenge here is to choose among potentially hundreds of suitable alternatives. For the PTPs, this can be overwhelming.
Here, we demonstrate the method’s application by tailoring the ferry towards local requirements through choosing the most appropriate modules. For the sake of demonstration, three modules are assumed: superstructure, hull and engine. Further, four submodule types are assumed under the superstructure module. For each module/submodule, four alternatives are evaluated. Their descriptions can be found in Appendix F. The performance scores necessary for this evaluation are indicated in Appendix G.
The DPI ( Y k   =   m o d u l e ) of modules consisting of two or more submodules is calculated by evaluating the mean of the DPIs of constituent submodules, denoted as,
Y p k = 1 G Y j S M G
for the pth combination of module assembly where G is number of sub-modules.
The DPI of the tth modular ferry assembly is calculated by the mean of its constituent module DPIs, expressed as,
D P I t = Y t F e r r y = k = S S ,   H u l l E n g i n e Y p k / 3
where k = S S ,   h u l l ,   e n g i n e represents modules.
The method’s application is divided into three stages: (a) Input–Weight preferences and route type. (b) Output–Performance of alternatives (c) Selection–Choosing alternatives for modular ferry assembly.
Corresponding to PTP’s input on route type, ferry size variant, desired capacity, mandatory requirements, suitable module alternatives are shortlisted. In addition, respective intensities of importance are input resulting in weights corresponding to Table 7, Table 8, Table 9 and Table 10 for the three tertiary criteria and constituent sub-criteria.
Using the weights, the respective DPIs of all shortlisted alternatives are calculated as seen in Figure 9. The first three charts (Figure 9a–c show performance indices with respect to economic, social, and environmental performance and the fourth chart (Figure 9d shows the overall DPI. These DPIs aid the PTP in objectively picking the highest performing alternatives.
Based on alternatives’ DPIs, the modular ferry is assembled using a sample graphical user interface in Figure 10 to help visualise the selection process. For the given choice of alternatives, the best modular ferry combination has a DPI of 0.6. The superstructure, hull, and engine DPIs are 0.64, 0.58 and 0.58, respectively.
Through the method’s application module, selection can be performed in an objective manner, resulting in a ferry tailored towards local requirements potentially saving the hassle of choosing among many alternatives.

4. Discussion

We start by discussing MCDM methods. Many contemporary studies focus on hybrid models which integrate the advantages of two or more MCDM methods. Pamucar, Deveci [52] developed a WASPAS (weighted aggregated sum product assessment) approach based on the fuzzy Hamacher weighted averaging function and weighted geometric averaging to assess the electrification of ferries. Baihaqi, Lazakis [53] combined DEMATEL (decision-making trial and evaluation laboratory) and TOPSIS to assess the performance of shipbuilding and ship-repair industry. Celik, Bilisik [54] combined TOPSIS and GRA (grey relational analysis) to evaluate customer satisfaction in Istanbul’s public transport. Gavalas, Syriopoulos [55] combined DEMATEL, ANP (analytic network process) and MOORA (Multi-objective Optimization on the basis of Ratio Analysis) to assess the key performance indicators in shipbuilding. Within hybrid models, usually the first method handles subjectivity from weight selection, while the latter method handles the subjectivity in score evaluation. Gündoğdu, Duleba [56] point out that using separate methods can lead to an incoherent decision and propose a coherent two-stage MCDM methodology. In our study, score evaluation rules have been defined to facilitate objective evaluations which negates the need for a hybrid model. However, if PTPs feel the need for surveys to evaluate social performance, then such a hybrid model may be developed as part of future work.
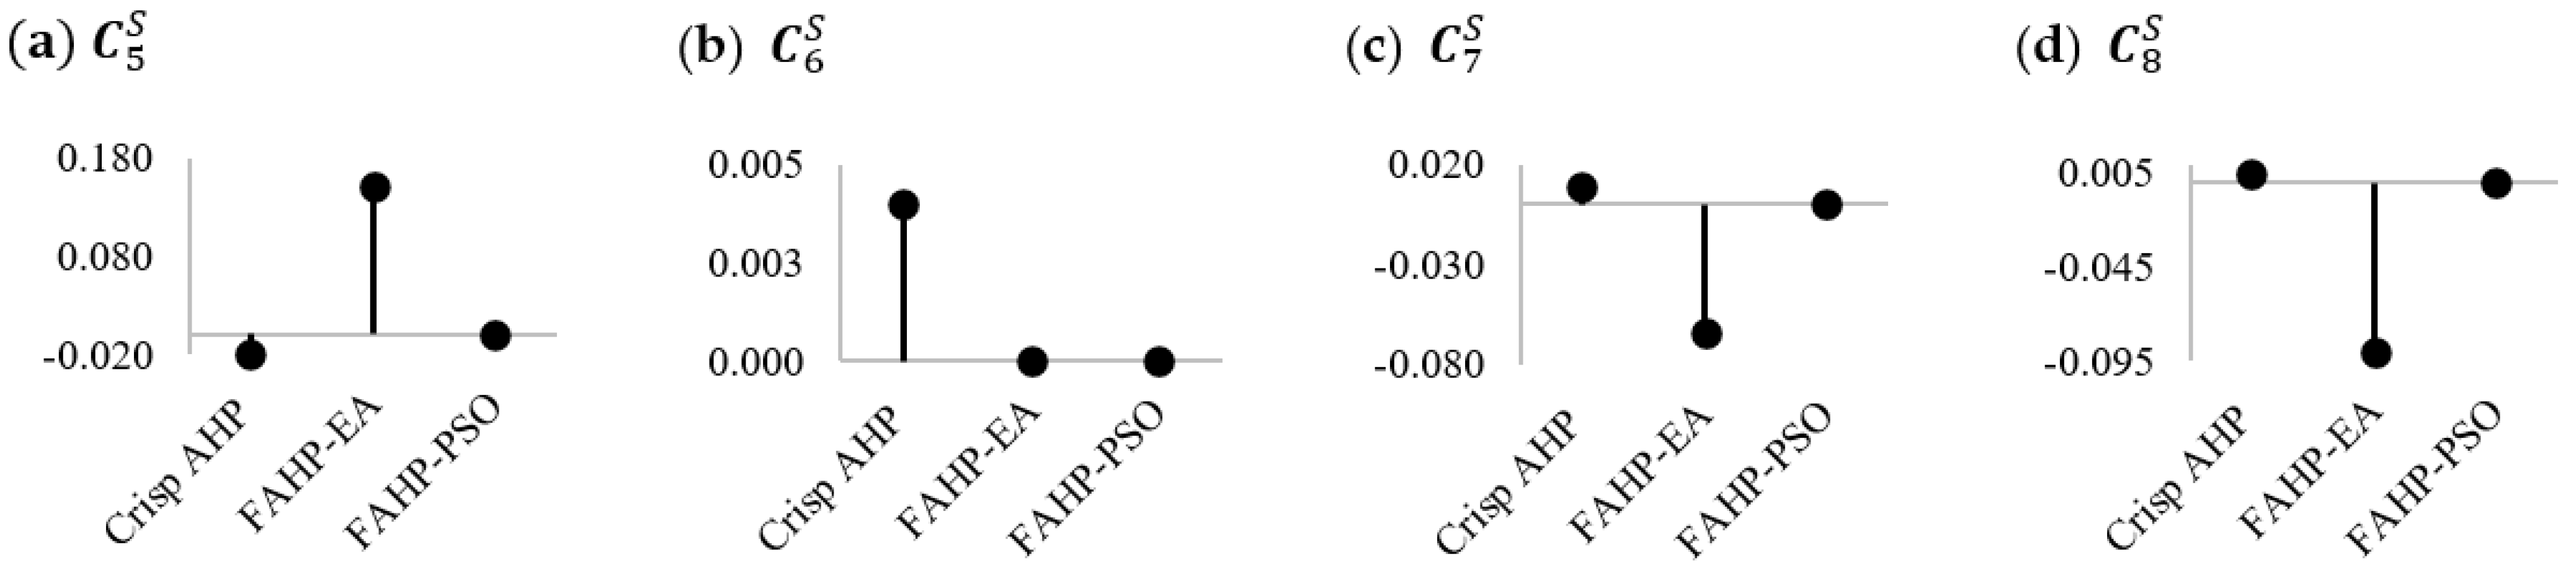
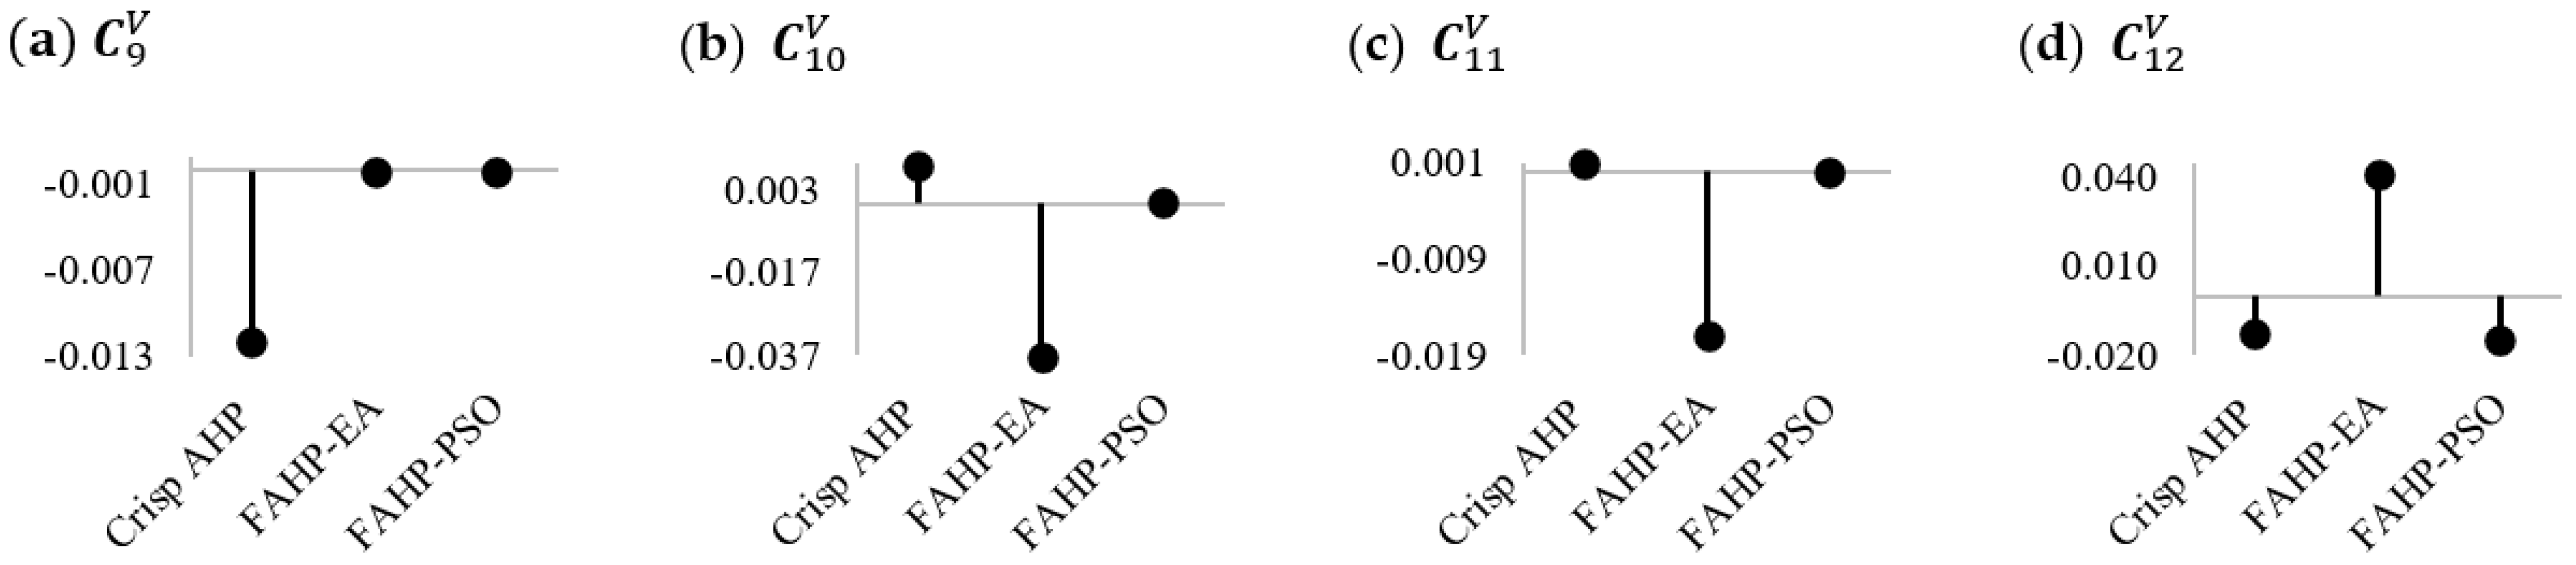
In our study, the MCDM problem is tackled using AHP for its simplicity in implementation. This does not represent an optimal method but a reasonable one. In our case, the number of pairwise comparisons are n(n − 1)/2 = 6 considering four sub-criteria per criteria. The comparisons may be reduced by using some newer techniques such as BWM (best worst method) [57], which would have 2n − 3 = 5 comparisons, and FUCOM (full consistency method) [58], which would have n − 1 = 3 comparisons. Six comparisons are not considered a daunting task for PTPs, and this reasonably justifies using AHP. However, improvements through newer methods may be adopted as part of future work.
The uncertainties associated with the selection of weights in this paper is handled by using a fuzzy approach. Here, we used triangular fuzzy sets [42]. However, newer membership functions incorporate greater uncertainties including those arising from hesitancy in groups [59]. Further, contemporary three-dimensional membership functions are capable of collecting experts’ judgements more explicitly. They include the interval-valued intuitionistic fuzzy sets [60], Pythagorean fuzzy sets [61] and interval extended neutrosophic sets [62]. A more sophisticated newer formulation is interval valued spherical fuzzy sets. It considers hesitant scoring and combines different stakeholder group opinions coherently [63]. This would be useful when different stakeholder groups compete to decide the ferry performance criteria weights. Such formulations may be added as part of future work.
Using AHP’s ability to handle intangibles and its easy mathematical implementation facilitates a small learning curve for PTPs to use the method. We found using Javanbarg, Scawthorn [22]’s fuzzy AHP approach in combination with PSO was more suitable in handling uncertainties. The extent analysis method [21] was found to be unreliable in certain cases and is unable to derive true weights, as pointed out by Wang, Chu et al. [47]. A few observations with respect to the evaluation method are discussed.
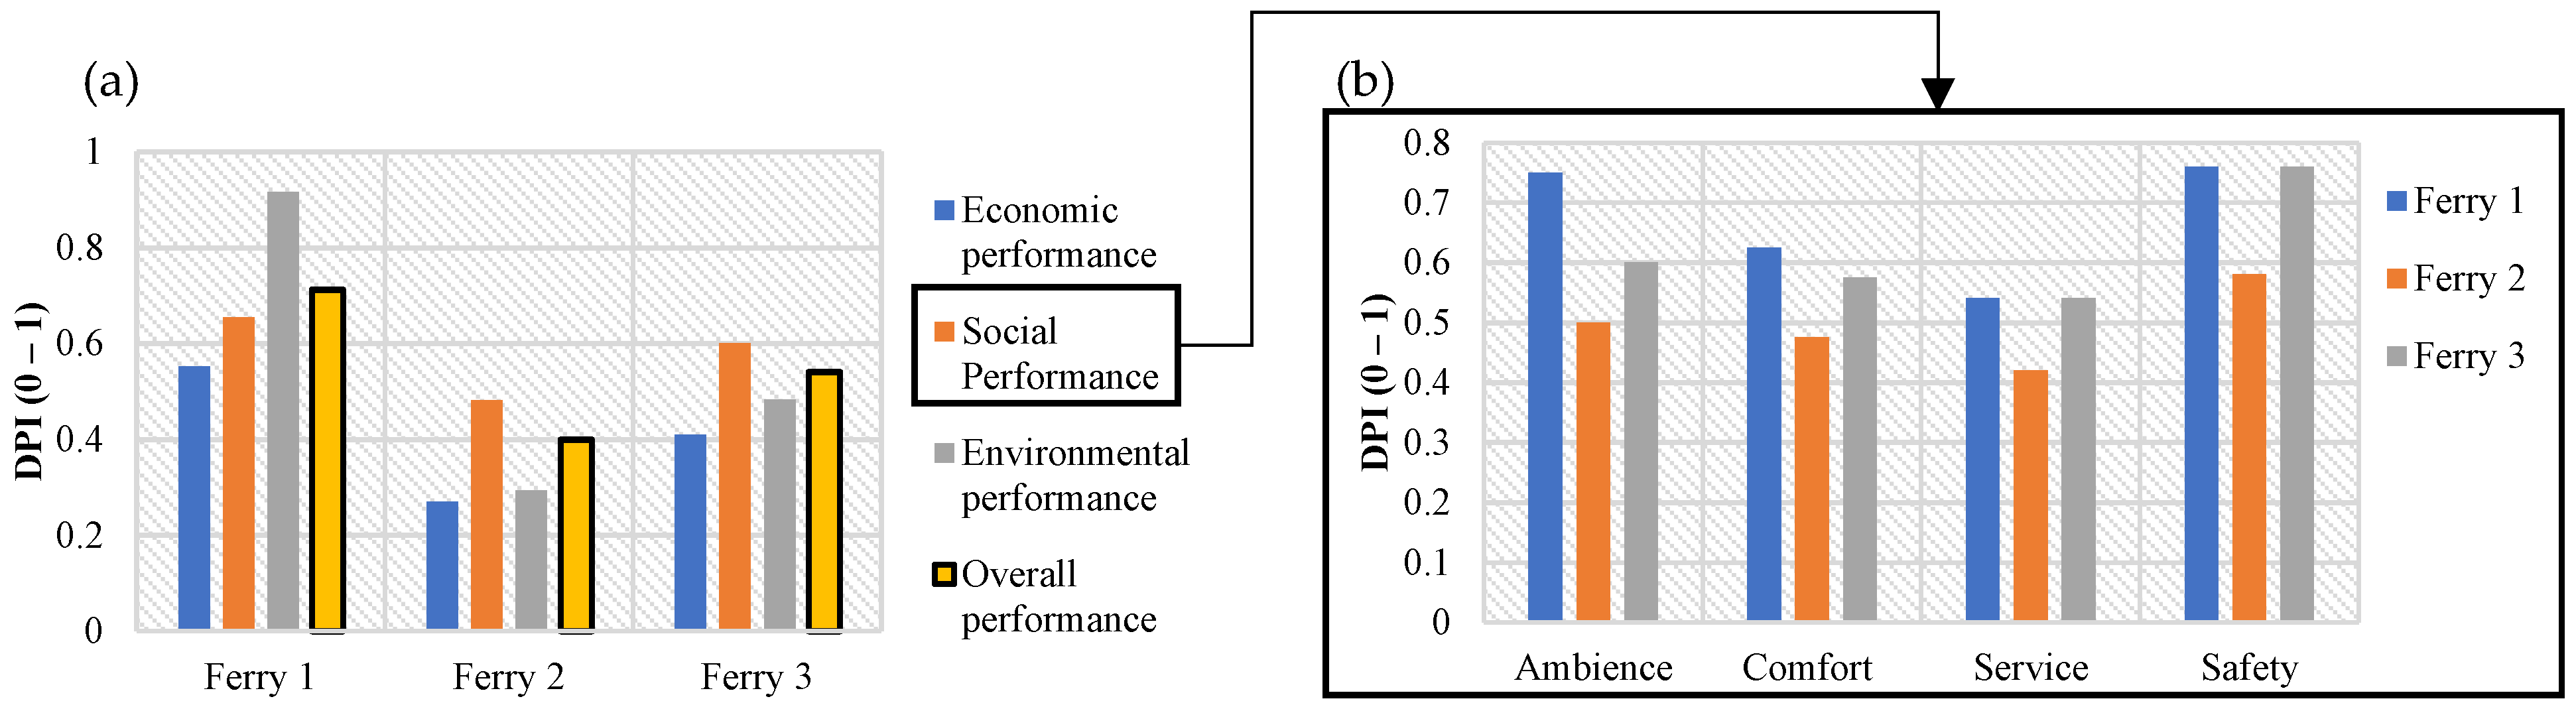
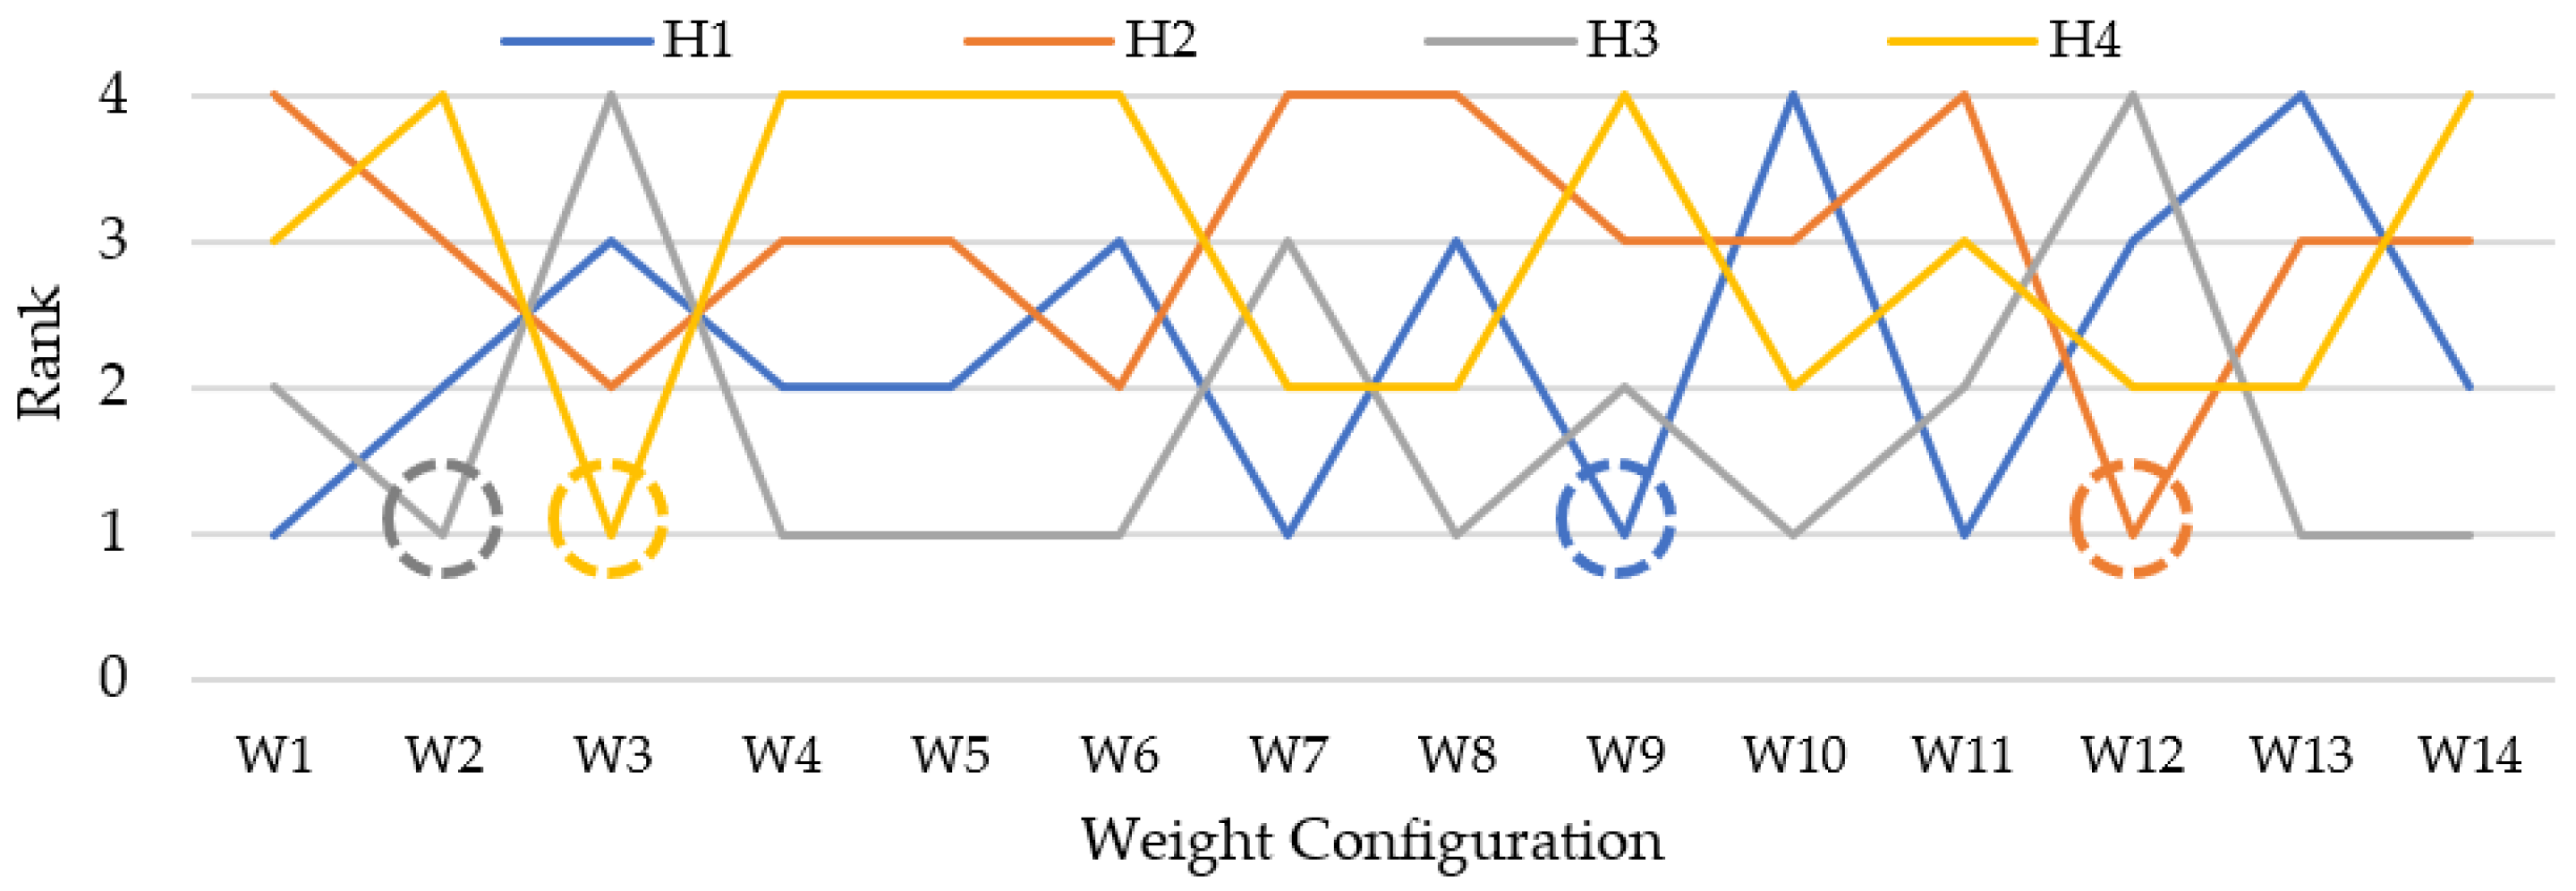
The alternative’s DPI is sensitive to the weights of performance criteria. These choices can vary between cities and PTPs due to differences in policy/interests/goals. Figure 11 shows a sensitivity analysis where the weight distribution is varied across the 12 sub-criteria. We notice that all four hulls rank as the favoured choice at different combinations of weights. This implies that a wrong choice of preferences may lead to the procurement of an inefficient ferry. This reinforces the need for an informed and balanced selection of weights in consultation with as many stakeholders as possible. Using interval-valued spherical fuzzy sets would be an apt way to capture the differences arising stakeholder groups [20].
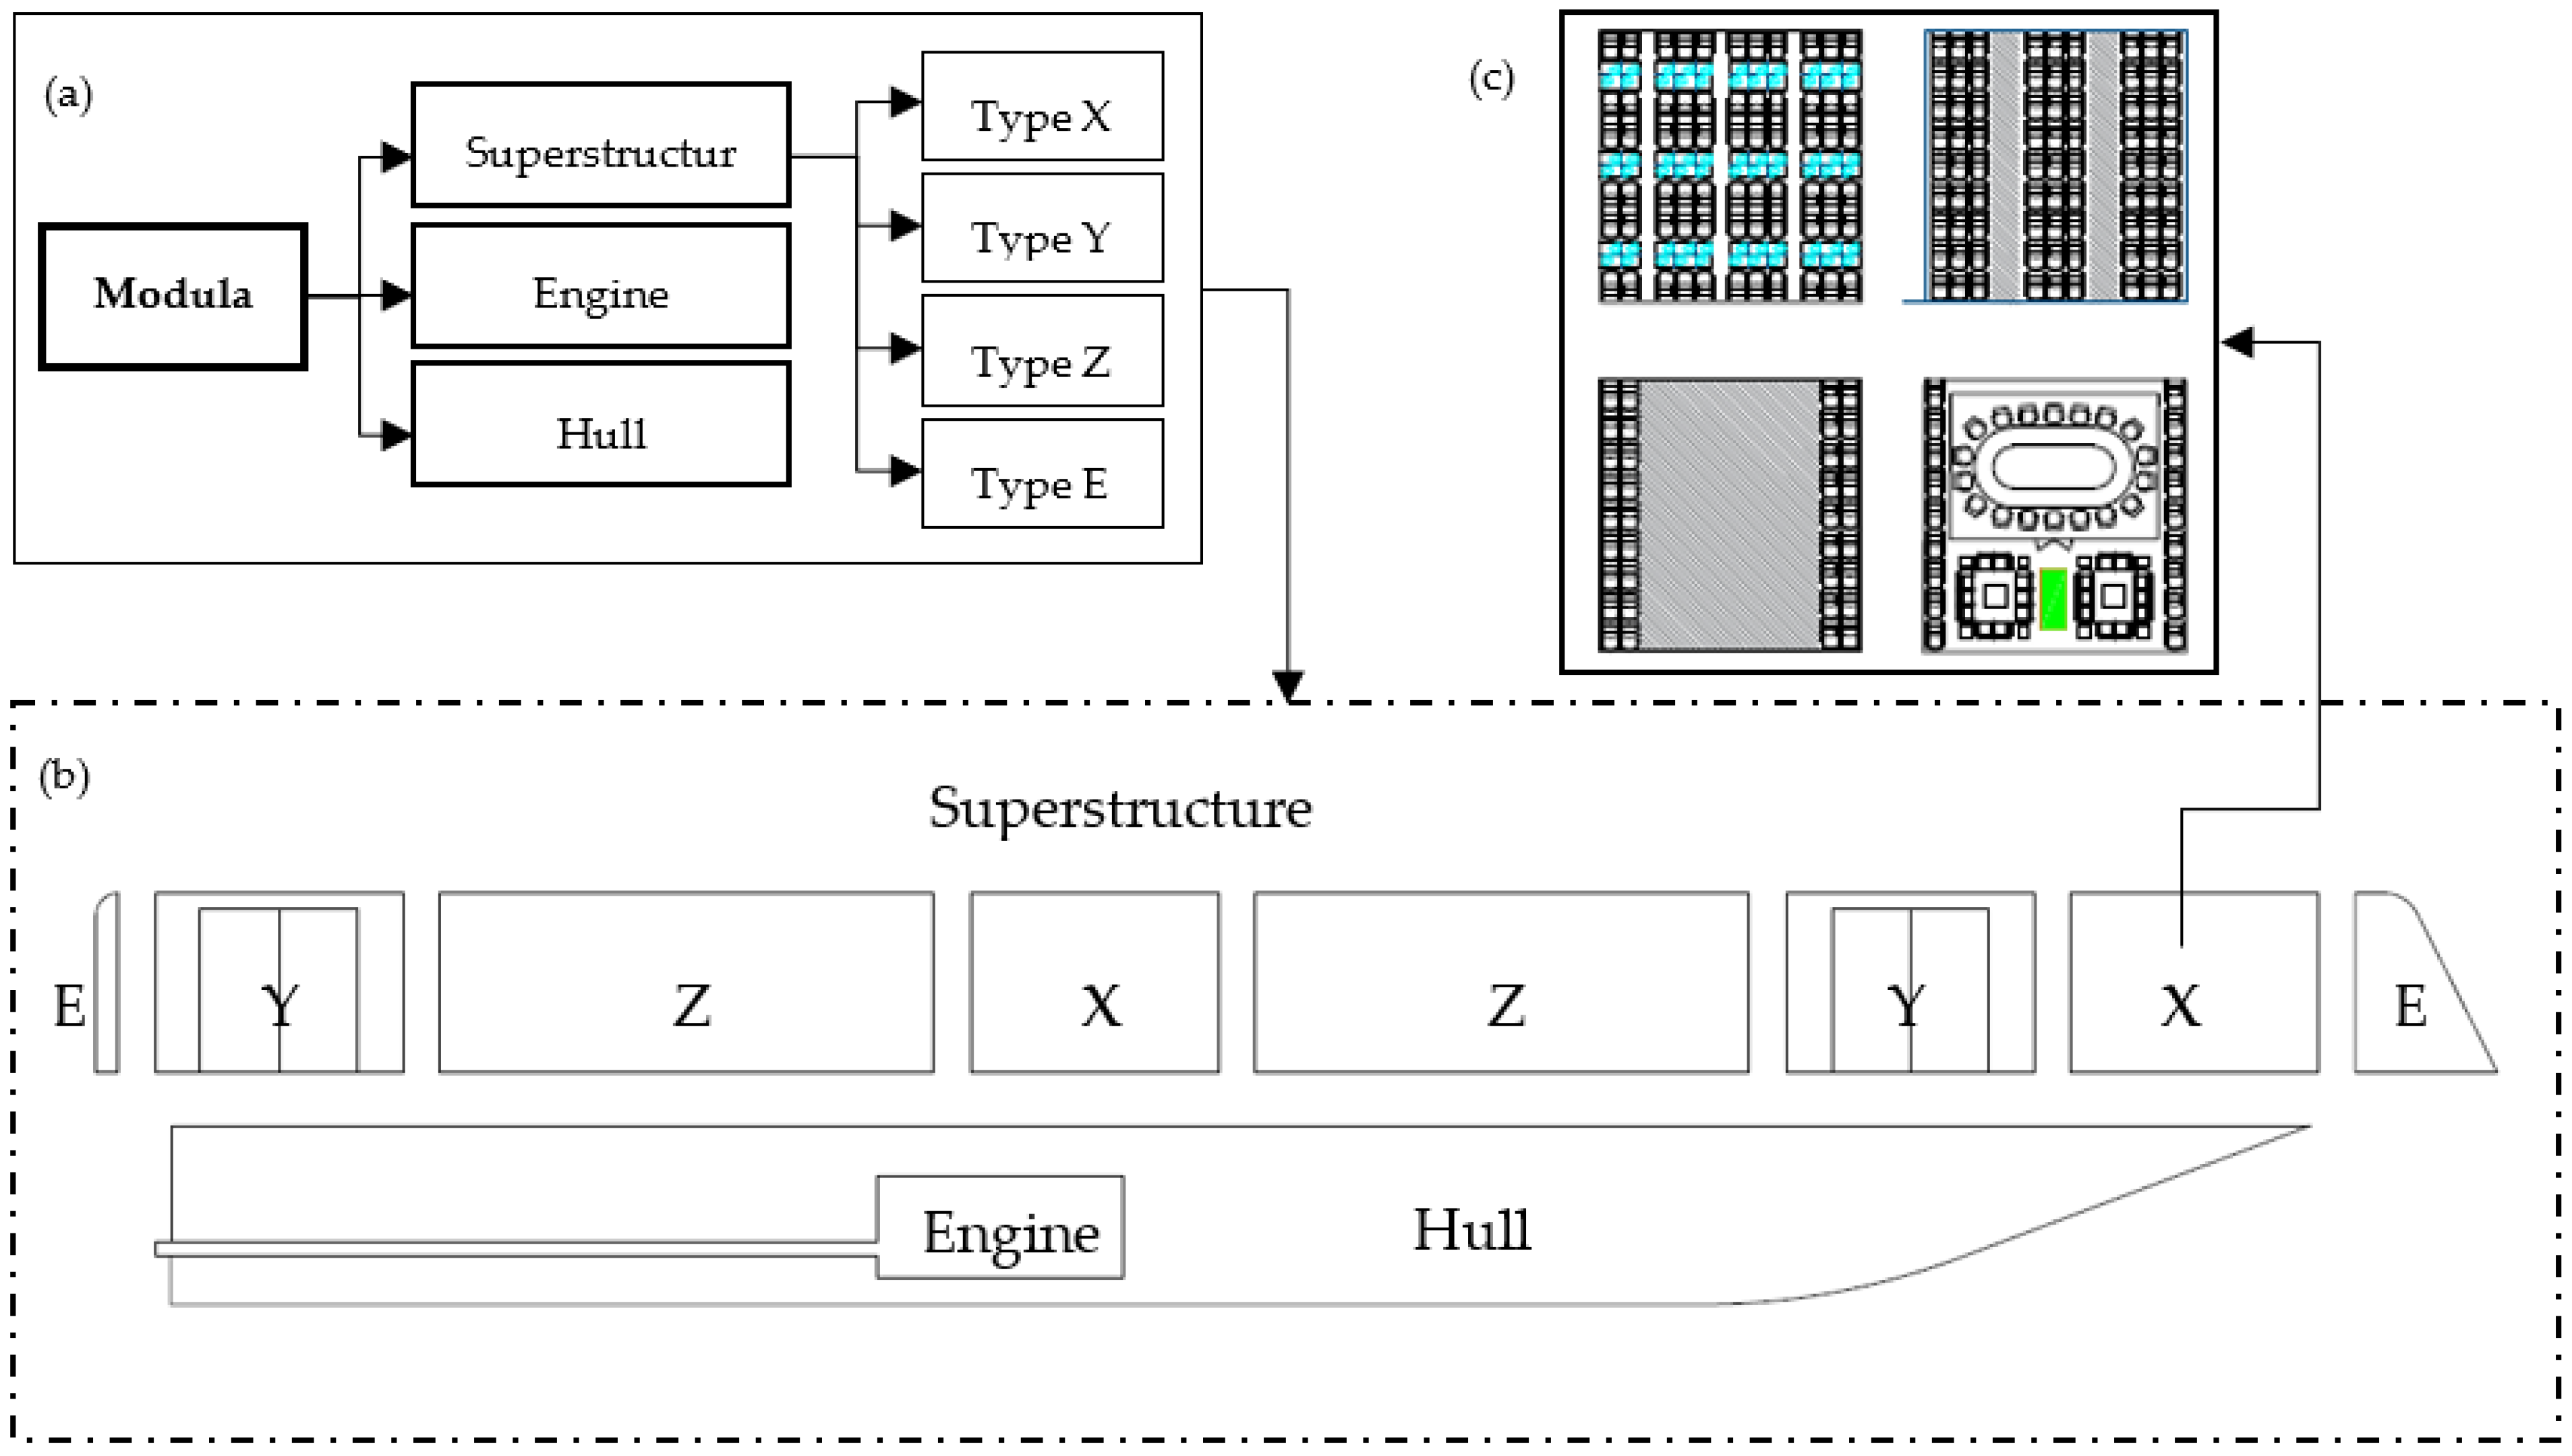
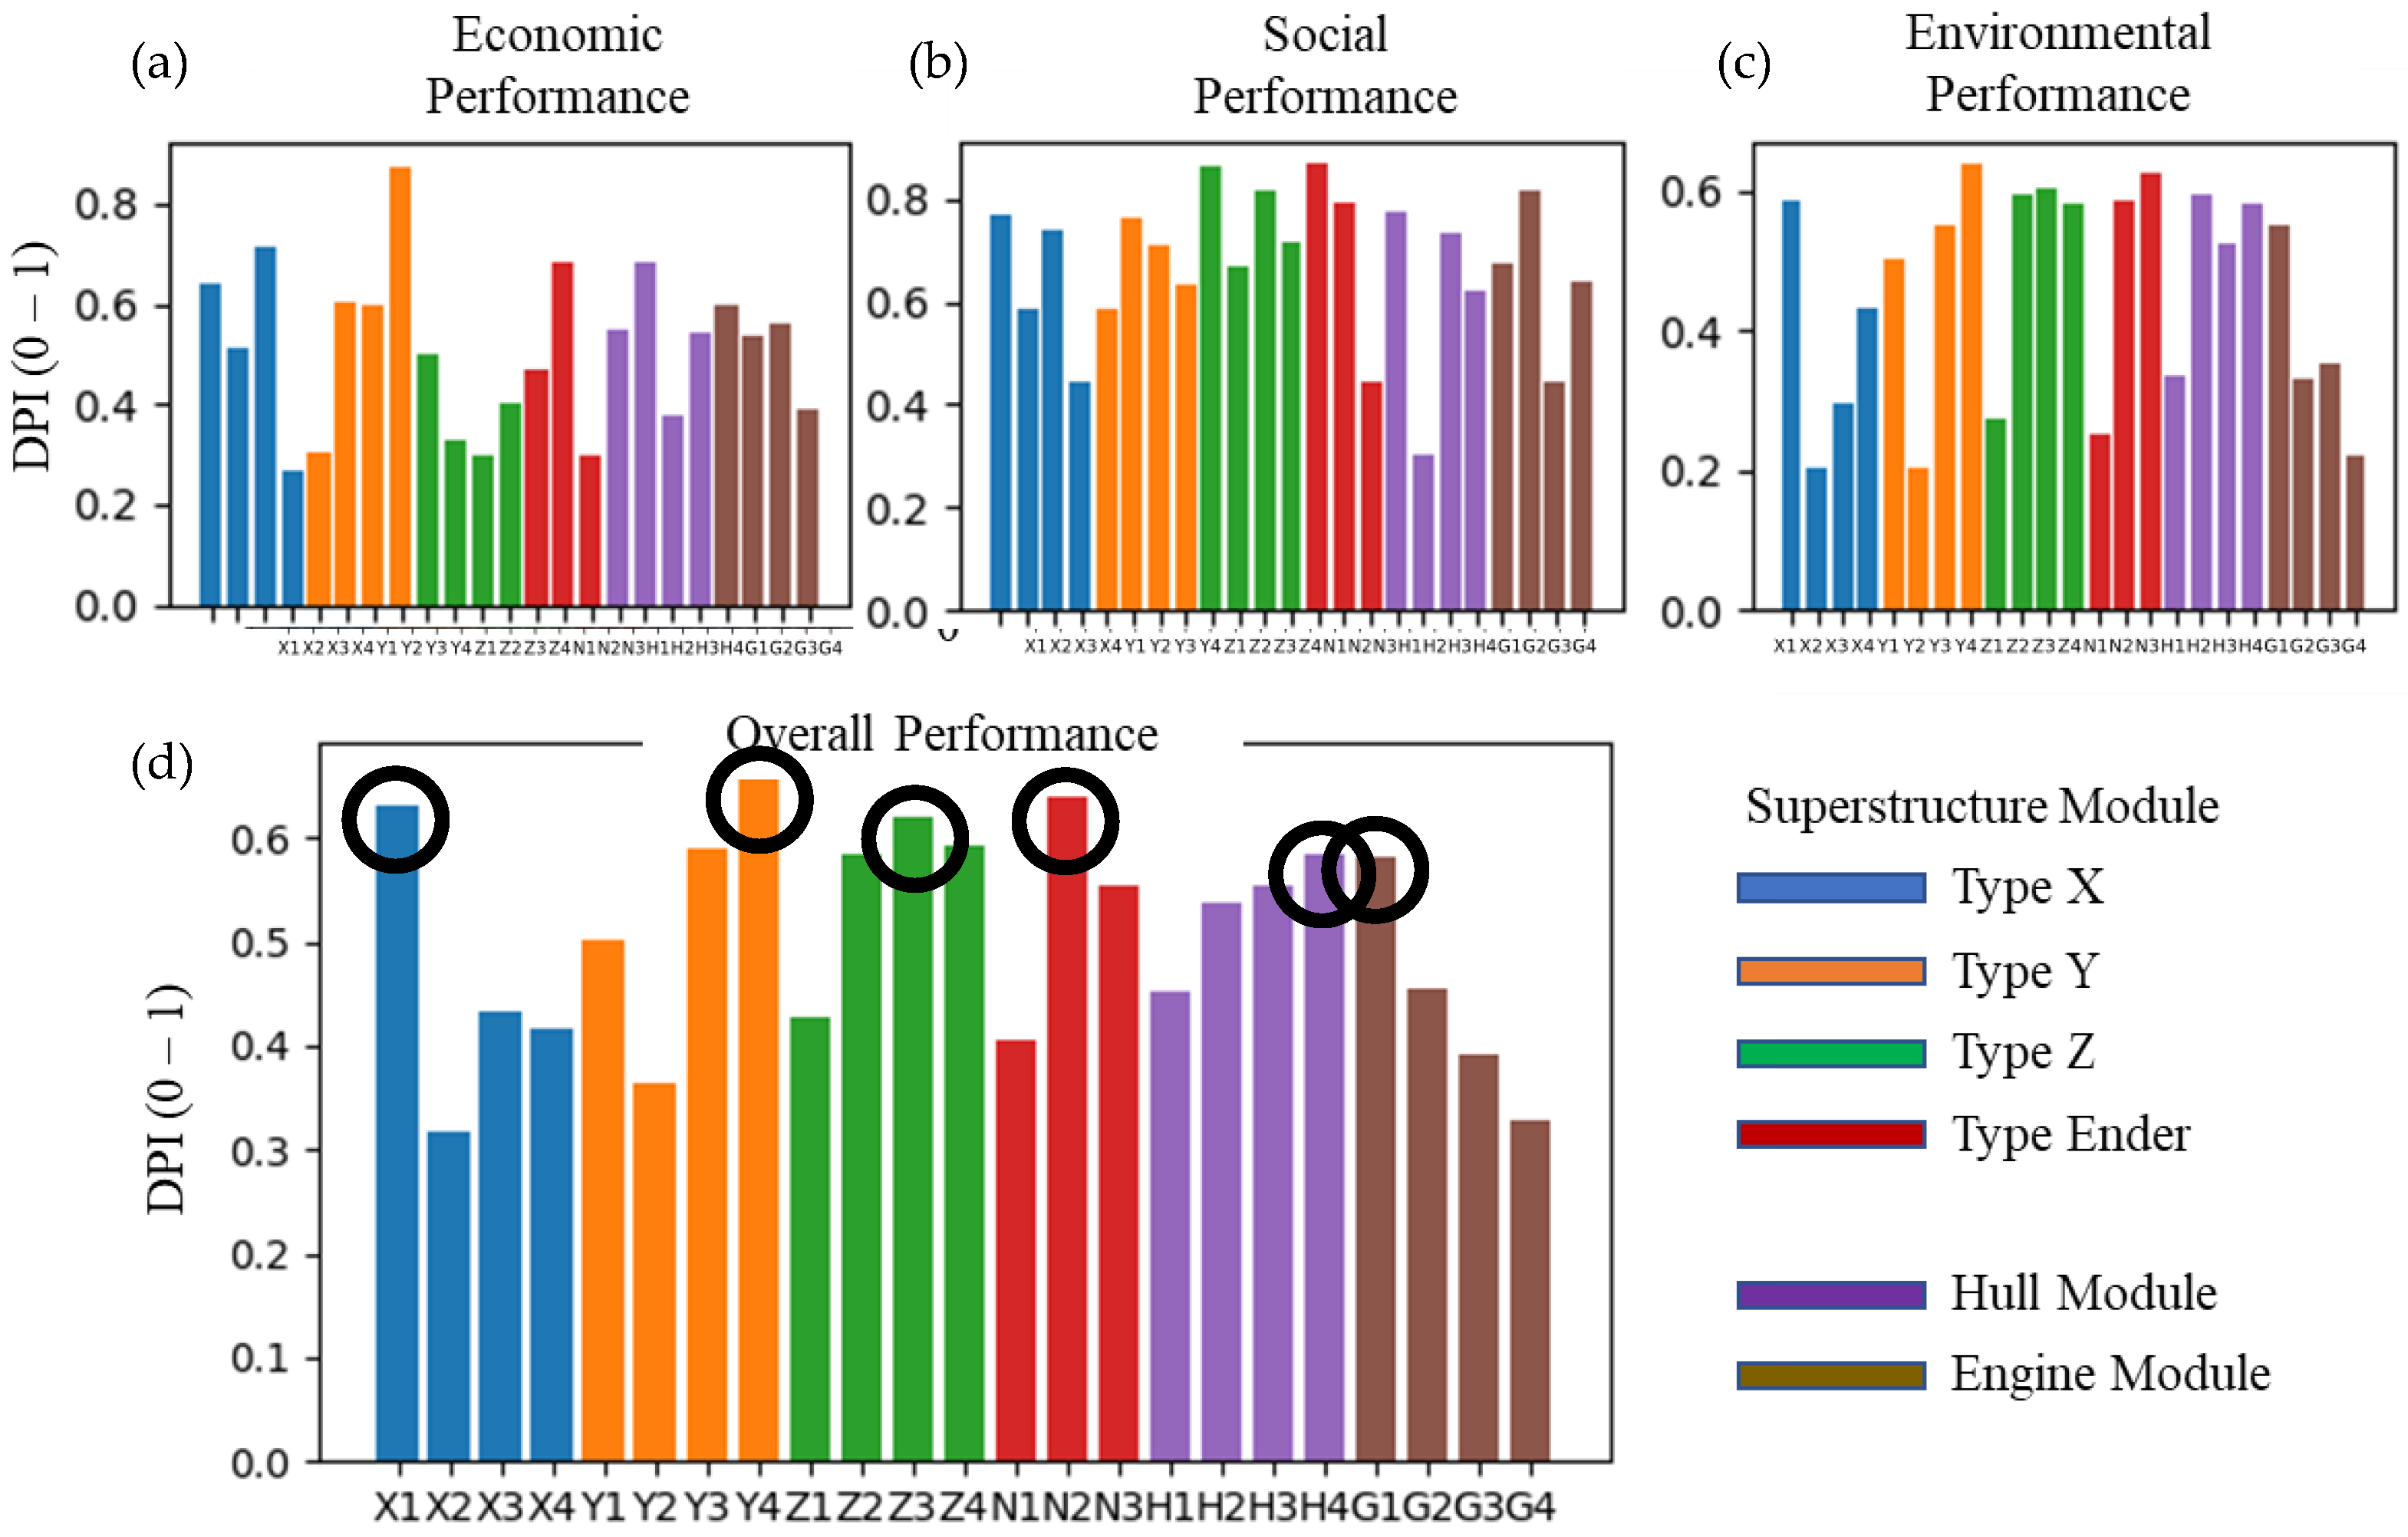
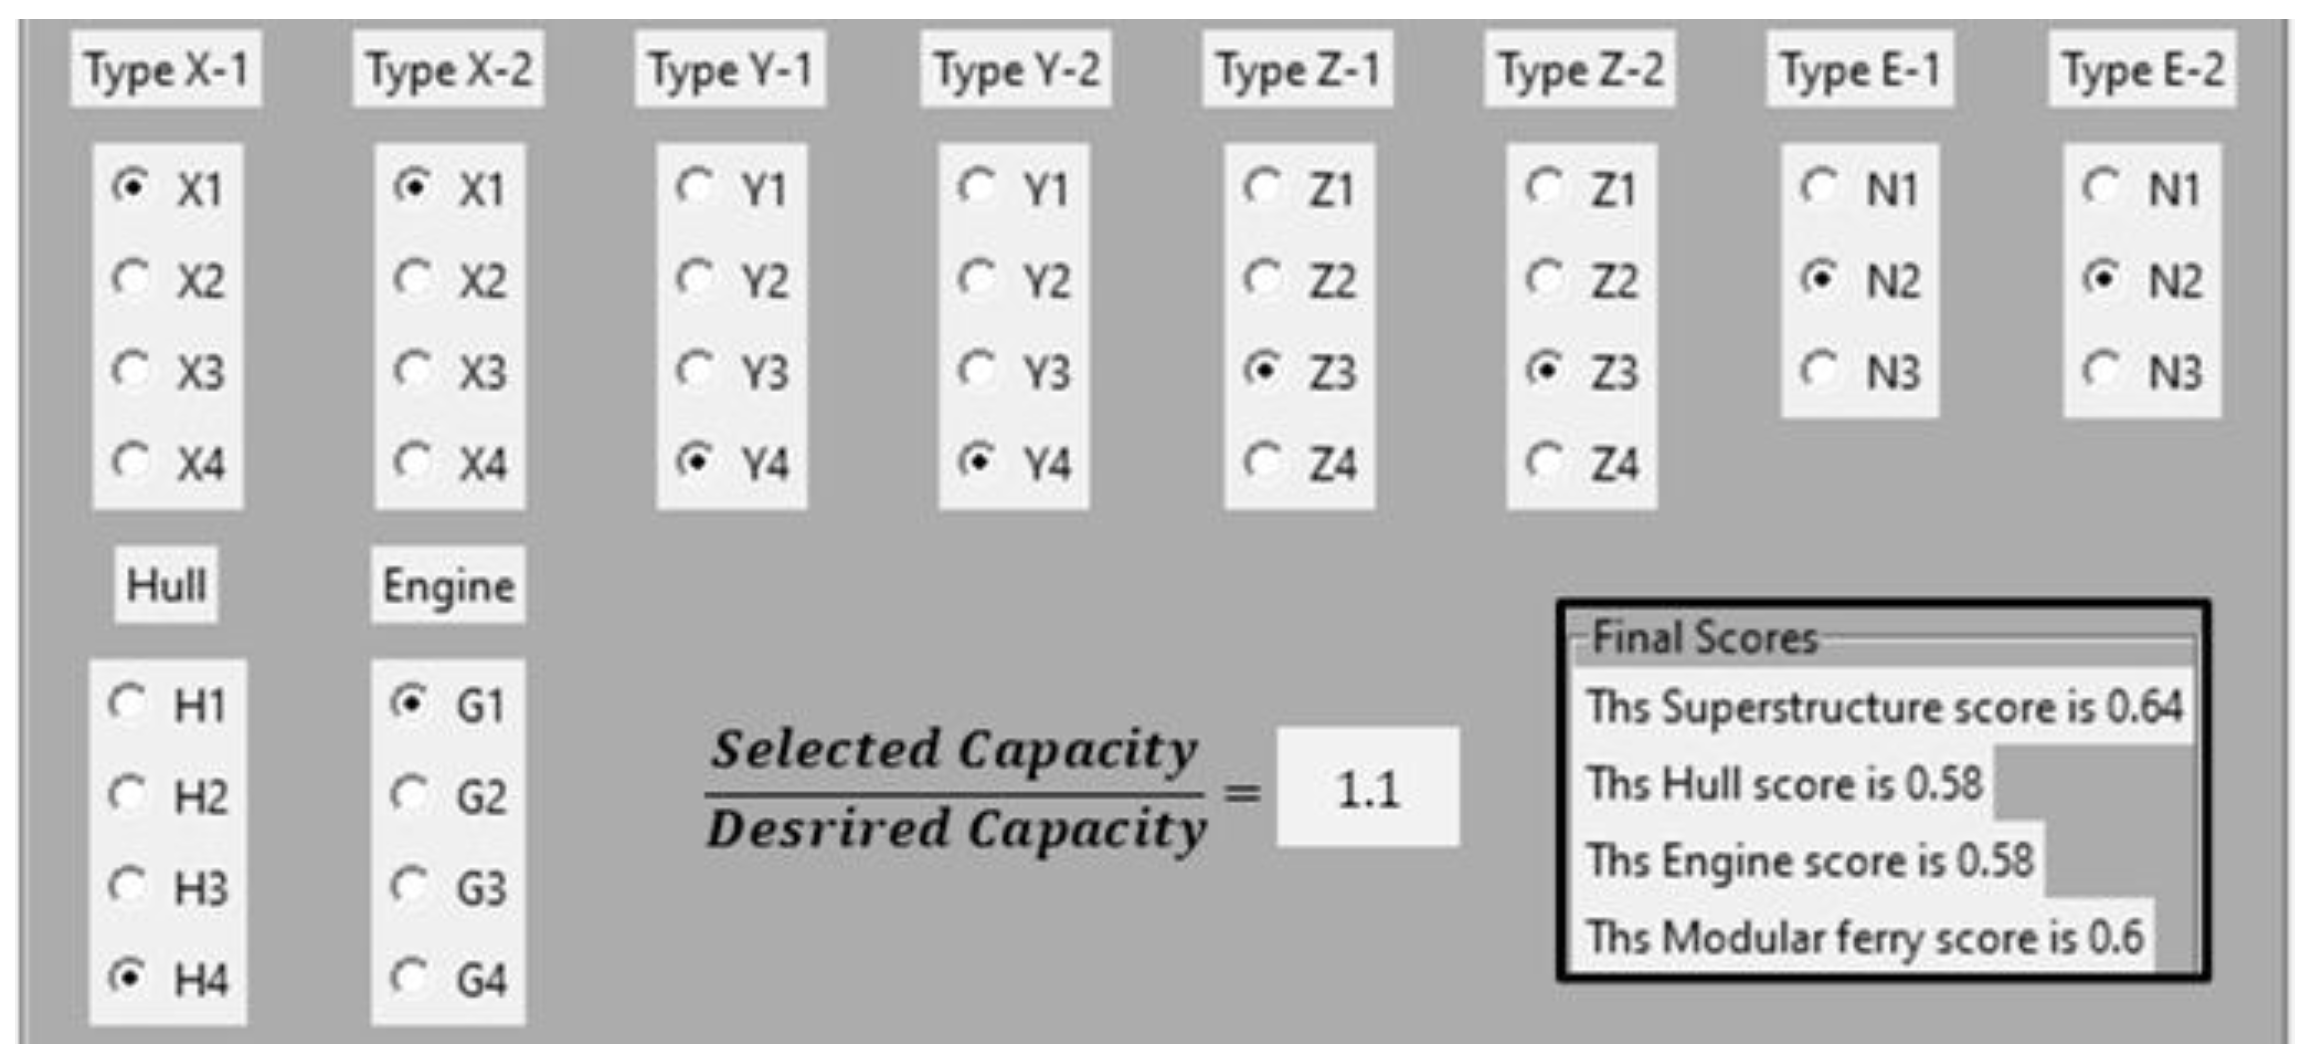
It is observed that the DPI of the assembled modular ferry in the example in Figure 10 is less than 1, indicating scope for improvement. The method pinpoints underperforming modules and which performance sub-criteria need attention. For example, hull module H1 has an economic index of 0.45. A breakdown of the index reveals that sub-criterion C 2 E -Operational cost is critical having a weight of 0.5. Correspondingly, efforts can be directed in lowering the operational cost to improve the DPI. This information may be picked up by companies as a market need, who could dedicate resources towards the targeted development of new modules. Considering that only a module requires development, rather than the entire ferry, smaller companies might be willing to participate in the development process. This argument stems from the associated advantage of modularization towards encouraging innovation [64].
In the example, some performance sub-criteria were not applicable to certain alternatives. For example, under environmental criteria, Operational emissions is not applicable to superstructure submodule Type X because it is related to passenger seating. In such cases, the alternatives obtain a performance value of 0 against non-applicable sub-criteria. Correspondingly, the weights of remaining sub-criteria under the criterion are recalculated after omitting inapplicable sub-criteria.
The analysis can provide justifications for refurbishment and upgrades by analysing its implications on the ferry’s performance by tracking its DPI. For example, in the ferry example, if scrubbers are installed on Ferry-2, the operational emissions would reduce from a fictional 80 g/NM to 30 g/NM. Correspondingly, the environmental index would increase, and economic index would decrease, resulting in an overall 15% increase in the ferry’s DPI.
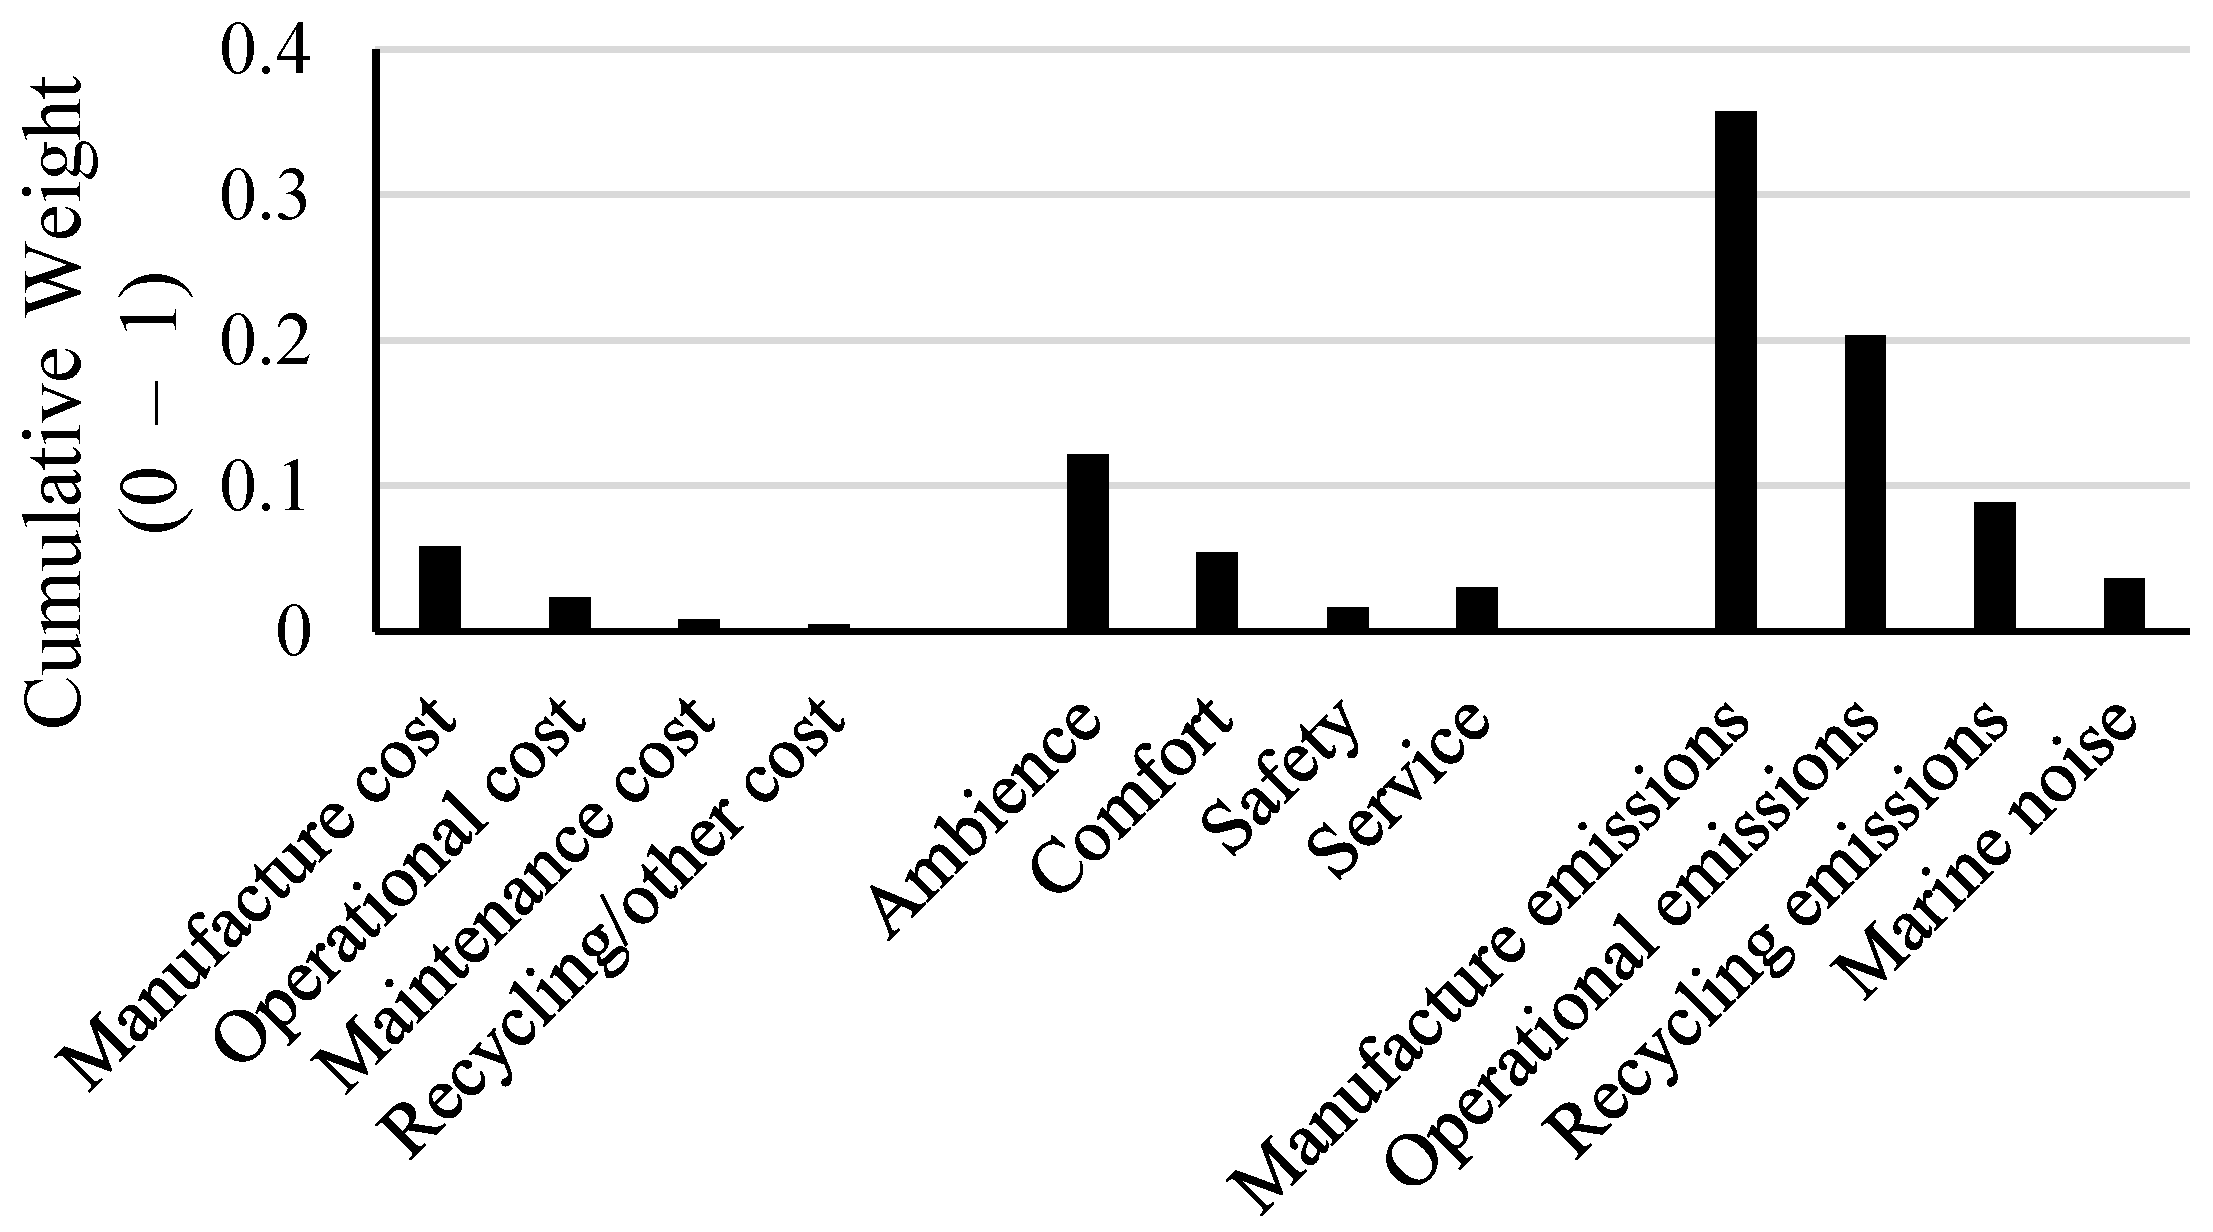
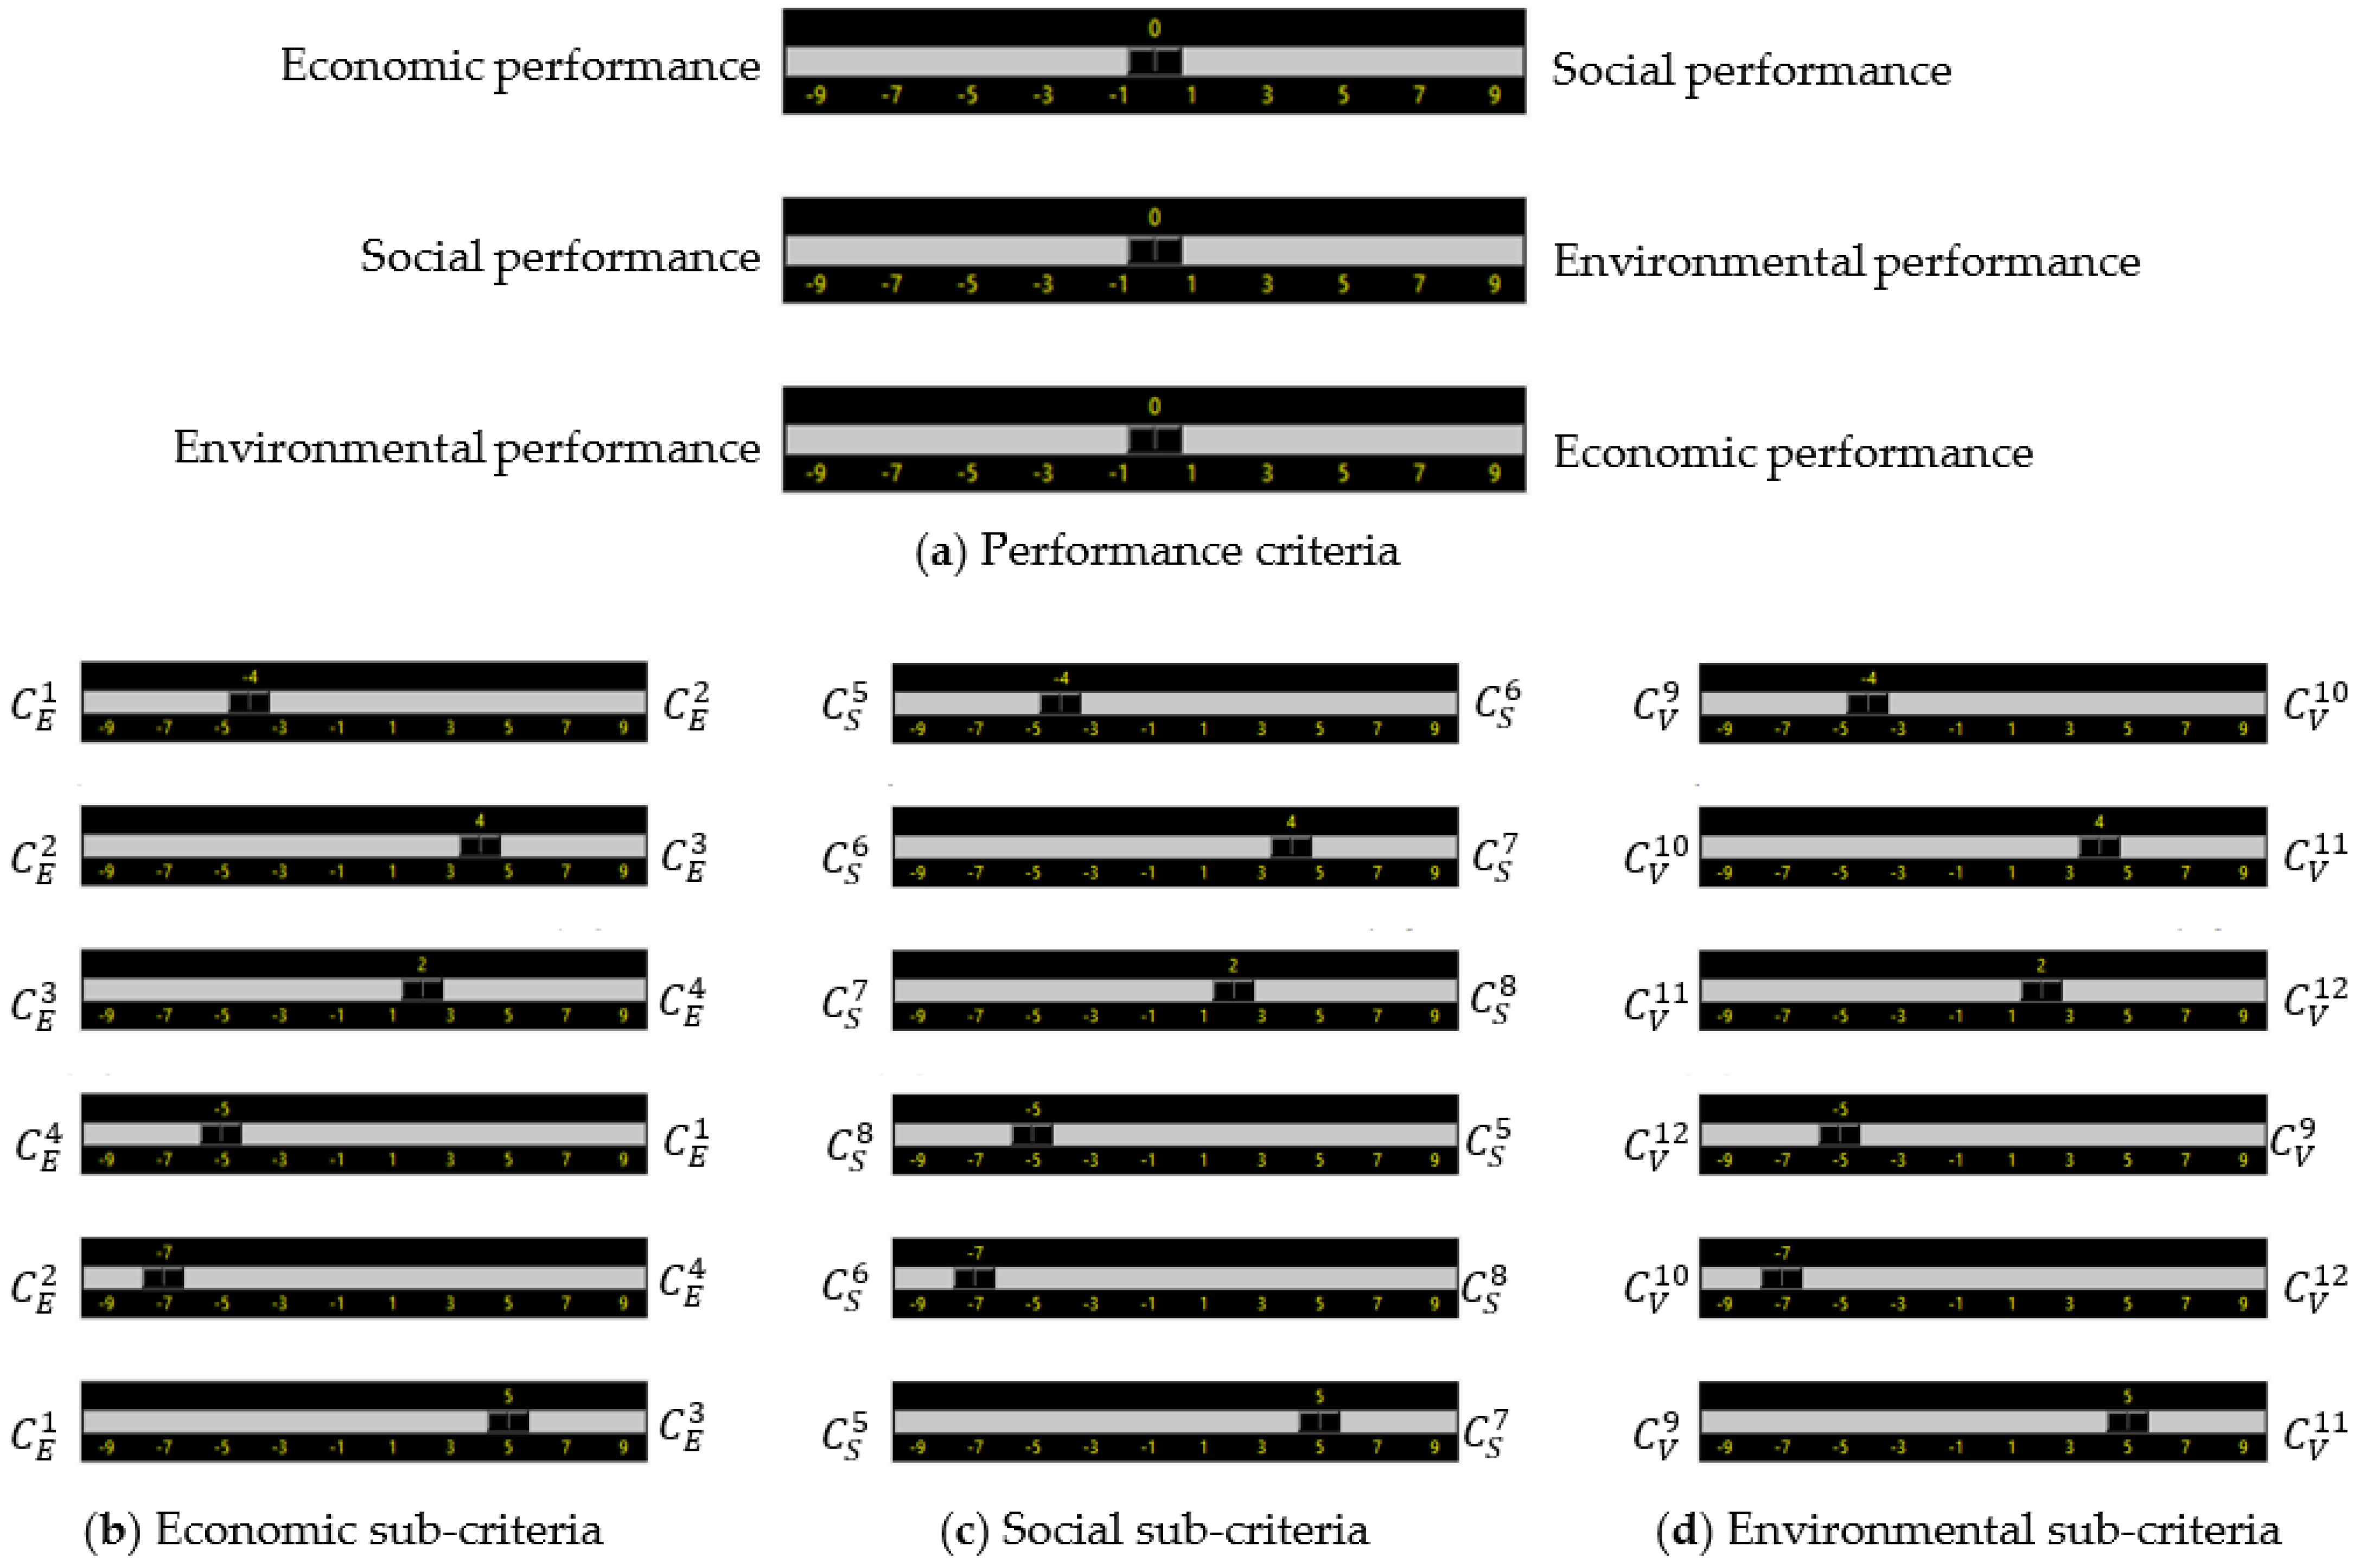
The method can be used to drive refurbishment by analysing critical sub-criteria. A chart of the cumulative weights in Figure 12.shows that manufacturing emissions under environmental performance is the most important sub-criteria, while recycling cost under economic performance is the least. Correspondingly, the PTP may prioritize efforts in maximizing performance of important sub-criteria.
The method’s application in communicating requirements to shipyards can give more control to PTPs in the design process. They can monitor progress and lay out precise requirements following the proposed structure. For example, PTPs may first communicate the route type which defines the overall design of the ferry. Next, they may communicate a list of minimum requirements following the secondary level of the operational requirements structure. Finally, the PTP may provide a list of constraints under each of the 12 performance criteria. E.g., manufacturing cost < E U R   s a m p l e ; operational emissions < θ   g m and so on.
The advantages of the proposed method can be summarised as follows:
  • Holistic performance of ferries including social, economic, and environmental factors;
  • Identification of strengths and weaknesses of ferries allow targeted refurbishment and upgrades;
  • Precise communication of requirements by PTPs to vessel manufacturers;
  • Objective decision making when choosing among ferry candidates;
  • Enables tailoring of the ferry based on local requirements.
The study’s limitations are addressed as part of future work in the conclusion section. In our demonstrations, whenever data on performance scores such as costs, life-cycle emissions, noise levels and passenger perception were not available, they were reasonably assumed. However, in practice, this information should be available to PTPs from manufacturers. The ferry evaluation method developed in this paper is presented as a user-friendly possibility for PTPs. It has the potential to make WPT more efficient and improve PTPs perception towards it.

5. Conclusions

We proposed a structure for operational requirements while drawing elements from literature, passenger surveys and consultations with operators and subject experts. Further, a process is outlined to relate these requirements to ferry characteristics. Efforts are made to make decision making in procuring ferries objective, thus filtering out empirical factors such as gut feelings and reliance on face value, which may be misleading through clever packaging/marketing. Unlike existing operational requirement structures, we incorporate performance assessment consisting of the three pillars of sustainability. Special attention is given to quantifying social performance through addressing commuter preferences and incorporate attitudinal factors such as comfort, safety, service, and ambience. The ferry evaluation framework is built using fuzzy AHP. We found using Javanbarg, Scawthorn [22]’s approach in combination with PSO was more suitable in handling uncertainties than the extent analysis method [21].
Future work includes the following:
  • Working together with PTPs to improve the method’s accessibility;
  • Studying the weight preferences of PTPs in different cities;
  • Incorporating newer MCDM methods and reduce the number of pairwise comparisons;
  • Exploring hybrid MCDM models to facilitate survey-based evaluation of social performance;
  • Using 3-dimensional fuzzy sets to improve information capture.
If the PTPs have access to a user-friendly tool to evaluate ferries based on a standard set of requirements, more suitable ferries could be acquired, and the existing fleet could be subjected to targeted refurbishment. Such tailored ferries would be efficient and could improve the current perception of WPT.

Author Contributions

Conceptualization, H.C. and K.G.; methodology, H.C.; software, H.C.; validation, H.C. and K.G.; formal analysis, H.C.; investigation, H.C.; resources, K.G.; data curation, H.C.; writing—original draft preparation, H.C.; writing—review and editing, H.C. and K.G.; visualization, H.C.; supervision, K.G.; project administration, K.G.; funding acquisition, K.G. All authors have read and agreed to the published version of the manuscript.

Funding

The Swedish Transport Administration is acknowledged for financially supporting the research program Waterborne Urban Mobility TRV 2018/6471.

Institutional Review Board Statement

Not applicable.

Informed Consent Statement

Not applicable.

Data Availability Statement

The data presented in this study is available in the appendix.

Conflicts of Interest

The authors declare no conflict of interest. The funders had no role in the design of the study, in the collection, analyses, or interpretation of data, in the writing of the manuscript, or in the decision to publish the results.

Appendix A. Energy and Emission Comparison of Alternate Modes

Table A1. Comparison of energy efficiency of alternate modes of transport (Values from Stenius, Garme [10]).
VehiclesEnergy Cons (kWh/paxkm)CO2 (g/paxkm)
Car (1)0.33110
Bus (2)0.15 (6)15
Train (3)0.051
Air (domestic) (4)0.66171
Air Boeing 787 (5)0.2976
Hammarby ferry0.093
(1) Average car 1997 year with 2 passengers. (2) Large bus 1997 with 60 passengers. (3) Inter-city 65% occupancy. (4) Travel within Sweden with 65% occupancy. (5) Average travel Hongkong-New York 65% occupancy. (6) Approximation based on Lenner (1993) stating 0.07 kWh/paxkm for bus at 80% fullness and 0.22 for bus at medium fullness and 0.46 at 10% fullness.

Appendix B. Commuter Survey

Figure A1. Ferry commuter survey to assess social preferences towards WPT.
Sustainability 14 03680 g0a1

Appendix C. Fuzzy AHP Methodologies

Appendix C.1. Fuzzy AHP with Extent Analysis

Appendix C.1.1. Definition of a Triangular Fuzzy Number

The membership function M ˜ ( x )   : R [ 0 , 1 ] of the triangular fuzzy number M ˜ = ( l , m , u ) defined on R [42] is defined as,
M ˜ ( x ) = { x m l l m l ,           x [ l , m ] x m u u m u ,       x [ l , m ] 0 ,               o t h e r w i s e
where m is most probable value, l is the lower bound and u is the upper bound of the fuzzy number M ˜ such that l m u .

Appendix C.1.2. Chang (1996)’s Fuzzy AHP Method

The method uses extent analysis such that each object in an object set X = [ o 1 , o 2 , , o n ] is considered one by one and analyses for each possible goal in a goal set U = [ g 1 , g 2 , , g m ] . This results in m extent analyses for each object, represented as,
M ˜ g i 1 ,   M ˜ g i 2 , , M ˜ g i m ,           i = 1 , 2 , , n
where M ˜ g i j   ( j = 1 , 2 , , m ) is a triangular fuzzy number. There are 4 steps in the extent analysis.
Step 1: The fuzzy synthetic extent for the i t h object is defined as,
S i = j = 1 m M ˜ g i j [ i = 1 n j = 1 m M ˜ g i j ] 1
where denotes extended multiplication [65]. The right-hand terms are calculated as,
j = 1 m M ˜ g i j = ( j = 1 m l j , j = 1 m m j , j = 1 m u j )
i = 1 n j = 1 m M ˜ g i j = ( i = 1 n l i , i = 1 n m i , i = 1 n u i )
The inverse of the vector in Equation (A5) is,
[ i = 1 n j = 1 m M ˜ g i j ] 1 = ( 1 i = 1 n u i , ,   1 i = 1 n m i , ,   1 i = 1 n l i , )
Step 2: The degree of possibility of M 2 ˜ M 1 ˜ is defined as,
M 2 ˜ = ( l 2 , m 2 , u 2 ) M 1 ˜ = ( l 1 , m 1 , u 1 )
Additionally, expressed as,
V ( M 2 ˜ M 1 ˜ ) = hgt ( M 1 ˜   M 2 ˜ ) = M 2 ˜ ( d ) = {     1                                                             i f   m 2 m 1     0                                                             i f   l 1 l 2 l 1 u 2 ( m 2 u 2 ) ( m 1 l 1 )                 otherwise
Figure A2. Intersection of M 1 ˜ and M 2 ˜ .
Sustainability 14 03680 g0a2
Figure A2 shows V ( M 2 ˜ ( M 1 ˜ ) ) , for the case m 2 < l 1 < u 2 < m 1 .   d represents the abscissa value corresponding to highest point of crossover between M 1 ˜ and M 2 ˜ . Their comparison can be performed on the basis of V ( M 1 ˜ M 2 ˜ ) and V ( M 2 ˜ M 1 ˜ ) .
Step 3: The degree of possibility for any given convex fuzzy number to be greater than k other fuzzy numbers ( M i ˜ ( i = 1 , 2 , , k ) is defined by,
V V ( M ˜ M 1 ˜ ,   M 2 ˜ ,   , M k ˜ ) = min V ( M ˜ M i ˜ ) ,   i = 1 , 2 , , k
Step 4: The final weight vector for k = 1 , 2 , , n is defined as,
W = ( min V ( S 1 S k ) , min V ( S 2 S k ) , , V ( S n S k ) ) T

Appendix C.2. Fuzzy AHP Optimization Model

The method was proposed by Javanbarg et al. [22]. A fuzzy judgement matrix A ˜ consisting of pairwise comparison judgements that are represented by fuzzy triangular numbers a ˜ i j = ( l i j , m i j , u i j ) such that l i j < m i j < u i j is defined as,
M ˜ = { a ˜ i j } = ( a ˜ 11 a ˜ 12 a ˜ 1 n a ˜ 21 a ˜ 22 a ˜ 2 n a ˜ n 1 a ˜ n 2 a ˜ n n )     i , j   1 , 2 , , n
If i = j , then, a ˜ i j = a ˜ j i = ( 1 , 1 , 1 ) . The corresponding priority vector ( w 1 , w 2 , , w n ) T must satisfy,
l i j ˜ w i w j ˜ u i j ;       w i , w j > 0 ; i j
where the symbol ˜ means “fuzzy less than equal to”. For measuring the degree of compliance of Equation (A10), a new membership function is defined as,
μ i j ( w i / w j ) = { m i j ( w i / w j ) m i j l i j , 0 < w i w j m i j ( w i / w j ) m i j u i j m i j , w i w j m i j ,   i j
The crisp ratio ( w i / w j ) is more acceptable if μ i j ( w i / w j ) is smaller. The value of μ i j ( w i / w j ) can be larger than 1 and linearly decreases in the interval ( 0 , m i j ] and linearly increases in the interval [ m i j , ) . Equation (A10) represents a set of non-linear equations and we are interested in solving for the vector ( w 1 , w 2 , , w n ) T , such that,
i = 1 n w i = 1 ,                 w i > 0 ,     i = 1 , 2 , , n
Equations (A12)–(A14) represent an optimization problem and the objective function that one aims to minimize can be expressed as,
min J ( w 1 , w 2 , , w n ) = min i = 1 n j = 1 n [ μ i j 2 w i w j ] = min i = 1 n j = 1 n [ δ ( m i j w i w j ) ( m i j ( w i / w j ) m i j l i j ) 2 + δ ( w i w j m i j ) ( ( w i / w j ) m i j u i j m i j ) 2 ]
Such that Equation (A15) is subject to Equation (A14) where i j and heavyside function δ ( x ) is defined as,
δ ( x ) = { 0 , 1 ,       x < 0       x 0
This optimization problem may be solved using particle swarm optimization (PSO).
To check the degree of consistency of fuzzy judgement matrix in Equation (A11), Mikhailov [66] method can be used. For a fuzzy feasible area P ˜ in an ( n 1 ) -dimensional simplex Q n 1 , with respect to the optimization problem, the membership function of the fuzzy feasible area is expressed as,
μ P     ˜ ( w ) = min ij { ( μ i j ( w ) | i = 1 , 2 , , n 1 ; j = 2 , 3 , , n ; j > i ) }
Javanbarg introduces a consistency index λ P [ 0 ,   1 ] that measures degree of inconsistency in the decisionmaker’s judgements, defined as,
λ P = μ P     ˜ ( w * ) = min min ij ( μ i j ( w ) |   w Q n 1 )
where w * = ( w 1 * , w 2 * , , w n * ) T is the optimal priority vector. A positive λ * denotes that all solution ratios satisfy fuzzy judgements which indicates the consistency of initial fuzzy judgements.

Appendix C.3. Particle Swarm Optimization (PSO)

PSO was first proposed by Eberhart and Kennedy [67]. Consider a swarm of N particles in an n-dimensional search space, S R n . The i t h particles position and velocities are n-dimensional vectors denoted as x i = ( x i 1 , x i 2 , , x i n ) S and v i = ( v i 1 , v i 2 , , v i n ) S . The best position visited by the i t h particle previously is denoted as p i = ( p i 1 , p i 2 , , p i n ) S . The swarm positions and velocities are updated as,
v i d ( t + 1 ) = v i d ( t ) + c 1 r 1 ( p i d ( t ) x i d ( t ) ) + c 2 r 2 ( p g d ( t ) x i d ( t ) )
x i d ( t + 1 ) = x i d ( t ) + v i d ( t + 1 )
where g is the index of the particle that achieved the best position previously and t is the iteration counter, i = 1 , 2 , , n is the particle’s index and d = 1 , 2 , , n is the particle’s d t h components, c 1 and c 2 are cognitive and social parameters and r 1 ,   r 2   [ 0 , 1 ] are uniformly distributed random numbers.
PSO’s limitation on converging on early best solutions is overcome using inertia and constriction terms [68]. Inertia is expressed as,
v i d ( t + 1 ) = ω v i d ( t ) + c 1 r 1 ( p i d ( t ) x i d ( t ) ) + c 2 r 2 ( p g d ( t ) x i d ( t ) )
where ω is the inertia weight. An optimal strategy is to set ω to 0.9 initially and linearly diminish it to 0.4 .
Constriction is denoted by χ . It removes the need for clamping the velocity [69], expressed as,
v i d ( t + 1 ) = χ { v i d ( t ) + c 1 r 1 ( p i d ( t ) x i d ( t ) ) + c 2 r 2 ( p g d ( t ) x i d ( t ) ) }
where
χ = 2 | 2 φ φ 2 4 φ | ,             φ = c 1 + c 2 > 4
The value of φ = 0.41 is suggested by Eberhart & Shi (2000). χ = 0.72984 ; c 1 = c 2 = 2.05 .
The optimization problem defined in Equation can be solved using this approach. The broad steps to PSO are:
  • Setup control parameters and initialize iteration at t = 1;
  • Initialize particle position and velocity for each particle,   x i S and v i S ;
  • Update particle position for each particle,   p i S ;
  • Evaluate objective function for each particle f ( x i ) ;
  • Update personal p i d ( t ) and swarm p g d ( t ) best positions for each particle;
  • Report the best position if f ( x i ) < p g d ( t ) ;
  • Else, update iteration t = t + 1, and repeat steps 3–6.

Appendix D. AHP Input Survey

To record PTP’s preferences for intensities of importance, a GUI was developed that may be used digitally. The users mark their preferences by sliding the slider. The inputs are converted into crisp weights based on the preferences.
Figure A3. GUI for recording user input for ‘intensities of importance’ for (a) performance criteria, (b) economic sub-criteria, (c) social sub-criteria (d) environmental sub-criteria. The codes in (bd) refer to Table 2.
Sustainability 14 03680 g0a3

Appendix E. Ferries on Line 80, Stockholm, Sweden

Table A2. Tertiary level performance values of ferries on line 80, Stockholm.
OptionMan. Cost (SEK)Op. Cost (SEK)Mt. Cost (SEK)Other Cost (SEK)AmbienceComfort Service Safety Recycling Emission (gms)Manufacturing Emission (gms)Operational Emission (gms)Noise (dB)
Ferry 1120,00010,000200,00050,0007.56.255.47.6506002
Ferry 270,00060,000250,00070,00054.754.25.830428050
Ferry 390,00040,000220,00030,00065.755.47.670505038

Appendix F. Description of Module and Submodule Alternatives

Table A3. Descriptions of modules and submodules to be assembled for the modular ferry example.
ModuleSub-ModuleAlternativeDescription
SuperstructureType XX1Hull access, safety equipment outlet. storage area, recyclable material, side entrances
X2Hull access, storage space and safety outlet, noise absorbing material, side entrances
X3Driver cabin, cold food cafeteria, special access place, WC, side entrances
X4Driver cabin, functional hot food cafeteria, special access place, WC, side entrances
Type YY1Mechanized bike stowing overhead with comfortable seating below for bike holders
Y2Bike stowing spaces, seating
Y3Bike stowing spaces
Y4Space of standing passengers, wide open space, noise cancelling furnishings
Type ZZ1Combination of seating and standing space, high passenger capacity
Z2Combination of seating and standing space, premium quality
Z3Seating intensive, large inter-seat space, premium quality
Z4Seating intensive, economical, high passenger capacity
Type EN1Sealed entrance with large windowpanes
N2Front opening entrance without windows
N3Front opening entrance modules with large windowpanes
Hull H1Monohull, FRP–steel hybrid
H2Monohull, Aluminium–steel hybrid
H3Monohull, FRP
H4Monohull, Steel
Engine G1Electric engine
G2Conventional diesel engine
G3Diesel engine noise free
G4Diesel–electric hybrid engine

Appendix G. Hypothetical Module Performance Scores for All Sub-Criteria

Table A4. Module performance scores of all submodules and modules under investigation.
ModuleSubmoduleOptionMan CostOp CostMt CostOther CostAmbienceComfortSafetyServiceRe emisMan EmisOp EmisNoise
SuperstructureType XX1300030700300.80.60.90.30.20.800
SuperstructureType XX24000503001500.50.40.50.90.80.800
SuperstructureType XX32000201200100.90.30.60.40.60.900
SuperstructureType XX480004020010000.20.90.40.30.50.700
SuperstructureType YY17000465443320.60.20.20.50.50.500
SuperstructureType YY23000323465430.80.40.90.10.80.800
SuperstructureType YY32000646455530.50.80.80.30.20.900
SuperstructureType YY4100012234950.40.50.90.70.40.300
SuperstructureType ZZ112,000200012009000.70.90.900.60.600
SuperstructureType ZZ214,0004000160014100.70.30.500.10.900
SuperstructureType ZZ318,000300010008000.70.80.600.30.400
SuperstructureType ZZ410,0005000180012000.70.50.400.20.700
SuperstructureType EN130003520020000.90.60.60.60.80.9
SuperstructureType EN22000201304000.50.80.10.90.50.6
SuperstructureType EN360001241425000.60.20.30.40.30.2
HullHullH14,00,00002,00080,0000.90.40.90.30.60.60.30.5
HullHullH23,00,00003,00024,4440.20.30.50.40.10.90.50.4
HullHullH37,00,000050025,2520.50.90.60.90.30.40.90.7
HullHullH42,50,000012,00090,2220.60.50.40.60.20.70.60.2
Engine EngineG130,000700080030000.50.90.90.10.40.50.80.5
Engine EngineG225,00012,000200020000.80.40.30.90.90.40.70.9
Engine EngineG329,9993999400010,0000.30.40.50.60.90.40.60.7
Engine EngineG460,00053221004520.40.80.90.50.80.90.90.8

References

  1. Cheemakurthy, H. Urban Waterborne Public Transport Systems: An Overview of Existing Operations in World Cities; KTH Royal Institute of Technology: Stockholm, Sweden, 2018; pp. 1651–1660. ISBN 978-91-7729-648-5. [Google Scholar] [CrossRef]
  2. Wiegmans, B.; Witte, P.; Spit, T. Characteristics of European inland ports: A statistical analysis of inland waterway port development in Dutch municipalities. Transp. Res. Part A Policy Pract. 2015, 78, 566–577. [Google Scholar] [CrossRef]
  3. Sihn, W.; Pascher, H.; Ott, K.; Stein, S.; Schumacher, A.; Mascolo, G. A green and economic future of inland waterway shipping. Procedia CIRP 2015, 29, 317–322. [Google Scholar] [CrossRef]
  4. Tanko, M.; Cheemakurthy, H.; Kihl, S.H.; Garme, K. Water transit passenger perceptions and planning factors: A Swedish perspective. Travel. Behav. Soc. 2019, 16, 23–30. [Google Scholar] [CrossRef]
  5. Camay, S.; Zielinski, E.; Zaranko, A. New York City’s East River Ferry: Expanding Passenger Ferry Service and Stimulating Economic Development in the New York City Region. Transp. Res. Rec. 2012, 2274, 192–200. [Google Scholar] [CrossRef]
  6. Ulfvengren, P.; Hall Kihl, S.; Engwall, M.; Garme, K. FLYT 365–Dags Att Sjösätta Förutsättningar för en Innovativ Kollektivtrafik? 2020; Report No.: 978-91-7873-753-6. [Google Scholar]
  7. Bignon, E.; Pojani, D. River-based public transport: Why won’t Paris jump on board? Case Stud. Transp Policy 2018, 6, 200–205. [Google Scholar] [CrossRef] [Green Version]
  8. Wang, Z.; Lo, H.K.; Lai, M. Mixed-fleet ferry routing and scheduling. In Computer-Aided Systems in Public Transport; Springer: Berlin/Heidelberg, Germany, 2008; pp. 181–194. [Google Scholar] [CrossRef]
  9. Zhang, W.; Qi, Y.; Yan, Y.; Tang, J.; Wang, Y. A method of emission and traveller behavior analysis under multimodal traffic condition. Transp. Res. Part D Transp. Environ. 2017, 52, 139–155. [Google Scholar] [CrossRef]
  10. Stenius, I.; Garme, K.; Hall Kihl, S.; Burman, M. WATERWAY 365: System Analysis of Challenges in Increased Urban Mobility by Utilization of the Water Ways; KTH Royal Institute of Technology: Stockholm, Sweden, 2014; Report No.: 978-91-7595-161-4. [Google Scholar]
  11. Tanko, M.; Burke, M.I.; Cheemakurthy, H. Water transit and ferry-oriented development in Sweden: Comparisons with system trends in Australia. Transp. Res. Rec. 2018, 2672, 890–900. [Google Scholar] [CrossRef]
  12. Evans, J.H. Basic design concepts. J. Am. Soc. Nav. Eng. 1959, 71, 671–678. [Google Scholar] [CrossRef]
  13. Andrews, D. An integrated approach to ship synthesis. Trans. RINA 1986, 128, 73–102. [Google Scholar]
  14. Levander, K. System Based Passenger Ship Design; IMSDC: Kobe, Japan, 1991. [Google Scholar]
  15. De Dios Ortúzar, J.; Willumsen, L.G. Modelling Transport; John Wiley & Sons: Hoboken, NJ, USA, 2011; p. 1119993520. [Google Scholar]
  16. Stojčić, M.; Zavadskas, E.K.; Pamučar, D.; Stević, Ž.; Mardani, A. Application of MCDM methods in sustainability engineering: A literature review 2008–2018. Symmetry 2019, 11, 350. [Google Scholar] [CrossRef] [Green Version]
  17. Saaty, T.L. Fundamentals of Decision Making and Priority Theory with the Analytic Hierarchy Process; RWS publications: Pittsburgh, PA, USA, 2000. [Google Scholar]
  18. Keeney, R.L. Utility functions for multiattributed consequences. Manag. Sci. 1972, 18, 276–287. [Google Scholar] [CrossRef]
  19. Chan, F.T.; Kumar, N. Global supplier development considering risk factors using fuzzy extended AHP-based approach. Omega 2007, 35, 417–431. [Google Scholar] [CrossRef]
  20. Duleba, S.; Kutlu Gündoğdu, F.; Moslem, S. Interval-valued spherical fuzzy analytic hierarchy process method to evaluate public transportation development. Informatica 2021, 32, 661–686. [Google Scholar] [CrossRef]
  21. Chang, D.-Y. Applications of the extent analysis method on fuzzy AHP. Eur. J. Oper. Res. 1996, 95, 649–655. [Google Scholar] [CrossRef]
  22. Javanbarg, M.B.; Scawthorn, C.; Kiyono, J.; Shahbodagh, B. Fuzzy AHP-based multicriteria decision making systems using particle swarm optimization. Expert Syst. Appl. 2012, 39, 960–966. [Google Scholar] [CrossRef]
  23. Jung, H.; Kim, J.; Shin, K. Importance Analysis of Decision Making Factors for Selecting International Freight Transportation Mode. Asian J. Shipp. Logist. 2019, 35, 55–62. [Google Scholar] [CrossRef]
  24. Hart, E.C.; Adebiyi, S.O.; Oyenuga, O.G. Prioritisation of ferry commuters’ needs in Lagos metropolis: An analytical hierarchical process approach. Sci. J. Silesian Univ. Technol. Ser. Transp. 2020, 107, 53–71. [Google Scholar] [CrossRef]
  25. Kim, J.; Lee, G.; Kim, H. Analysis of Operational Efficiency Considering Safety Factors as an Undesirable Output for Coastal Ferry Operators in Korea. J. Mar. Sci. Eng. 2020, 8, 367. [Google Scholar] [CrossRef]
  26. Pahl, G.; Beitz, W.; Blessing, L.; Feldhusen, J.; Grote, K.-H.; Wallace, K. Engineering Design: A Systematic Approach, 3rd ed.; Springer: London, UK, 2007. [Google Scholar] [CrossRef]
  27. Melewar, T.C.; Saunders, J. International Corporate Visual Identity: Standardization or Localization? J. Int. Bus. Stud. 1999, 30, 583–598. [Google Scholar] [CrossRef]
  28. Anderegg, A.H. A concurrent process for development and validation of operational requirements. INCOSE Int. Symp. 1996, 6, 903–906. [Google Scholar] [CrossRef]
  29. Cheemakurthy, H.; Garme, K. A modularly tailored commuter ferry platform. Int. Shipbuild Prog. 2022; accepted for publication. [Google Scholar]
  30. Barbier, E.B. The Concept of Sustainable Economic Development. Environ. Conserv. 1987, 14, 101–110. [Google Scholar] [CrossRef]
  31. Traffic, T. Public Transport on Water: Description of Potential Western District; Technical Report; Trivector Traffic: Lund, Sweden, 2014. [Google Scholar]
  32. De Soto, N.A.; Gkikopoulou, K.; Hooker, S.; Isojunno, S.; Johnson, M.; Miller, P.; Tyack, P.; Wensveen, P.; Donovan, C.; Harris, C.M.; et al. From physiology to policy: A review of physiological noise effects on marine fauna with implications for mitigation. Proc. Meet. Acoust. Acoust. Soc. Am. 2016, 27, 1–14. [Google Scholar] [CrossRef] [Green Version]
  33. Zahedi, F. The Analytic Hierarchy Process—A Survey of the Method and its Applications. Interfaces 1986, 16, 96–108. [Google Scholar] [CrossRef]
  34. Saaty, T.L. The Analytic Hierarchy Process; McGraw-Hill: New York, NY, USA, 1980; Volume 324. [Google Scholar]
  35. Flyvbjerg, B.; Holm, M.K.S.; Buhl, S.L. How (in) accurate are demand forecasts in public works projects?: The case of transportation. J. Am. Plan. Assoc. 2005, 71, 131–146. [Google Scholar] [CrossRef] [Green Version]
  36. Tanko, M.; Burke, M.I. Transport innovations and their effect on cities: The emergence of urban linear ferries worldwide. Transp. Res. Proc. 2017, 25, 3957–3970. [Google Scholar] [CrossRef] [Green Version]
  37. Translink. TransLink Tracker Quarterly Report—October to December (Q2) 2015–2016; Queensland Government: Queensland, Australia, 2016.
  38. Code on Intact Stability for All Types of Ships Covered by IMO Instruments: IMO IC874E Intl. Code on Intact Stability (IS); International Maritime Orgamization: London, UK, 2008; Available online: https://puc.overheid.nl/nsi/doc/PUC_3005_14/3/ (accessed on 9 February 2022).
  39. Lu, C.-S.; Tseng, P.-H. Identifying crucial safety assessment criteria for passenger ferry services. Saf. Sci. 2012, 50, 1462–1471. [Google Scholar] [CrossRef]
  40. NCEH. What Noises Cause Hearing Loss? National Center for Environmental Health, Centers for Disease Control and Prevention (CDC): Atlanta, GA, USA, 2020. [Google Scholar]
  41. Kulak, O.; Durmuşoğlu, M.B.; Kahraman, C. Fuzzy multi-attribute equipment selection based on information axiom. J. Mater. Process. Technol. 2005, 169, 337–345. [Google Scholar] [CrossRef]
  42. Van Laarhoven, P.; Pedrycz, W. A fuzzy extension of Saaty’s priority theory. Fuzzy Sets Syst. 1983, 11, 229–241. [Google Scholar] [CrossRef]
  43. Buckley, J.J. Fuzzy hierarchical analysis. Fuzzy Sets Syst. 1985, 17, 233–247. [Google Scholar] [CrossRef]
  44. Dağdeviren, M.; Yüksel, I. Developing a fuzzy analytic hierarchy process (AHP) model for behavior-based safety management. Inf. Sci. 2008, 178, 1717–1733. [Google Scholar] [CrossRef]
  45. Gogus, O.; Boucher, T.O. A consistency test for rational weights in multi-criterion decision analysis with fuzzy pairwise comparisons. Fuzzy Sets Syst. 1997, 86, 129–138. [Google Scholar] [CrossRef]
  46. Mikhailov, L. A fuzzy approach to deriving priorities from interval pairwise comparison judgements. Eur. J. Oper. Res. 2004, 159, 687–704. [Google Scholar] [CrossRef]
  47. Wang, L.; Chu, J.; Wu, J. Selection of optimum maintenance strategies based on a fuzzy analytic hierarchy process. Int. J. Prod. Econ. 2007, 107, 151–163. [Google Scholar] [CrossRef]
  48. Kahraman, C.; Ertay, T.; Büyüközkan, G. A fuzzy optimization model for QFD planning process using analytic network approach. Eur. J. Oper. Res. 2006, 171, 390–411. [Google Scholar] [CrossRef]
  49. Zhu, K.-J.; Jing, Y.; Chang, D.-Y. A discussion on Extent Analysis Method and applications of fuzzy AHP. Eur. J. Oper. Res. 1999, 116, 450–456. [Google Scholar] [CrossRef]
  50. Tyagi, M.; Kumar, P.; Kumar, D. Assessment of CSR based supply chain performance system using an integrated fuzzy AHP-TOPSIS approach. Int. J. Logist. Res. Appl. 2018, 21, 378–406. [Google Scholar] [CrossRef]
  51. Cheemakurthy, H. Efficient Commuter Craft for Urban Waterborne Public Transportation. Ph.D. Thesis, KTH Royal Institute of Technology, Stockholm, Sweden, 2021. [Google Scholar]
  52. Pamucar, D.; Deveci, M.; Gokasar, I.; Popovic, M. Fuzzy Hamacher WASPAS decision-making model for advantage prioritization of sustainable supply chain of electric ferry implementation in public transportation. Environ. Dev. Sustain. 2021, 1–40. [Google Scholar] [CrossRef]
  53. Baihaqi, I.; Lazakis, I.; Kurt, R. Developing a Hybrid Value Engineering and Risk Assessment (VENRA) Framework for Shipbuilding and Ship Repair Industry Performance Measurement; International Conference on Ship and Offshore Technology: Houston, TX, USA, 2021. [Google Scholar]
  54. Celik, E.; Bilisik, O.N.; Erdogan, M.; Gumus, A.T.; Baracli, H. An integrated novel interval type-2 fuzzy MCDM method to improve customer satisfaction in public transportation for Istanbul. Transp. Res. Part E Logist. Transp. Rev. 2013, 58, 28–51. [Google Scholar] [CrossRef]
  55. Gavalas, D.; Syriopoulos, T.; Tsatsaronis, M. Assessing key performance indicators in the shipbuilding industry; an MCDM approach. Marit. Policy Manag. 2021, 1–29. [Google Scholar] [CrossRef]
  56. Gündoğdu, F.K.; Duleba, S.; Moslem, S.; Aydın, S. Evaluating public transport service quality using picture fuzzy analytic hierarchy process and linear assignment model. Appl. Soft Comput. 2021, 100, 106920. [Google Scholar] [CrossRef]
  57. Rezaei, J. Best-worst multi-criteria decision-making method. Omega 2015, 53, 49–57. [Google Scholar] [CrossRef]
  58. Pamučar, D.; Stević, Ž.; Sremac, S. A new model for determining weight coefficients of criteria in mcdm models: Full consistency method (fucom). Symmetry 2018, 10, 393. [Google Scholar] [CrossRef] [Green Version]
  59. Zhu, B.; Xu, Z. Analytic hierarchy process-hesitant group decision making. Eur. J. Oper. Res. 2014, 239, 794–801. [Google Scholar] [CrossRef]
  60. Abdullah, L.; Najib, L. A new preference scale mcdm method based on interval-valued intuitionistic fuzzy sets and the analytic hierarchy process. Soft Comput. 2016, 20, 511–523. [Google Scholar] [CrossRef]
  61. Mohd, W.R.W.; Abdullah, L. Pythagorean fuzzy analytic hierarchy process to multi-criteria decision making. In AIP Conference Proceedings; AIP Publishing LLC: Melville, NY, USA, 2017. [Google Scholar] [CrossRef]
  62. Bolturk, E.; Kahraman, C. A novel interval-valued neutrosophic AHP with cosine similarity measure. Soft Comput. 2018, 22, 4941–4958. [Google Scholar] [CrossRef]
  63. Kutlu Gündoğdu, F.; Kahraman, C. Hospital performance assessment using interval-valued spherical fuzzy analytic hierarchy process. In Decision Making with Spherical Fuzzy Sets; Springer: Berlin/Heidelberg, Germany, 2021; pp. 349–373. [Google Scholar] [CrossRef]
  64. Peltokorpi, A.; Olivieri, H.; Granja, A.D.; Seppänen, O. Categorizing modularization strategies to achieve various objectives of building investments. Constr. Manag. Econ. 2018, 36, 32–48. [Google Scholar] [CrossRef]
  65. Zadeh, L.A. Fuzzy sets. In Fuzzy Sets, Fuzzy Logic, and Fuzzy Systems: Selected Papers by Lotfi A Zadeh; World Scientific: Singapore, 1996; pp. 394–432. [Google Scholar] [CrossRef]
  66. Mikhailov, L. Deriving priorities from fuzzy pairwise comparison judgements. Fuzzy Sets Syst. 2003, 134, 365–385. [Google Scholar] [CrossRef]
  67. Eberhart, R.; Kennedy, J. Particle swarm optimization. In Proceedings of the IEEE International Conference on Neural Networks, Cachan, France, 27 November–1 December 1995. [Google Scholar] [CrossRef]
  68. Shi, Y.; Eberhart, R. A modified particle swarm optimizer. In Proceedings of the 1998 IEEE International Conference on Evolutionary Computation Proceedings IEEE World Congress on Computational Intelligence (Cat No 98TH8360), Anchorage, AK, USA, 4–9 May 1998. [Google Scholar]
  69. Clerc, M.; Kennedy, J. The particle swarm—explosion, stability, and convergence in a multidimensional complex space. IEEE Trans. Evol. Comput. 2002, 6, 58–73. [Google Scholar] [CrossRef] [Green Version]
Figure 1. The operational requirements structure goes from broad to detailed design.
Sustainability 14 03680 g001
Figure 2. Methodology for evaluating the DPI of an alternative using AHP. Here, performance ratings represent normalized performance scores.
Sustainability 14 03680 g002
Figure 3. Std. deviation of weights obtained from the three methods for performance criteria.
Sustainability 14 03680 g003
Figure 4. Std. deviation of weights obtained from the three methods for economic sub-criteria.
Sustainability 14 03680 g004
Figure 5. Std. deviation of weights obtained from the three methods for social sub-criteria.
Sustainability 14 03680 g005
Figure 6. Std. deviation of weights obtained from the three methods for environmental sub-criteria.
Sustainability 14 03680 g006
Figure 7. (a) Performance comparison of 3 ferries operating on Line 80 in Stockholm. (b) Break-down of social performance.
Sustainability 14 03680 g007
Figure 8. (a) Hierarchy of modular arrangement; (b) Representation of modular arrangement; and (c) An example of design alternatives for sub-module type Z of modular ferry.
Sustainability 14 03680 g008
Figure 9. (a) Economic, (b) Social (c) Environmental and (d) Overall DPI for all alternatives. The codes on the horizontal axis correspond with Appendix F. Best alternatives are denoted with circles.
Sustainability 14 03680 g009
Figure 10. GUI for assembly of modular ferry. Vessel’s DPI is indicated on the right.
Sustainability 14 03680 g010
Figure 11. Sensitivity analysis shows the impact of different weight choices on the hull alternative’s ranking. W1 refers to the choices made in Equation (18). W2 refers to the case where all sub-criteria have equal weights. In W3–W14, one sub-criterion is awarded a weight of 0.7, while others are equally distributed to 0.028. The order of assigning maximum weight is taken according to Table 2.
Sustainability 14 03680 g011
Figure 12. Cumulative weights of performance sub-criteria.
Sustainability 14 03680 g012
Table 1. Classification of WPT route types (based on findings from [29]).
Route TypeDescriptionRoute Characteristics
A:
City
Service along a water body within the cityBus comparable speed; High frequency; Accessible; Multimodal integration
B:
Bridge
Service across water bodies, similar in function to bridgesHigh frequency; Short turnaround; Quick embarkation; Large capacity
C:
Suburban
Service connecting suburban regions to cityComfort; Weather independent operations; Punctuality and Reliability
Table 2. Performance evaluation criteria at tertiary level of the operational requirements hierarchy.
DesignationCriterion SubcriterionDescription
CEEconomic Performance
C 1 E Manufacture CostManufacturing cost of the vessel
C 2 E Operational CostOperational cost including salaries, fuel, supplies, fees, and amenities
C 3 E Maintenance CostMaintenance related costs including part replacement, repairs, and service costs.
C 4 E Recycling/Other Other costs including recycling, insurance, bank interest and so on.
CSSocial Performance [4]
C 5 S AmbienceOutdoors access, Cleanliness and indoor ambience, onboard noise, productivity
C 6 S ComfortCalmness, Access to amenities including seating, open spaces, toilets, food and drink, embarkation ease and ship motions for comfortable travel
C 7 S ServicePunctuality; Travel time; Accessibility for bikes, trolleys, wheelchairs; Year-round operability; Reliability; Network integration
C 8 S SafetyFire safety, safety against capsizing and damage, evacuation measures
CVEnvironmental Performance
C 9 V Recycling Environmentally detrimental emissions during recycling phase
C 10 V Manufacturing Environmentally detrimental emissions during manufacturing phase
C 11 V OperationalEnvironmentally detrimental emissions during operational phase
C 12 V NoiseLevels of noise pollution
Table 3. Criteria for assessing relative intensity of importance of criteria using AHP [17].
Linguistic Scale for ImportanceCrisp Scale [17]Inverse Crisp Scale
Equally important 11
Weakly more important 31/3
Strongly more important51/5
Very strongly more important71/7
Absolutely more important91/9
Table 4. Social performance evaluation guidelines. Default values in brackets.
Sub-CriteriaDimensionsScores
Ambience Viewing outdoorsLarge windowsMedium windowsSmall windowsNo
8–10 (9)5–7 (6)2–4 (3)1
Access to outdoorsOutdoor seatingOutdoor standingNo outdoor
7–10 (9)2–6 (4)1
Cleanliness, Interior design, ergonomicGood (Ergonomic/Clean)Medium (Ergonomic/clean)Bad (Not ergonomic/clean)
7–10 (9)4–6 (5)1–3 (2)
Onboard noise and vibrationLow/NoneMediumHigh
7–10 (9)4–6 (5)1–3 (2)
ComfortSeating CushionSemi-cushionHard
7–10 (9)4–6 (5)1–3 (2)
Space per capita >0.75 m20.25–75 m2<0.25 m2
7–10 (9)4–6 (5)1–3 (2)
Amenities (toilets, food) Toilets, café, Wi-FiSome of themnone
7–10 (9)4–6 (5)1–3 (2)
Ship motion IMO 12 h limitIMO 5 h limitIMO 1 h limit
7–10 (9)4–6 (5)1–3 (2)
SafetyFire and electrical safety GoodPoor
8–10 (9)2–4 (3)
Rescue equipment/Evacuation measuresVisible and clear to passengersVisible but unclearNot visible and unclear
6–10 (8)2–5 (3)1
Construction and safety inclined GA Meets requirementsNo
6–10 (8)1
Communication and emergency systems YesNo
8–10 (9)1
Trained Personnel/automated safety Trained personnelNo crew/AutoNo
6–10 (8)2–5 (4)1
ServiceTotal Travel time <30 min30–60 min>60 min
7–10 (9)4–6 (5)1–3 (2)
Accessibility for special needsYesSomeNone
7–10 (9)4–6 (5)1–3 (2)
Provision for bikes YesProvisionalNone
7–10 (9)4–6 (5)1–3 (2)
Year-round operate/punctuality YesPunctualityNone
7–10 (9)4–6 (5)1–3 (2)
Information systems on board Digital/voice Digital updatingPoster/leafletNone
9–10 (9)6–8 (7)2–5 (3)1
Table 5. Linguistic scales for fuzzy judgement scores [48].
Linguistic Scale [48]Fuzzy Scale [48]Linguistic Scale [47]Fuzzy Score [47]
Just equal(1, 1, 1)About equal (1/2, 1,2)
Equally important (1/2, 1, 3/2)About x times more important (x − 1, x, x + 1)
Weakly more important (1, 3/2, 2)About x times less important (1/(x + 1), 1/x, 1/(x − 1)
Strongly more important(3/2, 2, 5/2)Between y and z times more important (y, (y + z)/2, z)
Very strongly more important(2, 5/2, 3)Between y and z times less important (1/z, 2/(y + z), 1/y)
Absolutely more important(5/2, 3, 7/2)x = 2, 3, 9 & y, z = 1, 2, …, 9 & y < z.
Table 6. Conversion of crisp intensities of importance to fuzzy scores [48].
Economic PerformanceSocial PerformanceEnvironmental Performance
Economic Performance(1, 1, 1)(0.67, 1, 1.5)(0.33, 0.4, 0.5)
Social Performance(0.67, 1, 1.5)(1, 1, 1)(0.5, 0.67, 1)
Environmental Performance(2, 2.5, 3)(1, 1.5, 2)(1, 1, 1)
Manufacture CostOperational CostMaintenance CostRecycling/Other costs
Manufacture Cost(1, 1, 1)(1.5, 2, 2.5)(2, 2.5, 3)(3.5, 4, 4.5)
Operational Cost(0.4, 0.5, 0.67)(1, 1, 1)(1, 1.5, 2)(2, 2.5, 3)
Maintenance Cost(0.33, 0.4, 0.5)(0.5, 0.67, 1)(1, 1, 1)(0.5, 0.75, 1)
Recycling/Other costs(0.22, 0.25, 0.29)(0.33, 0.4, 0.5)(1, 1.33, 2)(1, 1, 1)
AmbienceComfortSafetyService
Ambience(1, 1, 1)(0.67, 1, 1.5)(1, 1.5, 2)(2, 2.5, 3)
Comfort(0.67, 1, 1.5)(1, 1, 1)(0.5, 0.75, 1)(1, 1.5, 2)
Safety(0.5, 0.67, 1)(1, 1.33, 2)(1, 1, 1)(0.5, 0.75, 1)
Service(0.33, 0.4, 0.5)(0.5, 0.67, 1)(1, 1.33, 2)(1, 1, 1)
Manufacture EmissionsOperational EmissionsRecycling EmissionsMarine Noise
Manufacture Emissions(1, 1, 1)(0.5, 0.75, 1)(1, 1.5, 2)(3.5, 4, 4.5)
Operational Emissions(1, 1.33, 2)(1, 1, 1)(0.67, 1, 1.5)(1.5, 2, 2.5)
Recycling Emissions(0.5, 0.67, 1)(0.67, 1, 1.5)(1, 1, 1)(0.67, 1, 1.5)
Marine Noise(0.22, 0.25, 0.285)(0.4, 0.5, 0.67)(0.67, 1, 1.5)(1, 1, 1)
Table 7. Comparison of performance criteria’s crisp weights [17] with FAHP methods [21,22].
Performance CriteriaCrisp AHP FAHP-EAFAHP-PSOConsistency Index
CE0.0930.1050.101
CS0.2210.2160.215CR = 0.046
CV0.6850.6780.683 λ P = 0.183
Table 8. Comparison of economic performance crisp weights [17] with FAHP methods [21,22].
Economic Sub-CriteriaCrisp AHP FAHP-EAFAHP-PSOConsistency Index
C 1 E 0.6190.7980.642
C 2 E 0.2430.2010.217CR = 0.073
C 3 E 0.08700.085 λ P = 0
C 4 E 0.0500.056
Table 9. Comparison of social performance crisp weights [17] with FAHP methods [21,22].
Social Sub-CriteriaCrisp AHP FAHP-EAFAHP-PSOConsistency Index
C 5 S 0.5490.3760.529
C 6 S 0.2440.2480.248CR = 0.017
C 7 S 0.1340.2070.143 λ P = 0.129
C 8 S 0.0730.1690.078
Table 10. Comparison of environmental performance: crisp weights [17] and FAHP [21,22].
Environmental Sub-CriteriaCrisp AHP FAHP-EAFAHP-PSOConsistency Index
C 9 V 0.5210.5090.509
C 10 V 0.2970.3430.306CR = 0.014
C 11 V 0.1290.1470.13 λ P = 0.667
C 12 V 0.05300.055
Publisher’s Note: MDPI stays neutral with regard to jurisdictional claims in published maps and institutional affiliations.

