
Impact of Hydrological Infrastructure Projects on Land Use/Cover and Socioeconomic Development in Arid Regions—Evidence from the Upper Atbara and Setit Dam Complex, Kassala, Eastern Sudan

 and
and
Abstract
:1. Introduction
2. Materials and Methods
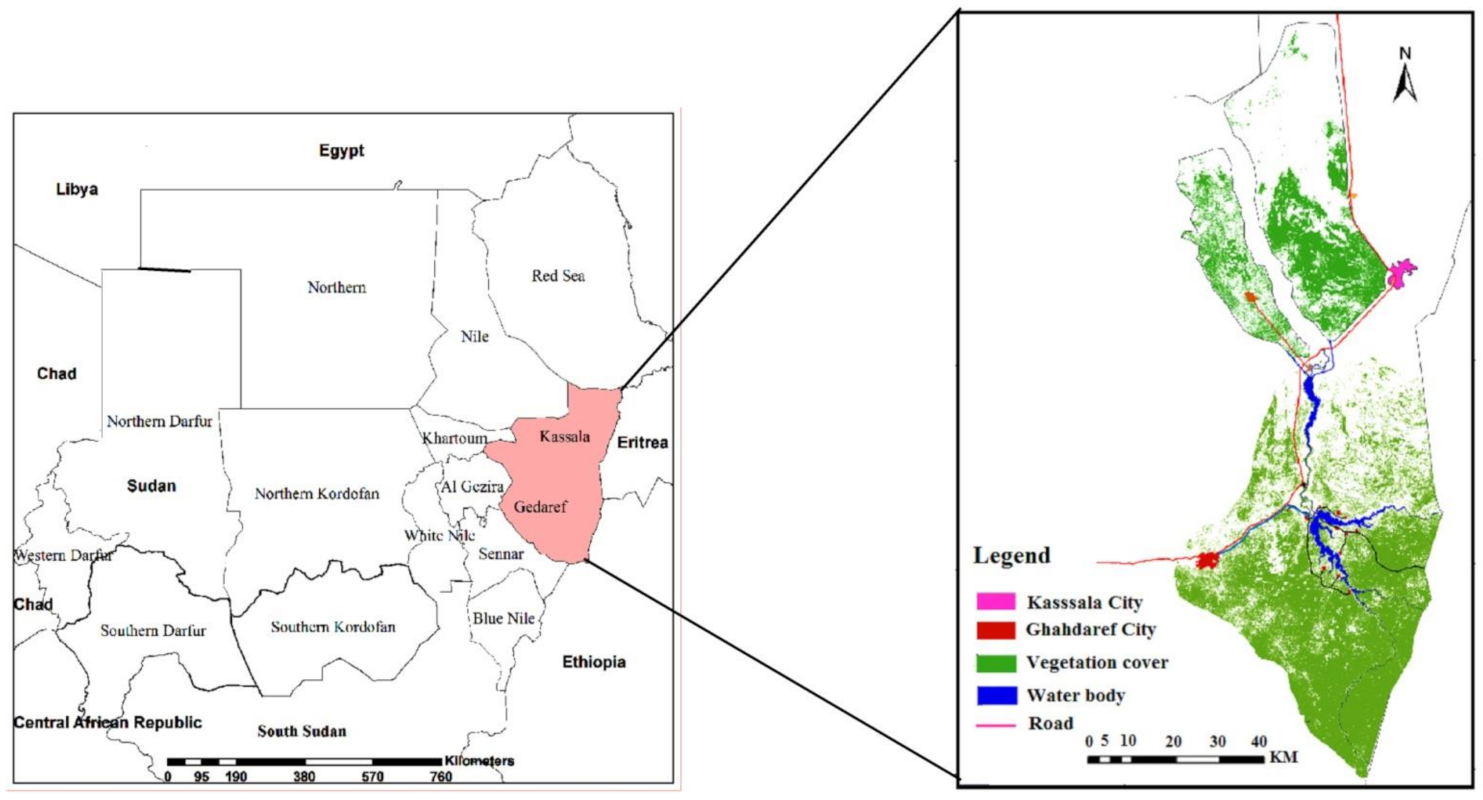
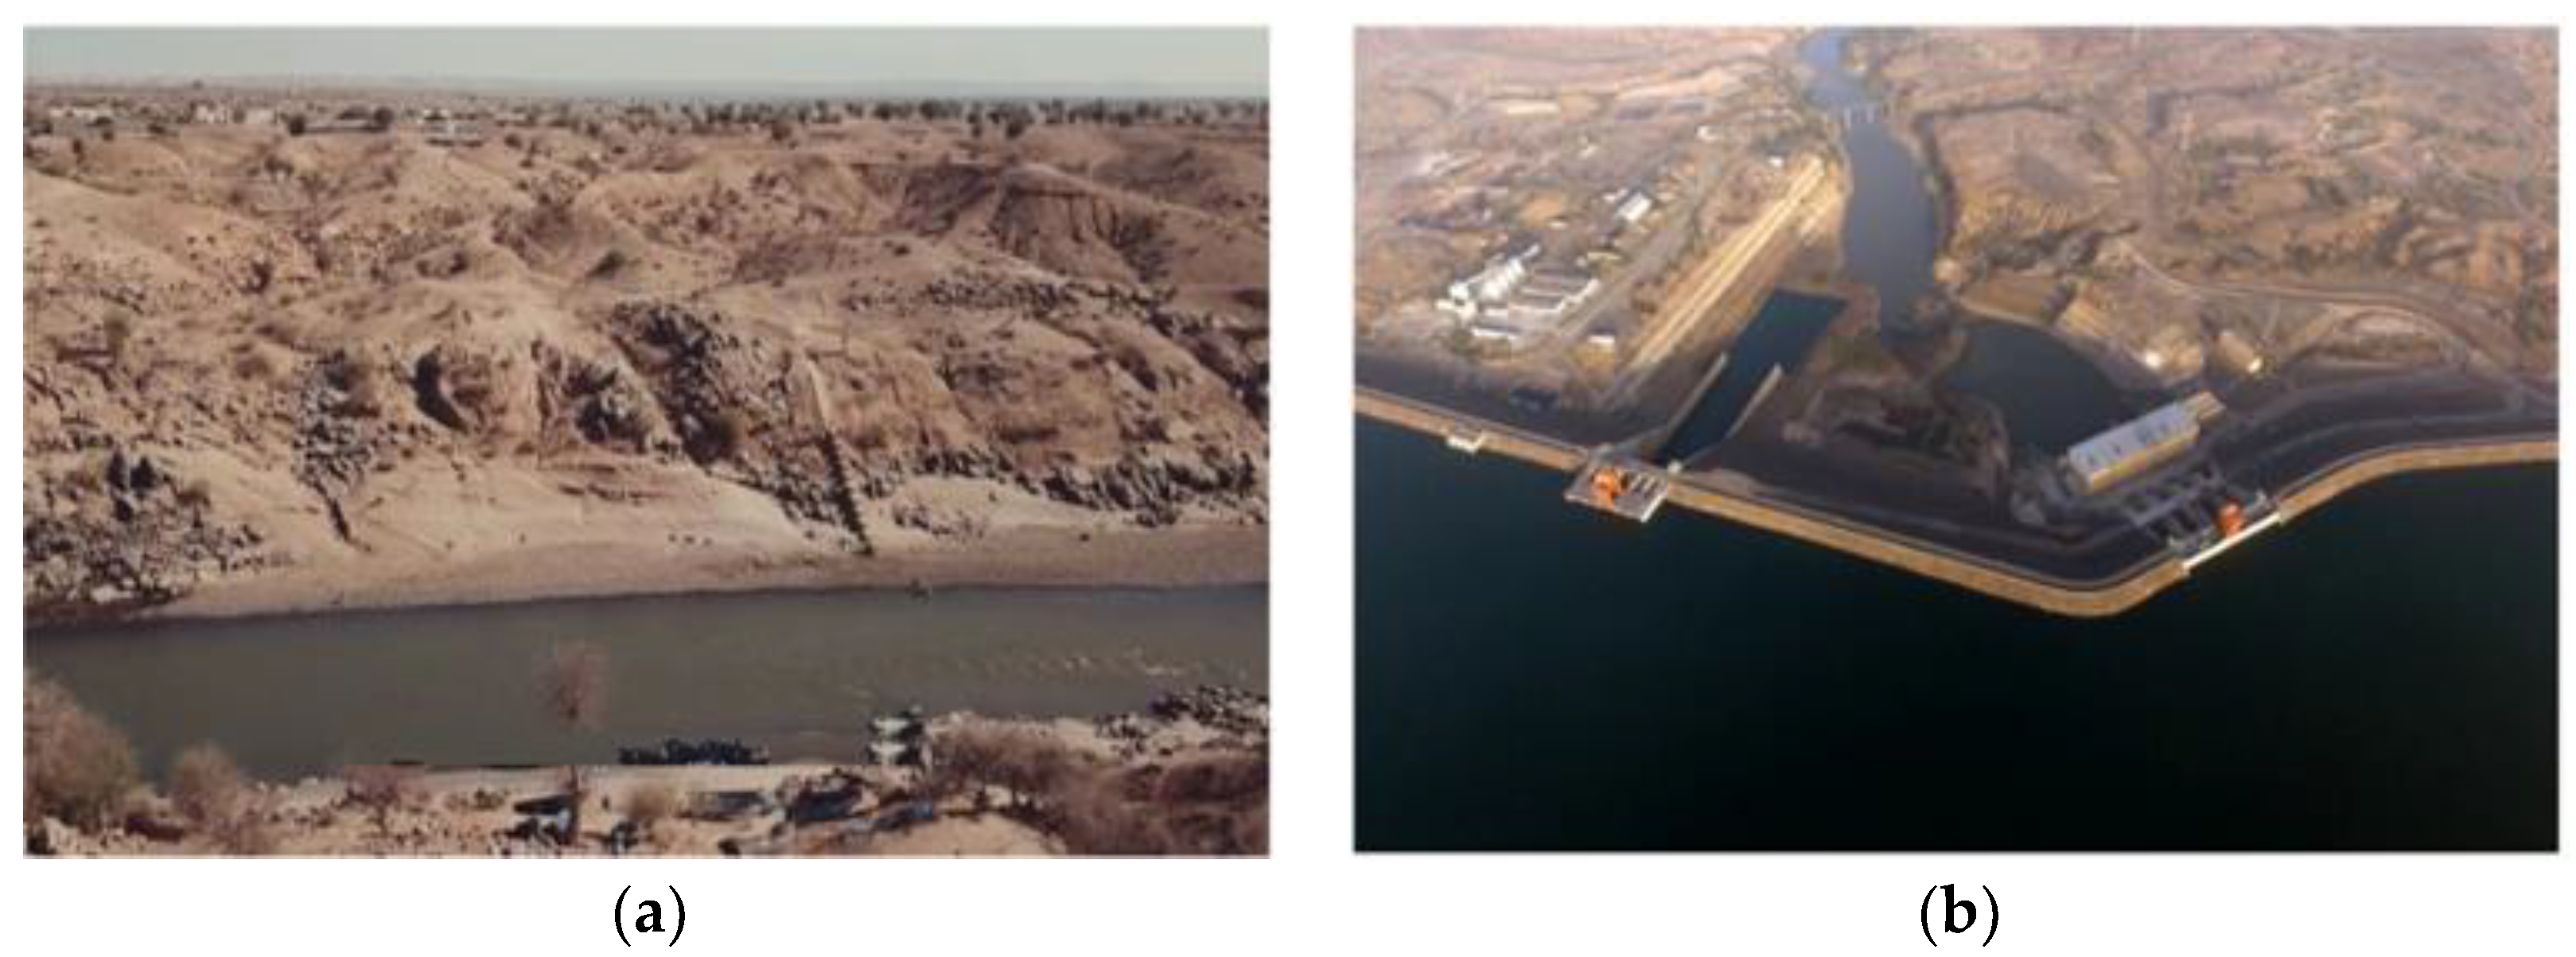
2.1. Study Area
2.2. The Importance of the Dam to Society
2.3. Data Collection
2.4. Datasets
2.5. Satellite Data and Pre-Processing
2.6. Methodology
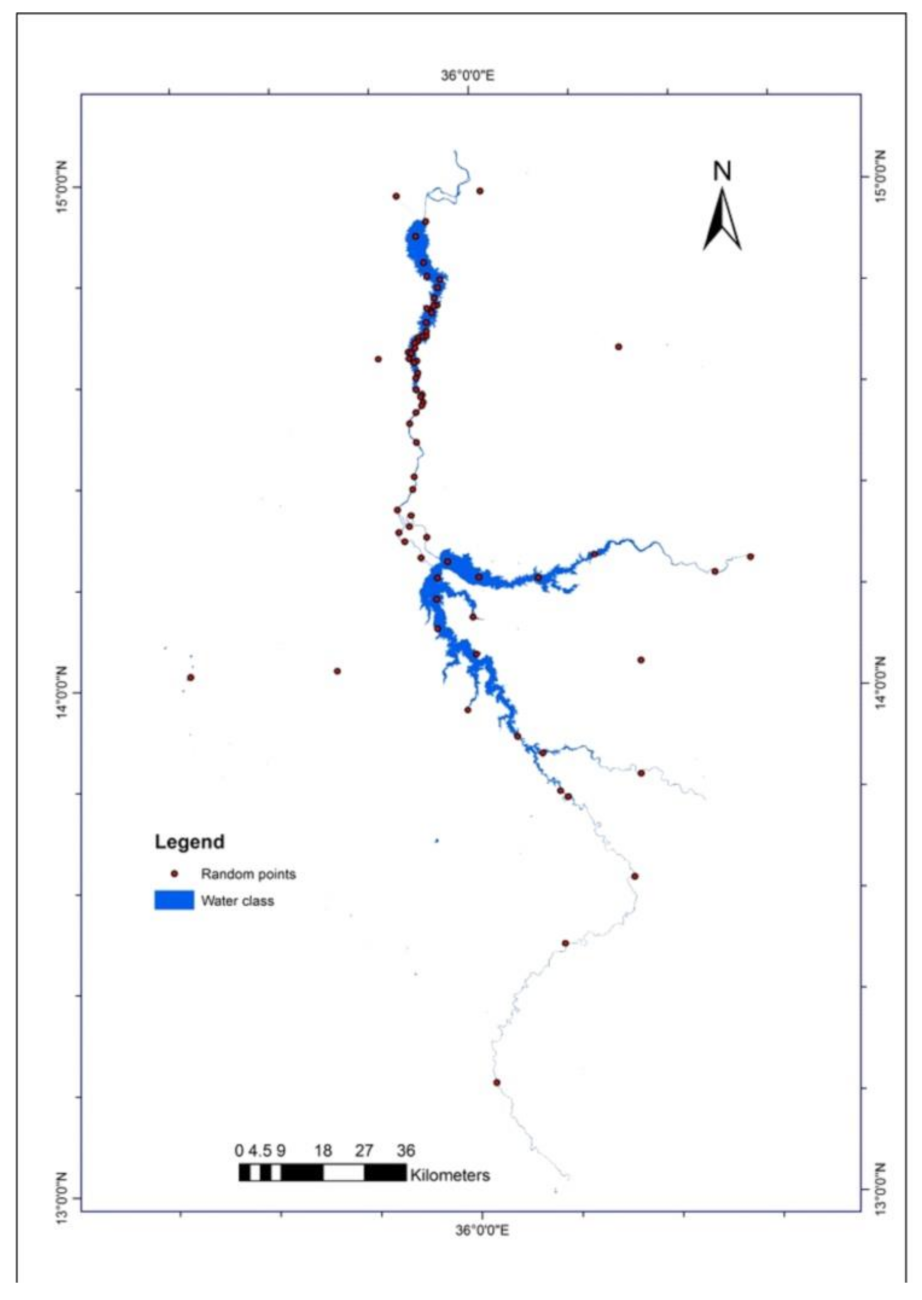
2.7. Accuracy Assessment
- Generating random reference points.
- 2.
- Comparison between LULC maps and Google Earth images.
- 3.
- Calculating accuracy assessment metrics.
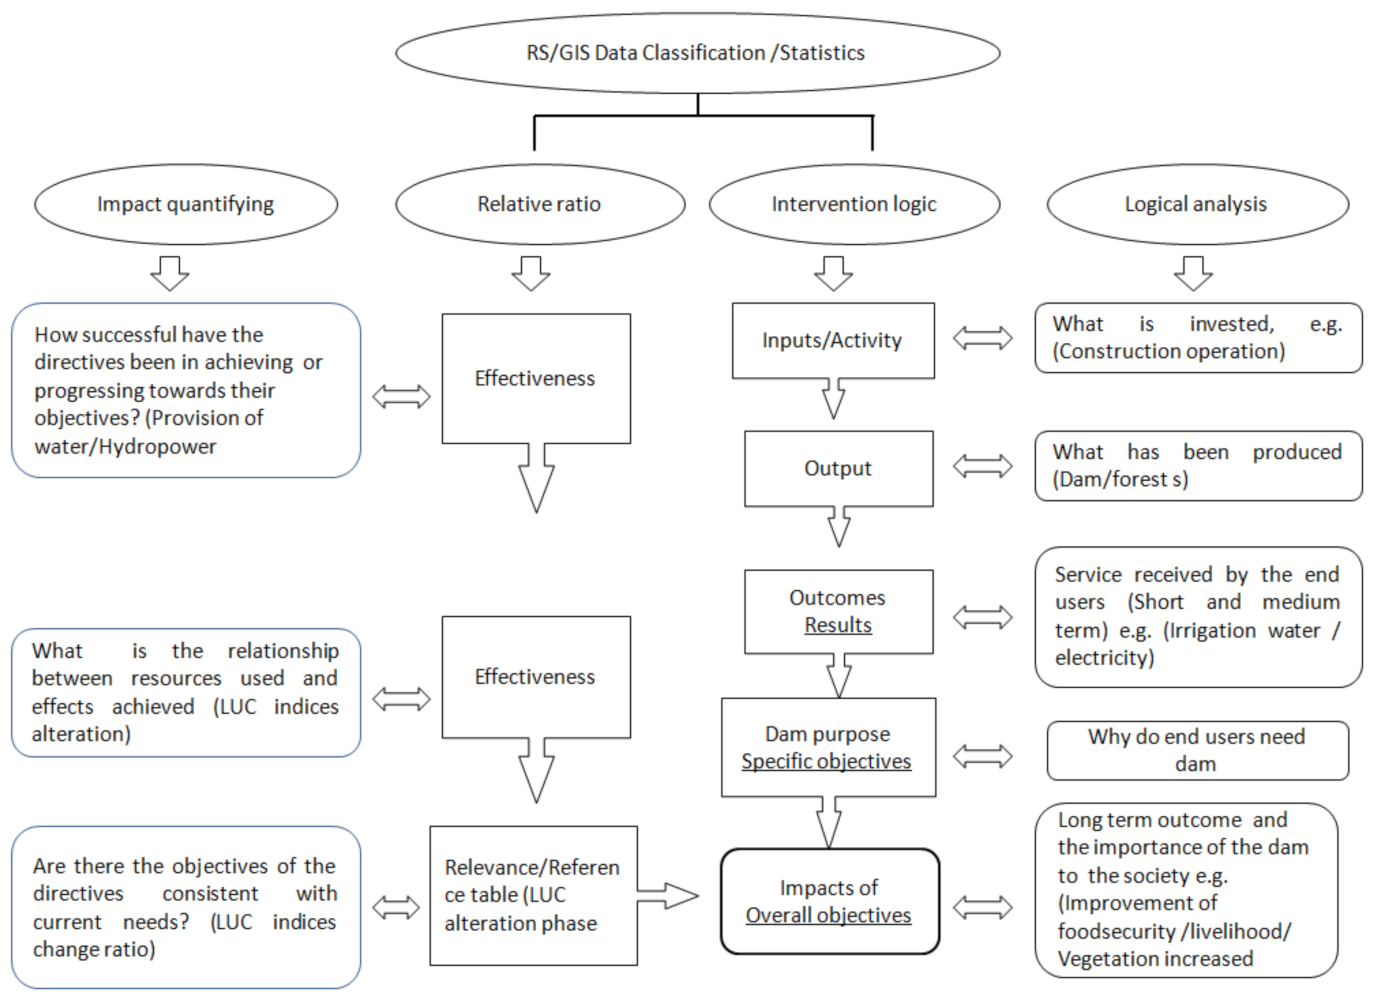
2.8. Logical Framework
2.9. Land-Use Change Analysis and the Spatial Dynamic
3. Results and Discussion
3.1. Accuracy Assessment
- Errors in the reference data.
- Sensitivity of the classification scheme to observer variability.
- Inappropriateness of the RS technology for mapping a specific LUC class.
- Mapping error.
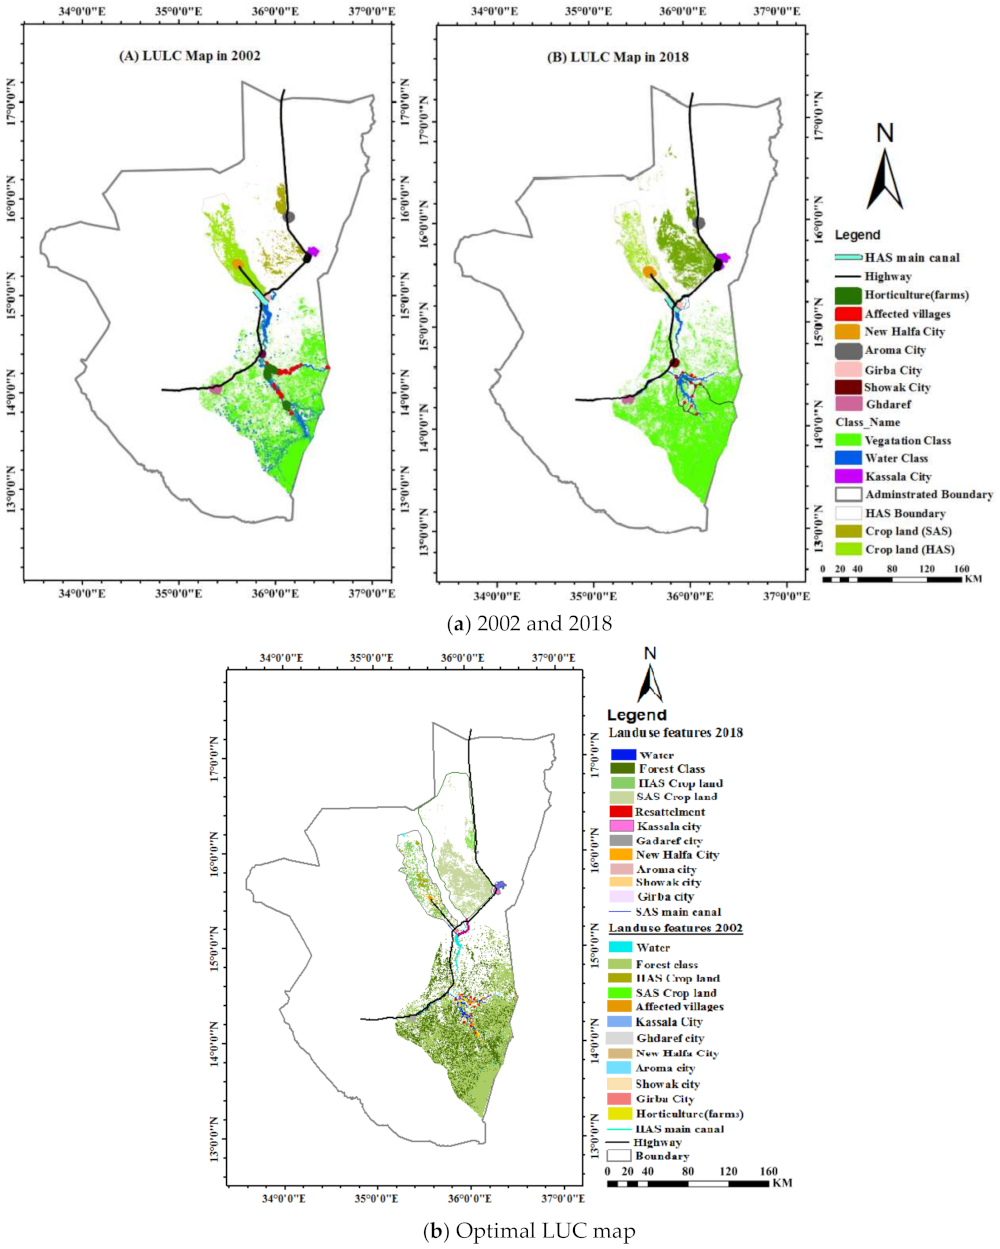
3.2. Spatiotemporal Change Analysis of the Regional Situation in 2002 and 2018
3.3. The Quantification of the Impact of Dam through Observation and Statistical Data Analysis
3.4. Detailed Case Study of Land Use/Land Cover Change and the Impact of the Dam Up/Downstream
3.4.1. Overall Objective of the Dam
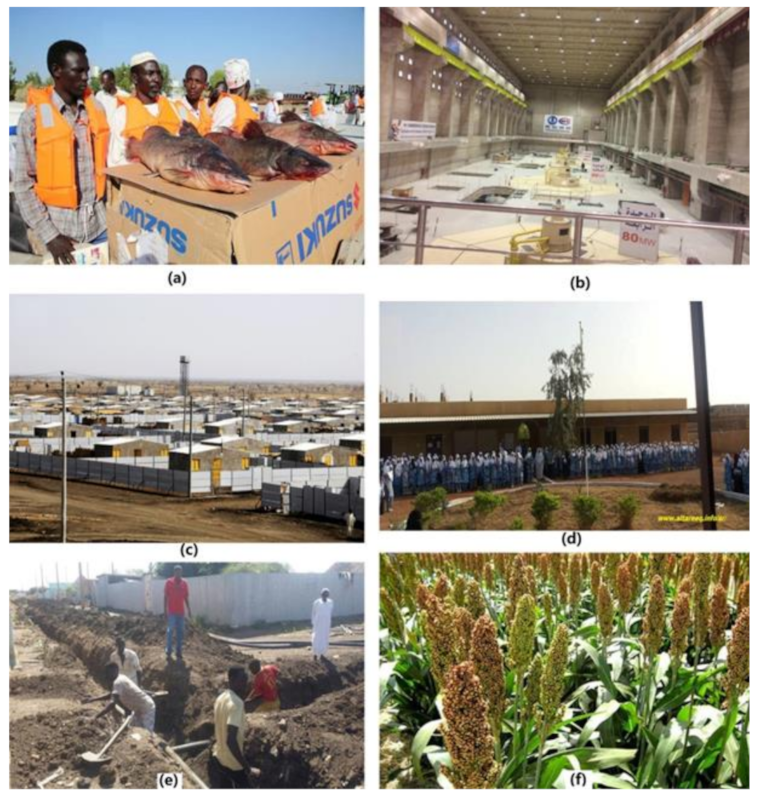
3.4.2. Dam-Related Livelihoods and Enabling Community Resilience
4. Conclusions and Recommendation
Author Contributions
Funding
Institutional Review Board Statement
Informed Consent Statement
Data Availability Statement
Acknowledgments
Conflicts of Interest
References
- dos Anjos Luís, A.; Cabral, P. Small dams/reservoirs site location analysis in a semi-arid region of Mozambique. Int. Soil Water Conserv. Res. 2021, 320, 14–16. [Google Scholar]
- Tundisi, J.G.; Goldemberg, J.; Matsumura-Tundisi, T.; Saraiva, A.C. How many more dams in the Amazon? Energy Policy 2014, 74, 703–708. [Google Scholar] [CrossRef]
- Alrajoula, M.T.; Al Zayed, I.S.; Elagib, N.A.; Hamdi, M.R. Hydrological, socio-economic and reservoir alterations of Er Roseires Dam in Sudan. Sci. Total Environ. 2016, 566–567, 938–948. [Google Scholar] [CrossRef] [PubMed]
- Zhang, W.; Mu, S.; Zhang, Y.; Chen, K. Temporal variation of suspended sediment load in the Pearl River due to human activities. Int. J. Sediment Res. 2011, 26, 487–497. [Google Scholar] [CrossRef]
- Ibrahim, G.R.F.; Rasul, A.; Hamid, A.A.; Ali, Z.F.; Dewana, A.A. Suitable Site Selection for Rainwater Harvesting and Storage Case Study Using Dohuk Governorate. Water 2019, 11, 864. [Google Scholar] [CrossRef] [Green Version]
- Yifru, B.; Kim, M.-G.; Lee, J.-W.; Kim, I.-H.; Chang, S.-W.; Chung, I.-M. Water Storage in Dry Riverbeds of Arid and Semi-Arid Regions: Overview, Challenges, and Prospects of Sand Dam Technology. Sustainability 2021, 13, 5905. [Google Scholar] [CrossRef]
- IRENA. Renewable Capacity Statistics 2021; International Renewable Energy Agency (IRENA): Abu Dhabi, United Arab Emirates, 2021; Available online: https://www.irena.org/publications/2021/March/Renewable-Capacity-Statistics-2021 (accessed on 19 June 2021).
- Akyürek, G. Impact of Atatürk Dam on Social and Environmental aspects of Southeastern Anatolia Project. Master’s Thesis, Middle East Technical University, Ankara, Turkey, 2005; pp. 19–22. [Google Scholar]
- Basheer, M.; Nechifor, V.; Calzadilla, A.; Siddig, K.; Etichia, M.; Whittington, D.; Hulme, D.; Harou, J.J. Collaborative management of the Grand Ethiopian Renaissance Dam increases economic benefits and resilience. Nat. Commun. 2021, 12, 5622. [Google Scholar] [CrossRef] [PubMed]
- Zarfl, C.; Lumsdon, A.E.; Berlekamp, J.; Tydecks, L.; Tockner, K. A global boom in hydropower dam construction. Aquat. Sci. 2015, 77, 161–170. [Google Scholar] [CrossRef]
- Tajziehchi, S.; Karbassi, A.; Nabi, G.; Yoo, C.; Ifaei, P. A Cost-Benefit Analysis of Bakhtiari Hydropower Dam Considering the Nexus between Energy and Water. Energies 2022, 15, 871. [Google Scholar] [CrossRef]
- D’Souza, R. Framing India’s Hydraulic Crisis: The Politics of the Modern Large Dam. Mon. Rev. 2008, 60, 112–124. [Google Scholar] [CrossRef]
- Tadese, J. The Grand Ethiopian Renaissance Dam (GERD): Diplomatic War between Ethiopia and Egypt; RG.2.2.16518.09286; 2020; Volume 10, pp. 17–19. Available online: https://www.researchgate.net/publication/351256854_The_Grand_Ethiopian_Renaissance_Dam_GERD_Diplomatic_War_Between_Ethiopia_and_Egypt (accessed on 15 January 2022).
- Requejo Castro, D.; Taberna Torres, J.; García Planas, M.I. Algebra and Large-scale Dam Assesment: The case of Merowe Dam in Sudan. 2018. Available online: https://upcommons.upc.edu/bitstream/handle/2117/118565/Case%20study.pdf (accessed on 15 January 2022).
- Tang, K.; Shen, Y. Do China-financed dams in Sub-Saharan Africa improve the region’s social welfare? A case study of the impacts of Ghana’s Bui Dam. 2019. Available online: https://africa.isp.msu.edu/files/8316/3625/3675/WP_25_Tang_Shen_Bui_Dam.pdf (accessed on 15 January 2022).
- Bengtsson, L.; Berndtsson, R. Conflicts regardingd dams with several functions. In Dams under Debate; Formas: Stockholm, Sweden, 2006; Volume 36, pp. 21–28. [Google Scholar]
- Marchetti, N.; Curci, A.; Gatto, M.C.; Nicolini, S.; Mühl, S.; Zaina, F. A multi-scalar approach for assessing the impact of dams on the cultural heritage in the Middle East and North Africa. J. Cult. Herit. 2019, 37, 17–21. [Google Scholar] [CrossRef]
- Ahmed, S.M. Impacts of drought, food security policy and climate change on performance of irrigation schemes in Sub-saharan Africa: The case of Sudan. Agric. Water Manag. 2020, 232, 106064. [Google Scholar] [CrossRef]
- Ayana, E.K.; Srinivasan, R. Impact of the Grand Ethiopian Renaissance Dam (GERD) and Climate Change on Water Availability in Sudan; Uppssls University: Uppssls, Sweden, 2019; Available online: http://www.diva-portal.se/smash/get/diva2:1359791/FULLTEXT01.pdf (accessed on 15 January 2022).
- Bashar, K.E.; Mustafa, M.O. Mustafa2, Water Balance Assessment of the Roseires Reservoir. Available online: https://ideas.repec.org/p/iwt/conppr/h042506.html (accessed on 15 January 2022).
- The Meowe Dam in the SUDAN. Lahmeyer International Involvement and Assistance. Available online: https://www.business-humanrights.org/es/últimas-noticias/pdf-the-merowe-dam-in-the-sudan-lahmeyer-internationals-involvement-and-assistance/ (accessed on 15 January 2022).
- Chinese Firm Completes Construction of Hydropower Station in Sudan. 2019. Available online: https://en.imsilkroad.com/p/133304.html (accessed on 15 January 2022).
- Ali, R.; Kuriqi, A.; Abubaker, S.; Kisi, O. Hydrologic Alteration at the Upper and Middle Part of the Yangtze River, China: Towards Sustainable Water Resource Management Under Increasing Water Exploitation. Sustainability 2019, 11, 5176. [Google Scholar] [CrossRef] [Green Version]
- Howells, M.; Hermann, S.; Welsch, M.; Bazilian, M.; Segerström, R.; Alfstad, T.; Gielen, D.; Rogner, H.; Fischer, G.; van Velthuizen, H.; et al. Integrated analysis of climate change, land-use, energy and water strategies. Nat. Clim. Change 2013, 3, 621–626. [Google Scholar] [CrossRef]
- Baeza, S.; Paruelo, J.M. Land Use/Land Cover Change (2000–2014) in the Rio de la Plata Grasslands: An Analysis Based on MODIS NDVI Time Series. Remote Sens. 2020, 12, 381. [Google Scholar] [CrossRef] [Green Version]
- Munroeaic, D.K.; Southworth, J.; Tucker, C.M. The dynamics of land-cover change in western Honduras: Exploring spatial and temporal complexity. Agric. Econ. 2002, 27, 355–369. [Google Scholar] [CrossRef]
- Boscolo, M.; Kerr, S.; Pfaff, A.; Sanchez, A. What role for tropical forests in climate change mitigation? The case of Costa Rica. AGRIS 1999, 25, 25–27. [Google Scholar]
- Vance, C.; Geoghegan, J. Temporal and spatial modelling of tropical deforestation: A survival analysis linking satellite and household survey data. Agric. Econ. 2002, 27, 317–332. [Google Scholar] [CrossRef] [Green Version]
- Palmer, A.R.; van Rooyen, A.F. Detecting vegetation change in the southern Kalahari using Landsat TM data. J. Arid Environ. 1998, 39, 143–153. [Google Scholar] [CrossRef]
- Alredaisy, S.M.A. Mitigating the catastrophic impacts of torrential rivers in semi-arid environments: A case of the Gash River in eastern Sudan. J. Arid Land 2011, 3, 174–183. [Google Scholar] [CrossRef]
- WFP (Sudan). Livelihood Vulnerability and Nutritional Assessment of Rural Kassala and Red Sea State; WFP: Khartoum, Sudan, 2015; Available online: https://www.slideserve.com/erik/livelihood-vulnerability-and-nutritional-assessment-of-rural-kassala-and-red-sea-state (accessed on 15 January 2022).
- Freeman, A.M., III; Herriges, J.A.; Kling, C.L. The Measurement of Environmental and Resource Values: Theory and Methods, 3rd ed.; RFF PRESS: New York, NY, USA, 2014; Available online: http://econdse.org/wp-content/uploads/2016/07/Freeman-Herriges-Kling-2014.pdf (accessed on 15 January 2022).
- Bashar, K.E. Assessment of the Level of Implementation of Integrated Water Resources Management in Sudan; Ministry of Irrigation and Water Resources: Khartoum, Sudan, 2008. [Google Scholar]
- Jiang, W.; Fu, B.; Lü, Y. Assessing Impacts of Land Use/Land Cover Conversion on Changes in Ecosystem Services Value on the Loess Plateau, China. Sustainability 2020, 12, 7128. [Google Scholar] [CrossRef]
- Dams Implementation Unit (DIU), Ministry of Electricity and Dams. Upper Atbara and Setit Project and Gadaref Potable Water; Dams Implementation Unit (DIU), Ministry of Electricity and Dams: Khartoum, Sudan, 2019. [Google Scholar]
- Project Unit. Resettlement Villgies; Potable Water Cirporation: Gadaref City, Sudan, 3 January 2017. [Google Scholar]
- Dam Implemenyation Unit. Sitit Agricultural Scheme (SAS); Ministry of Production and Economic Resources: Kassala City, Sudan, 2016. [Google Scholar]
- Ministry of Agriculture. Agricultural Investment; Ministry of Agriculture an Forst: Kassala, Sudan, 2017. [Google Scholar]
- M of Water Resources 61. Irrigation and Electricity. In Upper Atbara, Sitit and Gadaref Water; Dam Implement, Unit DIU: Khartoum, Sudan, 2016. [Google Scholar]
- Moran, M.; Jackson, R.D.; Slater, P.N.; Teillet, P.M. Evaluation of simplified procedures for retrieval of land surface reflectance factors from satellite sensor output. Remote Sens. Environ. 1992, 41, 169–184. [Google Scholar] [CrossRef]
- Maggiore, G.; Semeraro, T.; Aretano, R.; De Bellis, L.; Luvisi, A. GIS Analysis of Land-Use Change in Threatened Landscapes by Xylella fastidiosa. Sustainability 2019, 11, 253. [Google Scholar] [CrossRef] [Green Version]
- Mrówczyńska, M.; Sztubecka, M.; Skiba, M.; Bazan-Krzywoszańska, A.; Bejga, P. The Use of Artificial Intelligence as a Tool Supporting Sustainable Development Local Policy. Sustainability 2019, 11, 4199. [Google Scholar] [CrossRef] [Green Version]
- Wilson, D.J.; Smith, B.K.; Gibson, J.K.; Choe, B.K.; Gaba, B.C.; Voelz, J.T. Accuracy of digitization using automated and manual methods. Phys. Ther. 1999, 79, 15–19. [Google Scholar] [CrossRef] [Green Version]
- Diamond, J.T.; Wright, J.R. Design of an integrated spatial information system for multiobjective land-use planning. Environ. Plan. B Plan. Des. 1988, 15, 205–214. [Google Scholar] [CrossRef]
- Stehman, S.V.; Foody, G.M. Key issues in rigorous accuracy assessment of land cover products. Remote Sens. Environ. 2019, 231, 111199. [Google Scholar] [CrossRef]
- Tadros, M.; Al-Assaf, A.; Othman, Y.; Makhamreh, Z.; Taifoure, H. Evaluating the Effect of Prosopis juliflora, an Alien Invasive Species, on Land Cover Change Using Remote Sensing Approach. Sustainability 2020, 12, 5887. [Google Scholar] [CrossRef]
- Hu, Q.; Wu, W.; Xia, T.; Yu, Q.; Yang, P.; Li, Z.; Song, Q. Exploring the Use of Google Earth Imagery and Object-Based Methods in Land Use/Cover Mapping. Remote Sens. 2013, 5, 6026–6042. [Google Scholar] [CrossRef] [Green Version]
- Story, M.; Congalton, R.G. Accuracy assessment: A user’s perspective. Photogramm. Eng. Remote Sens. 1986, 52, 397–399. [Google Scholar]
- Kiani, A.K.; Khan, W.U.; Raja, M.A.Z.; He, Y.; Sabir, Z.; Shoaib, M. Intelligent Backpropagation Networks with Bayesian Regularization for Mathematical Models of Environmental Economic Systems. Sustainability 2021, 13, 9537. [Google Scholar] [CrossRef]
- Beniston, M.; Stoffel, M. Assessing the impacts of climatic change on mountain water resources. Sci. Total Environ. 2014, 493, 1129–1137. [Google Scholar] [CrossRef]
- Agresti, A. An Introduction to Categorical Data Analysis, 2nd ed.; Willey: Gainesville, FL, USA, 1996; Available online: https://mregresion.files.wordpress.com/2012/08/agresti-introduction-to-categorical-data.pdf (accessed on 15 January 2022).
- Bajagai, Y.S. Basic Concepts of Food Security: Definition, Dimensions and Integrated Phase Classification, Food and Environment. 2013. Available online: https://www.foodandenvironment.com/2013/01/basic-concept-of-food-security.html (accessed on 15 January 2022).
- Towards a New System of Monitoring and Evaluation in EU Cohesion Policy; European Commission: Brussels, Belgium, 2014; Available online: https://ec.europa.eu/regional_policy/sources/docoffic/2014/working/wd_2014_en.pdf (accessed on 15 January 2022).
- Potkány, M.; Gejdoš, M.; Debnár, M. Sustainable Innovation Approach for Wood Quality Evaluation in Green Business. Sustainability 2018, 10, 2984. [Google Scholar] [CrossRef] [Green Version]
- Verburg, P.H.; Soepboer, W.; Veldkamp, A.; Limpiada, R.; Espaldon, V.; Mastura, S.S.A. Modeling the Spatial Dynamics of Regional Land Use: The CLUE-S Model. Environ. Manag. 2002, 30, 391–405. [Google Scholar] [CrossRef]
- Lambin, E.F.; Geist, H.J.; Lepers, E. Dynamics of Land-Use and Land-Cover Change in Tropical Regions. Annu. Rev. Environ. Resour. 2003, 28, 205–241. [Google Scholar] [CrossRef] [Green Version]
- Abubakar, G.A.; Wang, K.; Shahtahamssebi, A.; Xue, X.; Belete, M.; Gudo, A.J.A.; Mohamed Shuka, K.A.; Gan, M. Mapping Maize Fields by Using Multi-Temporal Sentinel-1A and Sentinel-2A Images in Makarfi, Northern Nigeria, Africa. Sustainability 2020, 12, 2539. [Google Scholar] [CrossRef] [Green Version]
- Congalton, R.G.; Green, K. Assessing the Accuracy of Remotely Sensed Data, 3rd ed.; CRC Press: Boca Raton, FL, USA; Taylor & Francis Group: Abingdon, UK, 2019. [Google Scholar]
- Li, Z.; Ren, Y.; Li, J.; Li, Y.; Rykov, P.; Chen, F.; Zhang, W. Land-Use/Cover Change and Driving Mechanism onthe West Bank of Lake Baikal from 2005 to 2015—A Case Study of Irkutsk City. Sustainability 2018, 10, 2904. [Google Scholar] [CrossRef] [Green Version]
- Mahmood, M.I.; Elagib, N.A.; Horn, F.; Saad, S.A. Lessons learned from Khartoum flash flood impacts: An integrated assessment. Sci. Total Environ. 2017, 601, 16–18. [Google Scholar] [CrossRef]
- Han, D.; Qiao, R.; Ma, X. Optimization of Land-Use Structure Based on the Trade-Off between Carbon Emission Targets and Economic Development in Shenzhen, China. Sustainability 2019, 11, 11. [Google Scholar] [CrossRef] [Green Version]
- Mustafa, R.H. Risk Management in the Rain-Fed Sector of Sudan: Case Study, Gedaref Area Eastern Sudan; Justus—Liebig University: Giessen, Germany, 2006; Available online: http://geb.uni-giessen.de/geb/volltexte/2006/3679/pdf/HassanMustafaRajaa-2006-09-01.pdf (accessed on 15 January 2022).
- Wang, Y.; Shataer, R.; Xia, T.; Chang, X.; Zhen, H.; Li, Z. Evaluation on the Change Characteristics of Ecosystem Service Function in the Northern Xinjiang Based on Land Use Change. Sustainability 2021, 13, 9679. [Google Scholar] [CrossRef]
- Wu, C.; Ma, G.; Yang, W.; Zhou, Y.; Peng, F.; Wang, J.; Yu, F. Assessment of Ecosystem Service Value and Its Differences in the Yellow River Basin and Yangtze River Basin. Sustainability 2021, 13, 3822. [Google Scholar] [CrossRef]
- Mustafa, R.H. Project Management Fact Sheetm; Department of Premier and Cabinet: Sydney, Australia, 2008. Available online: https://www.dpac.tas.gov.au/__data/assets/pdf_file/0018/509301/Managing_Small_Projects_Fact_Sheet.pdf (accessed on 15 January 2022).
- Peng, Z.; Wu, H.; Ding, M.; Li, M.; Huang, X.; Zheng, R.; Xu, L. Ecological Compensation Standard of a Water-Receiving Area in an Inter-Basin Water Diversion Based on Ecosystem Service Value and Public Willingness: A Case Study of Beijing. Sustainability 2021, 13, 5236. [Google Scholar] [CrossRef]
- Porter, M.E.; Kramer, M.R. Strategy and society: The link between competitive advantage and corporate social responsibility. Harv. Bus. Rev. 2006, 84, 78–92. [Google Scholar]
- Huang, L.; Feng, Y.; Zhang, B.; Hu, W. Spatio-Temporal Characteristics and Obstacle Factors of Cultivated Land Resources Security. Sustainability 2021, 13, 8498. [Google Scholar] [CrossRef]
- Wang, Z.; Cao, J.; Zhu, C.; Yang, H. The Impact of Land Use Change on Ecosystem Service Value in the Upstream of Xiong’an New Area. Sustainability 2020, 12, 5707. [Google Scholar] [CrossRef]
- Zhou, Y.; Zhang, X.; Yu, H.; Liu, Q.; Xu, L. Land Use-Driven Changes in Ecosystem Service Values and Simulation of Future Scenarios: A Case Study of the Qinghai–Tibet Plateau. Sustainability 2021, 13, 4079. [Google Scholar] [CrossRef]
- Akamani, K. Integrating Deep Ecology and Adaptive Governance for Sustainable Development: Implications for Protected Areas Management. Sustainability 2020, 12, 5757. [Google Scholar] [CrossRef]
- Cervelli, E.; Di Perta, E.S.; Pindozzi, S. Identification of Marginal Landscapes as Support for Sustainable Development: GIS-Based Analysis and Landscape Metrics Assessment in Southern Italy Areas. Sustainability 2020, 12, 5400. [Google Scholar] [CrossRef]
- Baker, A.C.; Glynn, P.W.; Riegl, B. Climate change and coral reef bleaching: An ecological assessment of long-term impacts, recovery trends and future outlook. Estuar. Coast. Shelf Sci. 2008, 80, 435–471. [Google Scholar] [CrossRef]
- Nüsser, M. The emergence of technological hydroscapes in the Anthropocene: Socio- hydrology and development paradigms of large dams. In Handbook on Geographies of Technology; Edward Elgar Publishing: Cheltenham, UK, 2017; pp. 287–301. [Google Scholar] [CrossRef]
- Council for Natural Resources and Human Right Obligations Related to Access Safe Drinking Water and Sanitations; Drinking Water Corporation: Khartoum, Sudan, 2007.
- Bonan, G.B. Forests and climate change: Forcings, feedbacks, and the climate benefits of forests. Science 2008, 320, 1444–1449. [Google Scholar] [CrossRef] [PubMed] [Green Version]
- Zhang, L.; Zhao, F.; Chen, Y.; Dixon, R.N. Estimating effects of plantation expansion and climate variability on streamflow for catchments in Australia. Water Resour. Res. 2011, 47, 13–15. [Google Scholar] [CrossRef]
- Wang, Z.; Lu, Z.; Cui, G. Spatiotemporal Variation of Land Surface Temperature and Vegetation in Response to Climate Change Based on NOAA-AVHRR Data over China. Sustainability 2020, 12, 3601. [Google Scholar] [CrossRef]
- Yang, J.; Li, S.; Lu, H. Quantitative Influence of Land-Use Changes and Urban Expansion Intensity on Landscape Pattern in Qingdao, China: Implications for Urban Sustainability. Sustainability 2019, 11, 6174. [Google Scholar] [CrossRef] [Green Version]
- Kolk, A.; van Tulder, R. International business, corporate social responsibility and sustainable development. Int. Bus. Rev. 2010, 19, 119–125. [Google Scholar] [CrossRef] [Green Version]


| Satellite Series | Sensor | Spatial Resolution | Bands | Acquisition Date | Source |
|---|---|---|---|---|---|
| Landsat5 | Thematic Mapper TM | 30 m, Resample to 10 m | 7 | 22 January 2002 | USGS |
| Sentinel2A | Multispectral Instrument (MSI) | 10 m | 12 | 28 February 2018 | USGS |
| Google Earth Pro | - | 1 m | - | January 2002–2018 | Google Earth |
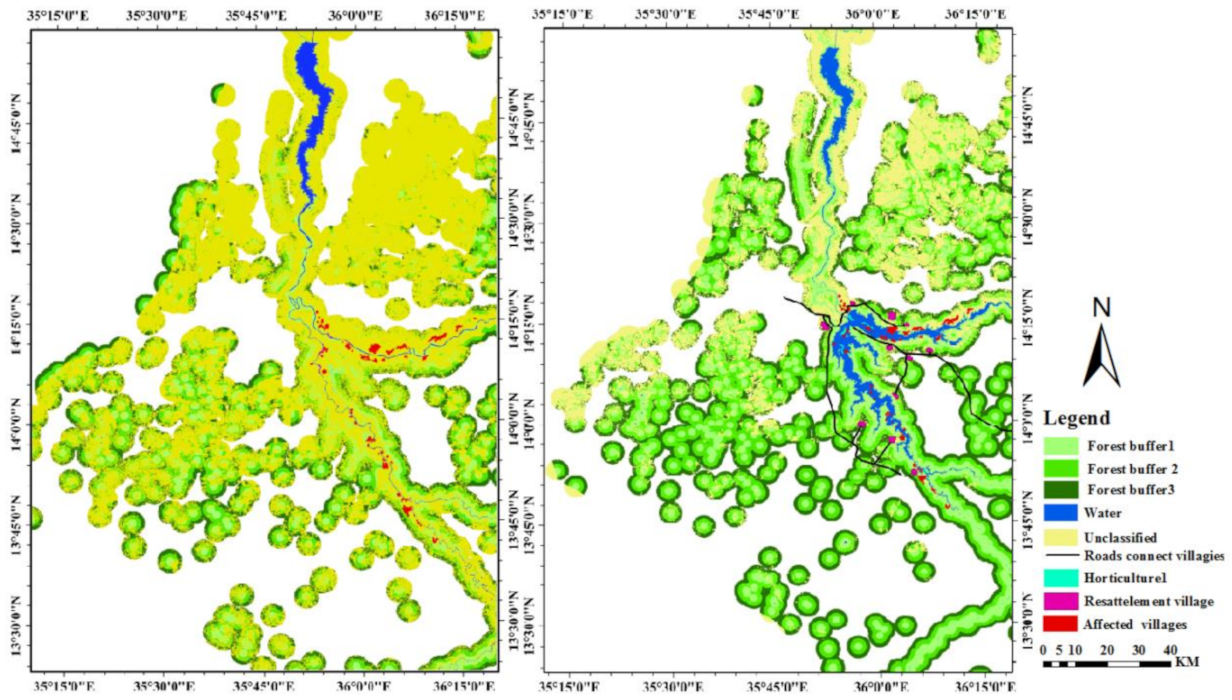
| Land Use Class Key | Description | Classification Method |
|---|---|---|
| Water | Water class, including the lake, the Atbara River, and water bonds (Hafir) | SVM |
| Forest | The vegetation of acacia trees used for Gum Arabic production and firewood | SVM |
| Cropped land | Irrigated agricultural land in HAS and SAS | SVM |
| Resettlement village | New villages built for people affected by the dam construction | Digitizing |
| Roads | New paved and improved roads, constructed to link the resettlement villages | Digitizing |
| Horticulture | Farms on the riverbank used for fruit trees, vegetables, and fodder production. | SVM |
| Built-up area, airport | City areas delineated in Google Earth | Digitizing |
| Codes of Change Phases | ||||
|---|---|---|---|---|
| S1 | S2 | S3 | N1 | N2 |
| Relative Ratio is higher than (100%) with high Change in services received by the end users. | Relative Ratio between (100–70) % with Sufficient change in services received by the end users. | Relative Ratio between (70–30) % with insufficient change in services received by the end users. | Relative Ratio between (30–1) % with weak change in services received by the end users. | Relative Ratio is less than 1% with decreasing in services received by the end users. |
| Year | Classification | Class | Non-Class | Row Total | Producer Accuracy (%) | Measure of Commission Error (%) |
|---|---|---|---|---|---|---|
| 2018 | Water | 67 | 3 | 70 | 95.7 | 4.3 |
| Forest | 84 | 6 | 90 | 93.3 | 6.67 | |
| Crop land—HAS | 74 | 6 | 80 | 92.5 | 7.5 | |
| Crop land—SAS | 82 | 8 | 90 | 91.1 | 8.9 | |
| Column Total | 307 | 23 | 330 | |||
| Overall accuracy | 93 | |||||
| 2002 | Water | 55 | 5 | 60 | 91.7 | 8.3 |
| Forest | 74 | 6 | 80 | 92.5 | 7.5 | |
| Crop land—HAS | 69 | 6 | 75 | 92 | 8 | |
| Crop land—SAS | 45 | 5 | 50 | 90 | 10 | |
| Column Total | 243 | 22 | 265 | |||
| Overall accuracy | 94.9 |
| Intervention Logic | Output | Outcome | Specific Objectives | Impact | |||
|---|---|---|---|---|---|---|---|
| Index/sub index | Indicators | 2002 | 2018 | Alteration (km2) and (Relative Ratio (%)) | LIPC | Validity | |
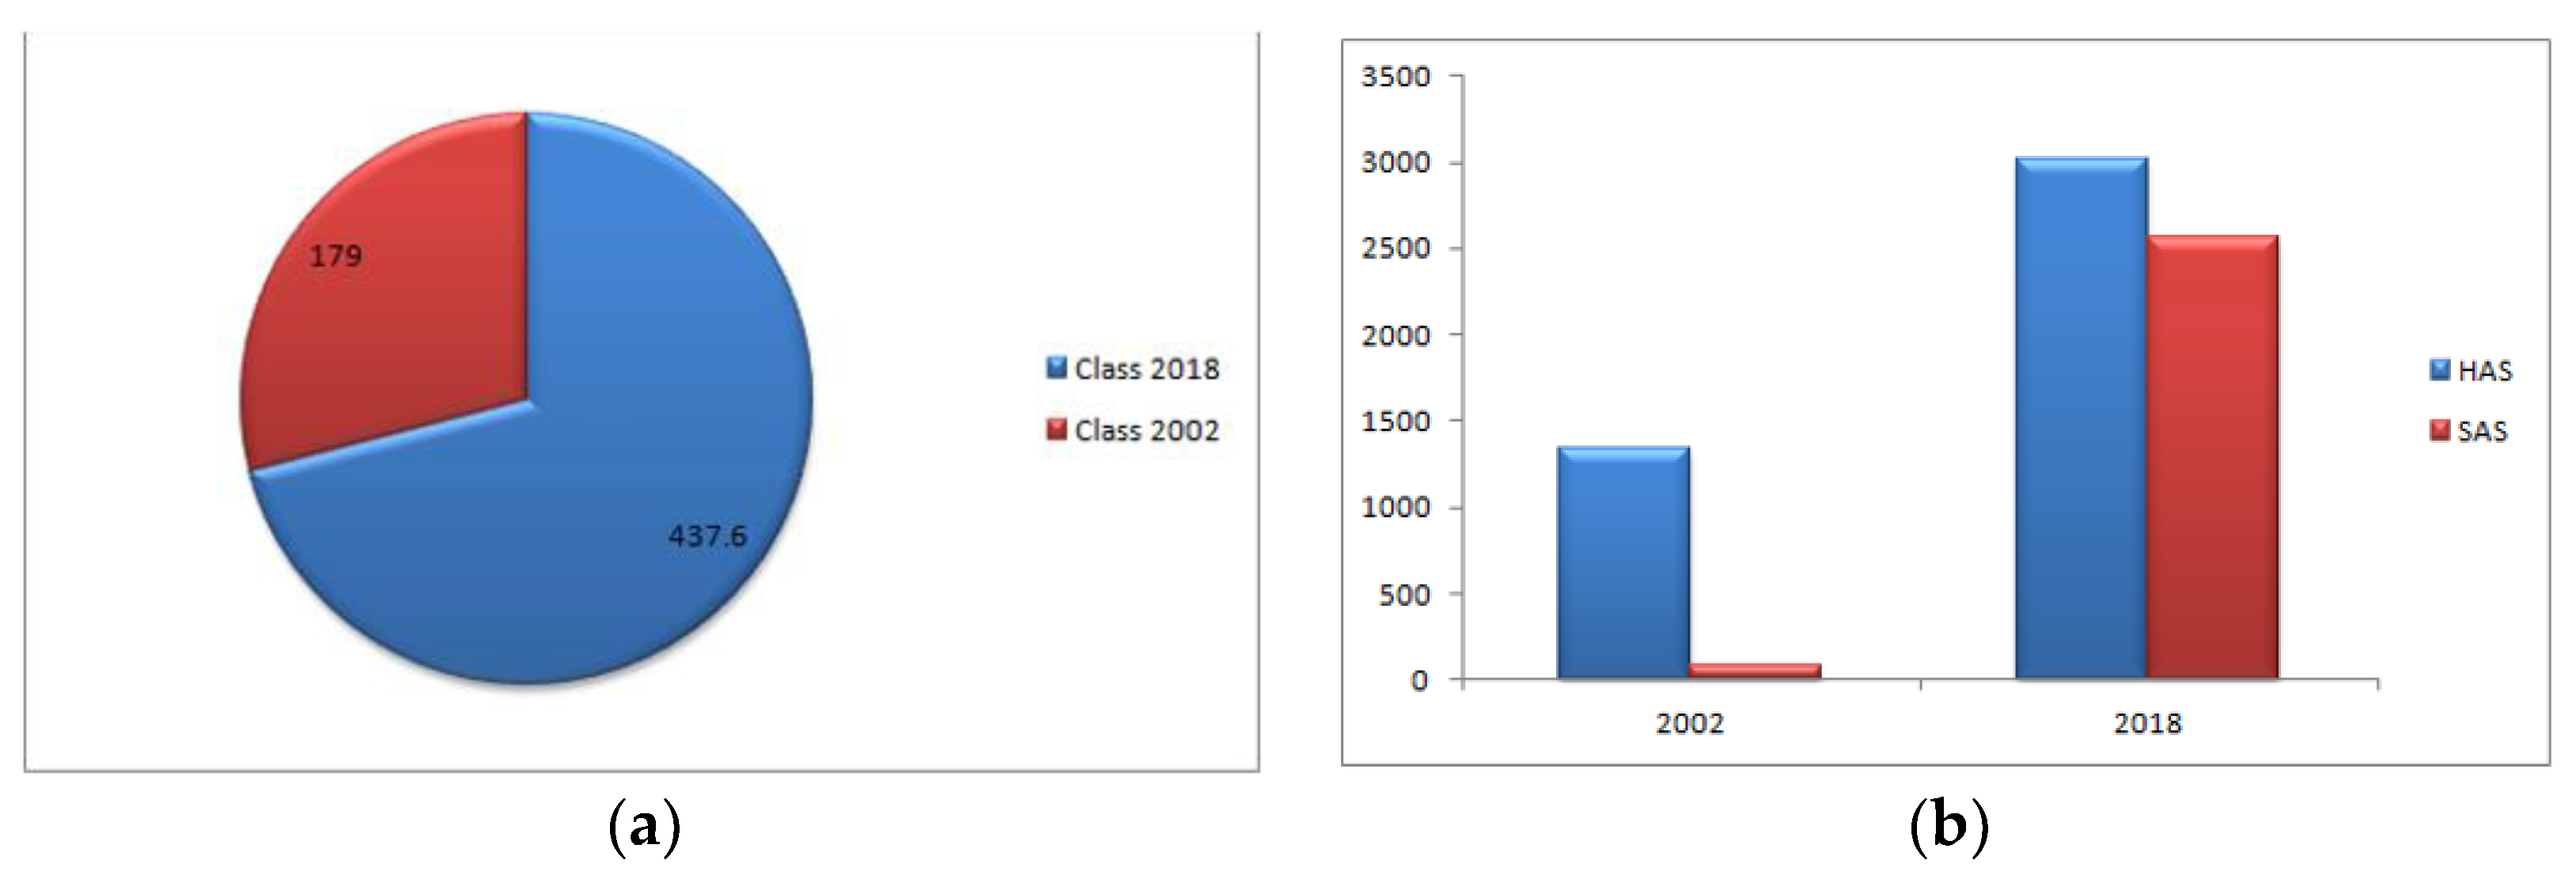
| Effects on land cover | Dam region | Water class Area (km2) | 179 | 437.6 | 258.60 (>100) | S1 | Overall accuracy assessment |
| Forest land (km2) | 7861 | 10,584 | 2723 (34.64) | S3 | |||
| Downstream | Irrigated land (HAS) km2 | 1340.77 | 3013.35 | 2672.58 (>100) | S1 | ||
| Irrigated Land (SAS) km2 | 81.25 | 2564.78 | 2483.53 (>100) | ||||
| Canals (SAS) km | 0 | 70 | 70 (>100) | ||||
| Urban growth | Kassala | 66.08 | 120.09 | 54.01 (81.73) | S2 | Mapping with Google Earth | |
| Gadaref | 66.51 | 78 | 11.49 (17) | S3 | |||
| Halfa | 18.48 | 21.79 | 3.31 (18)) | ||||
| Shwak | 3.77 | 4.98 | 1.21 (32.1) | ||||
| Girba | 6.68 | 9.82 | 3.14 (47) | ||||
| Intervention Logic | Output | Outcome | Specific Objectives | Impact | |||
|---|---|---|---|---|---|---|---|
| Index/sub index | Indicators | 2002 | 2018 | Alteration and (Relative Ratio (%)) | LIPC | Validity | |
| Effects on Infrastructure | Dam region | Hydroelectric power (MW) | 0 | 320 | 320 (>100%) | S1 | Statistics data |
| Resettlement modernistic | 28,394 | 30,000 | 1606 (5.66) | Statistics data/Google Earth | |||
| Roads (km) | 0 | 183 | 183 (>100) | ||||
| Bridges | 0 | 2 | 2 (>100) | ||||
| Airport | 0 | 1 | 1 (>100) | ||||
| Downstream | Gadaref Drinking water pipeline (km) | 0 | 70 | 70 (>100) | Statistics data | ||
| Gadaref Drinking water discharge (m3/day) | 0 | 75,000 | 75,000 (>100) | ||||
| Upper water tank in Gadaref (m3) | 0 | 10,000 | 10,000 (>100) | ||||
| Girba Dam Storage Capacity | 0.6 | 1.3 | 0.7 (>100) | ||||
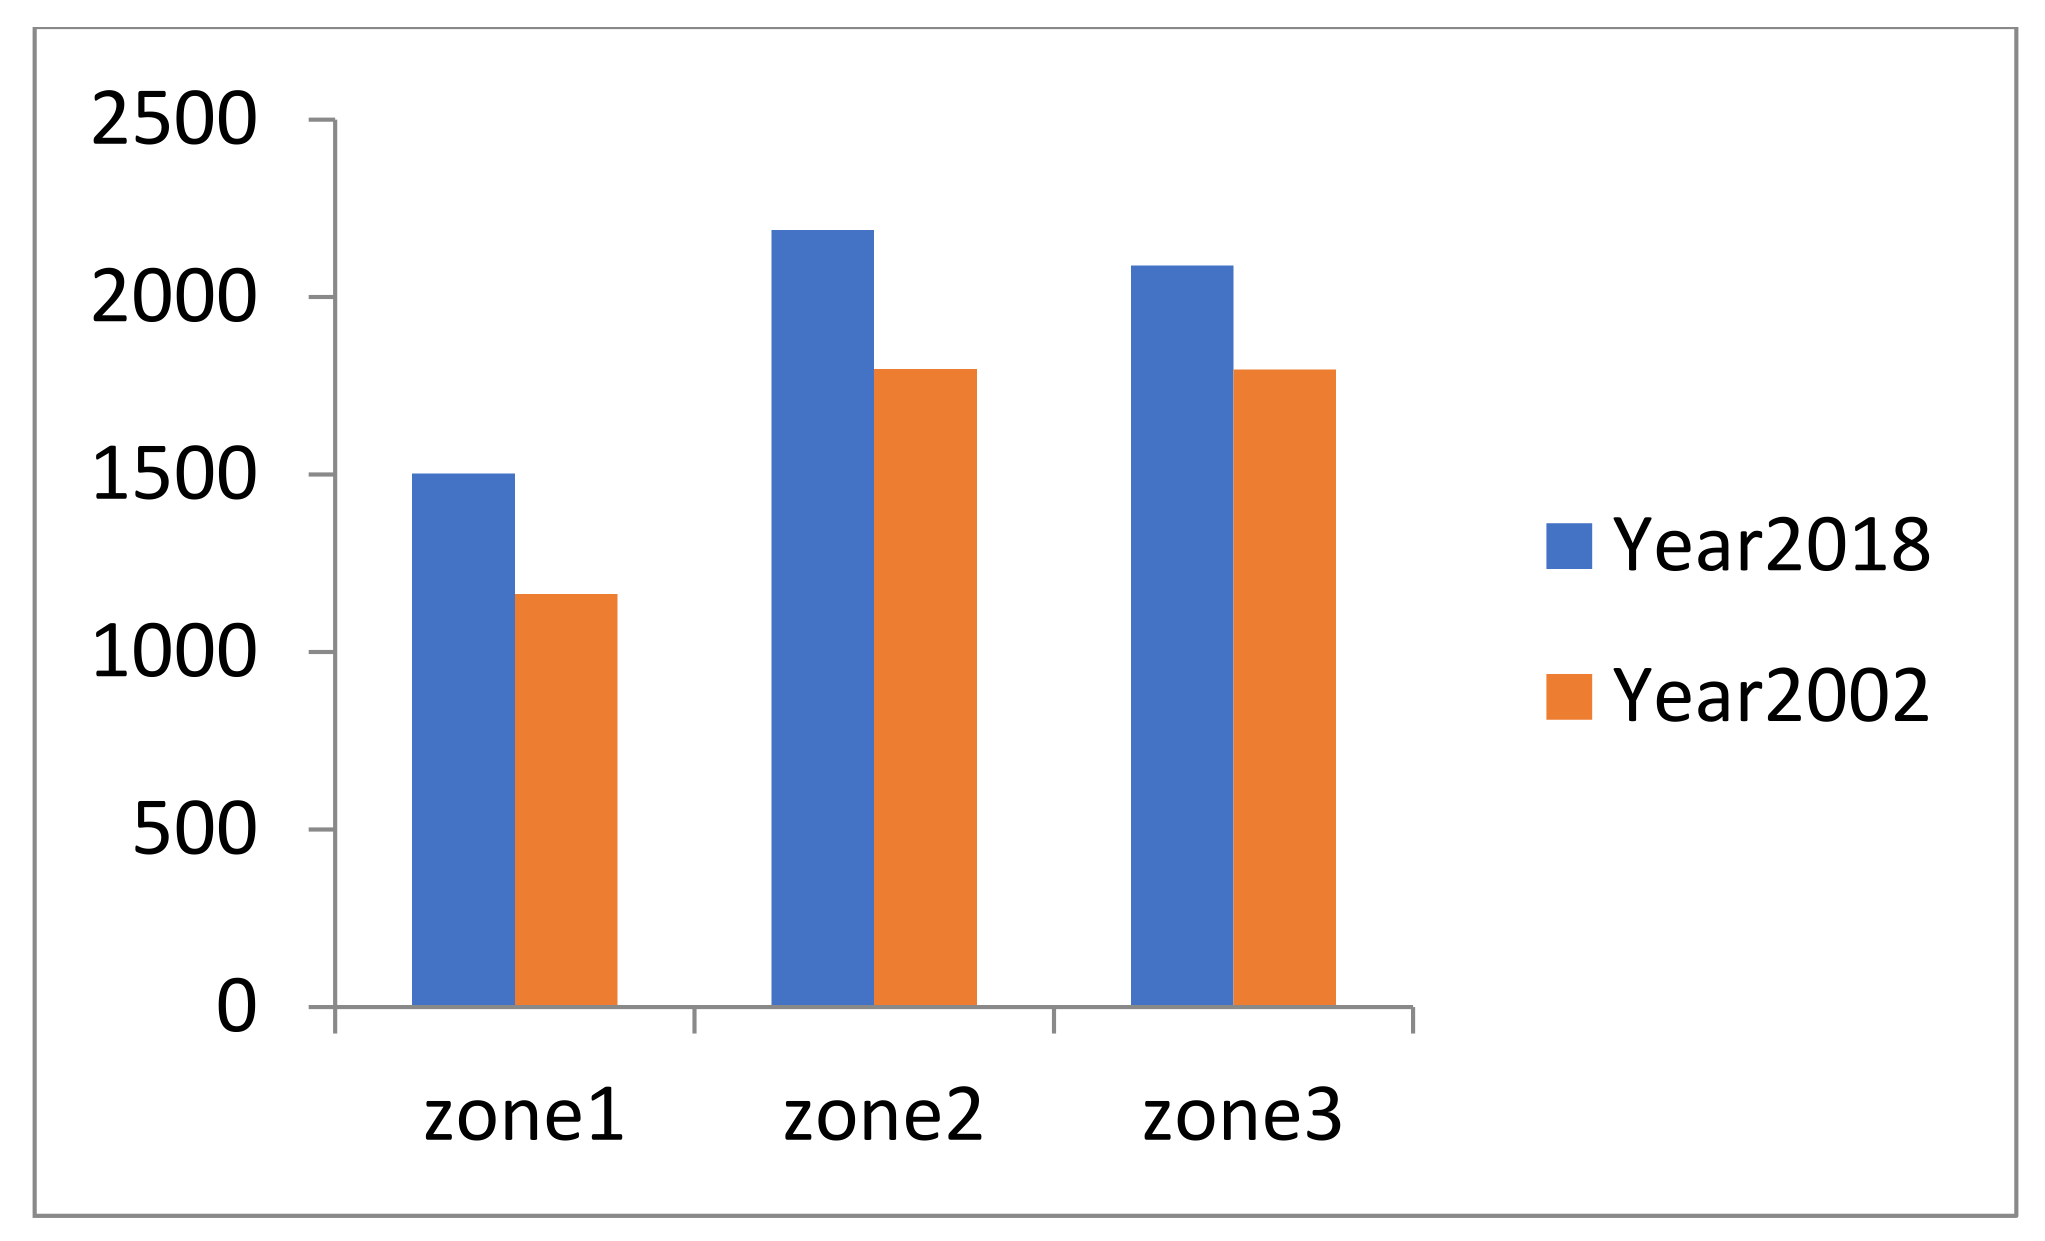
| Zone km | Vegetation (km2) 2018 | Buffer Change % | Alteration km2 | Vegetation (km2) 2002 | Vegetation Change (%) |
|---|---|---|---|---|---|
| 1 | 1503.491 | 0 | 330 | 1164.24 | 0 |
| 2 | 2188.88 | 45.59 | 391 | 1797.90 | 54.43 |
| 3 | 2089.35 | 38.97 | 393 | 1796.18 | 54.28 |
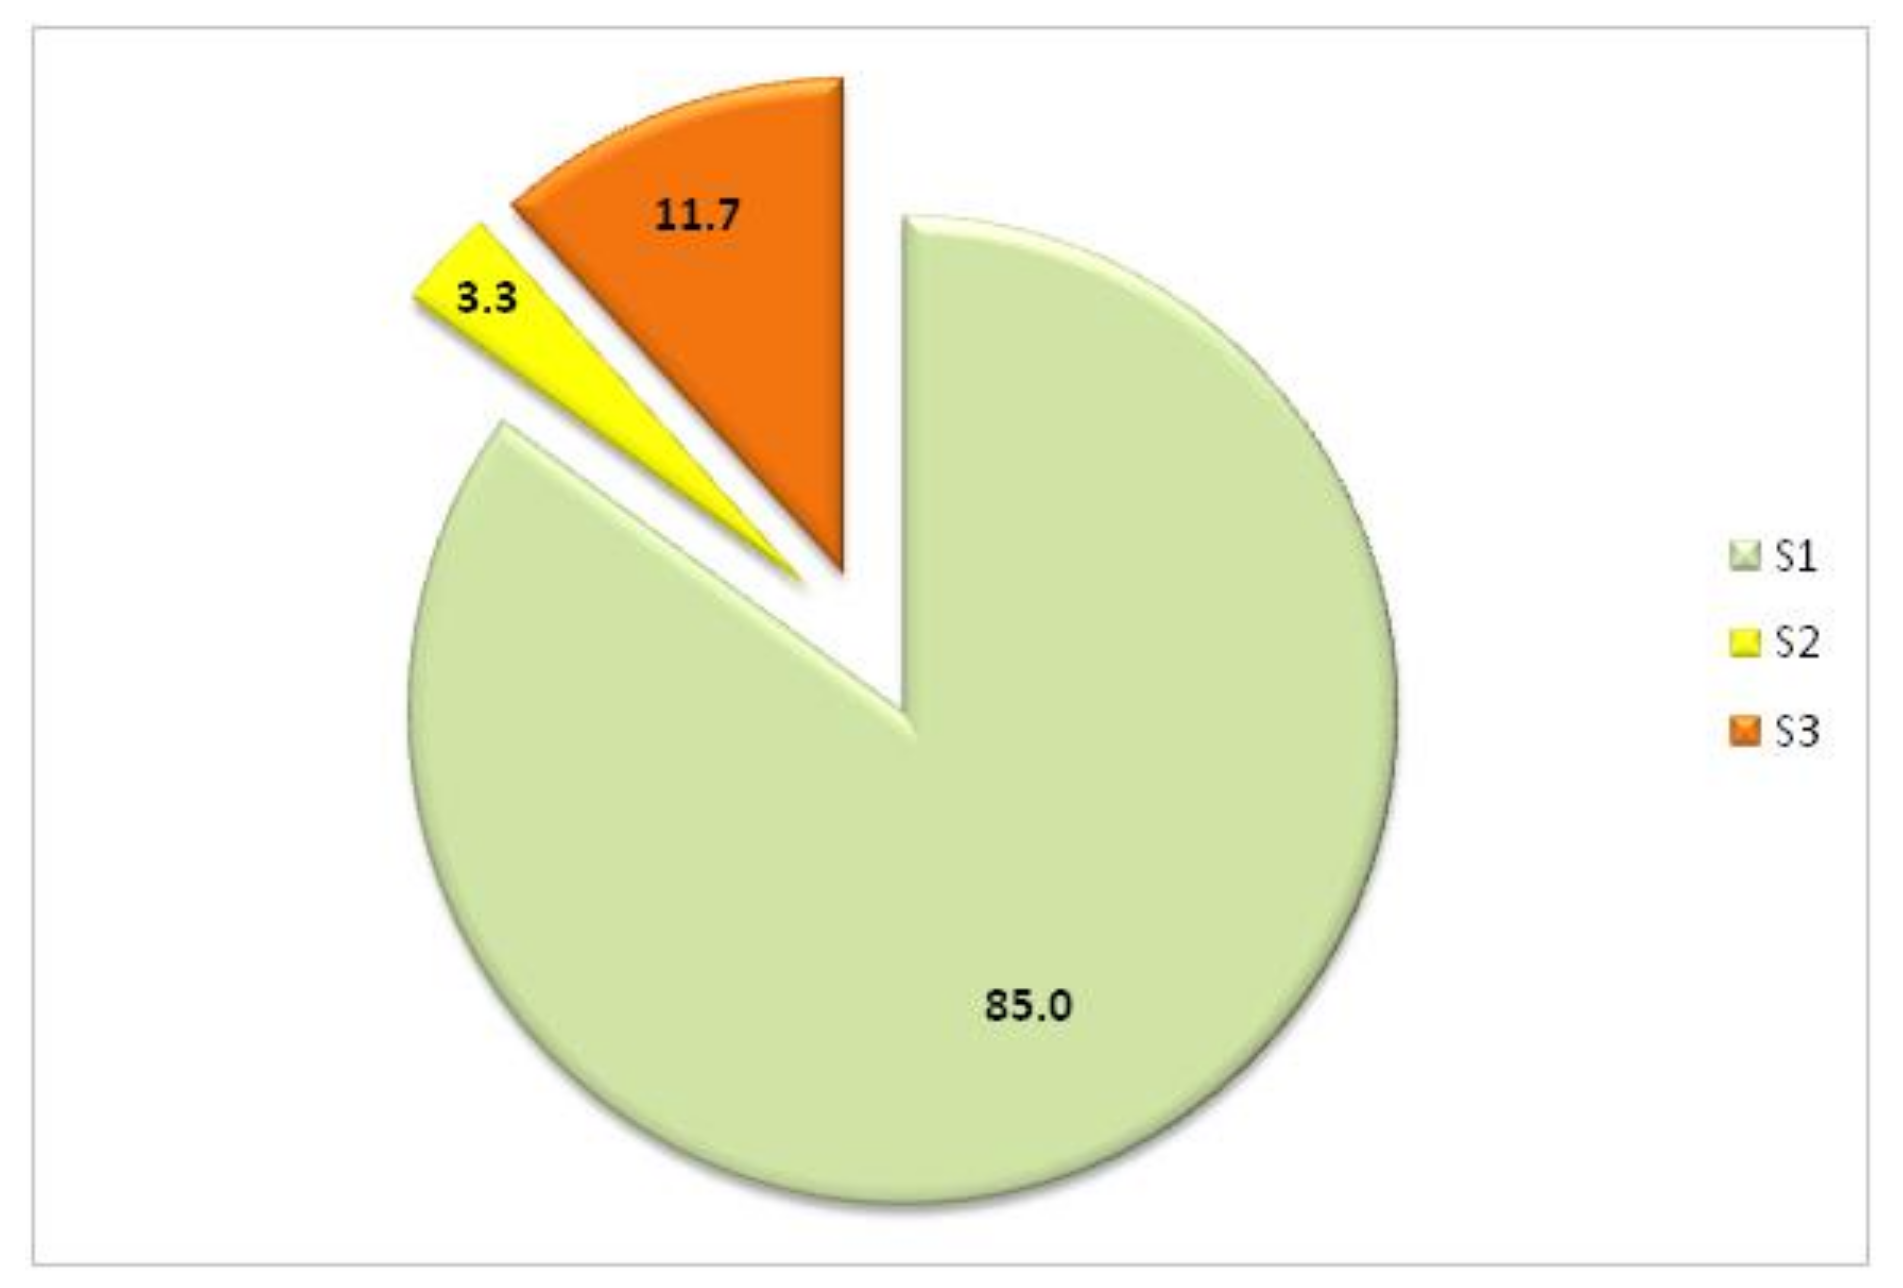
| No. of LU Indices | Impact of LU% | Overall Assessment Class | Phase |
|---|---|---|---|
| 51 | 85.00 | Very high | S1 |
| 2 | 3.33 | High | S2 |
| 7 | 11.67 | Moderate | S3 |
| 60 | 100.00 |
| Intervention Logic | Output | Outcome | Specific Objectives | Impact | |||
|---|---|---|---|---|---|---|---|
| Index/subindex | Indicators | 2002 | 2018 | Alteration/(Relative Ratio %) | LIPC | Validity | |
| Social responsibility | Livelihood | Tractors | 0 | 96 | 96 (>100) | S1 | Statistics data |
| Disc plough | 0 | 96 | 96 (>100) | ||||
| Fuel tanker | 0 | 24 | 24 (>100) | ||||
| Drinking water tanker | 0 | 34 | 34 (>100) | ||||
| Trolley for sanitation | 0 | 24 | 24 (>100) | ||||
| Fishing Boat | 0 | 50 | 50 (>100) | ||||
| Fish production Ton/year | 2 | 1700 | 1698 (>100) | ||||
| Loader | 0 | 2 | 2 (>100) | ||||
| Furry | 0 | 3 | 3 (>100) | ||||
| Bantoon | 0 | 1 | 1 (>100) | Overall Accuracy assessment | |||
| Drinking water supply/day within 20 years | 0 | 346.7 m3/day | 346.7 m3/day (>100) | ||||
| Intervention Logic | Output | Outcome | Specific Objectives | Impact | |||
|---|---|---|---|---|---|---|---|
| Index/subindex | Indicators | 2002 | 2018 | Alteration/(Relative Ratio %) | LIPC | Validity | |
| Social responsibility | Infrastructure and facilities | Houses | 28,394 | 30,000 | 1606 (5.7 | S1 | Statistics data |
| Drinking Water pipes line m3/day | 0 | 342 | 342 (>100) | ||||
| Electricity (subscriber) | 0 | 30,000 | 30,000 (>100) | ||||
| Primary schools | 18 | 100 | 82 (>100) | ||||
| Higher secondary school | 3 | 56 | 53 (>100) | ||||
| Hospital/health center | 2 | 11 | 9 (>100) | ||||
| Mosques | 7 | 23 | 16 (>100) | ||||
| Social services center | 6 | 14 | 8 (>100) | ||||
| Police office/station | 5 | 11 | 6 (>100) | ||||
| Courts | 1 | 2 | 1 (100) | ||||
| Attorney General | 1 | 3 | 2 (>100) | ||||
| School teachers’ houses | 21 | 22 | 1 (4.8) | S2 | |||
| Doctors’ rest house | 0 | 11 | 11 (>100) | S1 | |||
| Security office | 2 | 2 | 0 (<1) | S3 | |||
| Drinking water services | 0 | 4 | 4 (100) | S1 | |||
| Administrative unit | 1 | 2 | 1 (100) | ||||
Publisher’s Note: MDPI stays neutral with regard to jurisdictional claims in published maps and institutional affiliations. |
© 2022 by the authors. Licensee MDPI, Basel, Switzerland. This article is an open access article distributed under the terms and conditions of the Creative Commons Attribution (CC BY) license (https://creativecommons.org/licenses/by/4.0/).
Share and Cite
Shuka, K.A.M.; Ke, W.; Sohail Nazar, M.; Abubakar, G.A.; Shahtahamssebi, A. Impact of Hydrological Infrastructure Projects on Land Use/Cover and Socioeconomic Development in Arid Regions—Evidence from the Upper Atbara and Setit Dam Complex, Kassala, Eastern Sudan. Sustainability 2022, 14, 3422. https://doi.org/10.3390/su14063422
Shuka KAM, Ke W, Sohail Nazar M, Abubakar GA, Shahtahamssebi A. Impact of Hydrological Infrastructure Projects on Land Use/Cover and Socioeconomic Development in Arid Regions—Evidence from the Upper Atbara and Setit Dam Complex, Kassala, Eastern Sudan. Sustainability. 2022; 14(6):3422. https://doi.org/10.3390/su14063422
Chicago/Turabian StyleShuka, Kamal Abdelrahim Mohamed, Wang Ke, Mohammad Sohail Nazar, Ghali Abdullahi Abubakar, and AmirReza Shahtahamssebi. 2022. "Impact of Hydrological Infrastructure Projects on Land Use/Cover and Socioeconomic Development in Arid Regions—Evidence from the Upper Atbara and Setit Dam Complex, Kassala, Eastern Sudan" Sustainability 14, no. 6: 3422. https://doi.org/10.3390/su14063422