1. Introduction
The spread of COVID-19 pandemic throughout the world has led to severe intra- and intercountry travel restrictions. International travel has been restricted or suspended entirely by most of the countries around the world. Because of this, countries that rely heavily on tourism have suffered significantly.
Thailand is a well-known destination for foreign tourists. In 2019, foreign tourists accounted for as much as 1.93 trillion THB (Thai baht) (65 billion USD) or 11.35% of the country’s GDP [
1]. However, since Thailand had implemented modified country lockdown measures in early 2020, the Thai tourism industry has been worsening. The dramatic downturn in tourist arrivals has directly affected tourism supply chains and related sectors to different degrees. In addition, the pandemic has encouraged negative sentiments and perceptions regarding the end of the COVID-19 pandemic, which in turn has led domestic travelers to limit their traveling demand. As a result, Thailand’s tourism industry has struggled immensely, resulting in massive losses to essential stakeholders, particularly its associated production and households.
Strict international travel restrictions are employed to keep the pandemic under control; these measures cannot be considered as long-term solutions to the problem. Suppressing tourism activities have a significant impact on the whole economy, resulting in increased unemployment and the demise of entire businesses. Because of this, on 1 July 2020, Thailand introduced the Phuket Sandbox project, implemented on Phuket province, an island which is a favorite destination for international tourists that had contributed 272.56 billion THB (~8.26 billion USD) for the first half of 2019, representing 6.13% of country’s tourism revenue as reported by the Tourism Authority of Thailand [
2]. Under this initiative, fully vaccinated travelers entering Thailand are not required for mandatory quarantine, but the travelers must stay within the province for at least 14 days. After that, the travelers can travel to other parts of Thailand. This means that the Sandbox plays an important role on being a gateway for traveling to Thailand. Its inauguration is expected to mitigate the economic impact of pandemics on tourism and tourism-related activities, and used as a guideline to foresee the impacts of relaxing the restrictions before extending it to other tourism parts of the country.
The Thai government must assess the benefits of this initiative in order to make an effective decision whether to continue or discontinue this project. This need is addressed in academic literature [
3,
4,
5,
6,
7]. Most authors advise that a timely assessment of the relaxation of the lockdown restrictions would support a policymaker to balance negative and positive impacts to the society effectively, resulting in introducing effective recovery policy. According to a case study conducted in Saudi Arabia, easing lockdown measures would result in a cost savings of 378,000 USD per life, suggesting that countries must evaluate the optimal timing and strategic planning for releasing such measures in order to safely return to normal life with minimal loss of life and economic impact, taking into account their economic and health system capacity [
4]. Moreover, an assessment is also critical in ensuring a successful and healthy rehabilitation of the tourism supply chain during the recovery stage, sustaining tourism economic development [
8]. Additionally, an assessment of the relaxation could be used as an opportunity for the government to make amendments for improving the current tourism systems, establishing long-term policies to make tourism more resilient in the face of future pandemics and other disasters, along with help in buttressing other related sectors [
9,
10,
11,
12].
While global countries have been seeking effective policy in the aftermath of the pandemic, this report assesses how relaxing travel restrictions has supported sector/industry recovery and has delivered a benefit to society by applying to Thailand, where the tourism industry is driven for economic development. The assessment is expected to serve as a guideline for other countries/regions, whose economies depend on the tourism industry, for predicting the impact of easing restrictions, and for planning long-term tourism development. In the discussion, we also attempt to incorporate the assessment’s conclusions in order to fulfil the research gap on sustainable tourism development by establishing a framework for sustaining the tourism industry in post-COVID-19. This would assist policymakers to make an effective decision on providing necessary assistance to affected stakeholders and to draw an effective plan of sustainable tourism development, resulting in effective short- and long-term use of the national budget.
The rest of the study is divided into six sections. Initially, the study provides a literature review on impact assessment. After that, methodology and I–O analytical framework to investigate the impact are presented, followed by data and policy simulation, and key findings. Then, the study discussion is addressed, followed by suggestions for how to proceed in going forward and how Thailand and other countries can strengthen recovery measures to mitigate the impacts from the pandemic.
2. Literature Review
To analyze the impact of easing the restrictions, it is necessary to assess not only the tourism industry but also its interconnected sectors. As per approaches for impact assessment, they are normally referred to as the partial equilibrium approach and the general equilibrium approach. The partial equilibrium approach is a method that only a particular market/stakeholders is examined while others are fixed during the analysis [
13]. In fact, impact assessment of tourism activities could not be split from other sectors/industries in an economy [
14]. This means that easing the restrictions must be involved with the entire economy. When starting the implementation, it affects a wide-range economy since sectors/stakeholders adjust their productions/activities compatible with their capacity. Therefore, visualizing the effect on all sectors during easing the restriction is likely to be the weakness of partial equilibrium analysis. In contrast, the general equilibrium approach allows all markets in the economy to adapt themselves according to their capacity concurrently. With this approach, it demonstrates the mechanism of ecosystem adjustment when market demand and supply is an imbalance.
The circular flows of economy under general equilibrium are fundamentally interacted by five economic agents [
15]:
Household that plays as a seller of production factors and a consumer of market commodities,
Capital Market where all capital for investment is gathered,
Business that plays as a buyer of production factors and a producer of commodities in the market,
Government that plays as a public consumer, and
Rest of World that plays as foreign consumer. Under this interaction, all of the activities among agents have to confirm that their total expense equals their total revenue and follow economic theories such as micro- and macroeconomics theory, international trade theory, market-clearing theory, or investment theory [
15].
One of the notable models in the general equilibrium approach is the input–output (I–O) analytical framework introduced by Leontief [
16]. The framework is proposed as a simple instrument to calculate the impact of interactions between production sectors/industries in society. Its calculation method is based on an accounting framework in which total seller receipts must equal total buyer expenditures. The price of goods and services is assumed to be constant, which simplifies the model calculation linearly in addition to allowing the primary effect of using intermediate input to be described in a quick estimation. From the past to the present, numerous studies have adopted the basis of the I–O model to evaluate the primary impacts of policy implementation, e.g., [
17,
18,
19,
20,
21,
22,
23,
24]. Moreover, during the period of the COVID-19 pandemic, certain scholars have favorably adopted the I–O framework to investigate economic impacts, mainly to investigate the effect and loss on society, e.g., [
25,
26,
27,
28,
29,
30,
31,
32,
33]. These studies positively support that the I–O model is more advantageous for investigating initial impacts of the pandemic, because the impact is linked with various stakeholders in the society. In light of this remark, it is logical to conclude that the I–O analytical framework is suitable for assessing primary effects on the entire economy, suggesting that its use for assessing the economic impact of easing COVID-19’s restrictions is reasonable.
3. Methods
Upon considering the I–O framework, we conceptualized the transmission of implementing the restrictions to economic activity according to the concept of the general equilibrium approach, presented in
Figure 1. When the country introduces restrictions for travel mobility, it will have enormous damage on the tourism industry by slumping demand for tourism activities. This impact will link to all economic agents associated with the tourism industry in both direct and indirect ways, such as tourism suppliers losing their revenue, the government losing taxation, and households losing their income. While the tourism industry modifies its production, it will then push its suppliers or buyers to do the same. Hence, the total impact from this introduction can be assessed by examining those relationships of consumption and production activities linking to the tourism industry.
Moving to the calculation method, let
represent product
,
be expressed as technical input of sector
in order to produce product
, and
is final consumption of product
. The relationship of this activity is denoted by the following equations.
In notable matrix form, Equation (1) can be turned into Equation (2):
where
is a matrix of product output
,
is a matrix of coefficient of technical input
, and
is a matrix of final demand of product output
.
Accordingly, Equation (2) can be transformed into Equation (3) as follows:
, known as the Leontief inverse matrix, is used for analyzing the relationships among production sectors. Each estimated element in the matrix is defined as a multiplier, and its purpose is to quantify the level of consumption needed within production sectors. These multipliers can be categorized into two kinds of effects: backward linkage (BL) and forward linkage (FL). In terms of BL, given that
is a production sector, when sector
increases its output, the sector as “a purchaser” has to supply more intermediate input in order to produce the output
. This relationship is therefore noted as the effect on the “upstream sector”. FL, on the other hand, is a term that refers to the effect on sectors that have to purchase output
from sector
when sector
increases its production output. Buyers are forced to adjust their consumption accordingly. This can be noted as an effect on the “downstream sector”.
Establish that
, BL, and FL can be calculated by the following equations:
When final demand for consuming output
from sector
changes, the output multiplier
is to quantify the effect on output across the economy, as given in the following equation:
In addition, the Leontief inverse matrix can be applied to analyze other economic factors, particularly in those effect related to household income by constructing income multipliers
. The multipliers are converted from Leontief inverse matrix by using the labor-input coefficient, which can be calculated from monetary side (wages earned per unit of output) or physical side (person-years, or some such measure, per unit of output) [
15]. Regarding the accessibility of data, we calculated the labor-input coefficient by using income from employment or compensation of employees. The formula for the income multiplier is denoted in Equation (7):
where
is the ratio of total household income from selling input factor to sector
in order to produce output
. This multiplier shows the impact of a change in production output from sector
, which is as a result from the changes in final demand of product
, affecting income to the households working in sector
.
In the context of this study, tourism is expected to have a direct impact from COVID-19 restriction implementation. Therefore, to investigate the impact of an economic loss in an economy, the study exaggerates the multipliers obtained from Equations (6) and (7) into tourism multipliers, as follows:
and
where
is tourism industry,
are elements of the matrix
and
. Hence, the loss can be calculated by incorporating Equations (8) and (9) into Equation (3), as follows:
and
where
is loss in production as defined as economic loss,
is loss in household income, and
is a reduction in final demand caused by the tourism crackdown. Both Equations (10) and (11) state that the impact of loss depends on the degree of relationship to the tourism industry, as indicated by the tourism output and income multipliers.
4. Data and Policy Simulation
We developed an input–output (I–O) table for our analysis from the original tourism I–O table completed by the Office of the Permanent Secretary Ministry of Tourism and Sports [
34]. Production sectors are reclassified from 86 sectors, which are reported in the original I–O table, into 20 key main sectors by considering its characteristics of production. This aggregation is beneficial to depict a clear trend of effects, particularly in the main sectors of an economy. The I–O table developed defines the tourism industry as the activities that encompass a variety of tourism activities, such as recreational activities and entertainment, lodging services, vehicle rental for travel, travel agencies, art and museum activities, and personal tourism services.
To foresee the impact of the restrictions on the tourism industry, policy simulations have to be identified. In this context, the study highlights the economic impact of COVID-19 with respect to COVID-19 restrictions, based on 2021, as follows.
As noted, in 2020, the COVID-19 outbreak spread worldwide. The effect of the outbreak pushed countries around the world to start implementing national partial/full lockdown measures. As a result, international travel was mostly suspended. Hence, to estimate the economic impact from implementing the COVID-19 restrictions, adopting this situation is used as a benchmark scenario. We used the impact on revenue reduction from international tourists, amounting to 1.93 trillion THB (~58.5 billion USD), which was revenue generated from international travelers in 2019 [
1], for representing loss from implementing the restrictions of 2021.
We applied the relaxation of international traveler mobility to the Phuket Sandbox project. Implementing the Phuket Sandbox project is expected to stimulate tourism economies and distribute to other related sectors in the economy by allowing international tourists to visit Phuket province. This anticipates that Thailand could earn revenue from international travelers by relaxing the restriction. Under these anticipations, the estimated loss from international travel is anticipated to be less than in Scenario 1 due to revenue generated by those international tourists who decide to visit during this time. As reported by the Tourism Authority of Thailand (TAT), the revenue for the period of 1–31 July 2021 is estimated to amount to 829 million THB (~25.1 million USD) [
35]. When comparing with the benchmark scenario, we estimated for all of 2021 that the Phuket Sandbox could increase revenue as much as 5 billion THB or ~151.6 million USD (six-month estimation), or could reduce economic loss to 1.88 trillion THB (~57.01 billion USD).
We introduced this scenario to illustrate a positive outcome from implementing the Phuket Sandbox, which could apply to other areas, parts, or zones in Thailand. As a matter of fact, Thailand has planned to extend the sandbox project to several areas: Krabi province, Koh Samui Island, Koh Tao, for examples [
36]. Therefore, this scenario is denoted as a prospect scenario for the Thai government. Accordingly, the study assumes doubled increasing revenue over the Scenario 2, amounting to 10 billion THB (~303.3 million USD), or it can improve the tourism loss, amounting to 1.78 trillion THB or ~53.98 billion USD loss in the tourism industry (5 billion THB for Phuket Sandbox plus 10 billion THB for its extensions).
Again, the three scenarios are used for projecting the impact of such relaxation and extending the sandbox projects. The amount can be varied from this assumption for further investigation.
5. Results
Empirical results calculated from the input–output multipliers are summarized in
Table 1. In an overview of the Thai economic structure, the key findings report that the metallic, nonmetallic, and machine industry plays the most important role as the country’s buyer (backward linkage: BL), followed by wholesales and retails; rubber, chemical, and petroleum industry; and tourism industry, respectively. Meanwhile, a major seller (forward linkage: FL) in the Thai economy is the wholesales and retails sector, followed by mining and quarrying, paper and printing industry, communication, and public utilities, respectively.
It is important to consider the tourism industry, observing that backward linkage ranks higher than forward linkage. This implies that the Thai tourism industry has currently positioned itself as a buyer rather than a seller in the economy. When the tourism industry’s final consumption is affected by an external shock, such as COVID-19, this position has a greater influence on sectors that sell their products or inputs to the tourism industry, in contrast to sectors that consume tourism goods or services.
Taking the tourism multipliers into consideration, it is observed that the public utility sector has a strong relationship with the tourism industry. This means that most impacts appear in this sector when external shocks attack the tourism industry. As activities related to the tourism industry, specifically activities in hotels and accommodation requiring public utilities such as electricity, water supply, and water management to service its customers, when the demands from tourism decrease, this consequently reduces the demands on public utilities. It implies that public utility is a vulnerable sector to the tourism crackdown, having enormous impacts from the pandemic [
37,
38]. Apart from this, it is essential to consider impacts of tourism income multiplier effects, having the most impacts on the agricultural sector. This sector is well known as a labor-intensive sector comprising the largest labor force in the economy. This indicates that changes in tourism demand for production and consumption significantly affect the livelihood of farmers. In the worst case of COVID-19, their reduction in revenue from this pandemic would cause them to suffer the most.
Next, we moved our focus to policy simulations. Considering Scenario 1, as indicated in
Table 2, Thailand will lose revenue from the implementation of the restrictions both directly and indirectly, by as much as 4.78 trillion THB (~144.97 billion USD). For the tourism industry, a sharp decline in international travel revenue of 1.93 trillion THB (~58.5 billion USD) would result in a decline in tourism’s production output—approximately 1.96 trillion THB (~59.4 billion USD). Meanwhile, taking into account subsequent sectors, the most damaged sector is public utility, which loses revenue resulting from decreases in the tourism industry’s activities by as much as 375 billion THB (~11.4 billion USD), while the agricultural, food manufacturing, communication, and banking and insurance sectors lose 348 (~10.5), 313 (~9.5), 263 (~8.0), and 227 (~6.9) billion THB (million USD), respectively.
Moreover, key findings from a change in household income indicate that national household would lose as much as 1.50 trillion THB (45.4 billion USD) in income. The agricultural sector is the most damaged sector affected by the implementation of international travel restriction, amounting to the loss of 172 billion THB (~5.2 billion USD) of household income, followed by banking and insurance, and the communication sectors, with 121 (~3.7) and 92 (~2.8) billion THB (million USD), respectively.
When the country starts relaxing the restrictions and quarantines that affect tourism in some areas, in accordance to Scenario 2, the degree of impact would result in a total reduction of 4.66 trillion THB (~142.24 billion USD), or, in other words, give a boost of approximately 123.95 billion THB (~3.73 billion USD) to the Thai economy in comparison to Scenario 1. Meanwhile, income reduction would improve by 38.85 billion THB (~1.17 billion USD) in comparison to a nonrelaxing scenario. However, if Thailand could well achieve in extending the sandbox project to other areas, supposing double-increased tourism revenue from the Phuket Sandbox, the recovery amount would be increased to 371 billion THB (~11.26 billion USD) and 116.54 billion THB (~3.52 billion USD) for production and household income, respectively.
6. Discussion
The future of global economic growth is very uncertain since it seems so wholly dependent on how soon life can return to normal. Measures to control COVID-19 influence various production sectors of the economy, particularly concerning implementation of measures that limit the mobility of people both domestically and internationally. In the tourism industry, such measures constrain the demand for global consumption and production for traveling, ultimately damaging tourism economic activity.
The damages are also transmitted to other sectors or industries with a certain degree through the tourism production multipliers, having a major impact on those sectors with strong tourism multipliers. However, once the country relaxes mobility restrictions, such multipliers will reversely accelerate the industry’s economic recovery. According to our study, the fruitful discussions regarding loss recovery and sustainable tourism development are highlighted with two aspects, as described in the following sections.
6.1. Input–Output Structures for Sustaining Tourism Development
Empirical findings in the context of Thailand addressed that an easing of restrictions would have much impact only in particular sectors, leaving some important sectors behind.
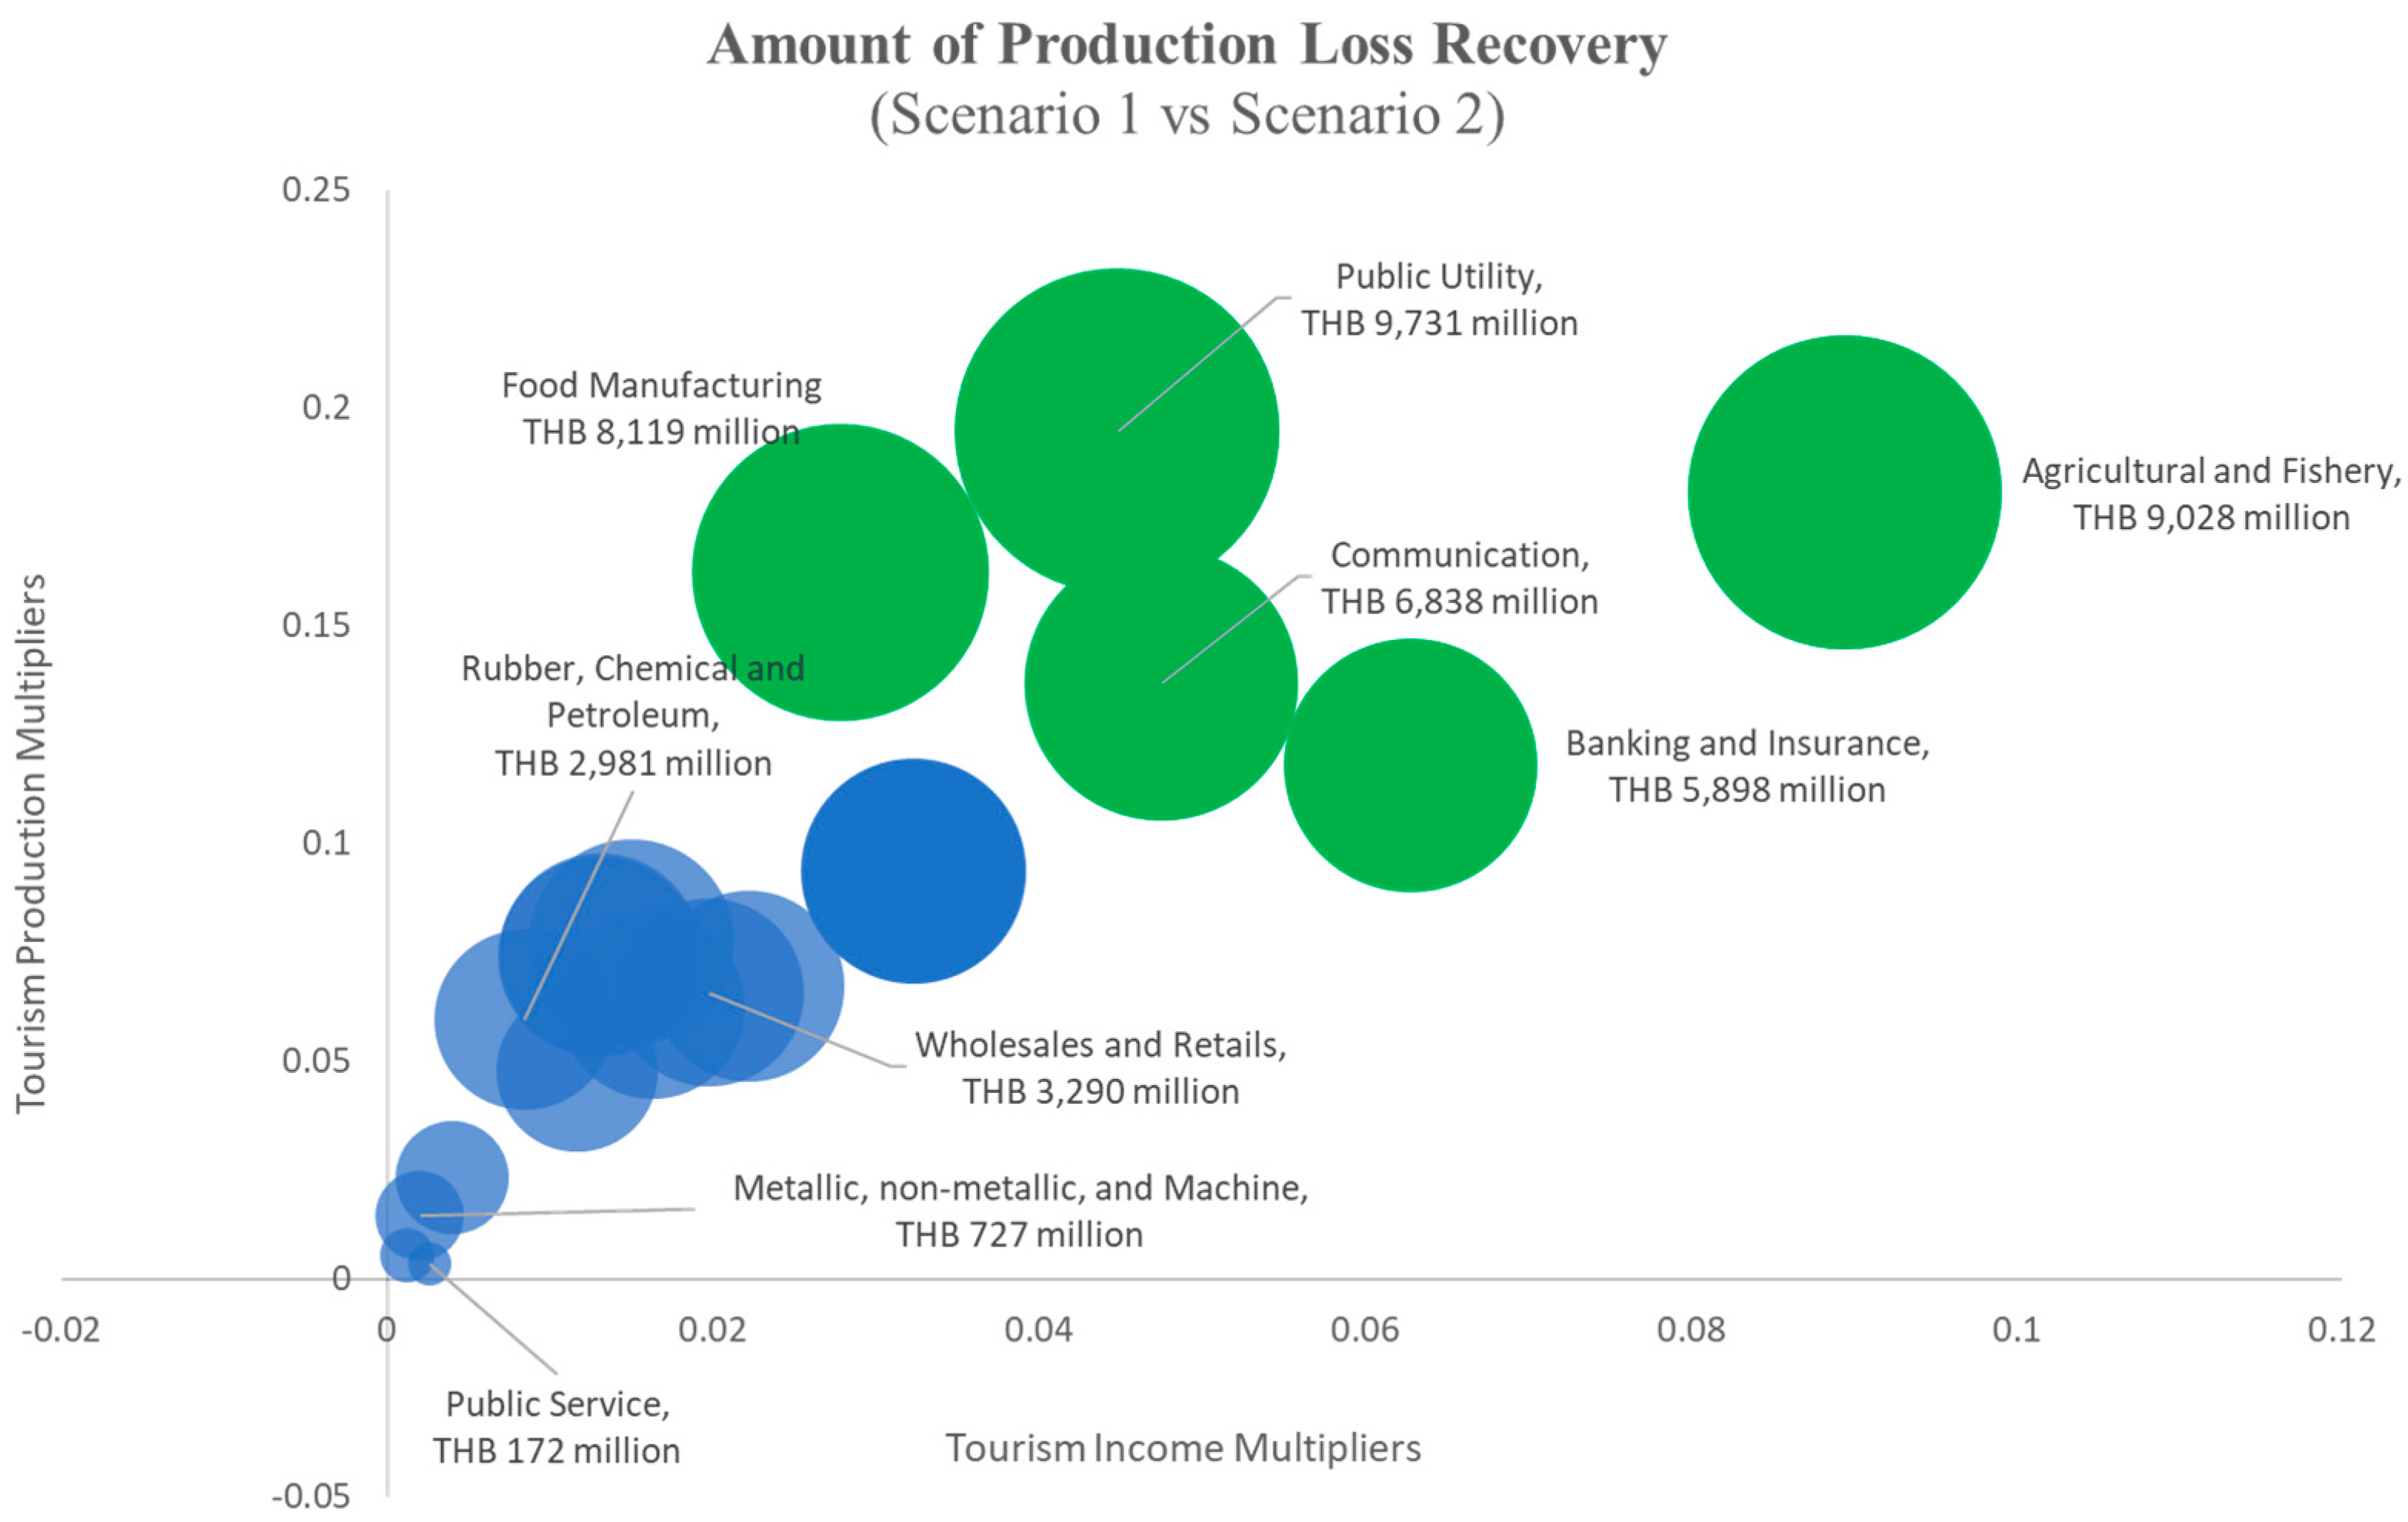
Figure 2 illustrates the relationship between the tourism multipliers and recovery loss (scenario 2) from easing the travel restrictions. It was observed that the amount of loss recovery is determined by the tourism multipliers, presenting the top five recovering sectors, namely, public utility, agricultural and fishery, food manufacturing, communication, and banking and insurance, respectively.
In the case of Thailand, we found that the top five affected industries/sectors likely relied excessively on tourism, as measured by their large tourism output and income multipliers in comparison to other sectors/industries. This was a result of massive recovery losses of 9.731 billion THB in the public utility sector and 9.028 billion, 8.119 billion, 6.838 billion, and 5.898 billion THB in the agriculture and fisheries, food manufacturing, communication, and banking and insurance sectors, respectively. In comparison to certain prospective tourism-supporting industries, such as wholesale and retail (in order to stimulate visitor spending), they experienced less benefit from the eased restrictions.
We emphasized that this circumstance had a crucial role in Thailand’s economy exposure to a future serious economic crisis. Imbalance in the input–output structure results in a lack of risk diversification in the economy. As a consequence, only certain industries bear the brunt of the pandemic’s massive damage. Several tourism scholars have been discussing this issue during the pandemic. Their conclusion indicated the economy with pooling tourism actors has the potential to make a country more vulnerable to tourism crises [
10,
12]. As evidenced by Cave and Dredge [
12], their key findings indicated that diverse economic practices provide a pathway to more resilient and regenerative practices in tourism, which are critical for the post-COVID-19 recovery phase. Therefore, to ensure sustainable tourist development, there is a need to balance its excessive reliance on tourism activities. By diversifying damage risk, this would enhance the ability of production sectors to quickly recover from future negative tourism shocks.
6.2. Policy Implication
One of the growing trends in tourism industry is the practice and integration of sustainability. Evidence from Thailand indicates that tourism sustainability requires a suitable structure of input–output functions for entire production sectors. Highlighting from the Phuket Sandbox project, local news reported that the Sandbox’s benefits are being expected to serve exclusively corporate chain hotels or major stakeholders. Whereas the overall economy, particularly in Phuket, has improved, such implementation may leave other industries or small business behind [
39]. This confirms that tourism input–output structure is a necessary condition for long-term tourism development.
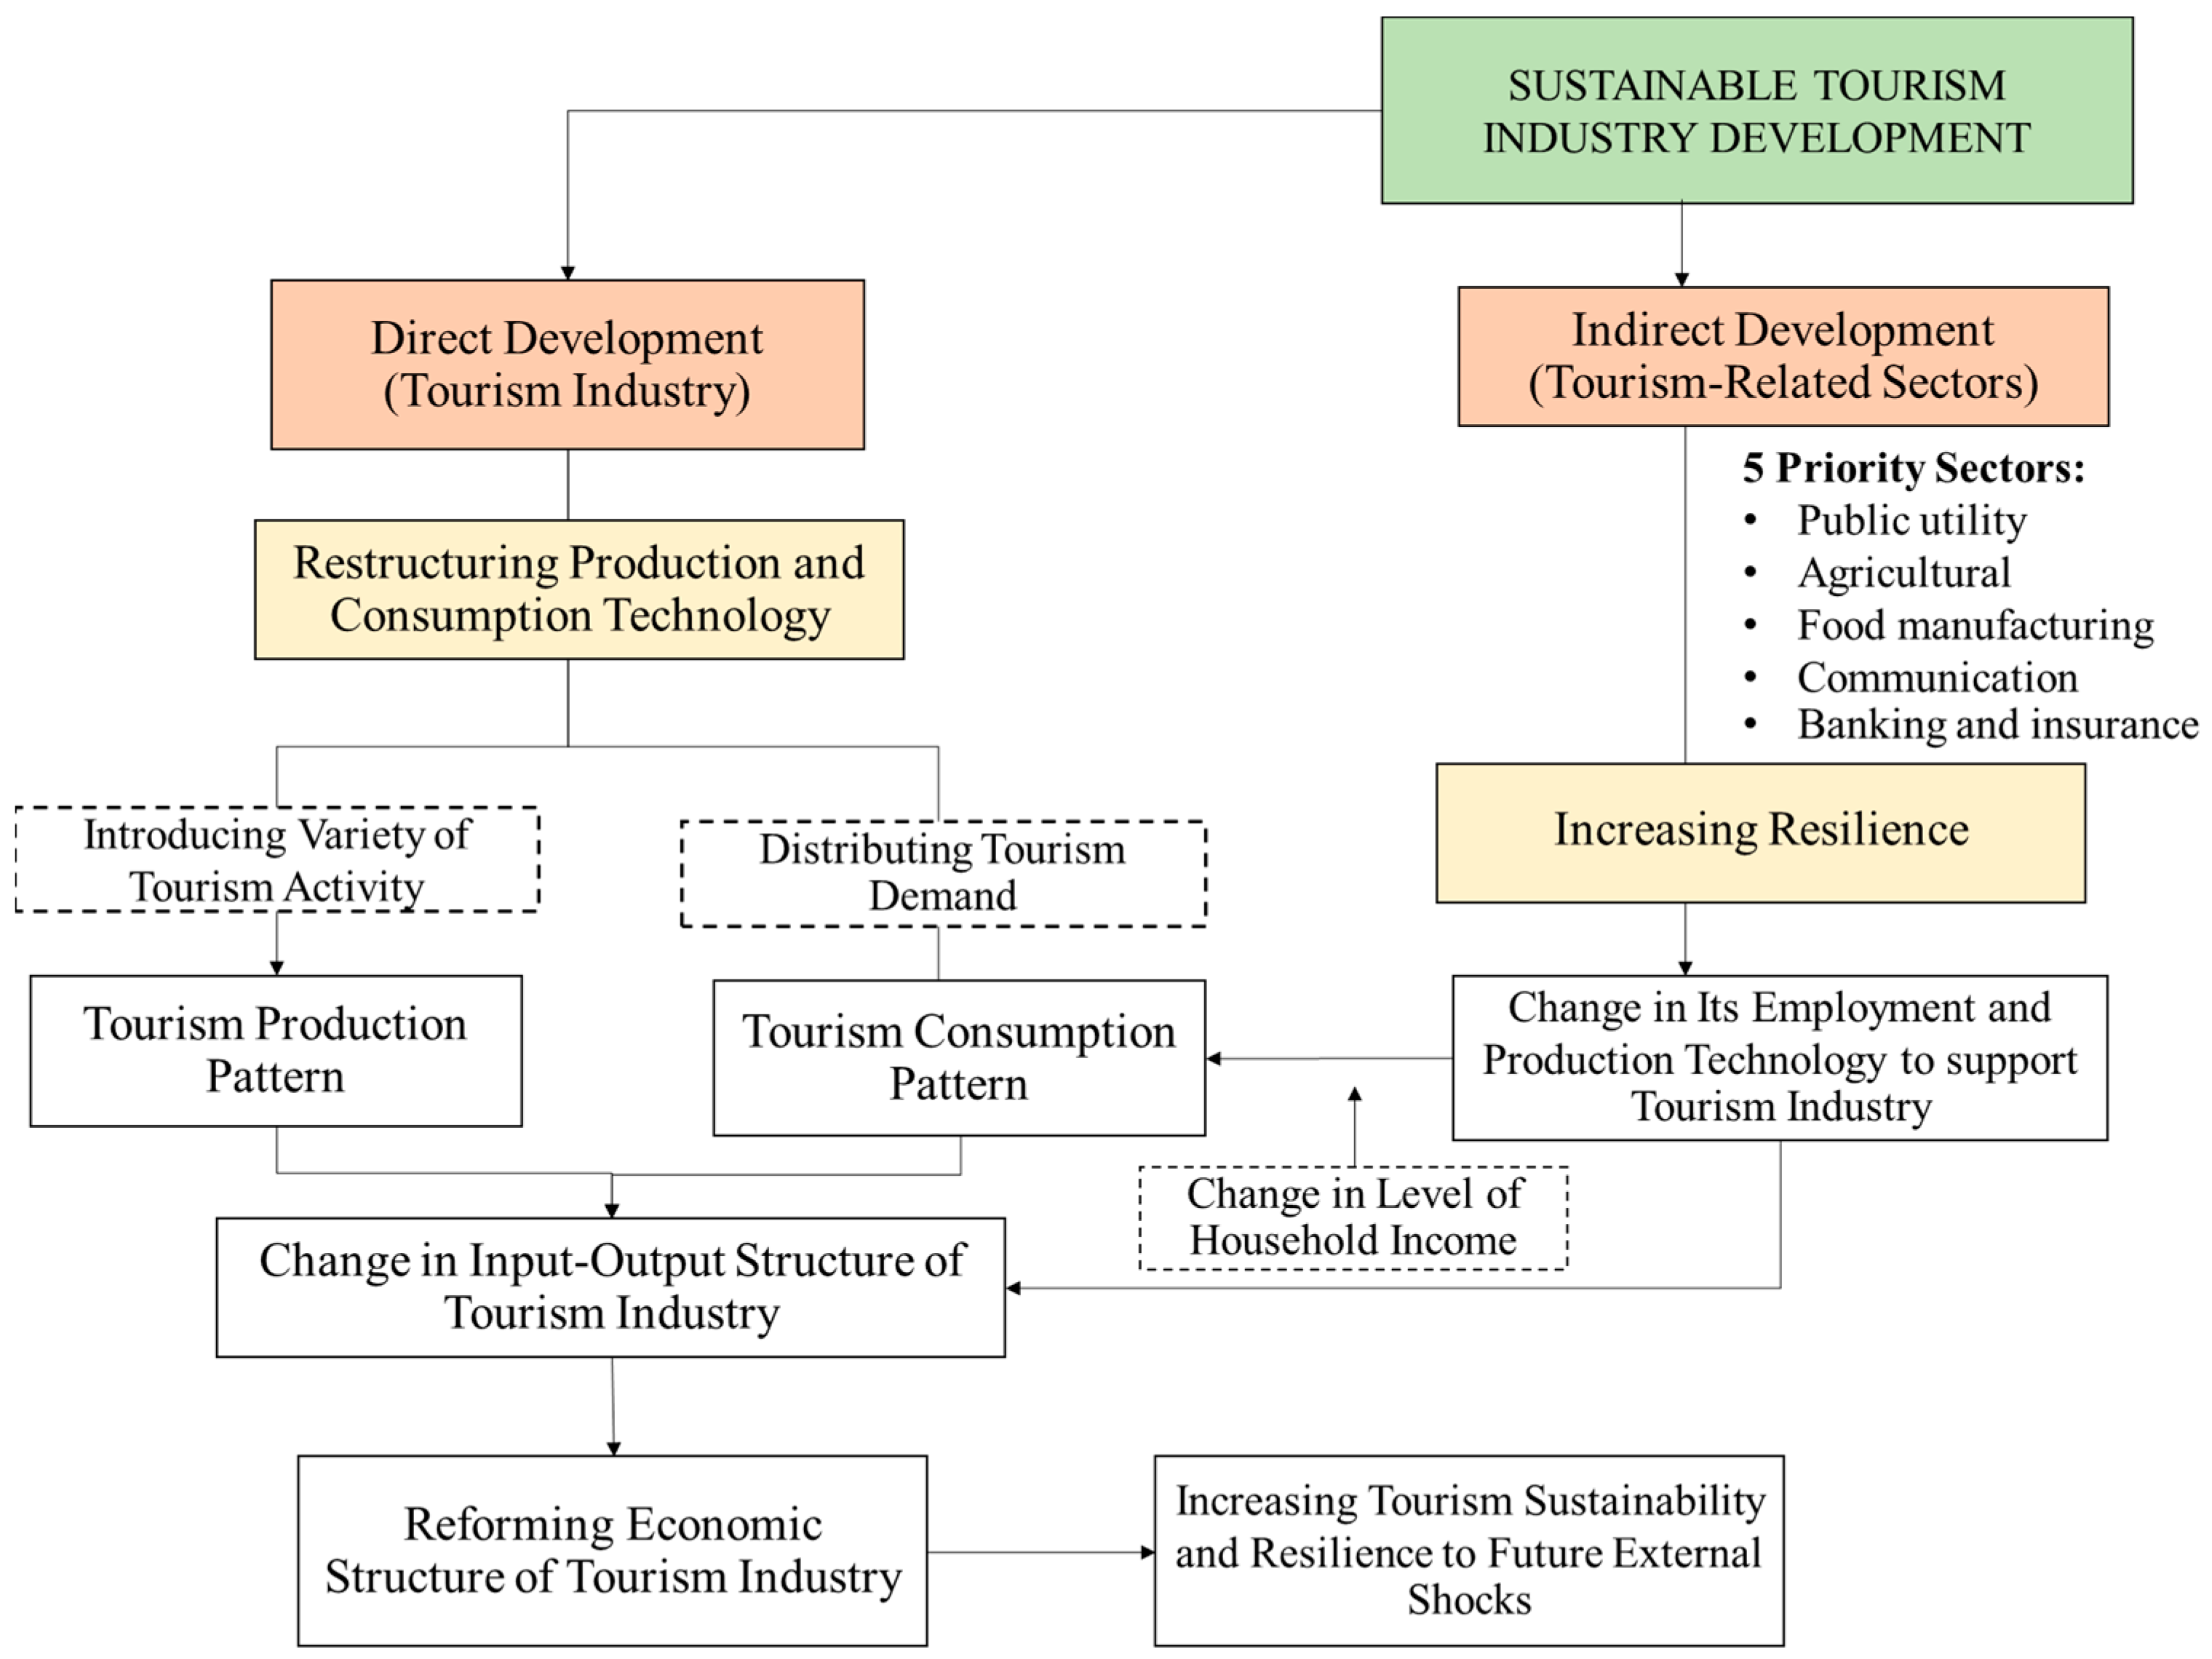
To support this initiative, we developed a policy implication for enhancing tourism sustainability by incorporating our key findings, as presented in
Figure 3.
To achieve tourism sustainability, we identified two components that should be incorporated into the planning process for sustainable development of the tourism industry in the aftermath of COVID-19. Direct and indirect developments are addressed.
According to direct development, this development is proposed to restructure production and consumption patterns within tourism itself, and expected to increase risk diversification among tourism producers. In terms of restructuring production pattern, national tourism development policies should promote diversifying tourism activities, with a particular emphasis on fostering high-value-added potential tourism activities. This is to incentivize tourism producers to enhance and develop their production technology by rearranging the input–output factors involved in the production process of tourism goods and services. As a result, demand on other sectors from tourism producers will be reformed, pushing a restructuring process of tourism‘s input–output activity efficiently. Meanwhile, tourism consumers are involved in the process of reshaping their consumption pattern. We emphasize that the development should encourage tourism consumers to diverse their consumption to various tourism goods and services. Effective tourism marketing and promotion strategies need to be addressed. This would expedite and reshape tourism demand.
In another perspective, indirect development, this development intends to increase the resilience of tourism-related sectors/industries by reducing their reliance on tourism activities. Effective policy to promote production and consumption for producing their goods and services to other sectors in an economy has to be undertaken. This will increase resilience of the entire tourism supply chain; in return, the tourism-related sectors will reduce their vulnerability to future tourism shocks. Flagship industries and their characteristics must be considered during the planning process. Regarding evidence from our study, in the context of Thailand, we prioritized and considered five priority sectors, including public utility, agriculture, food manufacturing, communication, and banking and insurance. These sectors were selected based on the current tourism input–output structure, and are likely at high risk to future tourism shock. Based on our multipliers calculation indicated in
Table 1, a seller characteristics such as the public utility sector (FL > BL), the policy development should focus on simulating the “output” perspective. Supporting them to distribute their output products to meet various customers should be undertaken. For buyers, such as food manufacturing (BL > FL), the development policy should encourage utilization of the “input”. Enhancing their production technology, utilized apart from traditional input, should be considered. In total impact of the indirect development, a change in consumption and production of tourism-related sectors will have a result on household income, leading to a change in tourism final consumption.
From both perspectives, this is expected to restructure the tourism production and consumption pattern effectively, which would have a lasting result on increasing resilience and suitability to the tourism industry and tourism supply chain.
7. Conclusions
The tourism industry is a key contributor in generating economic growth and national income in Thailand, a country that experiences tourism demand and needs to give serious attention to sustainable development of tourism and tourism-related sectors.
According to our empirical analysis, in the event of prolonged full mobility restrictions of international tourists, a yearly loss of revenue in the tourism industry would cost a loss of country production up to 4.78 trillion THB (~144.97 billion USD), and up to 1.50 trillion THB (~45.4 billion USD) for loss of household income. However, when international travel limitations were relaxed, production and household damage would fall to 4.66 trillion (~142.24 billion USD) and 1.46 trillion THB (~44.7 billion USD), respectively. Furthermore, if Thailand could expand the sandbox project incrementally, the loss of production and household income would be reduced to 4.41 trillion THB (~133.75 billion USD) and 1.38 trillion THB (~418.54 billion USD), respectively. For individual sectors, in terms of production, the major effects on production activities would exist in the public utility, agriculture, and food manufacturing sectors. From the perspective of household income, those in the agricultural sector would experience the greatest impact.
In Thailand, it is now acknowledged that the prepandemic input–output production and consumption of the tourism industry is deeply flawed, as evidenced by a significant amount of lost revenue concentrated in a particular sector. In the long term, the government is strongly recommended to reform the structure of tourism input–output functions, diversifying tourism production and consumption into various production sectors. The extent to which an industry is linked to the tourism industry, as evidenced by the multipliers addressed in this study, could be used and incorporated to set in motion comprehensive tourism development. Concerning other countries where tourism drives economic development, vulnerable sectors include public utility, agriculture, food manufacturing, communication, and the banking industry, based on our findings. A long-term plan for tourism development must emphasize the resilience of tourism and the tourism supply chain, which requires an appropriate input–output structure for the production of tourism goods and services. As a result, government intervention is crucial in facilitating technological production during the transitional period of the restructuring process.


