Article

Electric Vehicles Aggregation for Frequency Control of Microgrid under Various Operation Conditions Using an Optimal Coordinated Strategy

1
Department of Electrical Engineering, University of Azad Jammu and Kashmir, Muzaffarabad 13100, AJK, Pakistan
2
College of Energy and Electrical Engineering, Hohai University, Nanjing 211100, China
3
State Key Laboratory of Alternate Electrical Power System with Renewable Energy Source, North China Electric Power University, Beijing 102206, China
4
Department of Electrical Engineering, College of Engineering, Jouf University, Sakaka 72388, Saudi Arabia
5
Department of Electrical Engineering, Faculty of Engineering, Aswan University, Aswan 81542, Egypt
*
Author to whom correspondence should be addressed.
Sustainability 2022, 14(5), 3108; https://doi.org/10.3390/su14053108
Submission received: 6 February 2022 / Revised: 3 March 2022 / Accepted: 4 March 2022 / Published: 7 March 2022
(This article belongs to the Section Resources and Sustainable Utilization)

Abstract

:
This paper presents a novel optimal coordinated strategy for frequency regulation (FR) through electric vehicles (EVs) under variable power system operation states (PSOSs). The methodology ensures a secure and economical operation of the power system through the coordination of the frequency regulation, the power of the electric vehicles and generators with multiple optimization objectives. In the normal state of operation of the power system, the battery degradation cost is taken into account and accordingly the minimum FR cost is utilized as an objective. On the other hand, for abnormal operation, the optimization objective considers the minimum frequency restoration duration. Different scenarios have been investigated to validate the proposed method. The simulation results confirm the usefulness and superior performance of the proposed optimized coordinated control strategy.

1. Introduction

The anticipated carbon dioxide (CO2) reduction required by world environmental organizations necessitates the mainstreaming of renewable energy generation [1]. The future renewable energy power addition to power grids will subject the electricity systems to massive challenges further compounded by the intermittent and unpredictable nature of these resources, resulting in stress on the grids currently run by conventional FR techniques [2,3]. In vehicle-to-grid (V2G) technology, electric vehicles (EVs) are analogous to energy storage devices capable of charging and discharging to/from power grids [4]. The vehicle-to-grid power in USA, Italy UK, Germany, and other developed countries has a potential of 6.8 to 10 times the national electricity demand of these countries in the future [5]. The projected increase in EVs will provide a precious opportunity for the implementation of novel FR systems. Recently, the number of EVs in the US has already surpassed 1 million [6,7].
EVs can potentially participate in FR plans in three different orientations: In the first method, localized decision making is implemented where every charger configures the charge/discharge power on local information, for instance load fluctuation, EV arrival time, and local frequency of the area [8,9]. In the second configuration, FR signals are sent based on the operating voltage and power loss to the aggregators, which send them accordingly to the control center in a decentralized manner [10,11]. The third way commonly employed for FR is a centralized decision mechanism, where the control center controls the chargers through a communication system [12,13].
The participation of EVs in FR is motivated by several objectives including the reduction of frequency deviation (FD), the satisfaction of EV owners, and an improvement in FR revenue [14,15,16]. Frequency deviation (FD) reduction involves a coordinated control method for differing FR resources and is reported to have better performance [17,18]. This is owing to the efficient utilization of complementarity of varying FR resources by these strategies, leading to enhanced FR revenues when power system operation is safe enough. The charge/discharge of the EVs to/from grid can be optimized as per the high/low of electricity price [19,20,21]. FR cost reduction has also been found to improve FR revenue through factors such as battery degradation reduction [22,23]. The satisfaction of EV owners should also be ensured through the maintenance of state of charge (SOC) at maximum possible limits [24,25].
Five states of power system operation states (PSOSs) can be found in literature as per the security levels [26,27], and the objectives of optimization usually stem from these PSOS [28,29,30]. Depending on the optimization, the FR resource is changed to accommodate the complementarity of some resource characteristics. For instance, whereas the thermal power plants, or hydroelectric generators can only reach the level of seconds, the EVs can provide a millisecond’s level of control. This greater control usually comes at a higher cost of FR. Previous studies have demonstrated different response priorities in FR for EV participation at different PSOSs [31], however the optimal model was not determined. We propose and address an optimization technique in this research that optimizes the cost of charging and discharging EVs while enabling the frequency regulation of a microgrid. When the power system network is generally safe, the frequency deviation is regulated within a narrow range; nevertheless, only the normal state of power system operation is regarded as relatively safe. As a result, this study only considers the normal condition to be ‘normal,’ while the other four states are considered ‘abnormal.’ The proposed particle swarm optimization (PSO)-based fuzzy logic control (FLC) scheme for determining the required frequency regulation performance of a microgrid integrated with renewable energy sources (RES), nonrenewable energy sources, and prosumers. This method minimizes the frequency variations caused by the stochastic nature of renewable energy sources and critical loads to an acceptable range. The required gain values are multiplied by the inputs and outputs to bring them within a permissible limit for this purpose.
In this article, the current research is focused on a novel coordination method for optimal participation of EVs in frequency regulation under different power system operation states (PSOSs). The novelty of this manuscript can be summarized as follows.
(1)
The proposed coordination of the FR power of generators and EVs under different optimization objectives with the goal of secure and economic operation of power system through optimal coordinated strategy;
(2)
The coordinated control principle is drawn between the EVs and generators based on the optimization method proposed in this manuscript;
(3)
The proposed particle swarm optimization (PSO) and genetic algorithm optimization toolbox (GAOT) algorithms are used to study frequency control based on the optimal values of the fuzzy controller parameters;
(4)
A PSO-based FLC scheme is presented to discover the required frequency regulation performance of the microgrid integrated with renewable energy sources, non-renewable energy sources, and prosumers;
(5)
The proposed optimization objective under normal power system operation is minimum FR cost, to ensure the minimum degradation cost associated with batteries;
(6)
In the abnormal state of power system operation, the optimization objective is shifted to ensure minimum frequency restoration time;
(7)
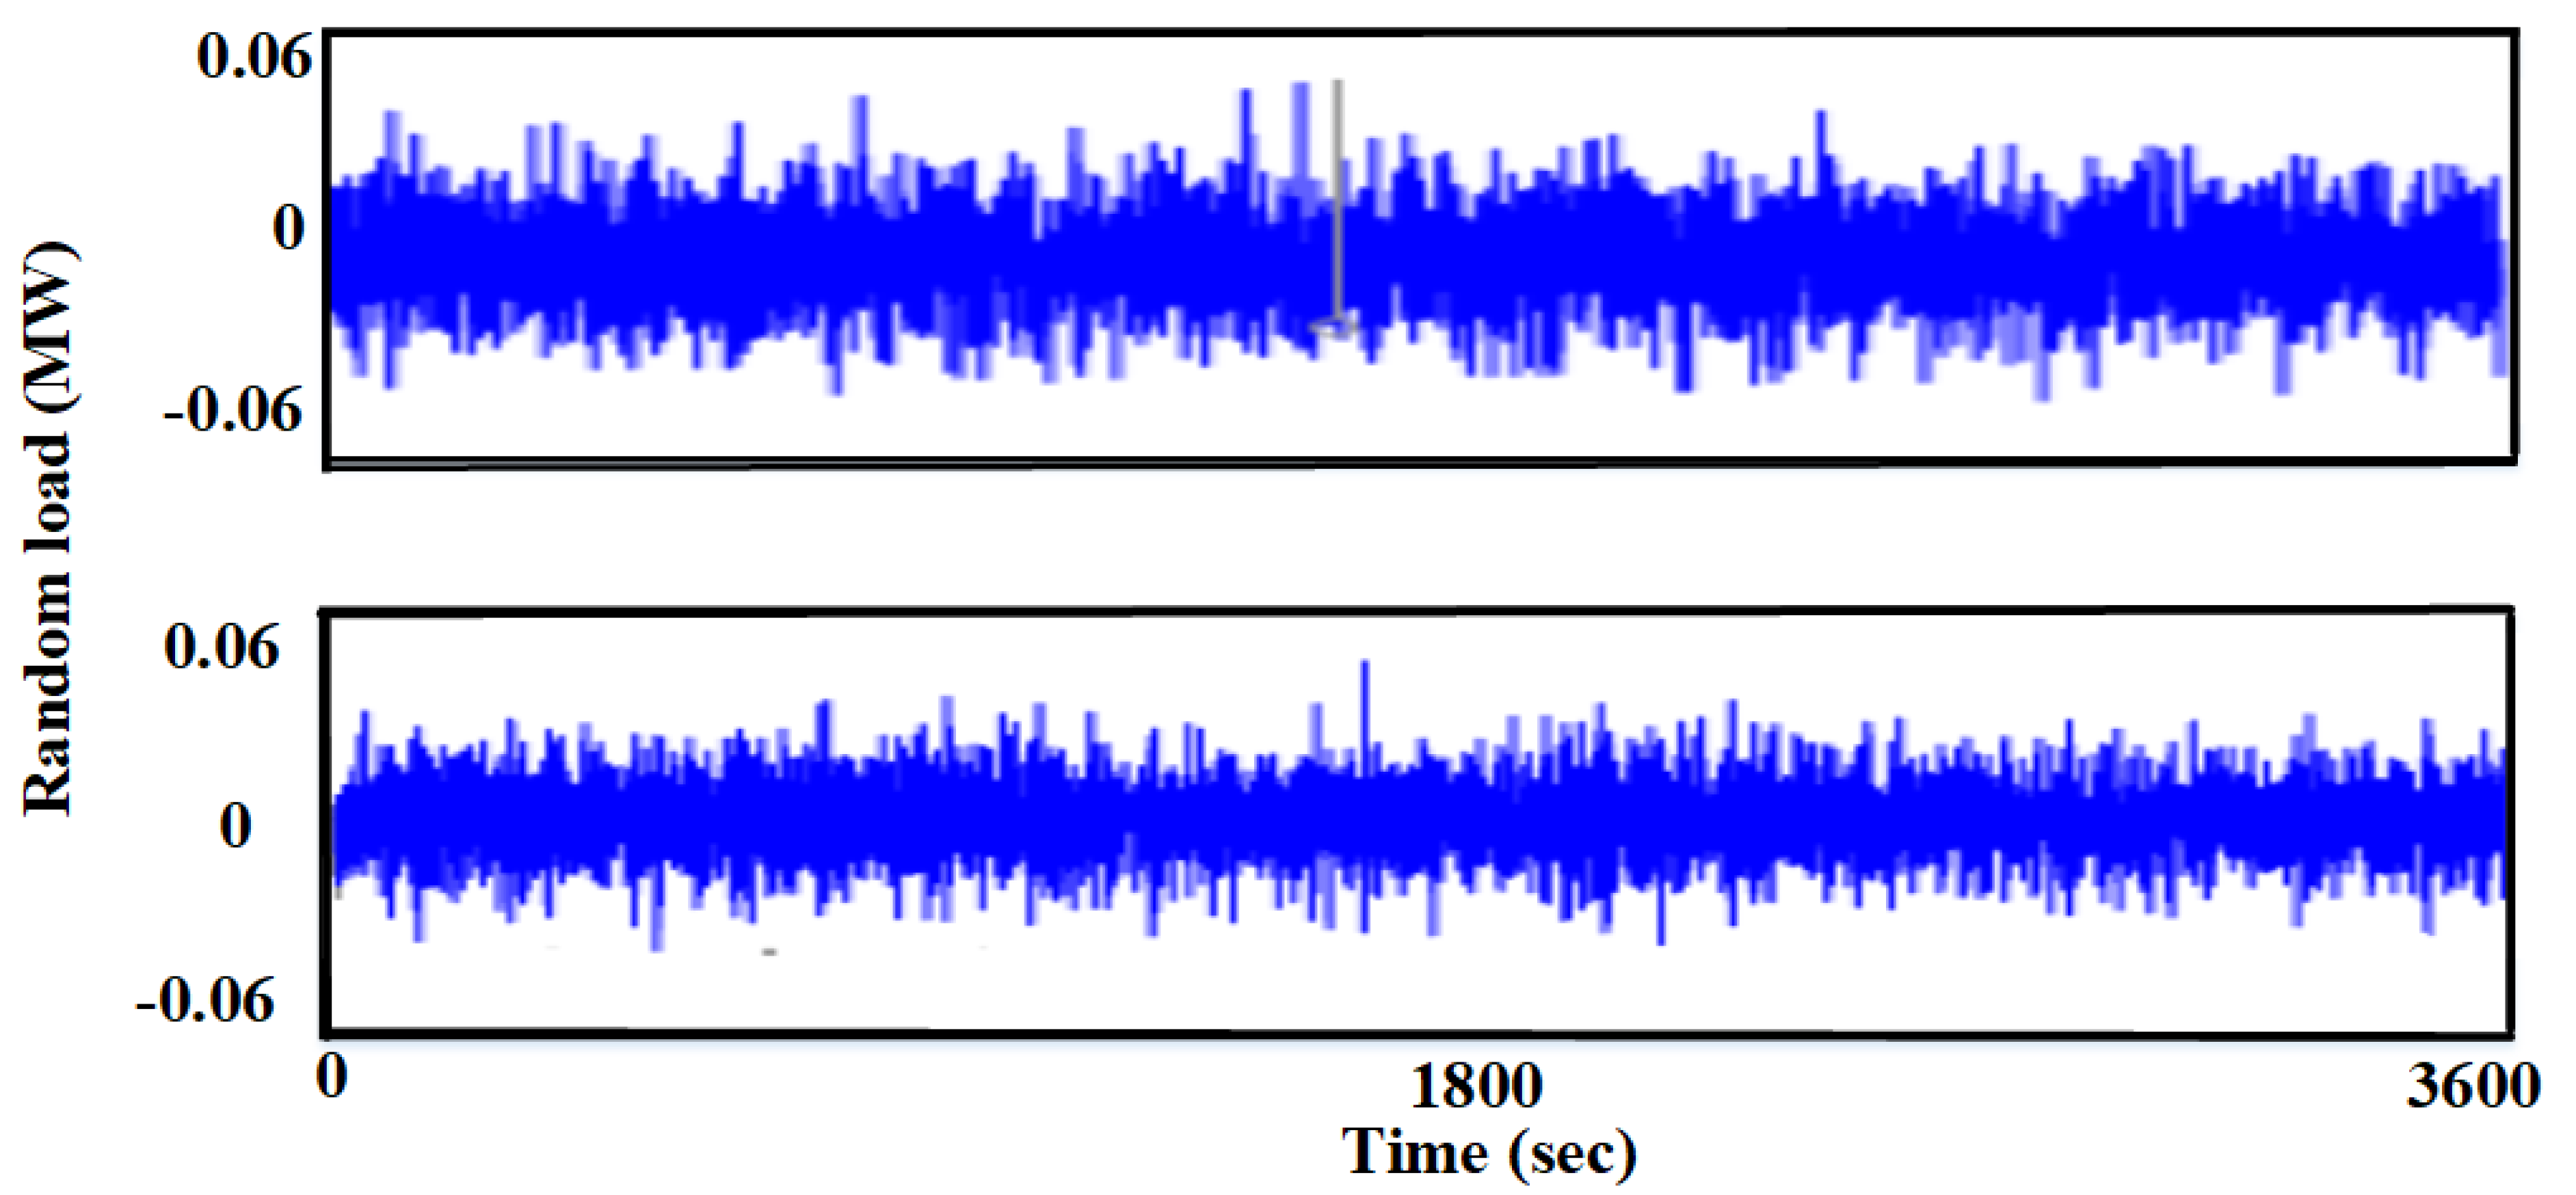
The proposed simulation involves the addition of a series of step loads and random loads in the abnormal and normal states, respectively.
The complete strategy of coordination charging station and EV aggregator with the microgrid operator is shown in Figure 1. The power generators, microgrid operator, charging station, and EV aggregator all serve as managers, ensuring that electric vehicles are monitored and controlled via communication with the charging station operator. The EVs aggregator sends the charging plan to the charging station operator (CSO) to calculate EV charging power based on the deployment structure. Meanwhile, the CSO monitors EV battery state and provides input to the EV aggregator, which analyses the gathered data and estimates baseload power capability for uploading and sends the obtained frequency regulation signal to the EVs. Figure 1 depicts the interlinkages between these entities.
This manuscript is arranged as follows. Section 2 establishes the optimized model. A resolution of the optimal model based on particle swarm optimization and fuzzy set theory are presented in Section 3. Section 4 proposes a coordination control methodology between the generators and EVs and finally, Section 5 presents the conclusions of the research.

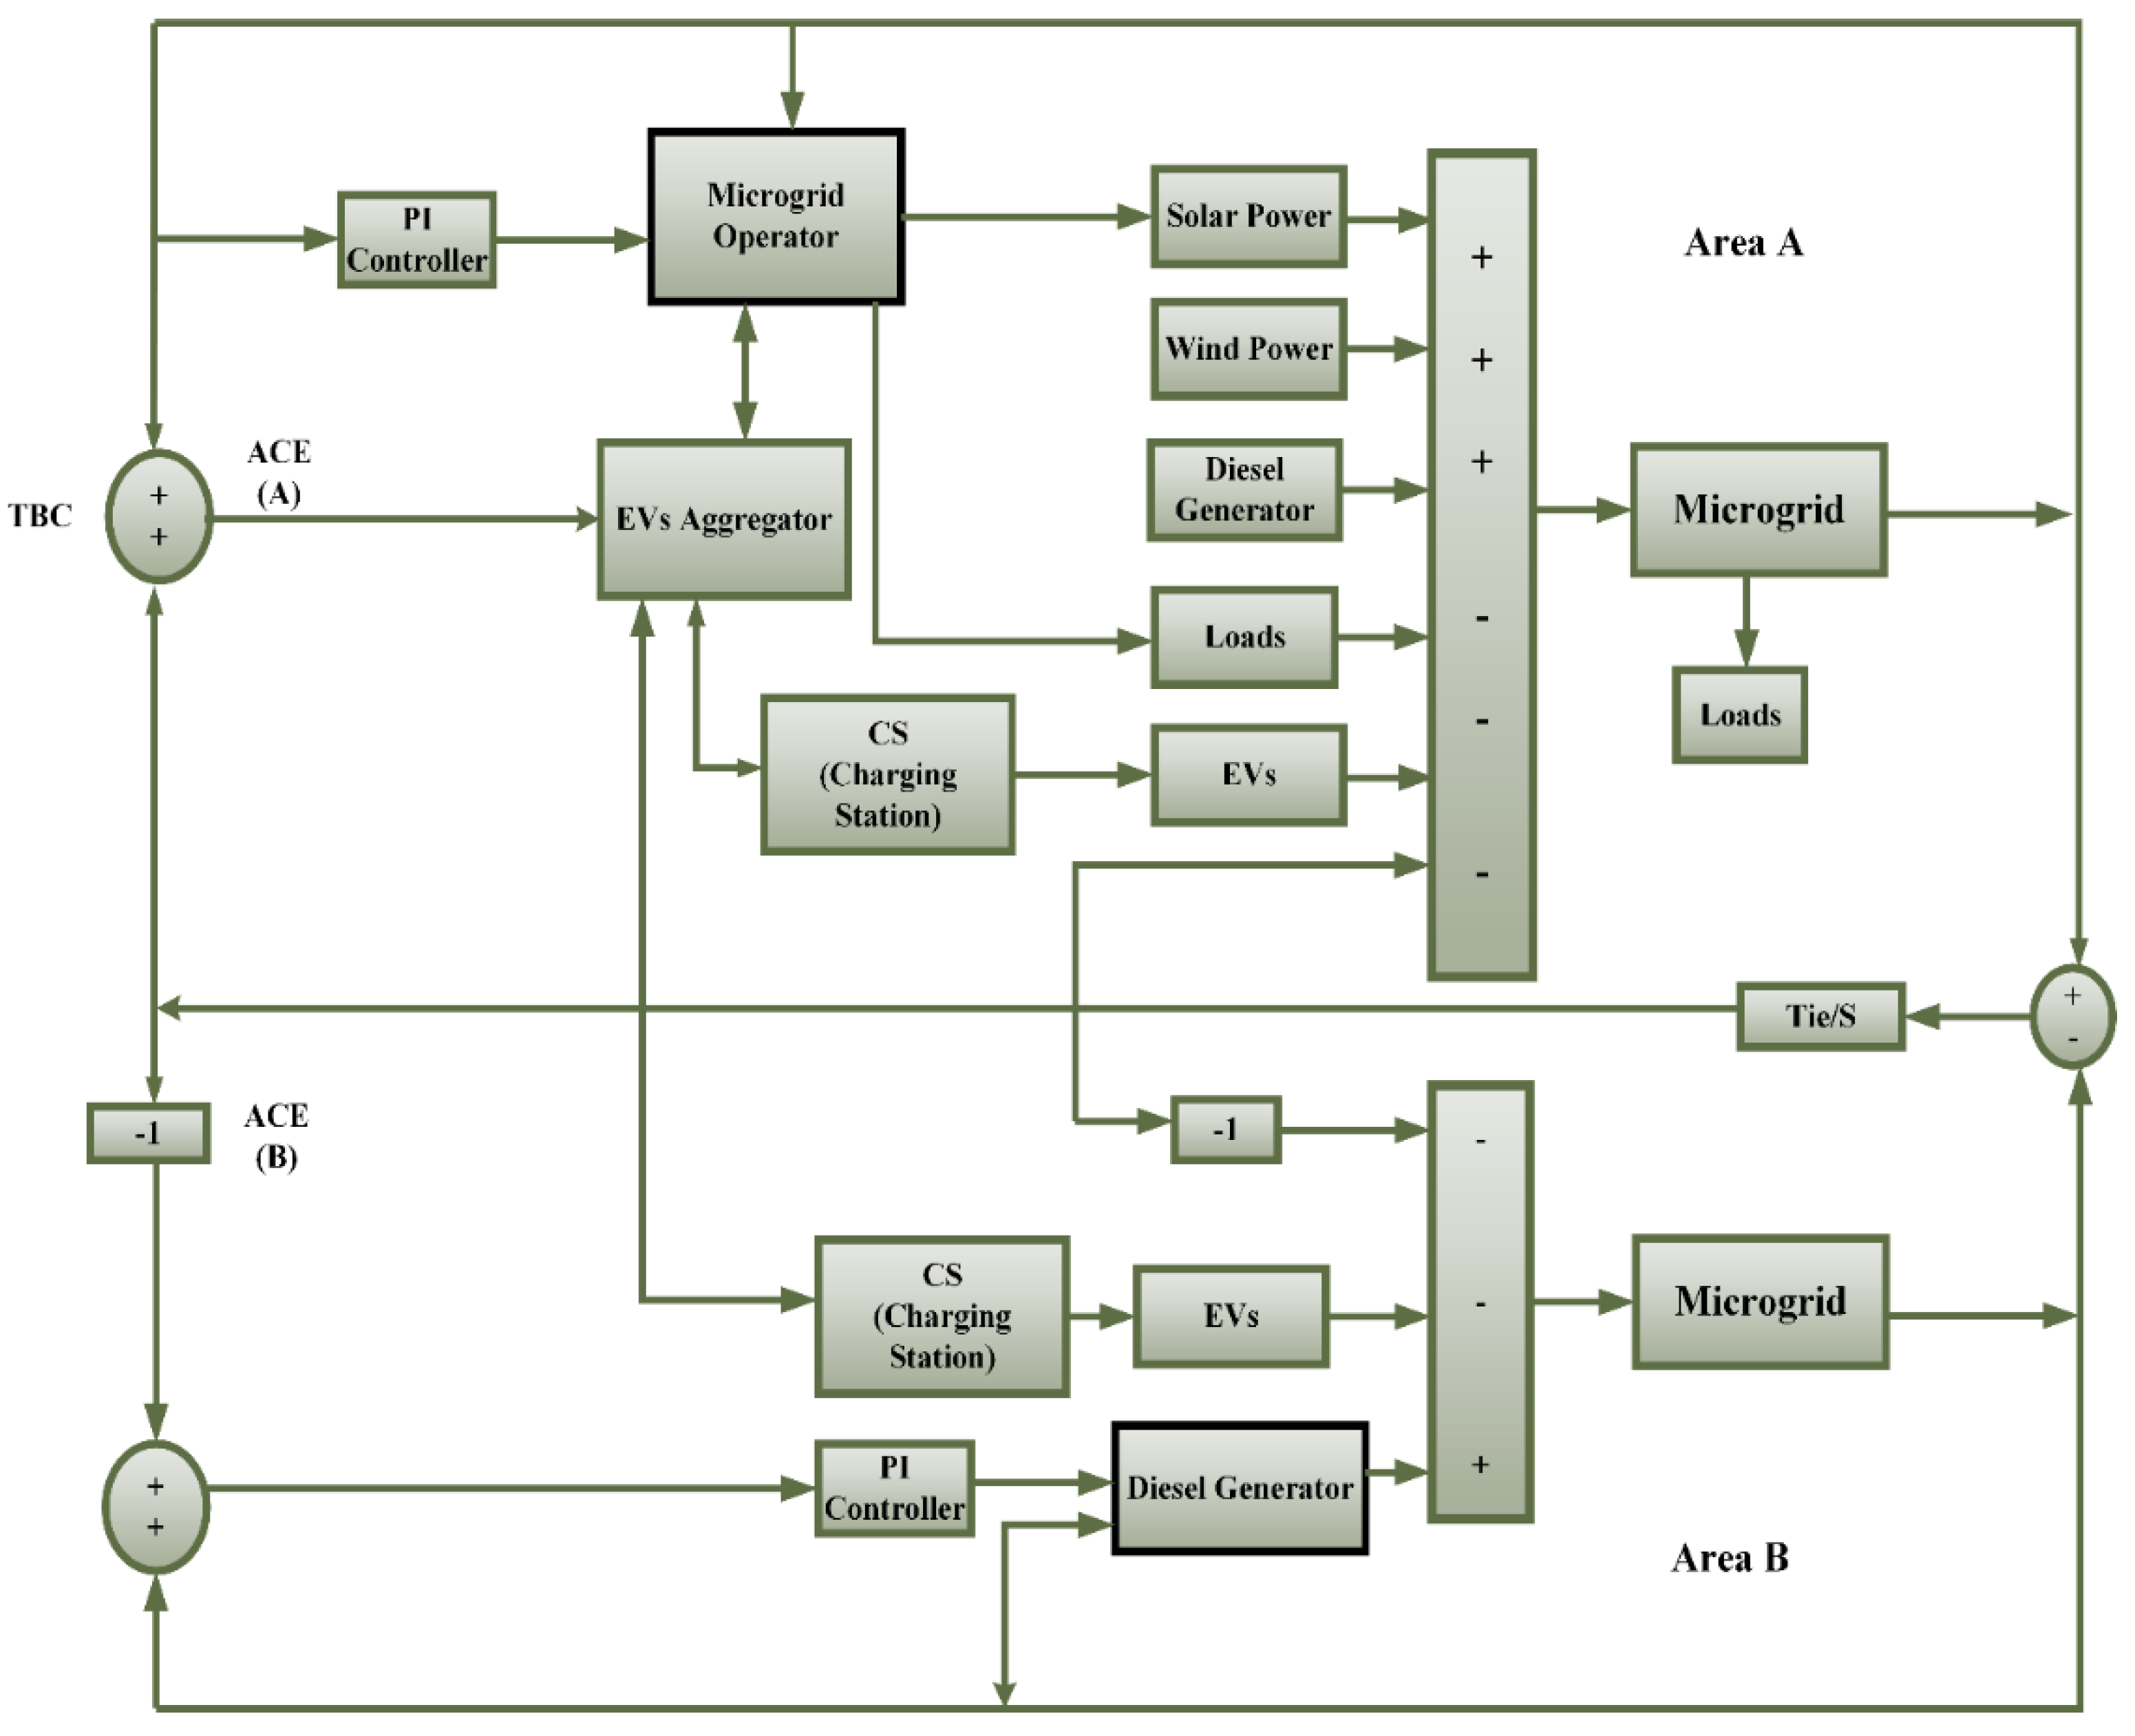
2. Problem Formulation

As a mismatch between generation and load might result in significant frequency deviation (FD), a power system operation should maintain a stringent generation–load balance. When the system operation is relatively safe, the frequency deviation is controlled within a small range, however only the normal state out of the five states of a power system operation is considered a relatively safe state [31,32]. Consequently, this paper only considers the normal state as ‘normal’, while the other four states are regarded as ‘abnormal’.

2.1. Objective Function

From the equation of the FD can be written as [6,30]:
Δ f ˙ = 1 M ( Δ P V 2 G + Δ P F R R Δ P L D Δ f )
Δ P V 2 G = i = 1 N Δ P E V , i  
where:
  • Δ I ndicates the deviation;
  • f denotes frequency;
  • M represents the angular momentum factors;
  • PV2G indicates the vehicle-to-grid (V2G) power of aggregated EVs
  • PFRR represents the output power of the system’s other FR resources;
  • PL indicates the frequency of the non-sensitive load;
  • D stands for the coefficient of damping load;
  • PEV,i indicates the power of the V2G network ith EV;
  • N means the number of the EVs.
This article assumes that the EVs are available in the charging station (CS) for the maximum possible time each day. The complete strategy of coordinating the charging station and the EV aggregator with the microgrid operator is shown in Figure 1. The number of EVs that are under consideration in the FR can be incentivized to stay in the charging station through economic measures, similar to demand response (DR). In DR, loads are time shifted through price or policy incentives and is considered a cost-effective technique [21].
The FR cost is computed using the following equations:
C = C E V + C m  
C E V = C d e g   + C c h a r + C l o s s  
where C indicates the cost of FR; Cm represents the cost of frequency regulation for generators; CEV denotes the FR cost accrued from EVs, factoring in the power loss cost Closs, charging cost Cchar and battery degradation cost Cdeg; Cchar indicates the cost accrued in buying or selling back the power to/from the microgrid; while Closs being the cost of power transmission loss. The degradation cost for batteries resultant from EV charge/discharge over a period of time is computed using Equations (5) and (12) given below:
C d e g = i I t W α P E V , i t z + i I t = 2 W β Δ P E V , i t 2
where α, β are symbols for model parameters; PEV,it represents the charging power and ΔPEV,it stands for the fluctuation of charging power of the ith EV in interval t; W stands for interval set; I indicates the set of EVs; PEV,it and ΔPEV,it can potentially have an impact on battery temperature and active material of the battery, which may result in increased battery degradation cost. For safe state power system operation, there is a noticeable reduction in FR cost. The objective function for this scenario is shown in Equation (6):
{ m i n { Δ f m a x , Δ f aver   , C } , S tate   = 0     m i n { Δ f m a x , Δ f aver   , t F } , S tate   = 1
where Δfmax and Δfaver are representative of the maximum and the average frequency deviation (FD) incurred during the FR process, respectively; tF indicates the time taken in the restoration of the FD to within normal range; State indicates the PSOS, equaling 0 for normal state operation of system and 1 for abnormal state.

2.2. Characteristics of Frequency Regulation

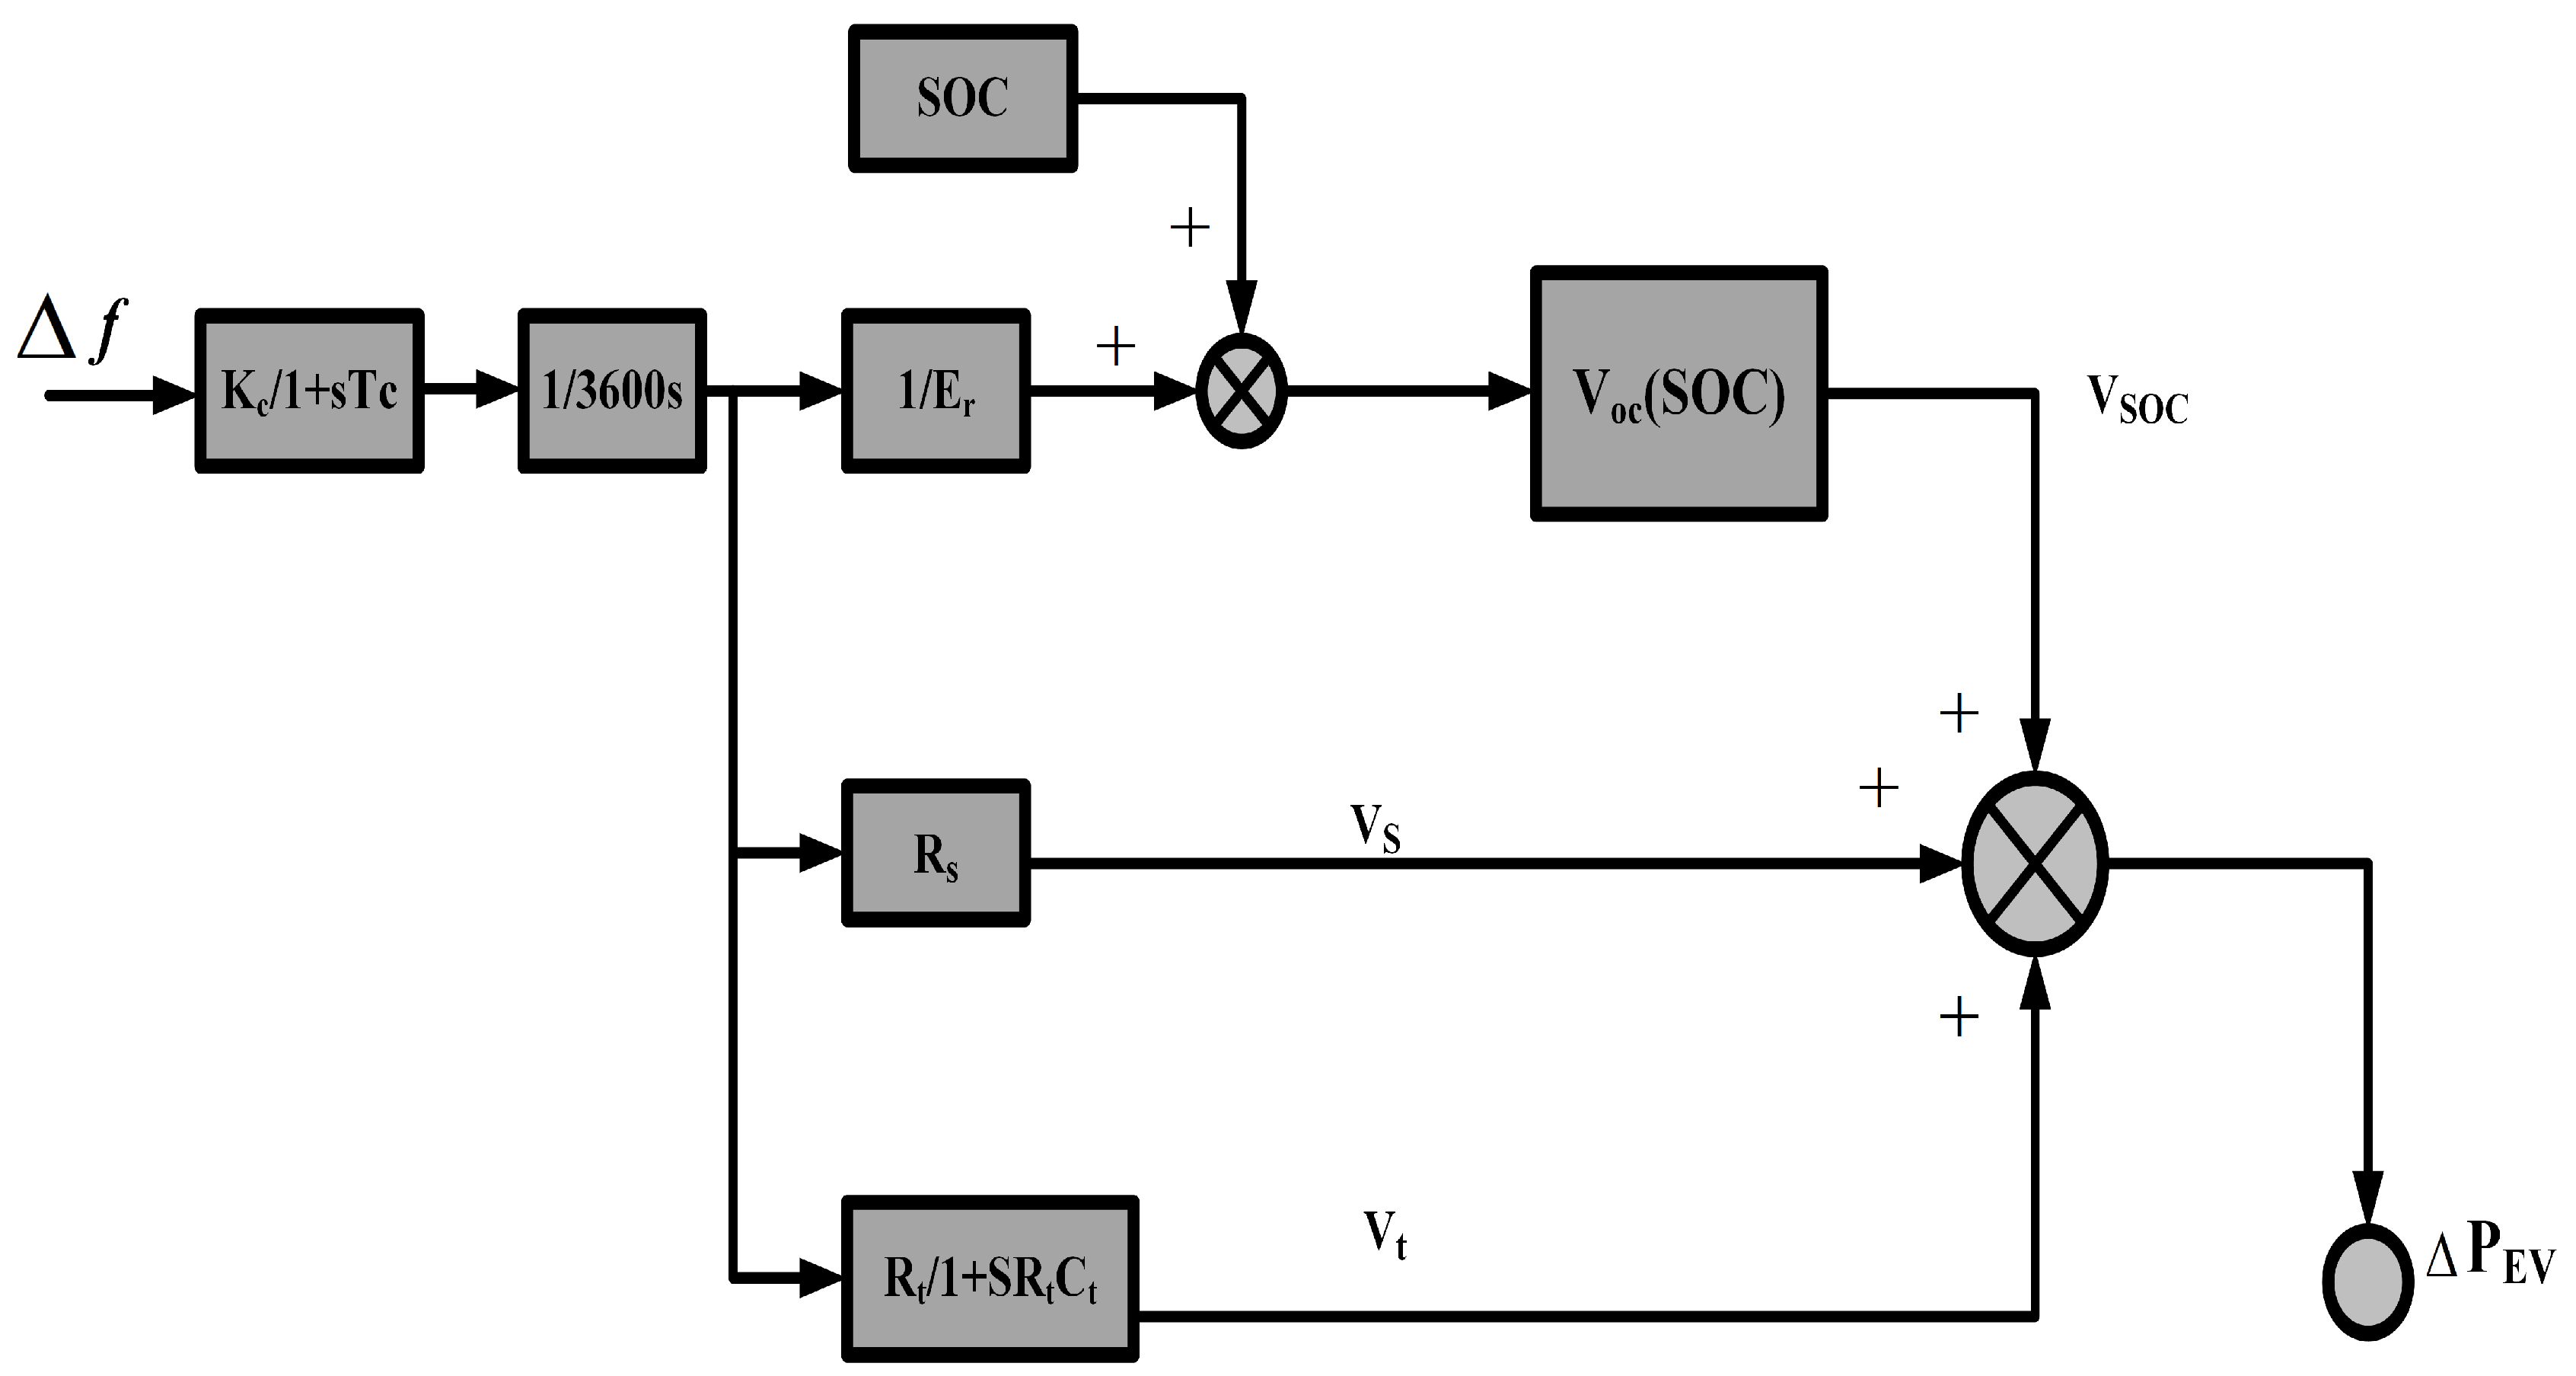
2.2.1. The Dynamic Characteristics of Power System Components

The dynamic characteristics mainly vary with the turbine, governor, and reheater inlet constants for generators, while for EVs, it is dependent on time constant of battery power adjustment and can reach as low as tens of milliseconds [33]. In cases where a sufficient number of EVs are available, the FR accuracy and response speed will entail obvious advantages, whereas in the opposite case, the capacity constraints will affect the EVs’ output power. The generator output power is limited by the ramp rate and response speed in comparison with the EVs. The dynamic model electric vehicle is shown in Figure 2.

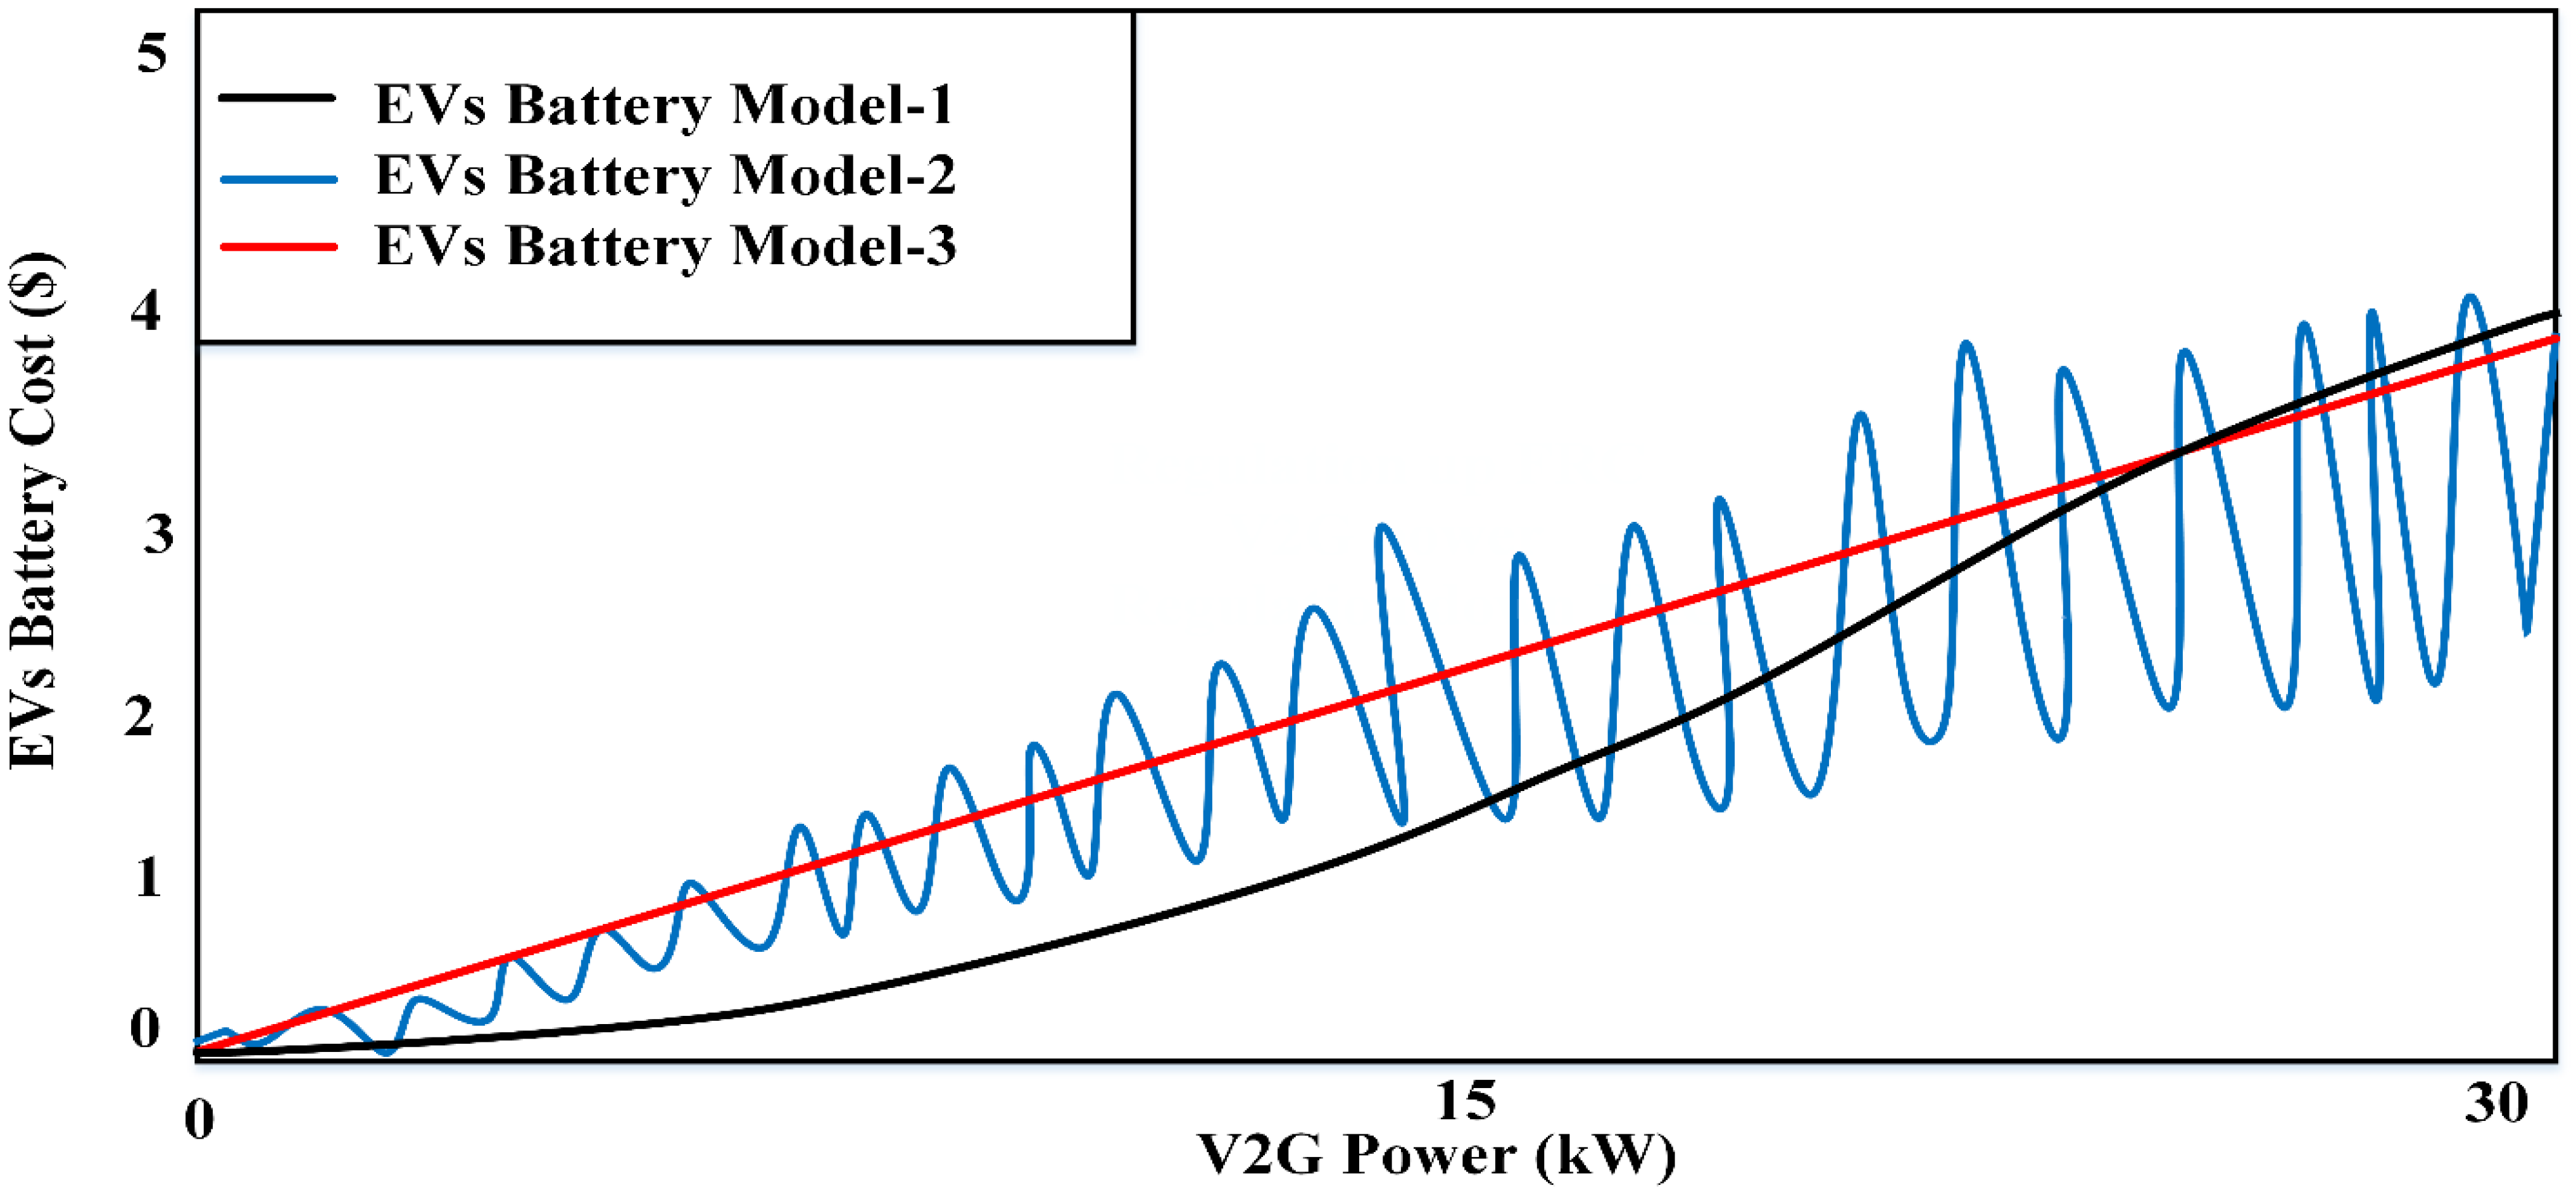
2.2.2. Cost Characteristic

Power loss cost, battery degradation cost and charging cost constitutes the bulk of FR costs of EVs. Charging cost, in turn, is limited by electricity costs from the grid, and charging power as shown in (7), and is positive for charging and negative for discharging. The charge and discharge power required for FR in this paper are assumed to be equal. Hence the charging cost is not a factor in this research. The cost of power loss resulting from transmission losses is indicative from the charging/discharging efficiency and expressed in Equations (14) and (15).
C E V c h a r g e = i I t W P charge , i t z purchase , t P discharge , it z sell , t  
where Pdischarge,it and Pcharge,it stand for the charging/discharging power of the ith EV respectively in interval t; Zpurchase,t and Zsell,t are the prices for the electricity purchase from grid and selling price to grid, respectively, in the interval t.
The life cycle of EV batteries is limited by the degradation of active materials owing to charge/discharge [34], caused by development and evolution of cracks in the dynamic materials in a similar process to the cyclic mechanical loading leading to fatigue in materials [35]. The factors influencing this effect can be categorized as temperature, depth of cycle, charge/discharge power, among others. V2G power is regarded as the variable of battery degradation cost equation. The equations, however, assume ideal or standard conditions of 25 degrees centigrade. Figure 3 illustrates the relationship between the V2G power and battery degradation costs. Models 1, 2, and 3 give an indication of the battery degradation costs, the calculation of which is based on [12,30]. Random V2G power is assumed in model 2, where the piecewise cost function is assumed. In model 3, on the other hand, average values of the factors constitute the correlation parameters. The cost function is simplified by only applying the model 1 cost equation in this research.
As shown in Equation (5), the battery degradation cost is directly related to EV output power fluctuations and the total power during t. The battery life is shortened in the cases of overcharging/discharging and frequent charging/discharging. The battery degradation cost, as schematically presented in Figure 3, where the FR power is shown in time t, by the charging power. Accordingly, a greater participation time for EVs in the frequency regulation will lead to lower degradation costs of batteries. It can also be seen from Figure 2 that the battery capacity is not factored into the charging power of the EV, which is assumed the same, irrespective of the number of EVs in the FR. FR costs in this case for generators is expressed in (8) [32].
C m = g = g z g e t = t s t e C g t + g = g s g e t = t s t e q p r , g t r p r , g t = g = g i g e t = t t t e [ U g t C f t ^ g t a g G g t 1 2 b g ( G g t ) 2 ] + g = g z g e t = t j t e q p r , g t r p r , g t
where:
  • Cgt is represented as factor for the generation cost associated with the gth diesel generator (DG) during t time period;
  • ts indicates the time when the generator operates for the participation in FR;
  • te indicates time the generator participation in FR ends;
  • ugt is 1 when the gth diesel generator (DG) is turned on during t time period and equal to 0 otherwise;
  • Cfix,gt is the factor for the fixed generation costs of the gth generator during time t;
  • ag and bg are the parameters for the generation cost in the FR;
  • Ggt indicates the planned power generation of the gth diesel generator (DG) in the pre-contingency condition during time t;
  • qpr,gt represents the primary reserve rate of the gth generator during t;
  • rpr,gt denotes the gth generator scheduled primary reserve of the during t.
As indicative from (8), the number of generators, reserve capacity, and output power of generator are the primary factors in FR costs of generators.

2.3. Constrants

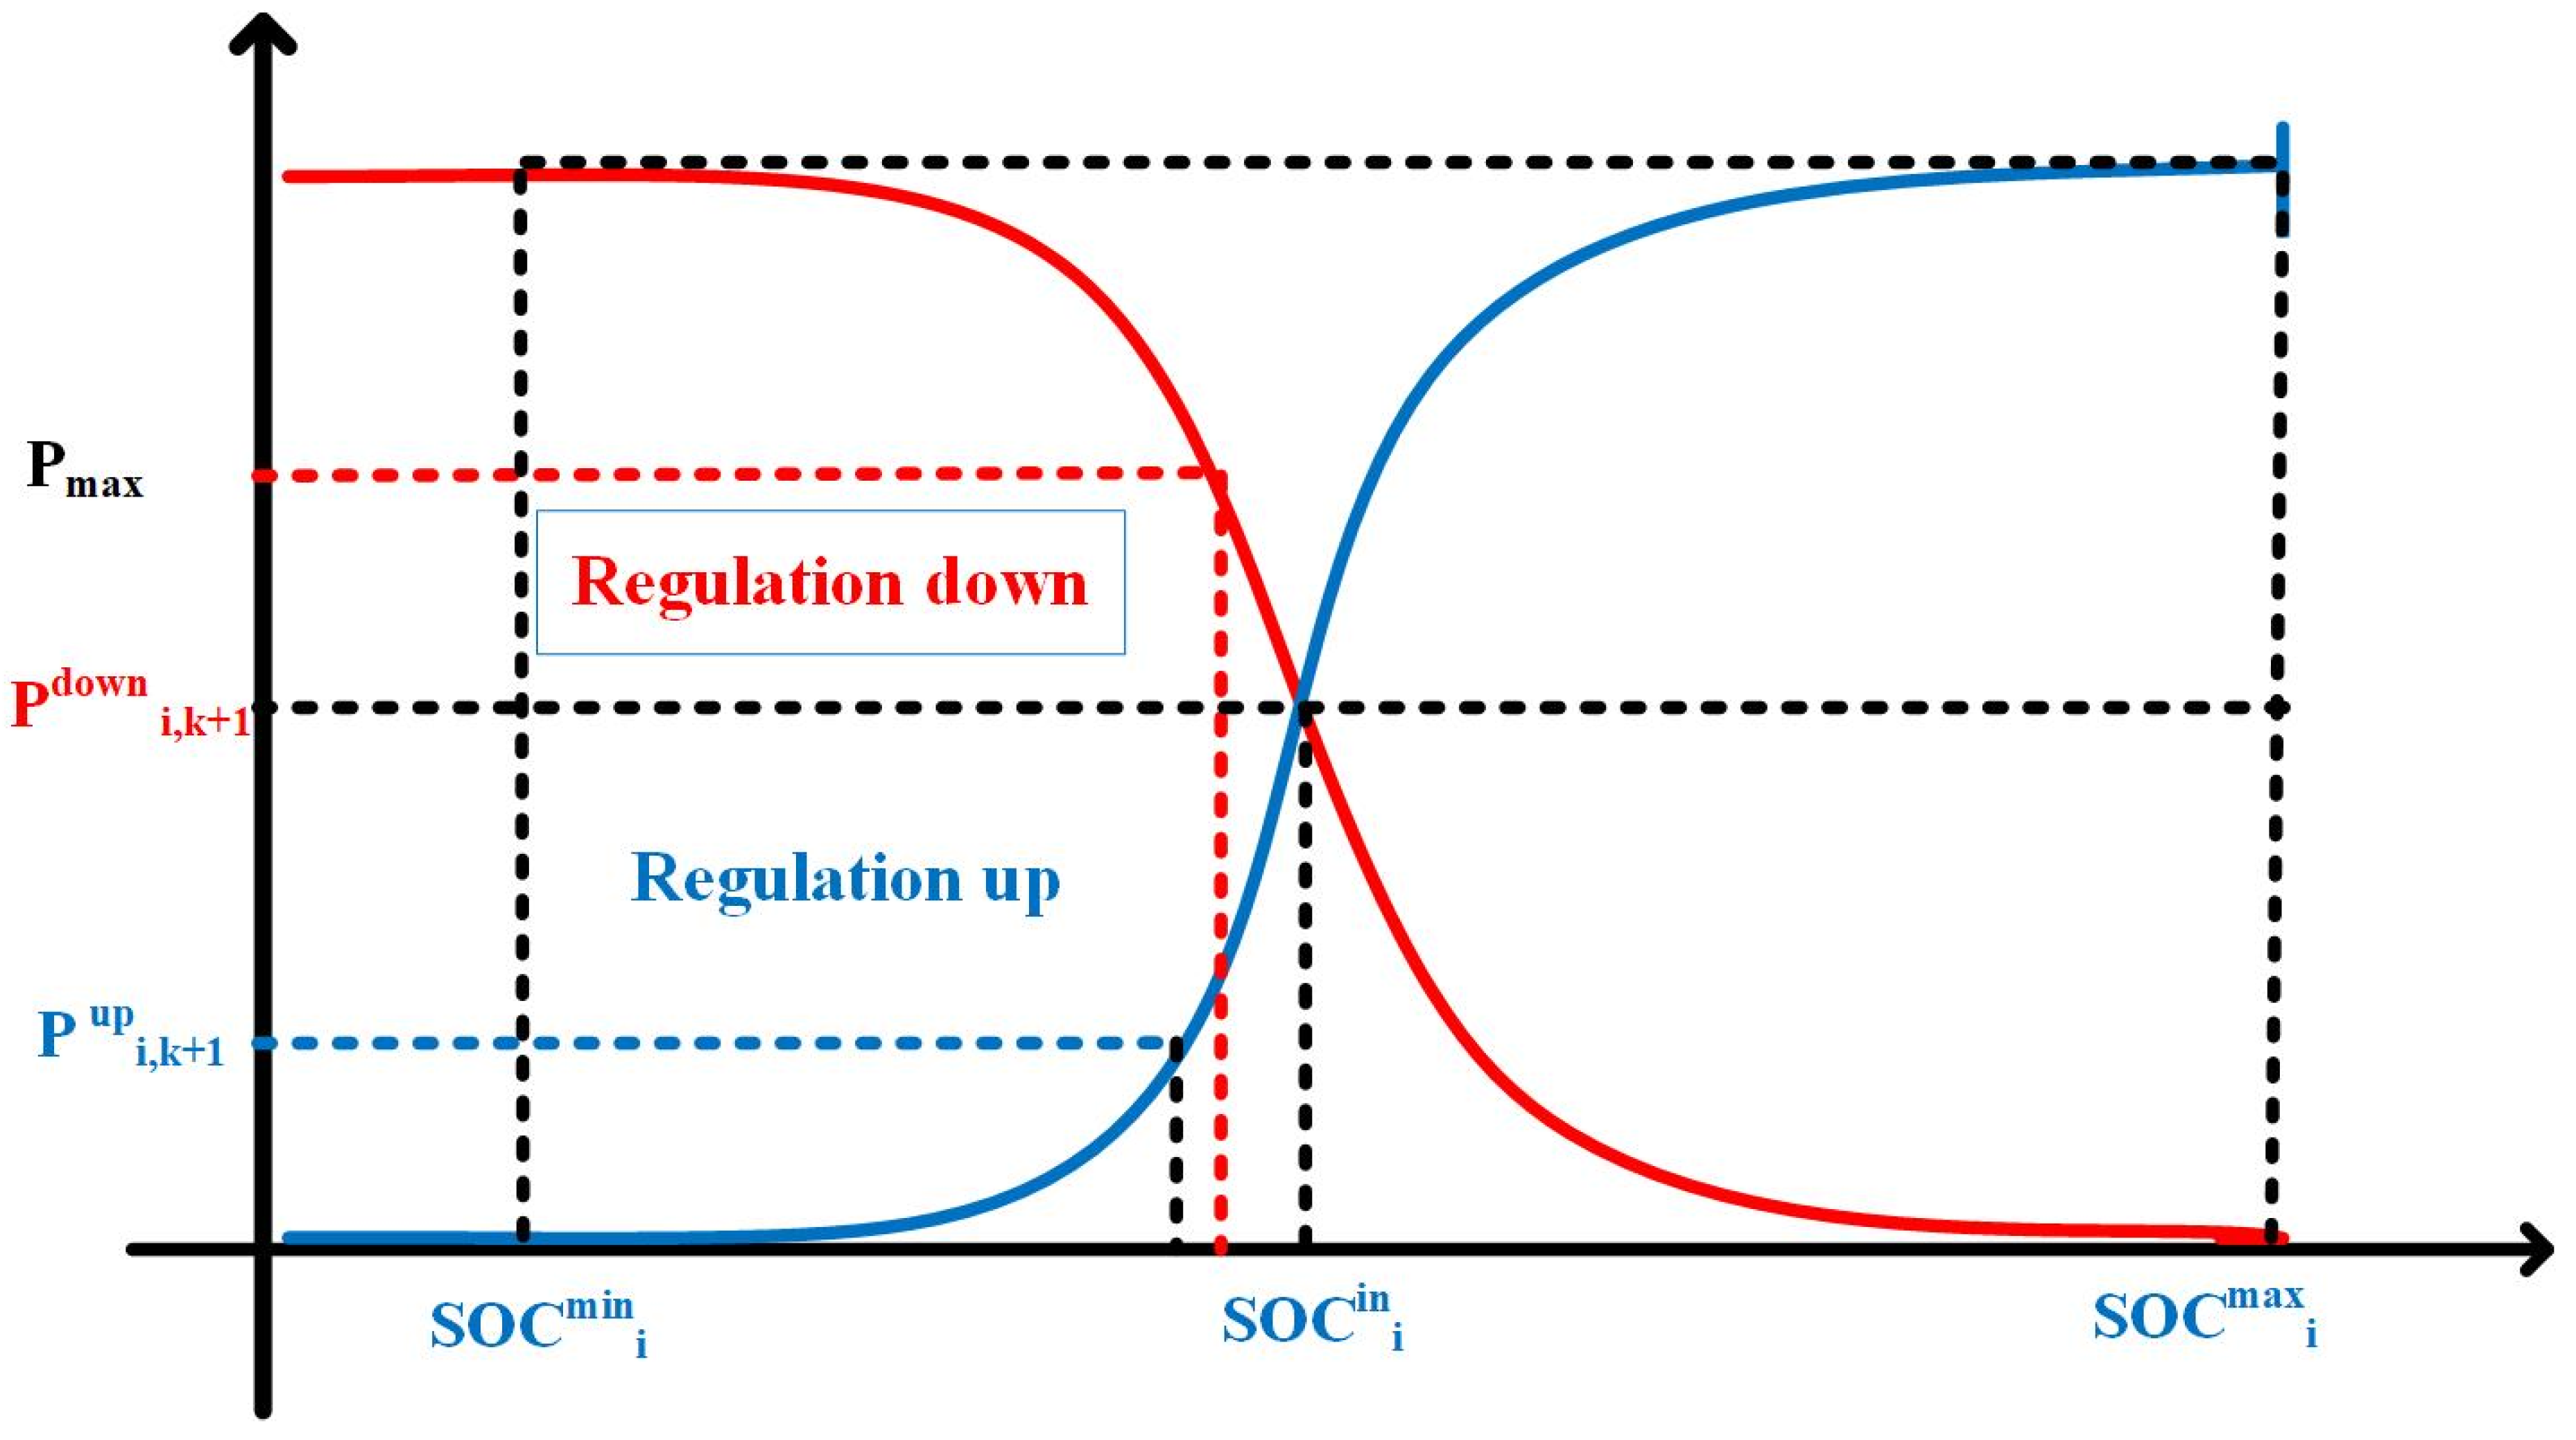
2.3.1. EV State of Charge

SOC is an important parameter for EV participation in charge, having direct impact on the charge/discharge capacity, expressed by the Equations (9)–(11) and shown in Figure 4.
S O C m i n S O C ini   , i S O C m a x
E c , i = ( S O C m a x S O C i n i , i ) E 0 , i
E d , i = ( S O C i n i , i S O C m i n ) E 0 , i  
where:
  • SOCmax and SOCmin respectively represent the EVs maximum and minimum SOC, and the relation in (9) represents the setting for optimal performance.
  • SOCini,i denotes the ith EV initial SOC;
  • Ec,i is ith EV charging energy;
  • Ed,i represents discharging energy of the ith EV for; and
  • E0,i is the ith EV battery rated capacity.

2.3.2. Generator Power Output

The constraint in (12) for avoiding for under/over power output of generators.
Δ P m i n m , g Δ P m , g Δ P m a x m , g  
where the gth generator minimum output power for participation in FR is represented by ΔPminm,g while ΔPmaxm,g indicates the gth generator maximum power output.

2.3.3. Charging and Discharging Power of the EVs

The EV output power is constrained by the expressions as given below:
Δ P m a x D , i Δ P V 2 G , i Δ P m a x C , i
Δ P V 2 GD , i = κ K i , k Down   Δ P V 2 GD , i  
Δ P V 2 G C , i = ζ K i , k U p Δ P V 2 G C , i
P sti , down   i = 1 N E V Δ P V 2 G , i P s t i , u p
The parameters given in the expressions (13)–(16) are explained as follows:
  • ΔPmaxD,i: the ith EV’s maximum discharging power during t time period;
  • ΔPmaxC,i: the ith EV’s maximum charging power during t time period;
  • ΔPV2GD,i and ΔPV2GC,i: respectively, the ith EV actual discharging and charging power;
  • ζ and κ: loss efficiency coefficients for transmission, both having value less than 1;
  • K i , k Down   and K i , k U p : respectively, the discharging and charging efficiency coefficients;
  • Δ P V 2 G D , i and Δ P V 2 G C , i : the ith EV discharging and charging power;
  • Psti,down and Psti,up: respectively, the upper and lower limit capacity of the stith CS.
    NEV is represented as the number of EVs stay at CS.
Δ P V 2 G D , i and Δ P V 2 G C , i are parameters dependent on the ith EV’s SOC, and are formulated as (17)—(20) and schematically represented in Figure 5 [14].
{ K i , k Down   = 1 K i , k U p = 0 , S O C i , k S O C i m i n
{ K i , k Down   = 0 K i , k U p = 1 , S O C i , k S O C i m a x
{ K i , k Down   = 1 2 ( 1 + S O C i , k S O C i m S O C i m i n S O C i m ) K i , k U p = 1 2 ( 1 S O C i , k S O C i m S O C i m i n S O C i i n ) , S O C i m i n S O C i , k S O C i in  
{ K i , k Down   = 1 2 ( 1 S O C i , k S O C i in   S O C i m a x S O C i in   ) K i , k U p = 1 2 ( 1 + S O C i , k S O C i in   S O C i m a x S O C i in   ) , S O C i m   S O C i , k S O C i m a x       .  
where SOCmax i indicates the ith EV maximum SOC; SOCmin i indicates the ith EV minimum SOC; and SOCin i factors in the initial plug-in SOC of the ith EV.

3. Proposed Optimization Strategy

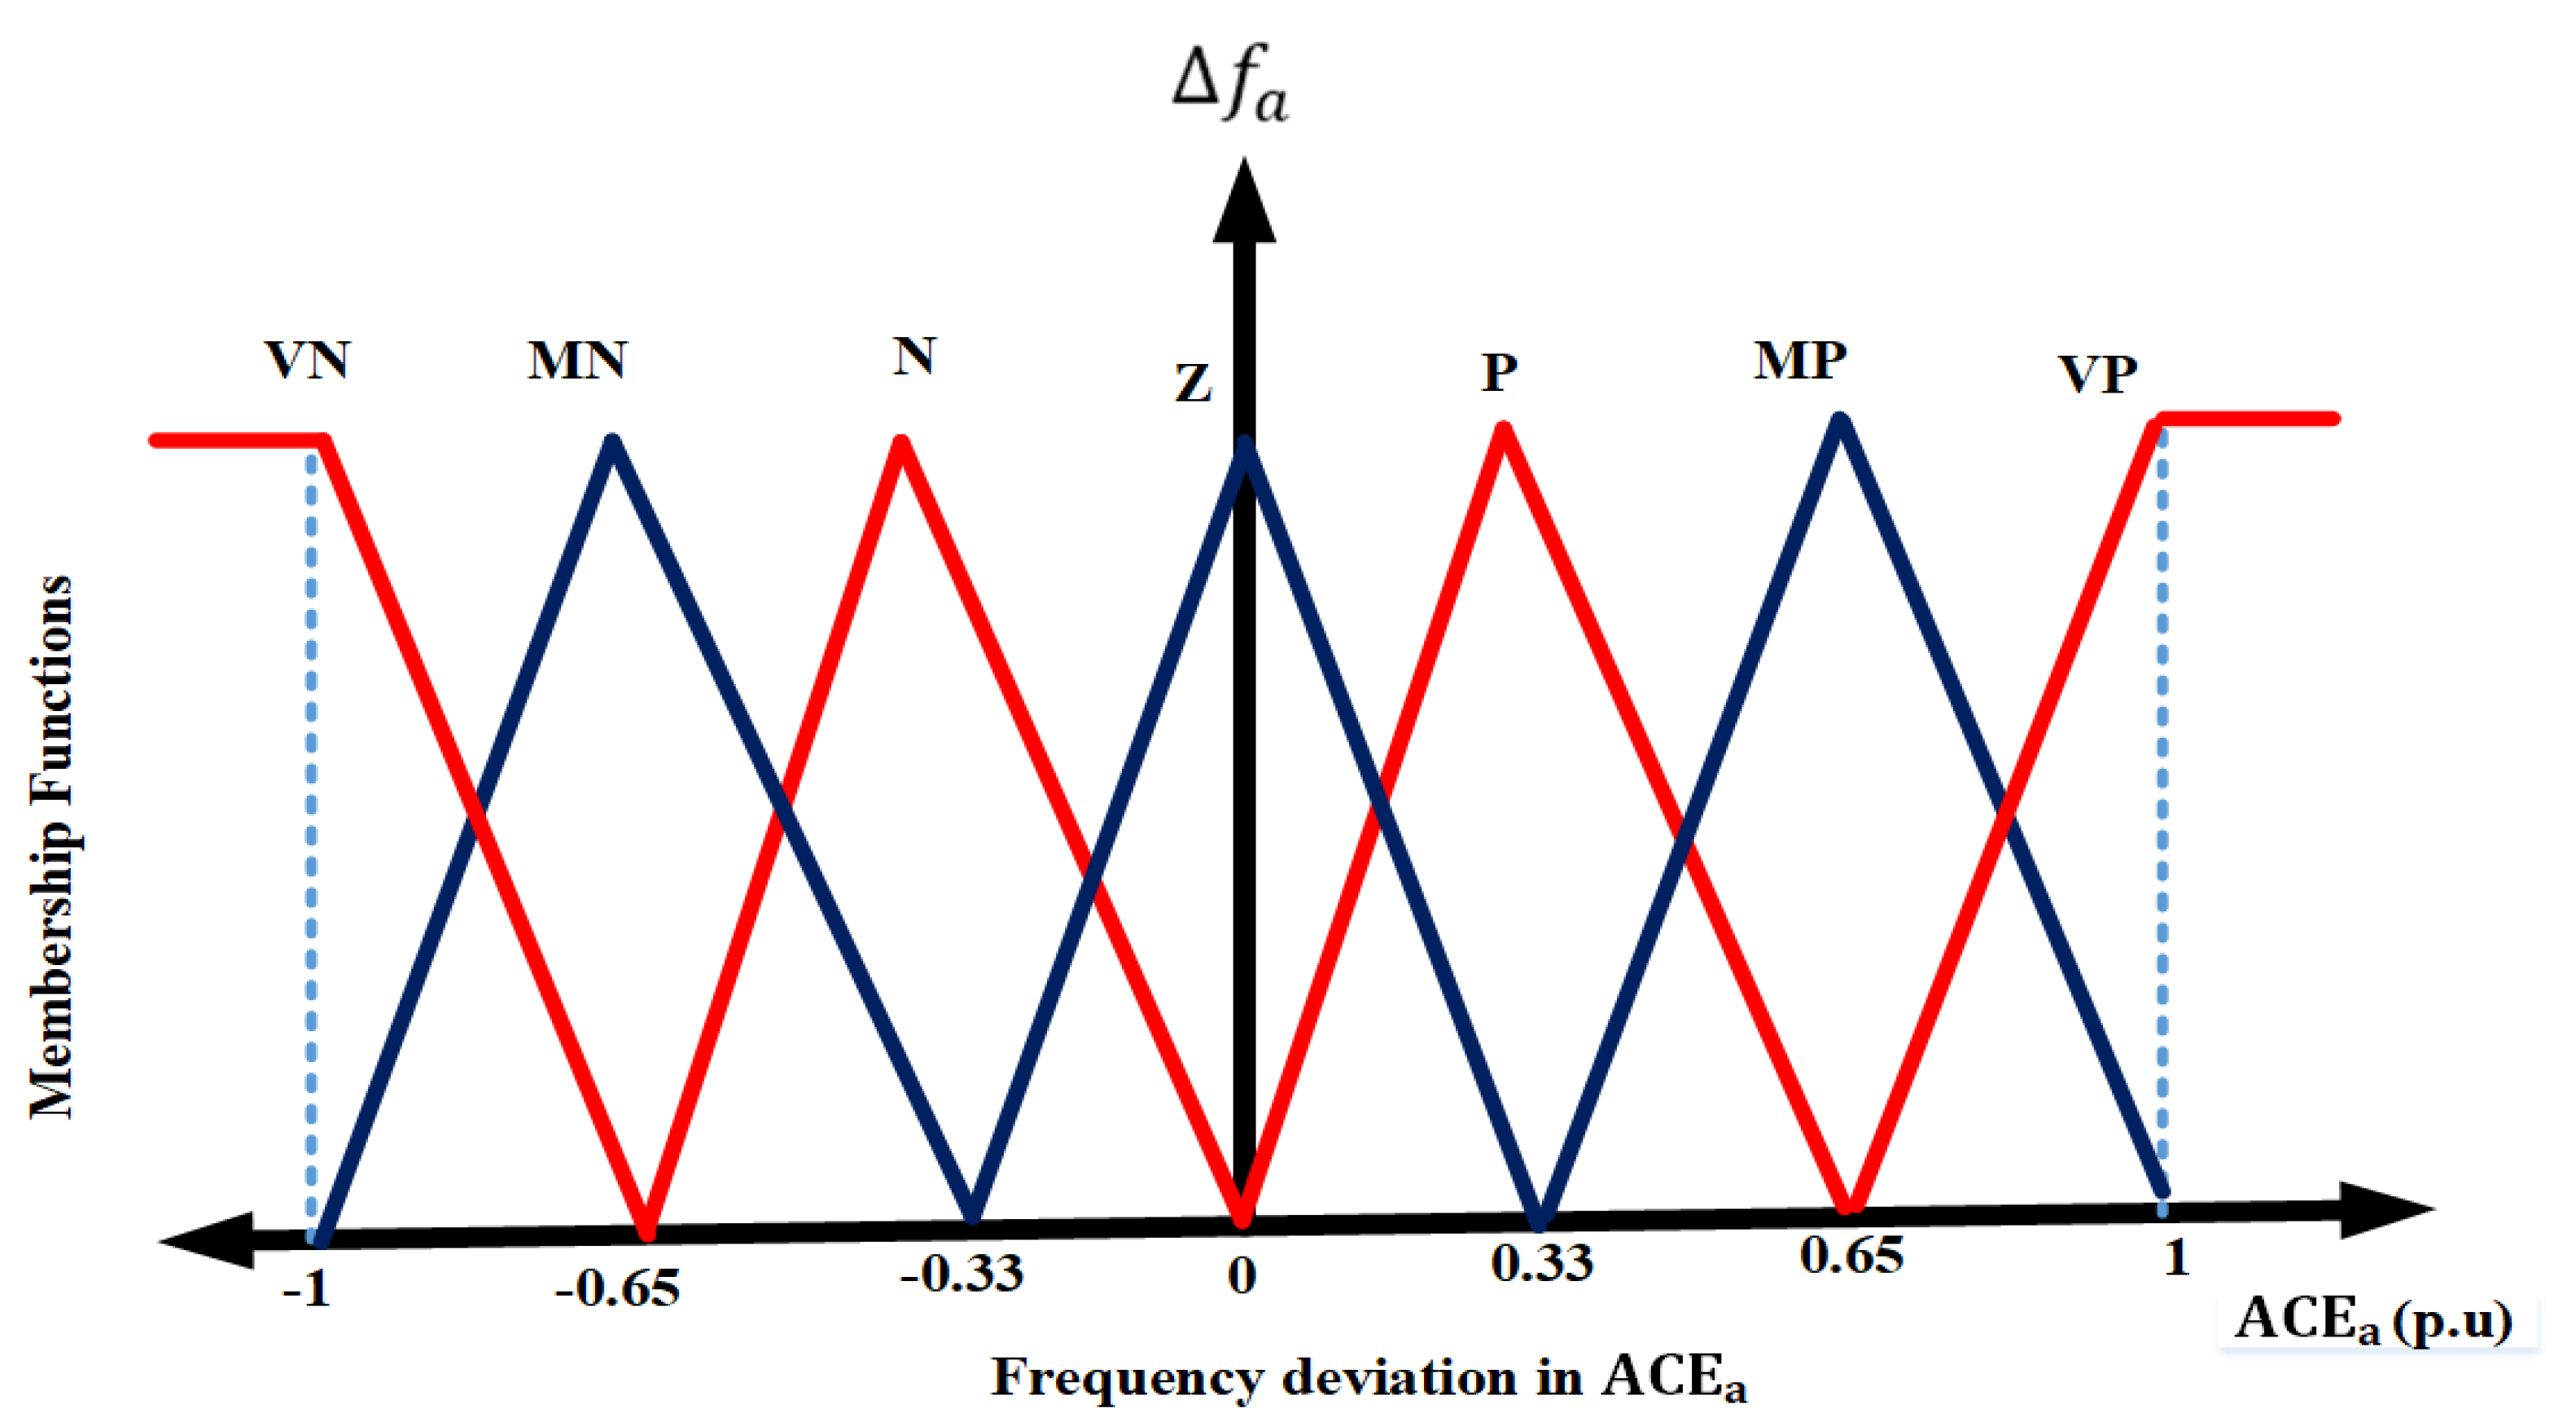
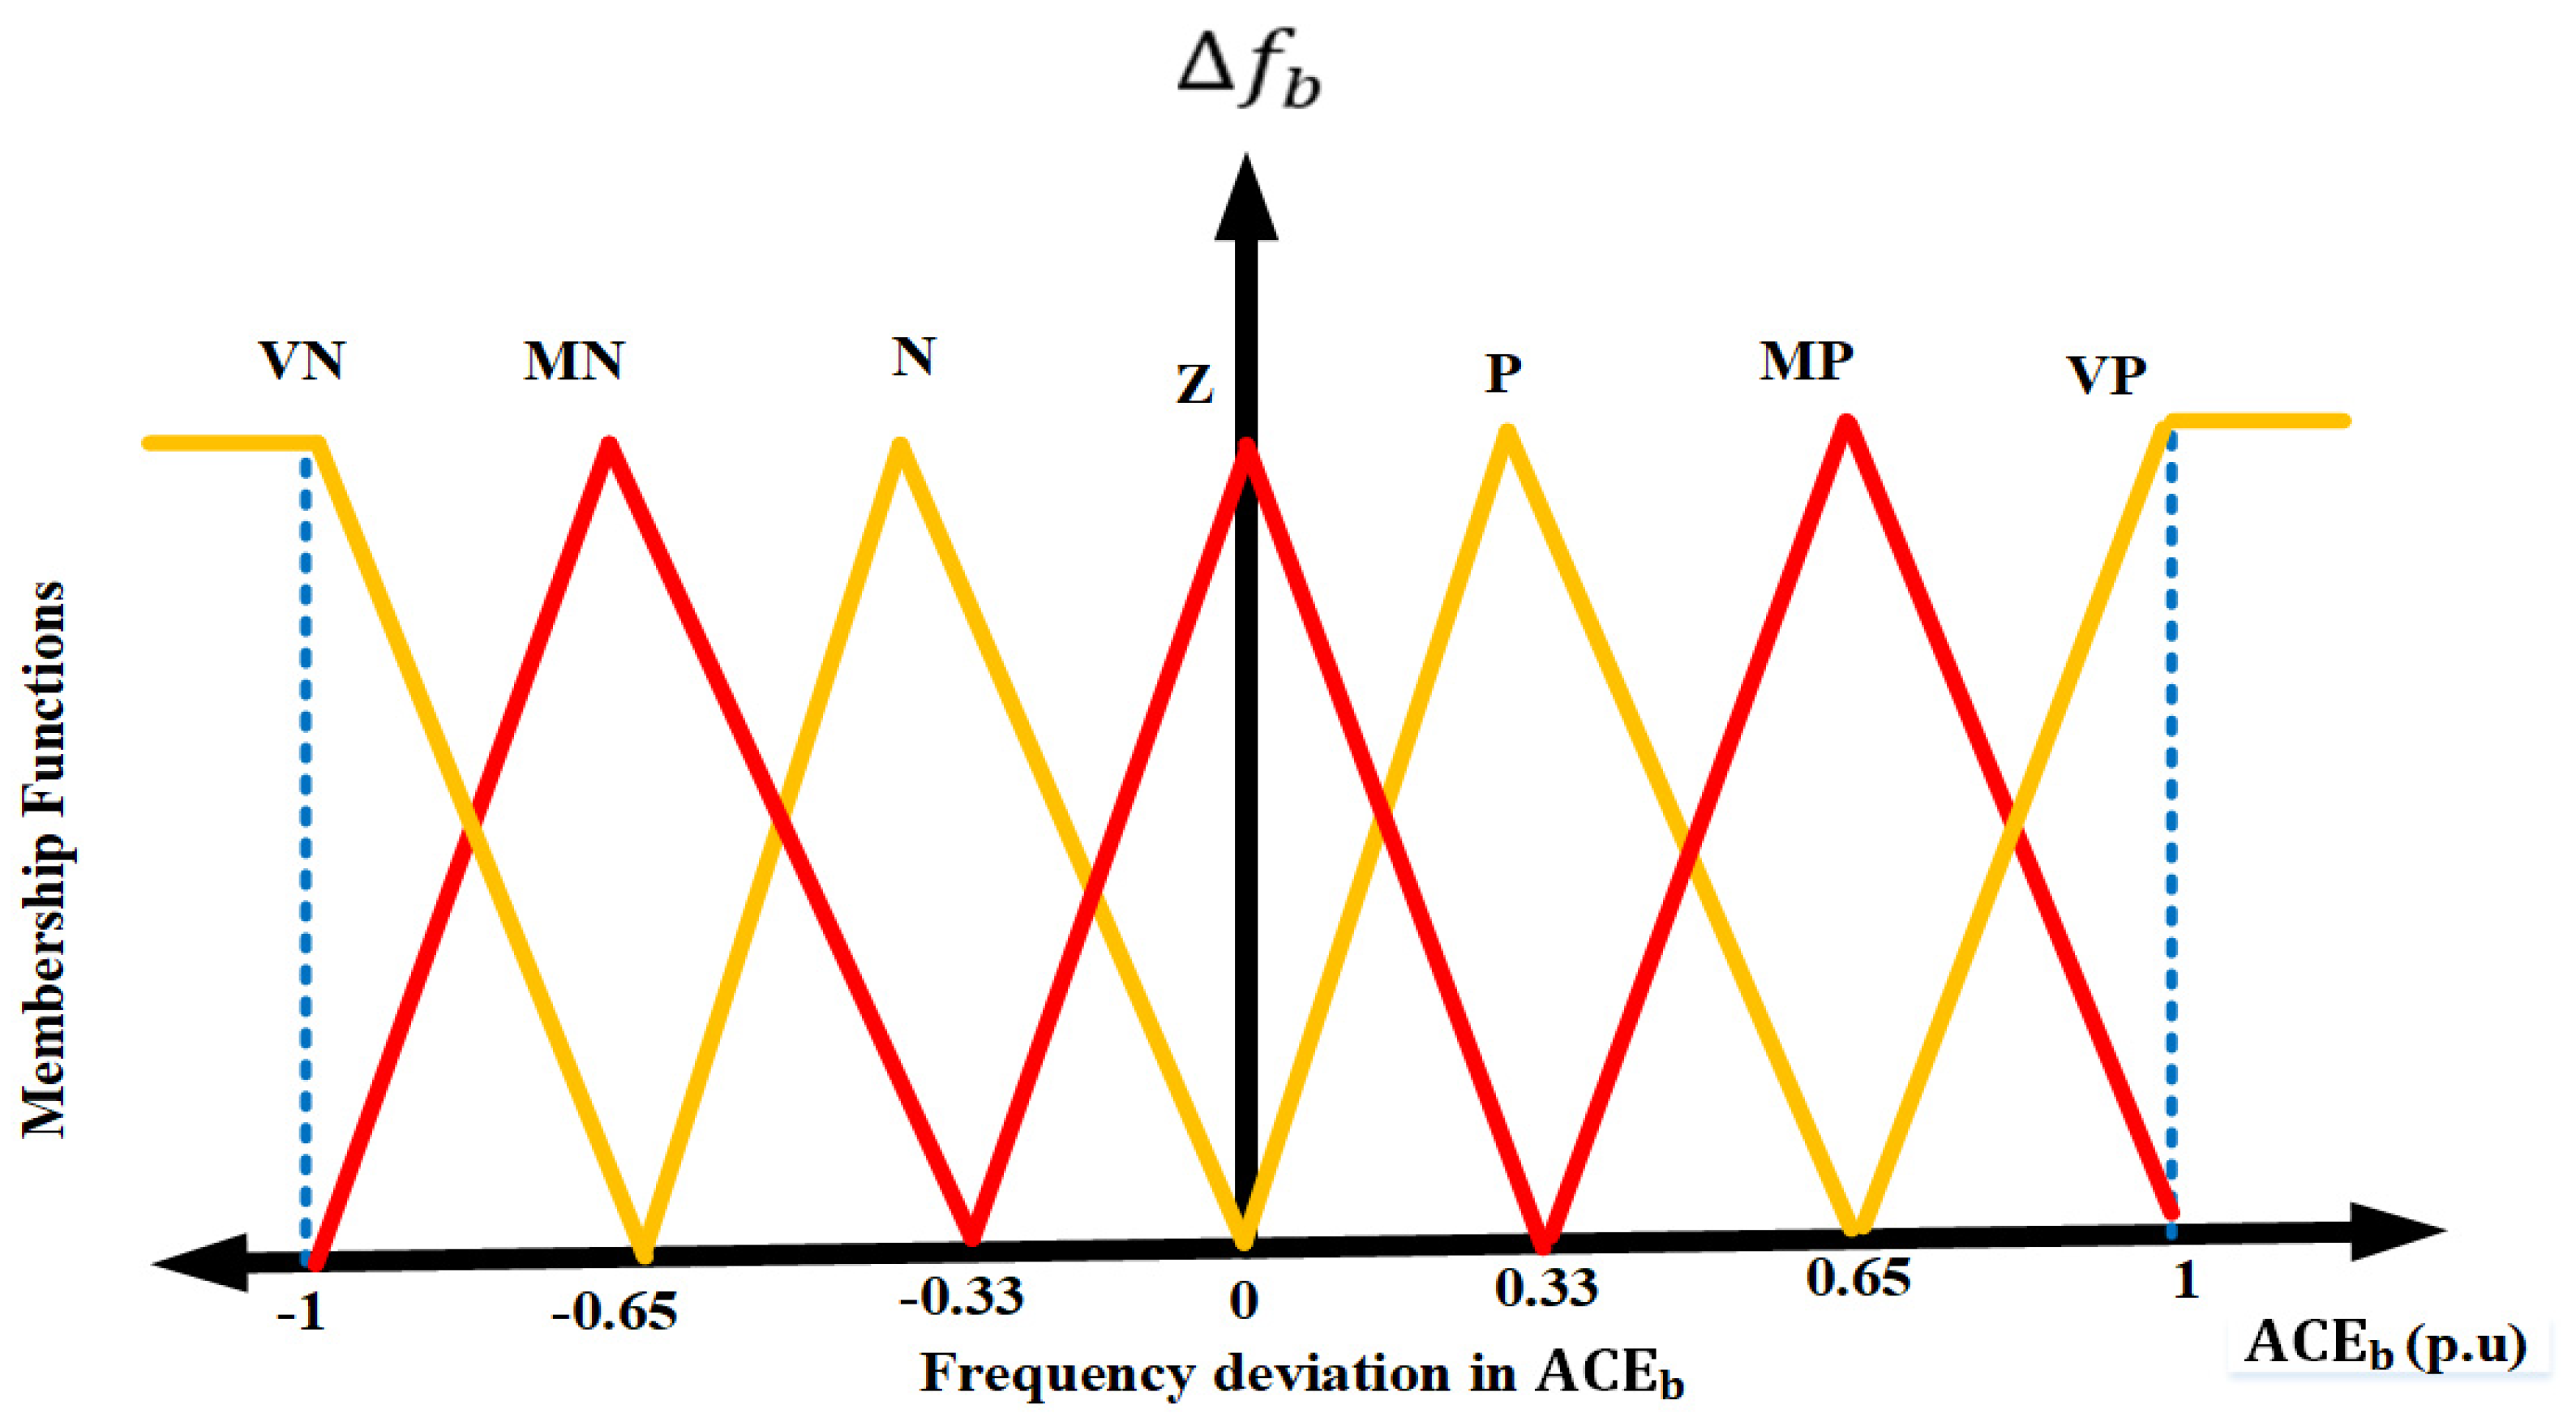
3.1. Fuzzy Logic Controller (FLC)

The particle swarm optimization (PSO) and genetic algorithm optimization toolbox (GAOT) algorithms are used to study frequency control based on the optimal values of the fuzzy controller parameters. In industry and power systems, FLC, adaptive control, and related controllers are extensively studied for diverse control objectives [34,35]. A PSO-based FLC scheme is presented to discover the required frequency regulation performance of the microgrid integrated with renewable energy sources, non-renewable energy sources, and prosumers. By using this strategy, the frequency changes produced by the stochastic nature of the renewable energy sources and critical loads are reduced to an acceptable range. The necessary gain values are multiplied by the inputs and outputs to bring them within a reasonable range for this objective. The inputs include Δ f ˙ and the rate of change of frequency deviation ( d Δ f ˙ ) and the delivered control signal is associated with a wide range of the operational points of the entities involved in FR.
Figure 6 depicts the FLC diagram of the two-area power system and the integrator of the FLC is represented by 1/S. In addition, e(t) denotes the error signal between the reference and measuring frequencies.
Fuzzification, fuzzy inference, and defuzzification are the three fundamental processes that make up a fuzzy system. The crisp inputs are first converted into fuzzy sets via the fuzzification procedure. The fuzzy inference process entails evaluating fuzzy rules with the AND/OR operator and employing fuzzy rules to analyze fuzzy sets. Finally, for crisp outputs, the defuzzification procedure combines fuzzy recommendations. The fuzzy logic control system with the two-area power system is shown in Figure 6, while Area a’s fuzzy membership function is shown in Figure 7, and Area a’s frequency deviation is shown in Figure 8, (A). The fuzzy membership function of Area (B) is depicted in Figure 9, and the frequency deviation of Area (B) is depicted in Figure 10. Table 1 illustrates the fuzzy control rules. The area control error and frequency deviation membership functions and the controller outputs are chosen to be identical to the triangle function for fuzzy logic control.
In a PSOS, frequency is a real-time dynamic variable that shows the balance of generation and load. In the proposed system, the power system operation states keeps frequency response within acceptable boundaries. These limitations are defined at two different levels: the operational range, which is equivalent to ±0.2 Hz (i.e., 49.8 Hz to 50.2 Hz), as well as the regulation limit, which is equal to 0.5 Hz (i.e., 49.5 Hz and 50.5 Hz). When the frequency drops significantly (below 49.2 Hz), a disconnection by low-frequency relays is provided for frequency regulation of both the generation and load.
The under-frequency control relay and the acceptable maximum frequency variation of Δ 0.5 Hz from the setpoint are used to define the membership function (typically set at 49.50 Hz). In addition, the frequency deviation membership function for a two area power system, as illustrated in Figure 8 and Figure 10, has characteristics of very negative (VN), medium negative (MN), negative, zero (Z), positive (P), medium positive and very positive (VP).
As a result, the fuzzy inference employs a table of fuzzy rules, including twenty-five distinct rules (see Table 1).

3.2. Particle Swarm Optimization (PSO)

A comparison of the PSO and GA, and evolutionary algorithms indicates that the overall most optimum results are achieved for PSO. Hence this research chose the PSO algorithm for further study. Accordingly, the fuzzy set theory was also applied for figuring out the most optimum compromised solution. The process and formulas involved in the solution are expressed in (21), and (22) [34]. A membership function denoted by μe is employed for representation of the eth objective function of the solution in Fe set. Figure 11 shows a schematic representation of the optimization procedure employed.
μ e = { 1 , | F e | | F e | m i n | F e | m a x | F e | | F e | m a x | F e | m i n , | F e | m i n < | F e | < | F e | m a x 0 , | F e | | F e | m a x  
μ θ = e = 1 N o b j ξ e μ e θ h = 1 H e = 1 N o b j ξ e μ e h        
where | F e | m a x and | F e | m i n , respectively, represent the maximum and minimum values for the eth objective function. The normalized membership function μθ for each solution θ, is computed as per (22). H denotes the number of possible solutions. The solution with the maximum μθ is found to be the most optimum solution. The weight coefficient of eth objective function is indicated by ξe.

4. Simulations and Results

The proposed two area power system is represented in Figure 12. The current research proposed an off-line optimization approach for an optimal coordinated control method for the participation of electric vehicles and generators in frequency regulation (FR). The decision variables in the current study are either FR capacity-allotted generators, and EVs or a multiple of the FR capacity referred to as ace signals for generators and EVs. Some considerations to consider in the implementation of this offline optimization process are: the power system should be subjected to sufficient load disturbances to create enough scenarios in high accuracy simulation conditions; and subjecting the system to several permutations of charge/discharge scenarios in various system operation states for optimum sampling. As a result, sufficient data will be available for optimized control strategy implementation for onsite operation. In addition, based on current system operation conditions, optimal charge/discharge power for individual EVs as per the timeliness requirement can also be obtained.
The simulation model is schematically represented in Figure 13 and was obtained through MATLAB/Simulink. Both the generators and EVs are the FR resources for area A and B. The parameters in a two-area interconnected system for the model are shown in Table 2, Table 3 and Table 4. Area control error (ACE) subjected to TBC control method was used for FR signal as indicated in (23).
A C E = Δ P t i e + B Δ f
The load fluctuations associated with normal systems of the system are captured through a series of random loads which fluctuate within a given range are connected in both areas A and B. The time period of the random fluctuating loads is set to 1 h to conform to the units of parameters. In addition, for simulation of the disturbed load in the abnormal power system state, two step loads, −0.8 MW and Pabnormal are added in areas A and B, respectively.

4.1. Optimization and Analysis of Control Strategy

In the current research the decision variables are either FR capacity-allocated generators and EVs or a multiple of the FR capacity termed as area control error (ace) signals for generators and EVs. Table 5 contains the relevant parameters [12]. For different states of the system, the optimization objectives are expressed as indicated in (6).

4.1.1. Normal State

There are considerable fluctuations in the normal states of the sum of power output of EVs and generators due to random loads. The total output power from EVs and generators are shown to increase as the Pnormal increases. The total output power from the EVs at each moment is miniscule, and hence can be considered negligible.

4.1.2. Abnormal State

In this state the power system operation is not safe, and the EVs and generator power complementarity can be utilized to restore the FD to normal state at the earliest instance. The generator output power in the abnormal state is found to increase with Pabnormal, while the EVs output power is at a maximum level at all times. The output power is characterized by a stable final value. The optimized influence of all the three objective expressions is equal to the minimum FD and remains the same throughout. Hence there is no relation between the output power and the ξabnormal-t. The EV power during the abnormal state is always found to be at maximum level, while in normal state the EVs output power is sometimes negligible. The EVs response speed and its FR accuracy along with the generator FR capacity in this case are utilized effectively. In addition, the FR cost is factored in during this state.

4.2. Simulation and Discussion
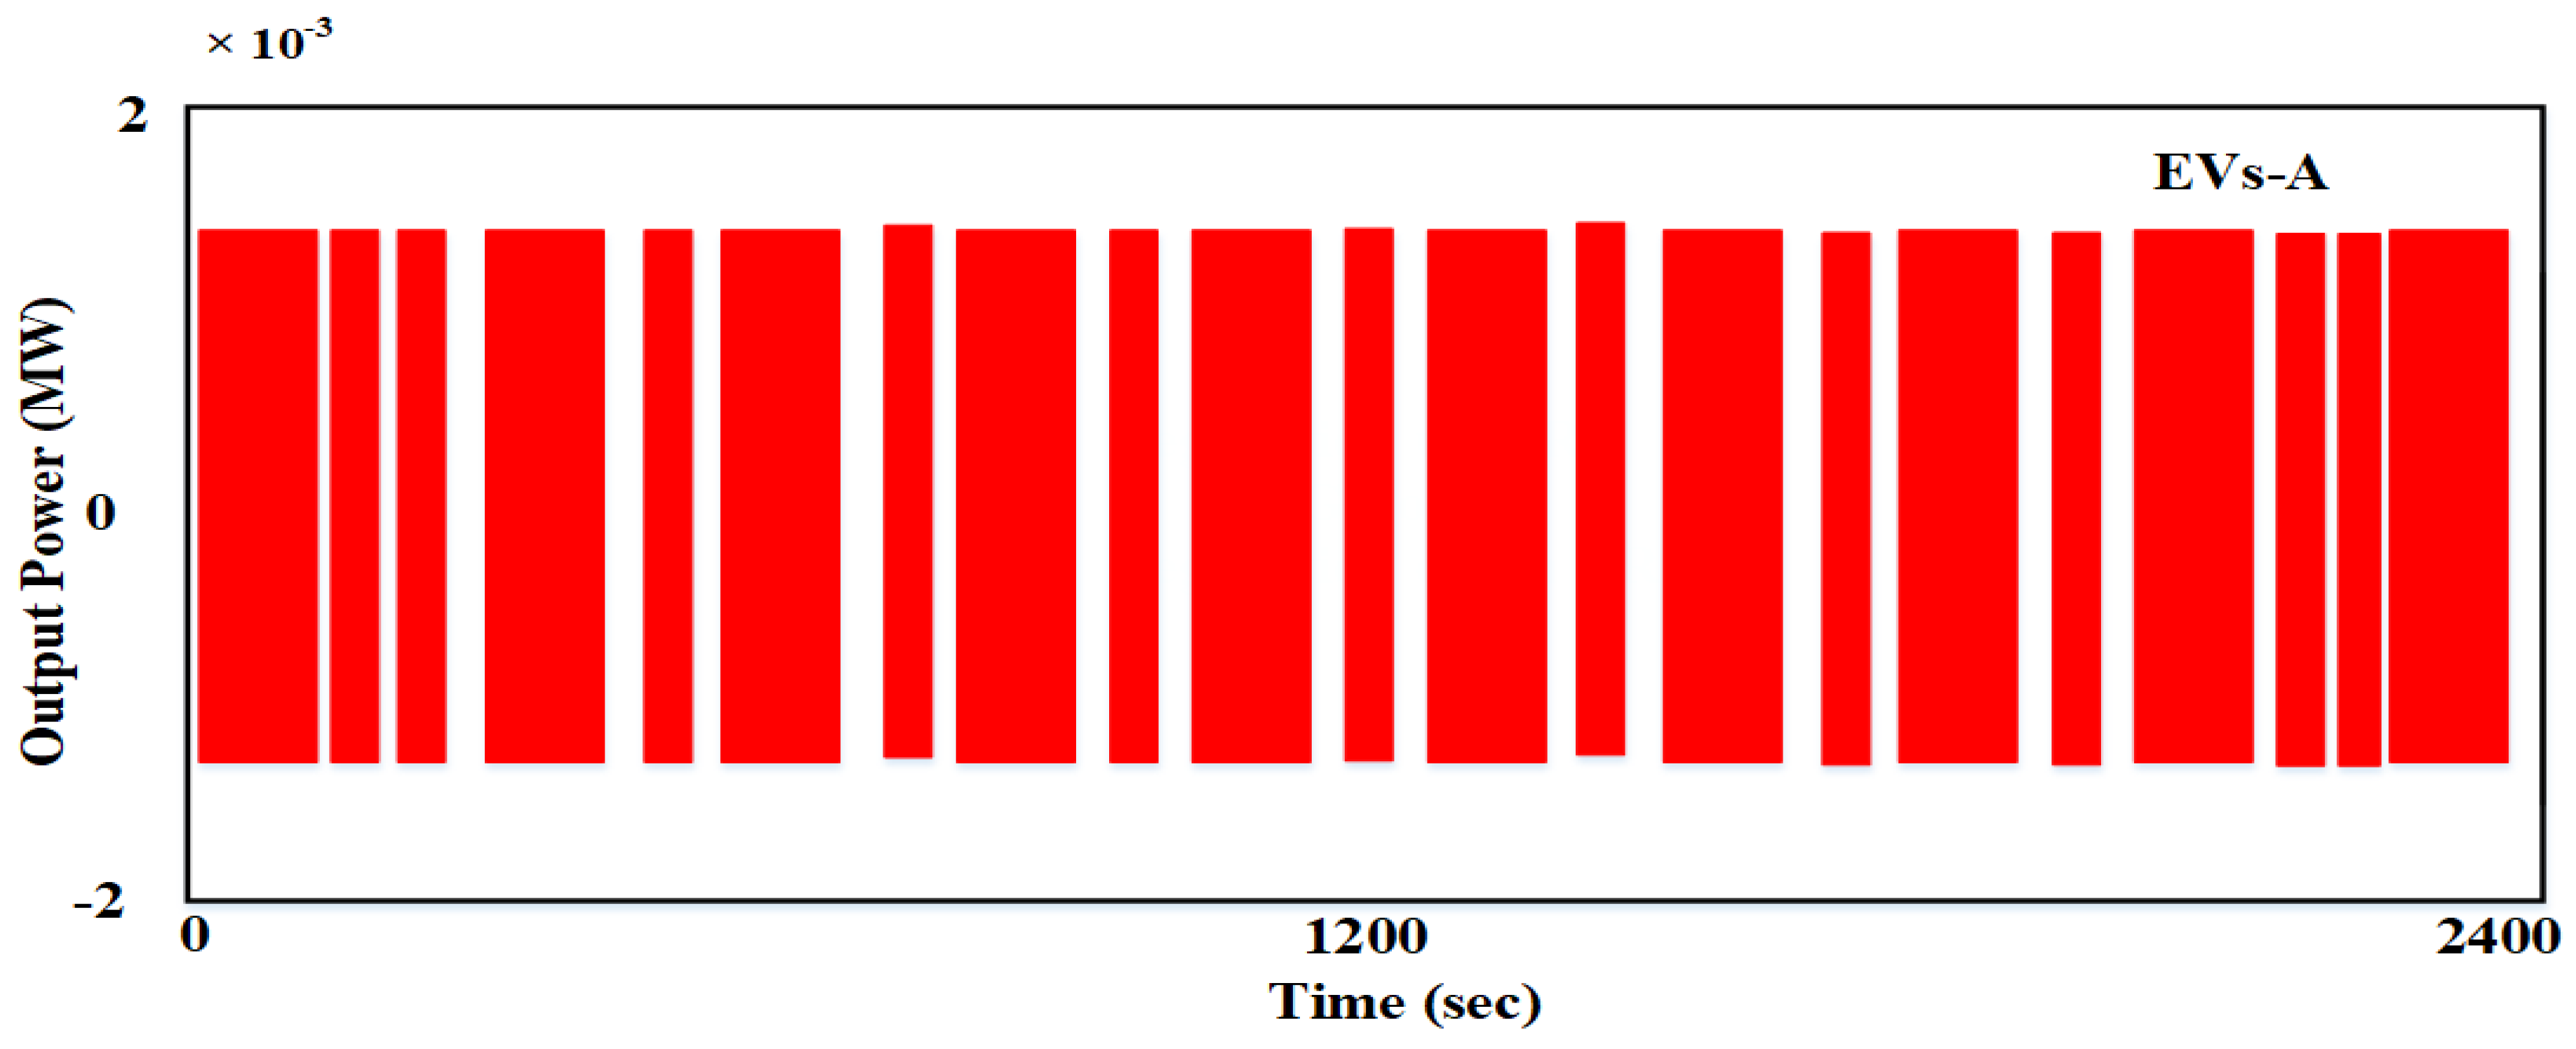
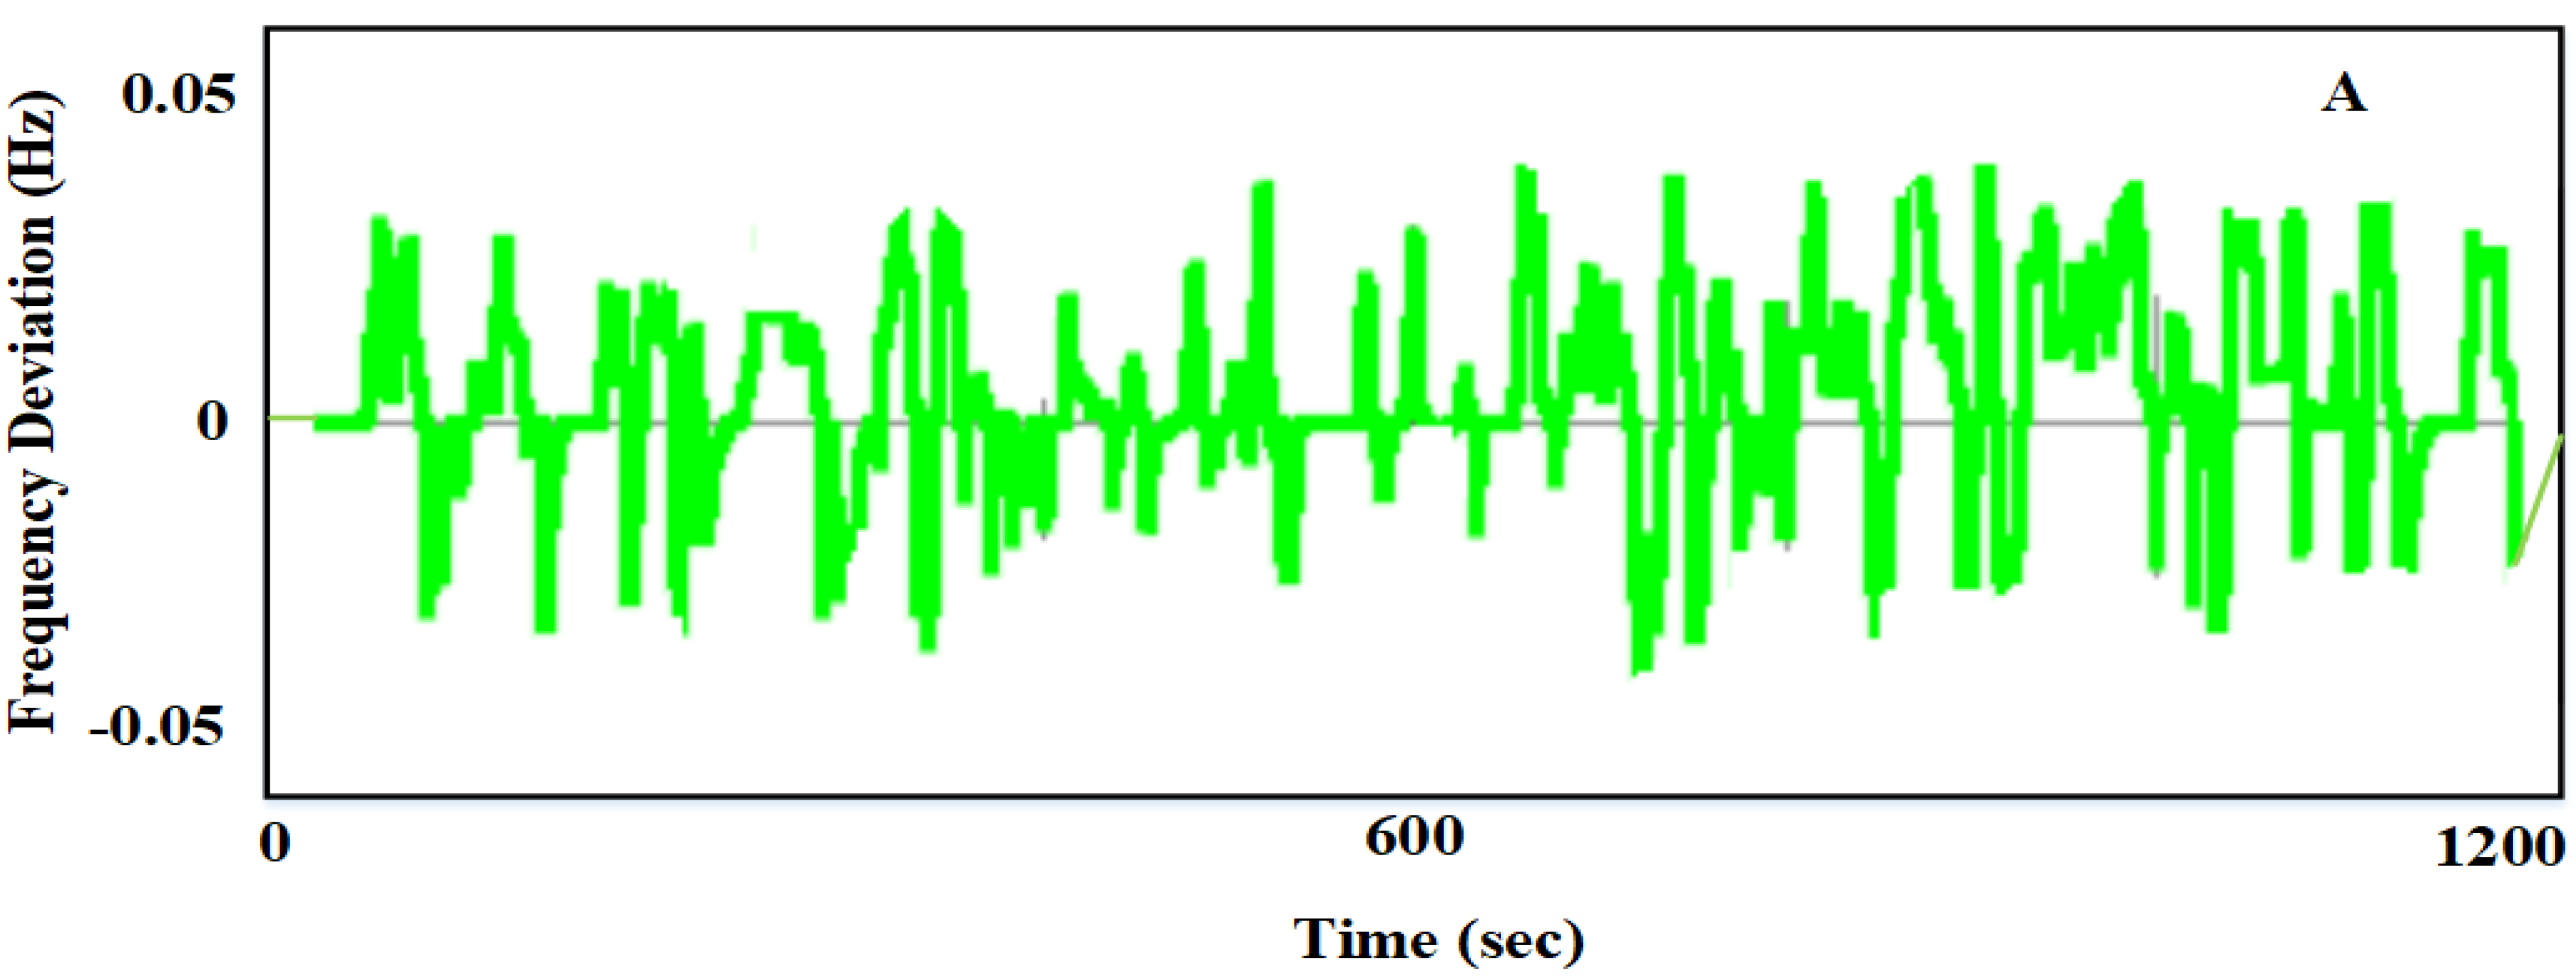
Figure 14, the upper area presents a schematic of an FR strategy termed STRATEGY 1. The FR control strategy taken from [13] is called as STRATEGY 2, where the control strategies and response preferences vary according to the varying operating states for FRRs. The FR control strategy obtained through the proposed optimization model presented in this paper, is called STRATEGY 3 here. The FR optimization strategy for the case when the number of EVs is increased to twice the original is termed as STRATEGY 3+.

4.2.1. Normal State

Distinct indicators at different system states were computed, as listed in Table 5, for evaluation of the effectiveness of the different FR control strategies. The random load formulated as in (24) and simulated as shown in Figure 14 was assumed to simulate normal distribution.
P random   ( t ) = μ + P normal   σ   rand   n  
where the term Prandom represents the load fluctuation in normal state of the system; μ and σ are the normal distribution function parameters and respectively equal to 0 and 0.388. Pnormal indicates the maximum value that the load fluctuation attains in most of time and is equal to 0.06 MW in Figure 14; randn is a random number in [0,1] standard normal distribution.
Figure 15, Figure 16, Figure 17, Figure 18, Figure 19 and Figure 20 present the output power obtained from different control strategies listed below. Both EVs and generators participated in FR in STRATEGY 1 and STRATEGY 2, while in STRATEGY 3 EVs did not participate in the FR activity, and hence the power output from the generators was the minimum in this case.
Figure 21, Figure 22 and Figure 23 represent the tie-line power output in the cases of the different strategies listed above. The tie-line power in the cases of STRATEGY 1 and STRATEGY 2 was evidently stable as compared to STRATEGY 3. This stems primarily from the fact that the FR power was least for STRATEGY 3.
Figure 24, Figure 25 and Figure 26 express the FD of the control strategies under consideration, and it is evident that the FR power was least for STRATEGY 3 here as well. The FD of this strategy, however, was less than the other strategies. From Table 6, it can be stated that STRATEGY 3 performed the most optimally in the FR effect, leading to a lower FR cost as compared with other configurations. This could be due to the constant random fluctuation of the loads. It is also evident that the FR cost of STRATEGY 3 was less as compared with STRATEGY 1, which could be due to the lower power output from the generators in STRATEGY 3. The FR results for STRATEGY 3 and STRATEGY 3+ were the same due to the lack of participation of EVs in FR.

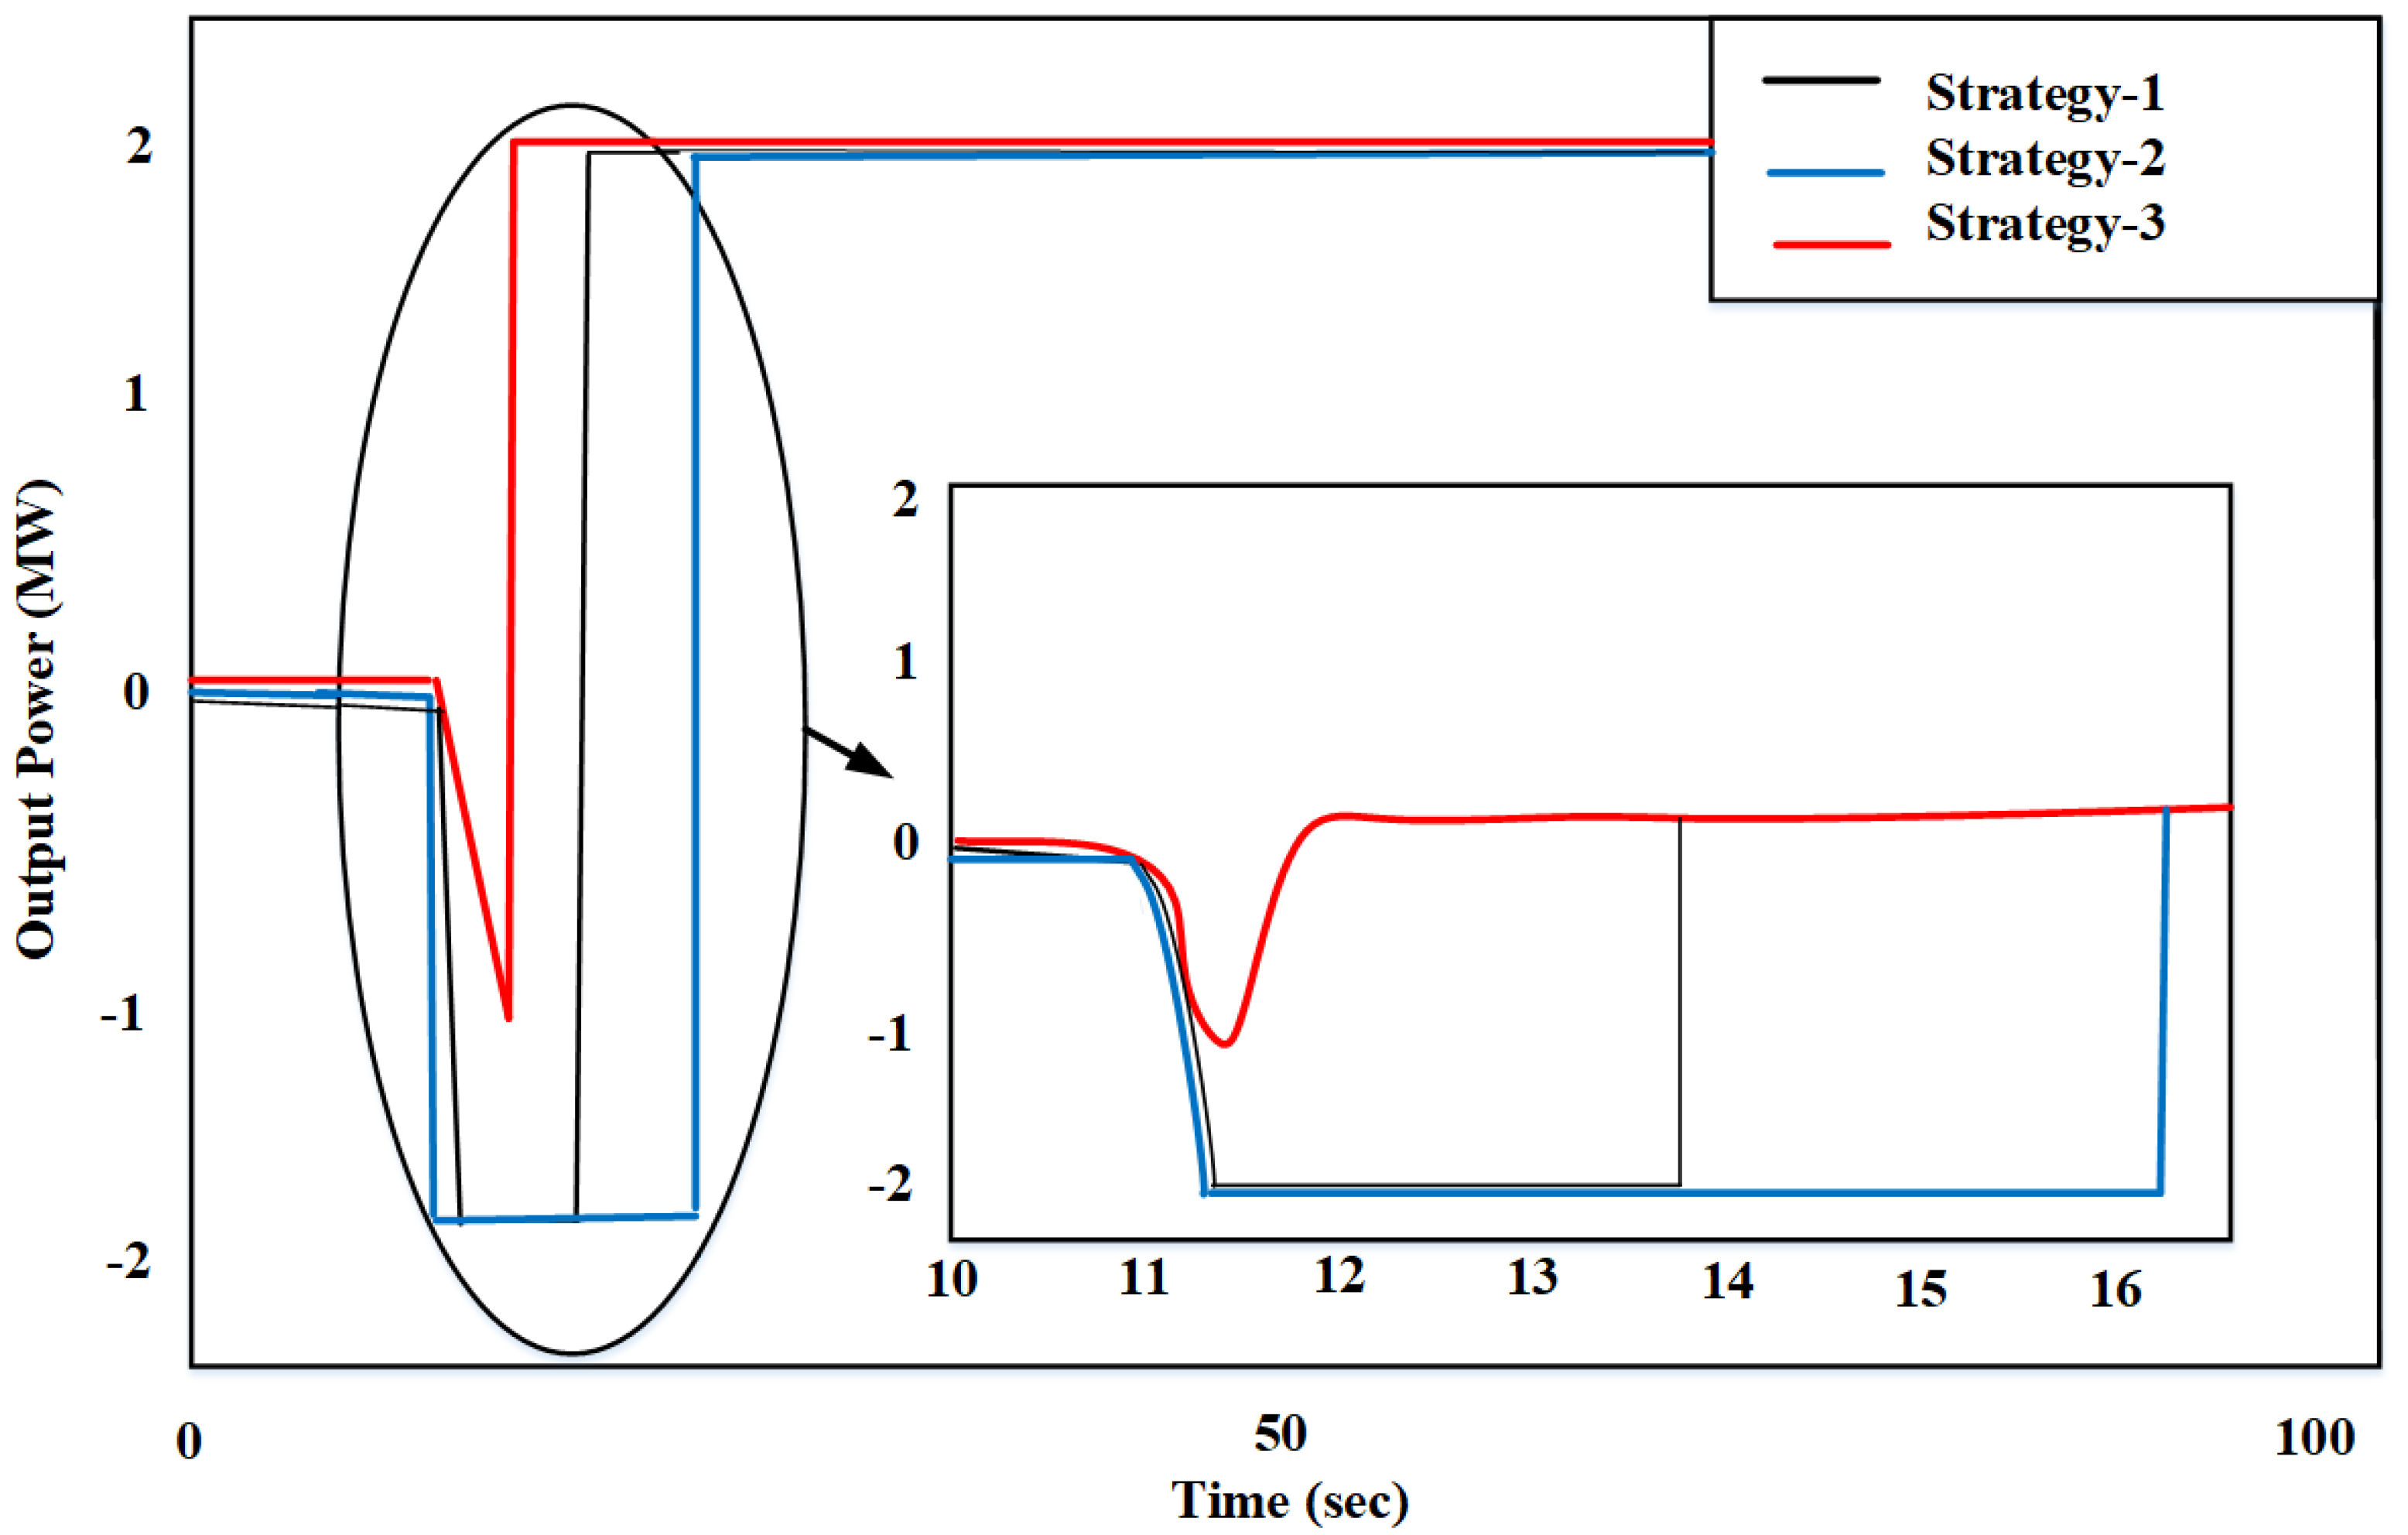
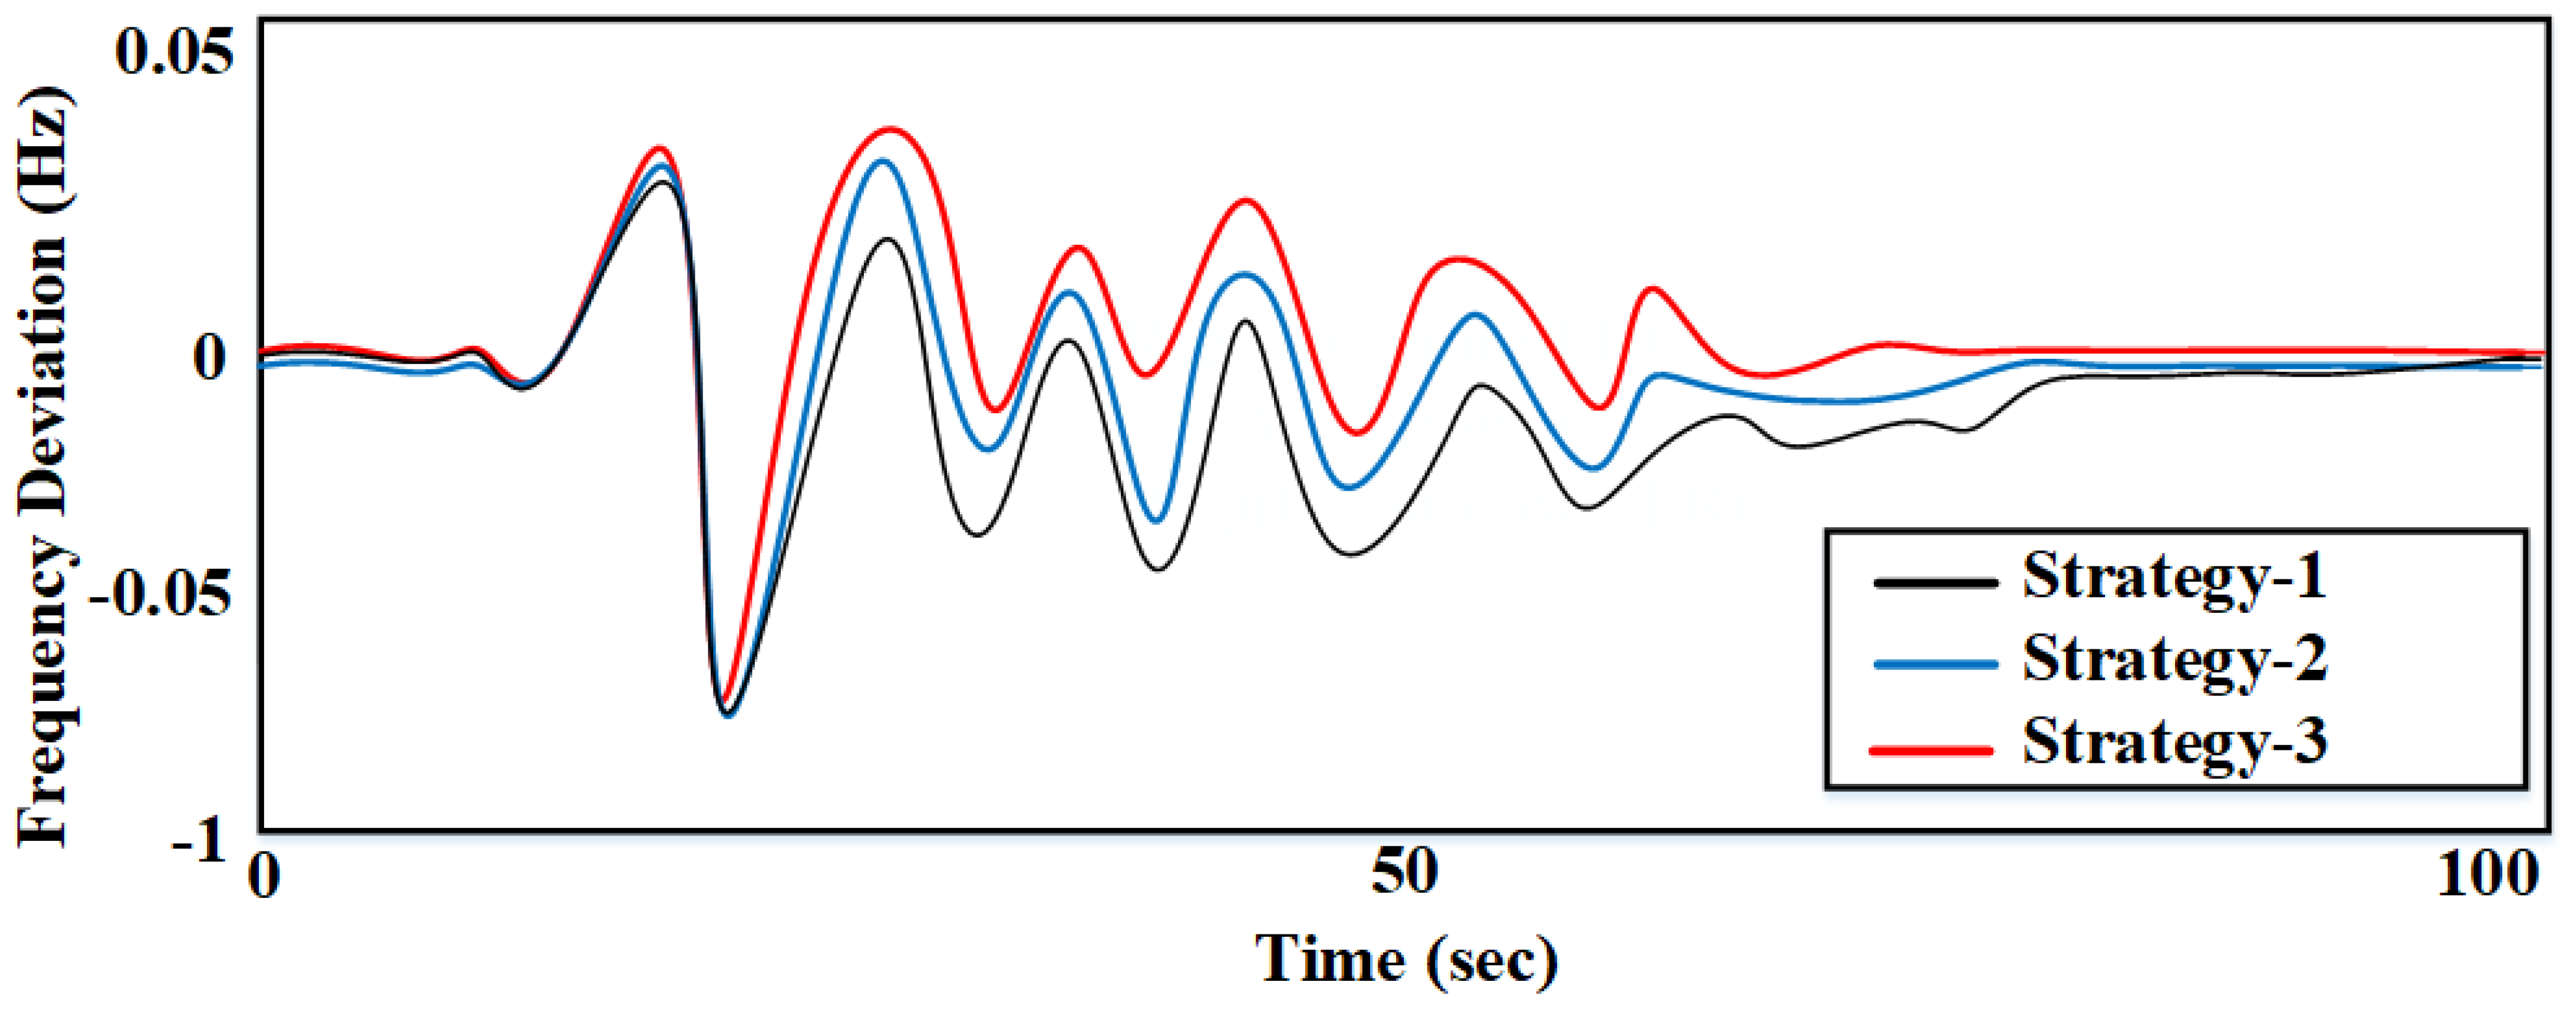
4.2.2. Abnormal State

In this state two loads of −0.8 MW, and 1.6 MW were added, respectively, at the 10th and 15th second in areas A and B, respectively. Figure 27 and Figure 28 present the power output for the different strategies for this state. It can be seen that EVs participated in FR where the ACE value reached response thresholds in STRATEGY 2. The output power of EVs in STRATEGY 3 responded much faster as compared with STRATEGY 1 and STRATEGY 2. The tie-line power for the different strategies along with the respective FD for the different strategies under consideration are given in Figure 29 and Figure 30, respectively. As is evident from Table 6, STRATEGY 3 performed the most optimally of all the strategies except STRATEGY 3+. This is due to the participation of more EVs in the FR and the concomitant quicker response power. The better performance of STRATEGY 3+ stems partially from the constraints on EV capacity.
The power system operation was comparatively safer and the FD fluctuation within a set range in the normal state. Hence, the FR cost reduction could accrue less FR resources. On the other hand, the only goal in the abnormal state of operation is system security improvement. Hence, the advantages accrued informing of FR accuracy and response speed should be utilized.
The output power from the generator was optimally less, and that of EVs was the minimum possible in normal state of operation for optimized results. Moreover, the output power from the EVs approached maximum values and therefore the remainder of FR power was all that was available from the generators output power in the abnormal state.

5. Conclusions

This paper presented an optimal control method for EV participation in frequency regulation under varying PSOSs. The complementary nature of the EVs and generators in different PSOSs configurations was employed. The power in normal state was found to be comparatively safer, whereas there was a need for timely restoration of FD to be within the normal range in the abnormal state of operations. In a normal state of operation, the optimization objective was based on the minimization of FR costs factoring in the cost of battery degradation, while in the abnormal state the optimization objective was based on the minimization of frequency restoration time. The FR costs associated with EVs came out to be higher in the current research, however the response speed was comparatively faster. Disturbed loads in the form of a series of random loads with a 1 h time period, and a step load were added for simulation of the power system. Accordingly, an optimal coordinated control principle was drawn between the EVs and generators. In a normal state the EVs and generator output power came out to be lower, while in an abnormal state the EVs’ output power was found to be more than that of the generators. The simulation in this research proved the existence of a cost reduction in FR for a normal state of operation. Moreover, the recovery time for frequency, and the FD improved significantly in an abnormal state by the employment of the proposed model.

6. Future Recommendations

  • It would be fascinating to add EVs into the security-constrained unit commitment (SCUC) framework, which will describe the dynamic behavior of EVs during both primary and secondary frequency control.
  • A procedure might be designed to better assure the requisite performance for the primary frequency control by simulation analysis.
  • A suitable pricing mechanism might be established in spot marketplaces to characterize both power and associated services.

Author Contributions

Conceptualization, S.I. and S.H.; methodology, S.I. and S.H.; software, S.H., S.I., N.H.K. and M.A. (Muhammad Ali); validation, E.M.A., S.H. and M.A. (Muhammad Aurangzeb), formal analysis, E.M.A., S.H. and S.I.; investigation, S.I. and S.H.; resources, S.H. and E.M.A.; writing—original draft preparation, S.I. and S.H.; writing—review and editing, S.I.; E.M.A.; N.H.K., M.A. (Muhammad Ali), M.A. (Muhammad Aurangzeb) and S.H.; visualization, N.H.K., M.A. (Muhammad Aurangzeb), M.A. (Muhammad Ali) and E.M.A.; supervision, S.H. and E.M.A.; project administration, E.M.A. and S.H.; funding acquisition, E.M.A. All authors have read and agreed to the published version of the manuscript.

Funding

This research received no external funding.

Institutional Review Board Statement

Not Applicable.

Informed Consent Statement

Not Applicable.

Data Availability Statement

Not Applicable.

Conflicts of Interest

The authors declare no conflict of interest.

Abbreviations

PSOSsPower system operation states
EVElectric vehicle
MGMicrogrid
FRFrequency regulation
V2GVehicle-to-grid
FDFrequency deviation
SOCState of charge
PSO Particle swarm optimization
FLCFuzzy logic control
RES Renewable energy sources
GAOTGenetic algorithm optimization toolbox
CSOCharging station operator
DRDemand response
DGDiesel generator
ECPExpected charging power
VNVery negative
MNMedium negative
MPMedium positive
VP Very positive
ACEArea control error

References

  1. Rehman, H.U.; Yan, X.; Abdelbaky, M.A.; Jan, M.U.; Iqbal, S. An advanced virtual synchronous generator control technique for frequency regulation of grid-connected PV system. Int. J. Electr. Power Energy Syst. 2021, 125, 106440. [Google Scholar] [CrossRef]
  2. Kazemi, M.V.; Sadati, S.J.; Gholamian, S.A. Adaptive Frequency Control of Microgrid Based on Fractional Order Control and a Data-Driven Control with Stability Analysis. IEEE Trans. Smart Grid 2021, 13, 381–392. [Google Scholar] [CrossRef]
  3. Ahmed, E.M.; Mohamed, E.A.; Elmelegi, A.; Aly, M.; Elbaksawi, O. Optimum modified fractional order controller for future electric vehicles and renewable energy-based interconnected power systems. IEEE Access 2021, 9, 29993–30010. [Google Scholar] [CrossRef]
  4. Zecchino, A.; D’Arco, S.; Endegnanew, A.G.; Korpås, M.; Marinelli, M. Enhanced primary frequency control from EVs: A fleet management strategy to mitigate effects of response discreteness. IET Smart Grid 2019, 2, 436–444. [Google Scholar] [CrossRef]
  5. Tushar, M.H.K.; Zeineddine, A.W.; Assi, C. Demand-side management by regulating charging and discharging of the EV, ESS, and utilizing renewable energy. IEEE Trans. Ind. Inform. 2017, 14, 117–126. [Google Scholar] [CrossRef]
  6. Yumiki, S.; Susuki, Y.; Oshikubo, Y.; Ota, Y.; Masegi, R.; Kawashima, A.; Ishigame, A.; Inagaki, S.; Suzuki, T. Autonomous Vehicle-to-Grid Design for Provision of Frequency Control Ancillary Service and Distribution Voltage Regulation. arXiv 2021, arXiv:2101.10518. [Google Scholar] [CrossRef]
  7. Di Somma, M.; Graditi, G.; Heydarian-Forushani, E.; Shafie-Khah, M.; Siano, P. Stochastic optimal scheduling of distributed energy resources with renewables considering economic and environmental aspects. Renew. Energy 2018, 116, 272–287. [Google Scholar] [CrossRef]
  8. Pal, A.; Bhattacharya, A.; Chakraborty, A.K. Placement of Public Fast-Charging Station and Solar Distributed Generation with Battery Energy Storage in Distribution Network Considering Uncertainties and Traffic Congestion. J. Energy Storage 2021, 41, 102939. [Google Scholar] [CrossRef]
  9. Di Somma, M.; Graditi, G.; Siano, P. Optimal bidding strategy for a DER aggregator in the day-ahead market in the presence of demand flexibility. IEEE Trans. Ind. Electron. 2018, 66, 1509–1519. [Google Scholar] [CrossRef]
  10. Nosratabadi, S.M.; Hooshmand, R.-A.; Gholipour, E. A comprehensive review on microgrid and virtual power plant concepts employed for distributed energy resources scheduling in power systems. Renew. Sustain. Energy Rev. 2017, 67, 341–363. [Google Scholar] [CrossRef]
  11. Aurangzeb, M.; Xin, A.; Iqbal, S.; Jan, M.U. An Evaluation of Flux-Coupling Type SFCL Placement in Hybrid Grid System Based on Power Quality Risk Index. IEEE Access 2020, 8, 98800–98809. [Google Scholar] [CrossRef]
  12. Iqbal, S.; Xin, A.; Jan, M.U.; Abdelbaky, M.A.; Rehman, H.U.; Salman, S.; Rizvi, S.A.A.; Aurangzeb, M. Aggregation of EVs for Primary Frequency Control of an Industrial Microgrid by Implementing Grid Regulation & Charger Controller. IEEE Access 2020, 8, 141977–141989. [Google Scholar] [CrossRef]
  13. Kong, Q.; Fowler, M.; Entchev, E.; Ribberink, H.; McCallum, R. The role of charging infrastructure in electric vehicle implementation within smart grids. Energies 2018, 11, 3362. [Google Scholar] [CrossRef] [Green Version]
  14. Habib, S.; Khan, M.M.; Abbas, F.; Ali, A.; Hashmi, K.; Shahid, M.U.; Bo, Q.; Tang, H. Risk Evaluation of Distribution Networks Considering Residential Load Forecasting with Stochastic Modeling of Electric Vehicles. Energy Technol. 2019, 7, 1900191. [Google Scholar] [CrossRef]
  15. Gazafroudi, A.S.; Corchado, J.M.; Keane, A.; Soroudi, A. Decentralised flexibility management for EVs. IET Renew. Power Gener. 2019, 13, 952–960. [Google Scholar] [CrossRef]
  16. Haque, A.; Kurukuru, V.S.B.; Khan, M.A. Stochastic methods for prediction of charging and discharging power of electric vehicles in vehicle-to-grid environment. IET Power Electron. 2019, 12, 3510–3520. [Google Scholar] [CrossRef]
  17. Hu, X.; Martinez, C.M.; Yang, Y. Charging, power management, and battery degradation mitigation in plug-in hybrid electric vehicles: A unified cost-optimal approach. Mech. Syst. Signal Process. 2017, 87, 4–16. [Google Scholar] [CrossRef]
  18. Cai, S.; Matsuhashi, R. Model Predictive Control for EV Aggregators Participating in System Frequency Regulation Market. IEEE Access 2021, 9, 80763–80771. [Google Scholar] [CrossRef]
  19. Jan, M.U.; Xin, A.; Rehman, H.U.; Abdelbaky, M.A.; Iqbal, S.; Aurangzeb, M. Frequency Regulation of an Isolated Microgrid With Electric Vehicles and Energy Storage System Integration Using Adaptive and Model Predictive Controllers. IEEE Access 2021, 9, 14958–14970. [Google Scholar] [CrossRef]
  20. Ali, H.H.; Fathy, A.; Kassem, A.M. Optimal model predictive control for LFC of multi-interconnected plants comprising renewable energy sources based on recent sooty terns approach. Sustain. Energy Technol. Assess. 2020, 42, 100844. [Google Scholar] [CrossRef]
  21. Dechanupaprittha, S.; Jamroen, C. Self-learning PSO based optimal EVs charging power control strategy for frequency stabilization considering frequency deviation and impact on EV owner. Sustain. Energy Grids Netw. 2021, 26, 100463. [Google Scholar] [CrossRef]
  22. Wang, J.; Bharati, G.R.; Paudyal, S.; Ceylan, O.; Bhattarai, B.P.; Myers, K.S. Coordinated electric vehicle charging with reactive power support to distribution grids. IEEE Trans. Ind. Inform. 2018, 15, 54–63. [Google Scholar] [CrossRef]
  23. Habib, S.; Khan, M.M.; Abbas, F.; Numan, M.; Ali, Y.; Tang, H.; Yan, X. A framework for stochastic estimation of electric vehicle charging behavior for risk assessment of distribution networks. Front. Energy 2019, 14, 298–317. [Google Scholar] [CrossRef]
  24. Shahab, M.; Wang, S.; Junejo, A.K. Improved control strategy for three-phase microgrid management with electric vehicles using multi objective optimization algorithm. Energies 2021, 14, 1146. [Google Scholar] [CrossRef]
  25. Jan, M.U.; Xin, A.; Abdelbaky, M.A.; Rehman, H.U.; Iqbal, S. Adaptive and Fuzzy PI Controllers Design for Frequency Regulation of Isolated Microgrid Integrated With Electric Vehicles. IEEE Access 2020, 8, 87621–87632. [Google Scholar] [CrossRef]
  26. Khooban, M.H.; Gheisarnejad, M. A novel deep reinforcement learning controller based type-II fuzzy system: Frequency regulation in microgrids. IEEE Trans. Emerg. Top. Comput. Intell. 2020, 5, 689–699. [Google Scholar] [CrossRef]
  27. Peng, C.; Zou, J.; Lian, L.; Li, L. An optimal dispatching strategy for V2G aggregator participating in supplementary frequency regulation considering EV driving demand and aggregator’s benefits. Appl. Energy 2017, 190, 591–599. [Google Scholar] [CrossRef]
  28. Khamies, M.; Magdy, G.; Kamel, S.; Khan, B. Optimal model predictive and linear quadratic gaussian control for frequency stability of power systems considering wind energy. IEEE Access 2021, 9, 116453–116474. [Google Scholar] [CrossRef]
  29. Iqbal, S.; Xin, A.; Jan, M.U.; Abdelbaky, M.A.; Rehman, H.U.; Salman, S.; Rizvi, S.A.A. V2G Strategy for Primary Frequency Control of an Industrial Microgrid Considering the Charging Station Operator. Electronics 2020, 9, 549. [Google Scholar] [CrossRef] [Green Version]
  30. Wang, K.; Qiao, Y.; Xie, L.; Li, J.; Lu, Z.; Yang, H. A Fuzzy Hierarchical Strategy for Improving Frequency Regulation of Battery Energy Storage System. J. Mod. Power Syst. Clean Energy 2021, 9, 689–698. [Google Scholar] [CrossRef]
  31. Dong, C.; Sun, J.; Wu, F.; Jia, H. Probability-Based Energy Reinforced Management of Electric Vehicle Aggregation in the Electrical Grid Frequency Regulation. IEEE Access 2020, 8, 110598–110610. [Google Scholar] [CrossRef]
  32. Zecchino, A.; Prostejovsky, A.M.; Ziras, C.; Marinelli, M. Large-scale provision of frequency control via V2G: The Bornholm power system case. Electr. Power Syst. Res. 2019, 170, 25–34. [Google Scholar] [CrossRef]
  33. Khan, W.; Ahmad, F.; Alam, M.S. Fast EV charging station integration with grid ensuring optimal and quality power exchange. Eng. Sci. Technol. Int. J. 2019, 22, 143–152. [Google Scholar] [CrossRef]
  34. Sánchez-Sáinz, H.; García-Vázquez, C.A.; Llorens Iborra, F.; Fernández-Ramírez, L.M. Methodology for the optimal design of a hybrid charging station of electric and fuel cell vehicles supplied by renewable energies and an energy storage system. Sustainability 2019, 11, 5743. [Google Scholar] [CrossRef] [Green Version]
  35. Shayeghi, H.; Rahnama, A.; Alhelou, H.H. Frequency control of fully-renewable interconnected microgrid using fuzzy cascade controller with demand response program considering. Energy Rep. 2021, 7, 6077–6094. [Google Scholar] [CrossRef]
Figure 1. Contribution in FR of a schematic framework for an integrated microgrid for electric vehicle coordination with charging stations and the EV Aggregator.
Sustainability 14 03108 g001
Figure 2. The dynamic model of electric vehicle.
Sustainability 14 03108 g002
Figure 3. Electric vehicle battery degradation cost.
Sustainability 14 03108 g003
Figure 4. The relationship between expected charging power (ECP), expected SOC, and plug-in duration.
Sustainability 14 03108 g004
Figure 5. The state of charge of EVs output power.
Sustainability 14 03108 g005
Figure 6. Fuzzy logic controller.
Sustainability 14 03108 g006
Figure 7. Membership functions of area control error (A).
Sustainability 14 03108 g007
Figure 8. Frequency deviation in ACEa.
Sustainability 14 03108 g008
Figure 9. Membership function of area control (B).
Sustainability 14 03108 g009
Figure 10. Frequency deviation in ACEb.
Sustainability 14 03108 g010
Figure 11. Hierarchical optimization operation.
Sustainability 14 03108 g011
Figure 12. A two-area interconnected power system for regulation with EVs.
Sustainability 14 03108 g012
Figure 13. Control strategy of two area power systems.
Sustainability 14 03108 g013
Figure 14. Hourly load fluctuation with different Areas.
Sustainability 14 03108 g014
Figure 15. The EVs with STRATEGY 1 (EVs-A), output power in normal conditions.
Sustainability 14 03108 g015
Figure 16. The EVs with STRATEGY 2 (EVs-B), output power in normal conditions.
Sustainability 14 03108 g016
Figure 17. The EVs with STRATEGY 3 (EVs-C), output power in normal conditions.
Sustainability 14 03108 g017
Figure 18. The generators with STRATEGY 1 (Gen-1), output power in normal conditions.
Sustainability 14 03108 g018
Figure 19. The generators with STRATEGY 2 (Gen-2) output power in normal conditions.
Sustainability 14 03108 g019
Figure 20. The generators with STRATEGY 3 (Gen-3),) output power in normal conditions.
Sustainability 14 03108 g020
Figure 21. The tie-line power in the normal state with STRATEGY 1 (A).
Sustainability 14 03108 g021
Figure 22. The tie-line power in the normal state with STRATEGY 2 (B).
Sustainability 14 03108 g022
Figure 23. The tie-line power in the normal state with STRATEGY 3 (C).
Sustainability 14 03108 g023
Figure 24. Frequency deviation in the normal condition with STRATEGY 1 (A).
Sustainability 14 03108 g024
Figure 25. Frequency deviation in the normal condition with STRATEGY 2 (B).
Sustainability 14 03108 g025
Figure 26. Frequency deviation in the normal condition with STRATEGY 3 (C).
Sustainability 14 03108 g026
Figure 27. In the abnormal state, the output power of electric vehicles with various tactics (Strategies 1–3).
Sustainability 14 03108 g027
Figure 28. In the abnormal state, the output power of generators with various tactics (Strategies 1–3).
Sustainability 14 03108 g028
Figure 29. In an abnormal operating state, the tie-line power with strategies.
Sustainability 14 03108 g029
Figure 30. In the abnormal operation state, frequency deviation with various strategies.
Sustainability 14 03108 g030
Table 1. Fuzzy Rules.
∆ACE∆f
VNMNNZPMPVP
VNVPVPVPMPMPPZ
MNVPMPMPMPPZN
NVPMPPPZNMN
ZMPMPPZNMNMN
PMPPZNNMNVN
MPPZNMNMNMNVN
VPZNMNMNVNVNVN
VN: very negative MN: medium negative N: negative. Z: zero P: positive MP: medium positive VP: very positive.
Table 2. Simulink Parameters.
Parametric ValuesValueParametric ValuesValue
Prosed network (MW)10frequency (Hz)50
TG-a, and TG-b (s)0.5Da and Db (MW/Hz)1/6
TCH-a, and TCH-b0.8Ra and Rb (Hz/MW)0.3
TRH-a, and TRH-b (s)10kr-a and kr-b (MW/Hz/s)2/15
Ma, and Mb (MW/Hz/s)2.0FHP-a, and FHP-b30%
Table 3. Electric vehicle charging station (CS) parameters.
Parametric ValuesValue
Coefficient of EVs frequency kEV-a, kEV-b (MW/Hz)1.12
Battery gain of electric vehicle1
Times constant of EV battery filter1 s
Area-A EV fleet800
Area-B EV fleet800
Area-A generators1
Area-B generators1
Table 4. Electric vehicle (EVs) parameters.
Parametric SymbolsValueElectric Vehicle State of ChargeQuantity
Battery capacity (mAH)509040
State of charge minimum (%)0.18065
State of charge of maximum (%)0.97092
SO io0.660275
Δ P m a x D , i 2550105
Δ P m a x C , i
K
ζ’
25
0.8
0.8
40
30
20
10
75
55
25
30
Table 5. Parametric values of frequency regulation cost.
Parametric SymbolsValueElectric Vehicle State of ChargeQuantity
Cit ($/h)10C1, C20.8
ait ($/MWh)9r1, r2[0,1]
bit ($/MWh2)0vx, mj, vx, EVj[−1,1]
Qpr,it ($/MWh)10Particles100
α ($/MWh2)3.8 × 10−4Iterations100
β ($/MWh2)7.6 × 10−4ωM, ωEV1
ζnormal,−fmaximum1ζabnormal,−faverage1
ζnormal,−faverage1ζabnormal,−faverage1
ζnormal,−cost1ζabnormal,−t1
Table 6. Output Results of different strategies.
Parametric ValuesValueParametric ValuesValue
Frequency deviation max (FD) (Hz)0.05530.05430.0549
Frequency deviation avg (FD) (Hz)0.01210.01230.0105
Normal stateFrequency regulation cost of gen275.18210.35230.01
Frequency regulation cost of electric vehicles ($)540.38480.620
Total Cost ($)815.50695.97230.00
Frequency deviation max (FD) (Hz)0.95680.95430.9346
Abnormal stateFrequency deviation avg (FD) (Hz)0.01330.01330.0095
Restore time (s)84.2584.2442.99
Publisher’s Note: MDPI stays neutral with regard to jurisdictional claims in published maps and institutional affiliations.

