Article

Facilitating Safe FFF 3D Printing: A Prototype Material Case Study

by
Panagiotis Karayannis
1,
Stratos Saliakas
1,
Ioannis Kokkinopoulos
1,
Spyridon Damilos
1,
Elias P. Koumoulos
1,*,
Eleni Gkartzou
2,
Julio Gomez
3 and
Constantinos Charitidis
2
1
IRES—Innovation in Research & Engineering Solutions, Rue Koningin Astridlaan 59B, 1780 Wemmel, Belgium
2
School of Chemical Engineering, R-Nano Lab, Laboratory of Advanced, Composite, Nanomaterials and Nanotechnology, National Technical University of Athens, 15773 Athens, Greece
3
Avanzare Innovacion Tecnologica S.L., Av. Lentiscares 4-6, 26370 Navarrete, Spain
*
Author to whom correspondence should be addressed.
Sustainability 2022, 14(5), 3046; https://doi.org/10.3390/su14053046
Submission received: 25 January 2022 / Revised: 1 March 2022 / Accepted: 3 March 2022 / Published: 4 March 2022
(This article belongs to the Special Issue Sustainability of Additive Manufacturing and 3D-Printed Parts)

Abstract

:
Three-dimensional (3D) printing has introduced a paradigm shift in the manufacturing world, and it is increasing in popularity. In cases of such rapid and widespread acceptance of novel technologies, material or process safety issues may be underestimated, due to safety research being outpaced by the breakthroughs of innovation. However, a definitive approach in studying the various occupational or environmental risks of new technologies is a vital part of their sustainable application. In fused filament fabrication (FFF) 3D printing, the practicality and simplicity of the method are juxtaposed by ultrafine particle (UFP) and volatile organic compound (VOC) emission hazards. In this work, the decision of selecting the optimal material for the mass production of a microfluidic device substrate via FFF 3D printing is supported by an emission/exposure assessment. Three candidate prototype materials are evaluated in terms of their comparative emission potential. The impact of nozzle temperature settings, as well as the microfluidic device’s structural characteristics regarding the magnitude of emissions, is evaluated. The projected exposure of the employees operating the 3D printer is determined. The concept behind this series of experiments is proposed as a methodology to generate an additional set of decision-support decision-making criteria for FFF 3D printing production cases.

1. Introduction

1.1. Additive Manufacturing

The International Organization for Standardization (ΙSO) defines additive manufacturing (AM) as “the process of joining materials to make parts based on computer-generated 3D model data, usually layer upon layer, as opposed to subtractive manufacturing and formative manufacturing methodologies” [1]. Additive manufacturing is considered by part of the research community to be a revolutionary enabler for the manufacturing sector, assisting in overcoming many of the barriers posed by conventional manufacturing techniques [2]. Since the first conception and implementation of additive manufacturing in 1984 by 3D Systems [3], this technological area has experienced massive breakthroughs. A multitude of AM techniques have been developed [4] and are projected to be applied in a wide field of applications, including the automotive industry [5], medicine [6], and aerospace [7]. In recent years, technological advances in the world of AM have resulted in fascinating achievements, including the 3D printing of graphene aerogels [8] and the bio-printing of several types of tissues and organs [9].
The fundamental operating principles of manufacturing objects based on computer design files, layer by layer, in an additive conceptual scheme leads to the following advantages, compared to traditional subtractive methods [10]:
  • On-demand part manufacturing, with the potential to remove barriers posed by remote manufacturing and the delivery of parts, as well as the need to maintain a large inventory.
  • Economical production of small batches.
  • Individual customization of print objects and the uncomplicated redesign of parts.
  • Small waste generation.
  • Straightforward supply chains and a reduced need for tooling.
  • The increased involvement of consumers in the manufacturing process, as 3D printing files can be distributed and will enable printing in non-professional settings.
  • Synergistic capabilities with 3D scanning technologies, enabling the cost-effective replication of scanned objects, a highly beneficial feature for areas such as personalized medicine [11] and historical building restoration [12].
It is sensible to suggest that safety-related studies of AM should focus on emphasizing and accentuating these beneficial elements of AM, while also highlighting any safety risks and defining the best approach to mitigate them, in order to render AM’s full establishment into the manufacturing world easier to achieve.

1.2. Fused Filament Fabrication

The most common and widely investigated AM technique is fused filament fabrication (FFF), which is a material extrusion-based technology. This technique involves the heating of solid thermoplastic filament feedstock close to the applied material’s melting point, with the subsequent passage through an extrusion nozzle and the programmed extrusion of the resulting semi-liquid material. The object is formed layer by layer, based on the design file, through the coordinated deposition and movement of the nozzle and/or the print bed platform. The platform is heated in most printer devices, as an assistive feature for layer adhesion [1]. FFF allows the use of a multitude of filament materials, such as the ordinarily applied polylactide (PLA) and acrylonitrile butadiene styrene (ABS), as well as nylon, polyethylene terephthalate glycol (PETG), polycarbonate (PC), and high-impact polystyrene (HIPS). The variety of available feedstock materials, along with the technique’s low cost and easy application, have contributed to its surging growth [4].

1.2.1. The Emission Potential of the FFF Technique

As demonstrated in the 3D printing emission/exposure assessment literature [13], fused filament fabrication (FFF) activities can lead to exposure to ultrafine particles (UFP) and volatile organic compounds (VOCs). Ultrafine particles have been defined as a concerning issue with regard to deteriorating air quality, due to their association with negative health effects [14].
Nozzle temperature is recognized as the main determinant factor for emission levels, with UFP concentrations often varying by multiple orders of magnitude at different temperatures. The bed temperature and the nozzle diameter, as well as most printing parameters, can affect emissions to different degrees. The choice of filament material heavily affects all aspects of particle releases, while its chemical composition determines the species of the emitted VOCs [13,15]. Many VOCs species that have been detected during 3D printing activities have hazardous effects; for example, styrene is released when printing with ABS materials [16]. Interestingly, while 3D printing is not a process that commonly involves nanomaterials, the fact that the main exposure concerns in these processes are nanoparticles/ultrafine particles emitted from the polymer’s partial decomposition renders the process widely compatible with being assessed via the methodologies and techniques developed in the nanosafety research field.
Early research on the measurement of emissions caused by fused filament fabrication generally targeted the most widely used FFF materials, PLA, and ABS filaments [17]. In general, PLA is considered one of the low-emitting, comparatively safer materials, while ABS has been demonstrated to possess high emission profiles for both ultrafine particles and VOCs [13,15]. Other common materials, such as nylon, may display intermediate emission hazards [18], while specific unconventional materials, such as laywood, may present high UFP emission potential [19]. In the last two years, the research focus has shifted considerably to the study of less common materials, while the inclusion of (nano)additives has been examined as well.
Bernatikova et al. [20] evaluated the UFP and VOC emissions of PETG and co-polyester (NGEN) filaments, using an enclosed printer. Potentially harmful particle emission rates were reported, and the presence of VOCs was confirmed, although at a low level. Dunn et al. [21] investigated the exposure to ultrafine particles caused by printing filaments that contain carbon nanotubes (CNTs) and carbon nanofibers (CNFs) in concentrations of up to 25% and 30%, respectively. While concentration increases were observed for all materials when measuring emissions inside an enclosure, no deviation from the background was recorded for the workroom, even when using 6 printers simultaneously. This was attributed to the high ventilation flow rate applied. Zhu et al. [22] examined the particulate matter (PM) and VOC concentrations resulting from the inclusion of lignocellulose in PLA filaments, while Alberts et al. [23] studied the impact of copper and tungsten additives in the emission profiles of filaments inside a chamber, showing increased emissions for the additivated filaments.
The morphology of emitted particles is a less widely examined field and, when assessing the connected risks, they are usually evaluated in terms of spherical particles. However, Kartz et al. [24] found that emissions consist mainly of fractal particles that can penetrate deeper into the lungs than spheres of equivalent volume, which finding was established after performing TEM analysis on particles collected during 3D printing.
The mechanism of UFP generation has been discussed previously in the literature. The formation of semi-volatile compounds (SVCs) leads to the generation of ultrafine particles released during thermal decomposition [25], which are transferred by the airflow patterns. As the process progresses, there is further growth of the UFP, either by the emitted SVCs attracted to the surface of the UFP or by the agglomeration of the particles as a result of particle-particle interaction. During printing, there is a dynamic balance between particle generation and removal, due to diffusion, deposition, and particle agglomeration, showing a decrease in the generated UFP matter during printing conditions [26].
Expanded emission research on the topic of unique, additivated, and prototype filament materials will most certainly support the application of new materials in the FFF technique, thus extending its technological value.

1.2.2. Toxicity of the Emitted Particles

A limited number of toxicity studies of fused filament fabrication 3D printer emissions have been carried out so far, focusing primarily on ABS materials. In terms of in vitro studies, Farcas et al. [27] evaluated the toxicity of 3D printing emissions with ABS filaments in an in vitro model, using human small-airway epithelial cells. At 24 h post-exposure, ABS emissions caused significant dose-dependent cytotoxicity, oxidative stress, apoptosis, necrosis, and the production of pro-inflammatory cytokines and chemokines in epithelial cells. Furthermore, Zhang et al. [18] found that ABS emissions from a consumer-level 3D printer caused decreased cell viability, increased oxidative stress, and inflammatory responses in rat alveolar macrophages and human tumorigenic lung epithelial cells.
In terms of in vivo studies, Farcas et al. [28] examined repeated whole-body inhalation exposure to FFF 3D printing emissions that were released from ABS filament in commercially available desktop 3D printers. This was tested in rats for 4 h/day for 1, 4, 8, 15, and 30 days of exposure (4 days/week). The authors observed that 3D printing emissions caused minimal and transient pulmonary and systemic effects on rats. The study concludes that the potential of further acute and chronic inflammatory responses is high, especially regarding the use of multiple printers and printing of prolonged duration.
Stefaniak et al. [29] investigated the acute toxic effects of ABS emissions on cardiovascular function via a nose-only inhalation study in rats. Exposure to 1 mg/m3 of ABS emission for 3 h induced significantly higher mean arterial pressure, along with elevated resting arteriolar tone and impaired endothelium-dependent arteriolar dilation. These results indicated that the 3D printer emissions could potentially induce systemic toxic effects.
Gumperlein et al. [30] conducted a randomized, cross-over design study, where healthy human volunteers were exposed to ABS 3D printer emissions for 1 h. No acute effects on the inflammatory markers in nasal secretions or urine were found. However, a slight increase in exhaled nitric oxide was noted, which could be induced by eosinophilic inflammation from inhaled UFPs. These findings may indicate a connection with the results of Stefaniak et al. [29], as a correlation between lower concentrations of circulating nitric oxide, high arterial pressure, and impaired arteriolar dilation is common among many species [31,32].
Moreover, in a health survey, Chan et al. [33] found that about 60% of participants using 3D printing in commercial prototyping businesses, educational institutions, and public libraries reported weekly respiratory symptoms. The same study also determined that working with it for more than 40 h per week was significantly associated with asthma or allergic rhinitis diagnosis. In addition, House et al. [34], in a case report study, found that a self-employed businessman with a history of childhood asthma operated ten 3D printers with ABS filaments in a small work area and after 10 days of working with ABS printing, he experienced chest tightness, shortness of breath, and coughing.
The research generally points toward the need for additional examinations to further clarify the expected toxicological effects of 3D printing emissions.

1.2.3. Novel FFF Materials

Using the FFF technique with novel or additivated materials has been explored for various high-performance [35] or unique property applications [36]. In such cases, the use of customized prototype filament feedstock materials may be preferred for tailoring the properties as required. Specialized filaments may be produced by means of the incorporation of additives with special properties (e.g., nanomaterials, flame-resistant additives, metal particles) to a commonly used thermoplastic feedstock matrix. Using nanomaterials containing filaments can offer unique properties, such as electrical conductivity [37]. The nano-inclusions introduce additional parameters, such as interparticle distance and the orientation of nanoparticles [38], that may influence printability and end-product properties. Composite filaments, such as filaments containing short carbon fibers, can be used for achieving higher strength, stiffness, and dimensional stability [39]. Printing with other unique filaments, such as foaming filament [40], requires precise control procedures for crucial print parameters, such as a variable nozzle temperature and extrusion rate. These unique materials are, unsurprisingly, demanding in terms of printability assessment. Quite importantly, the introduction of unique additives can also significantly influence occupational and environmental emissions and exposure potential. It is reasonable to assume that the emission profile of the prototype materials will not be definitely known; therefore, a quick and effective preliminary emission assessment before commencing the mass production of parts would be vital for process safety optimization.

1.2.4. FFF and Microfluidics

The FFF technique is currently gaining increasing interest in the fabrication of microfluidic devices. Glass and silicon—and later, polydimethylsiloxane (PDMS) [41]—have been the traditional materials by way of manufacturing microfluidic platforms via photolithography, soft lithography, and micromachining [42]. However, such techniques require an in-depth knowledge of operating specialized equipment, as well as the investment needed for purchasing such devices. FFF is considered an economically viable alternative for the machining of microfluidic devices using PMMA, PLA, and ABS filaments down to approx. 300 μm channels [41,43], due to the lower cost of the equipment, the ease of direct-printing the devices, the wider variety of polymer materials, the lower temperature conditions required, and the wider accessibility of FFF to research groups of different backgrounds [44]. However, the need for post-processing, such as the removal of the support structures, the long manufacturing times (especially for larger pieces), the surface roughness, and imperfect sealing between the 3D printed layers minimize the applicability of FFF [42]. Another issue is air entrapment between the printed layers, lowering the visibility of translucent polymers [41].
In this context, the EU-funded project “M3DLoC” [45] (Grant Agreement 760662, Horizon 2020) deals with the development of a pilot line for the manufacturing of PLA microfluidic devices with conductive channels (using nano-enabled conductive inks), implementing FFF, that can be used as lab-on-chip platforms. The pilot line employs FFF technology for the manufacturing of polymer substrates, followed by additional workstations for processing the device, and then quality assurance stations. The FFF technique is a vital element of the M3DLoC pilot line and the production of biomedical microelectromechanical systems (BIOMEMS) for the production of PLA-based substrates with or without additive nanomaterials in the polymer matrix. Therefore, the exposure assessment work described herein is an important supportive component to the safe setup and operation of this innovative pilot line.

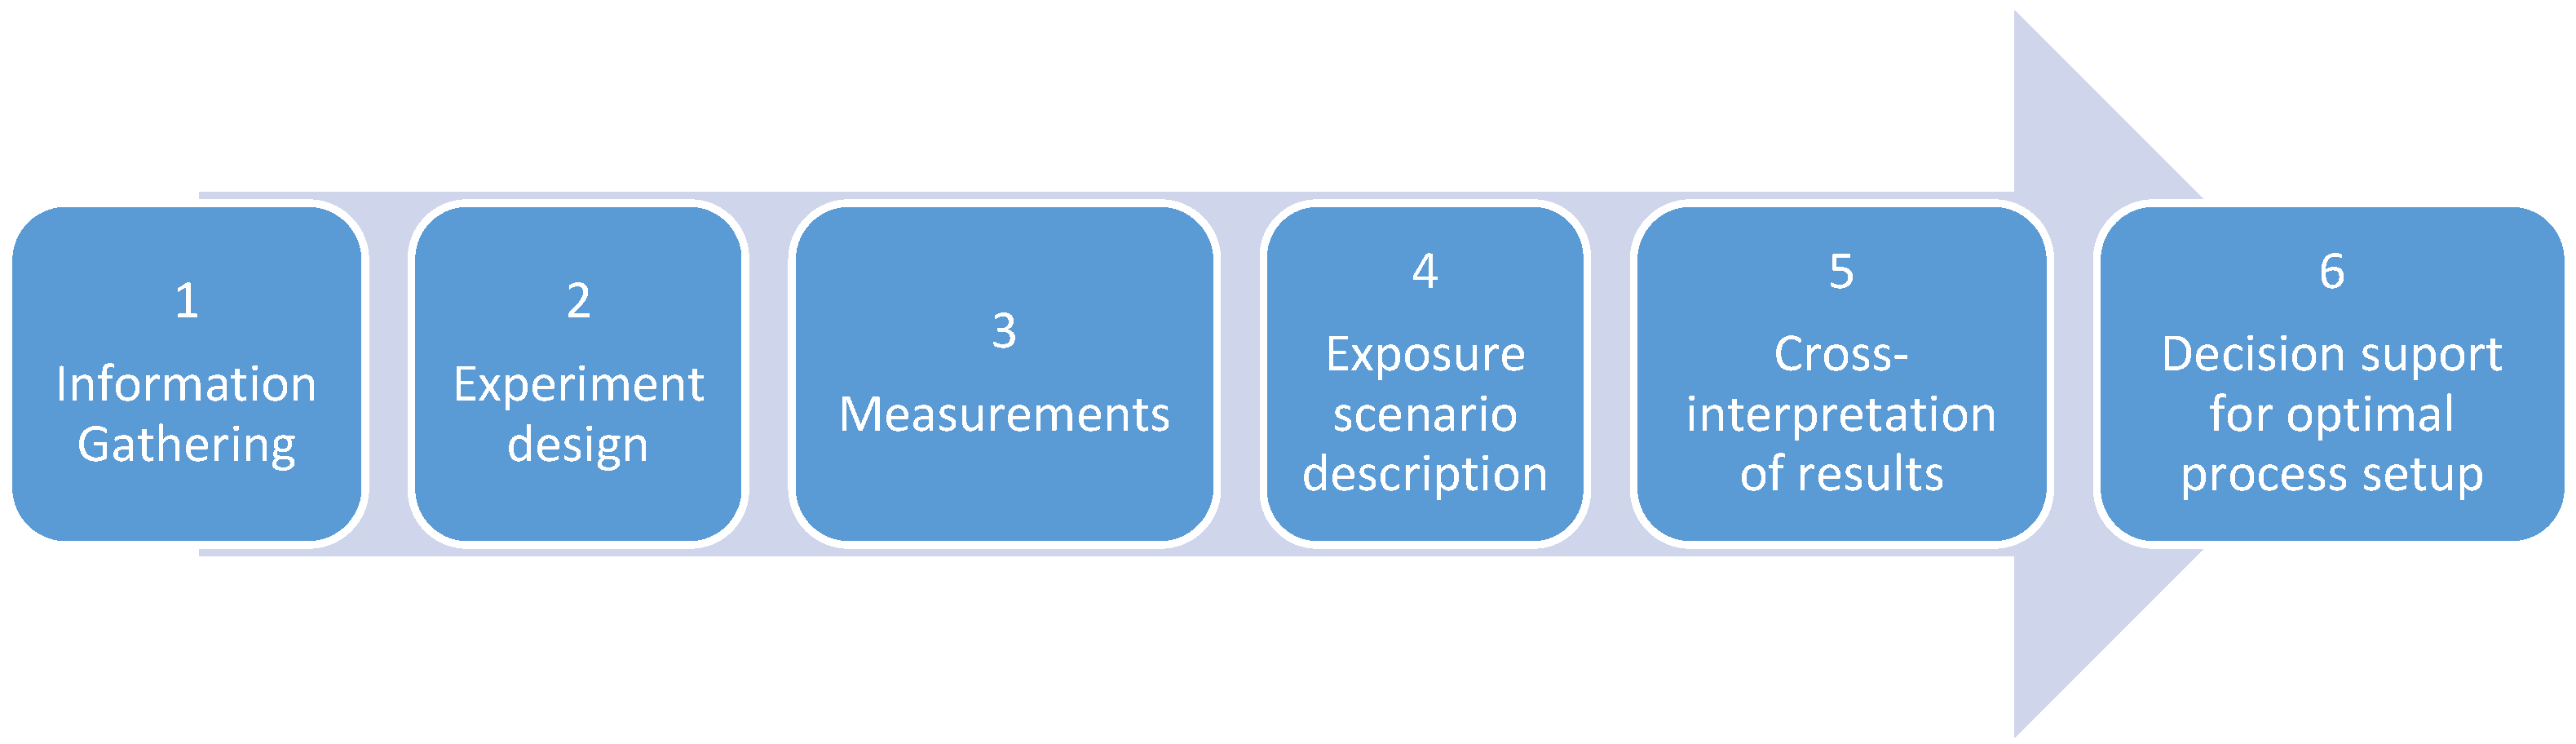
1.3. Utility of a Production Goal-Based Assessment

In this study, a production goal-based emission and exposure assessment is presented, from study conception and setup, to analysis, outputs, and decision support-oriented conclusions. A number of emission/exposure assessment tests were set up and performed, using the candidate materials for manufacturing the polymer substrate of the microfluidic device. The data produced are valuable for future decision support regarding the optimal material and process configuration. The integrated workflow as a whole is presented as a suggested approach that can be followed in terms of identifying emission safety issues and defining the most appropriate material and process alternatives. The proposed methodology can provide a basis for implementation in cases of similar scope and can be applied by the relevant stakeholders or safety experts (e.g., safety engineers, exposure assessors, and safety consultants).

2. Materials and Methods

2.1. Materials

In the framework of a M3DLoC project, PLA-blends and compounds were investigated, as part of a material development workflow for FFF processability enhancement and bulk modification with additives targeted toward application-specific properties, e.g., surface energy adjustment to customize the wetting behavior of water-based inks, heat dissipation, and insulating properties. Table 1 presents the 3D printing filament feedstock candidate materials that were used in the emission/exposure assessment experiments, representing an indicative selection of pure PLA blends (Ingeo 3D850/3052D grades by NatureWorks LLC, Minneapolis, MN, USA) and PLA compounds with polybutylene adipate terephthalate (PBAT), inorganic filler (Ingeo 3D850/IS1335 ecovio™, kindly provided by BASF Hellas SA, Marousi, Greece), and PLA nanocomposite by the incorporation of reduced graphene oxide filler (rGO) via twin-screw extrusion. The rGO was prepared in a thermochemical reduction process [46], starting with GO prepared using a modified Hummers’ method [47], as described in [48]. The rGO showed 43 μm of lateral size, as determined by laser diffraction; thickness below 1 nm was determined by TEM and AFM, and 1.3 wt % of oxygen was determined by XPS (49% C=O and 46% C-OH). The rGO showed thermal stability over 600 °C, as determined by TGA.
An important constraint in the present study was caused by the small quantities of the materials that were allocated, considering that these were prototype materials; it is beneficial in such approaches to allocating small amounts of material for testing. Thus, the following experiments were adjusted accordingly. This feature can render the methodology applicable even when numerous candidate materials are required to be tested since this process would not need large volumes of production to be invested in the pre-assessment stage.

2.2. Exposure Assessment Methodology

As of the time of conducting this study, there is only one standardized methodology for performing emission assessment in FFF 3D printing processes, as described in the ANSI standard, ANSI/CAN/UL 2904 [49]. A similarly themed ISO standard, ISO/ASTM CD 52932 [50], remains in development. The methodology developed in [49] is focused on assessing the emission rates of numerous combinations of filament/printer/print parameter scenarios, using isolated environmental chambers of defined specifications. It was determined that for the purposes of this study, this approach was not directly applicable. Additionally, based on the scope of this work being introduced as a suggestion for 3D printing workspaces, minimal interference or disruption to the normal process setup and workflow is reasonably expected to be desirable before starting mass production. The requirements of the material to be used for the emission test prints are also higher in [49], requiring prints that take at least 1.5 h, which is incompatible with the limited amounts of prototype materials that were at our disposal.
The customized methodology that was developed for this work (Figure 1) was based on the Organization for Economic Co-operation and Development (OECD) harmonized tiered framework for the exposure assessment of nanoparticles [51], aligned to some extent and in certain elements (such as equipment selection and temporal setup of measurements) with the 3D printing exposure assessment standard [49]. While this methodology is tailored for engineered nanomaterials, FFF emissions are expected to consist mainly of ultrafine particles, as the literature confirms, displaying analogous behavior and exhibiting similar challenges.
The steps that were implemented can be summarized as follows. Initially, the first set of data on the process was acquired from the process operators, with the aim of gaining a deep understanding of the process’ specificities and details. Based on this dataset, the release/exposure measurements were designed to offer the maximum gained information in a short time span, and with the use of low material quantities. It has also assisted in adapting the methodology so as to involve simple object designs, which is compatible with printability tests.
In parallel to the comparative assessment, based on the work practices already described, a set of exposure scenarios were defined that are necessary for transposing the release/emission data to conform with potential, realistic exposure occurrences. Cross-interpretation of the results enabled the identification of high-priority scenarios. These are very valuable for informing safety-related practices in the workplace being studied.

2.3. Instrument Selection and Characteristics

Airborne particle number concentrations (PNC) were recorded using TSI CPC 3007 [52], TSI Aerotrak 9306-V2 [53] (TSI Incorporated, Shoreview, MN, USA), and Dylos DC1700 [54] (Dylos Corporation, Riverside, CA, USA). Total volatile organic compounds (TVOC) were measured as an isobutylene equivalent in ppb, using the Ionscience Tiger [55] (ION Science Ltd, Royston, UK) photoionization detector (PID) instrument. This instrument displays a range of measurement from 0 to 20,000 ppm, with a minimum sensitivity of 1 ppb. The output of the measurement is given as the concentration of total VOCs (isobutylene equivalent) or specified VOC species. The reading can be transposed for specific VOC species, using a library of correction factors contained within the instrument software to adjust for the different ionization characteristics of the target VOC species [56]. The CPC (condensation particle counter) and OPC (Optical Particle Counter) are instrument types that are recommended and commonly used in both the 3D printing emission standard [49] and the nanosafety exposure assessment methodology [51]. The CPC detects airborne particles of sizes 10–1000 nm, while the Aerotrak instrument displays the capability of adjusting the measurement size-range channels. The channels (ch) were adjusted to display the <1 μm size range in detail, as follows:
  • Channel (ch) 1: 300 nm–400 nm
  • Channel (ch) 2: 400 nm–500 nm
  • Channel (ch) 3: 500 nm–600 nm
  • Channel (ch) 4: 600 nm–1 μm
  • Channel (ch) 5: 1 μm–2.5 μm
  • Channel (ch) 6: 2.5 μm–25 μm
The Dylos is an affordable air quality monitor, the use of which has been validated and reported to be in satisfactory alignment with measurements from highly specialized particle-counting equipment [57]. It measures airborne particles in two size ranges (Ch1: 0.5–2.5 μm and Ch2: 2.5–≈20 μm) [54]. It is very important to note that the instruments do not detect chemical identity, so the instrument outputs refer to total particles within a given size bin, and to the total VOCs as an isobutylene equivalent. As such, the assessment of whether the process emits particles/VOCs is performed through temporal comparison, evaluating the levels of airborne particle and VOC concentrations when the process is being performed, compared to before and after the process (background measurements). Measurements are performed for the whole duration of the printing process, and crucial process phases are time-logged, to be cross-evaluated with concentration fluctuations. In this way, the source of the release episodes can be pinpointed.
Additionally, size distribution data within the measured particle size channels are not acquired from this specific instrument setup. Collectively, the instruments provide measurement capabilities for particle sizes of 10 nm–25 μm. Since the literature investigation has shown that ultrafine particles are the main source of concern for this specific process, the focus of the assessment will be the output of the CPC instrument, evaluated in parallel to the first channels of the Aerotrak (0.3–1 μm). In this way, data for the concentrations of particles of 10–300 nm can be derived. Quite importantly, and as is accepted in aerosol research [58] as well as instrument manufacturer recommendations [59], the measurements are number-based, meaning that the CPC instrument output concentrations are expected to be dominated by particles in the size range of 10–100 nm. Due to their higher number, fluctuations of ultrafine particles will outweigh even the total number of larger particles within the 10–1000 nm size bin. In contrast, mass-based measurements favor larger particles, with releases of small particles having a minimal impact on the readings. Since particles emitted during the 3D printing process are expected to be on the lower part of the 10–1000 nm size bin, as shown for multiple PLA filaments [17,60], particle number-based measurements were considered to be preferable. All instruments were zero-checked before every experiment and had previously been calibrated by the manufacturer.

2.4. Information-Gathering

The first step in any exposure assessment measurement setup is the collection of basic information on the process. While FFF 3D printing is a highly automated process and a step like this may seem redundant, information such as controls that are active, workplace-specific worker practices, and potential incidental sources of particles are integral to data interpretation. We suggest documenting a structured list of information as a basis for the assessment to be performed (Table 2). This should include, but may not be limited to:
  • Equipment used;
  • Materials used;
  • Description of work practices;
  • Controls in place;
  • Maintenance schedule;
  • Potential incidental particle and VOC sources.

2.5. Hazard Identification

The work performed in this study is focused on determining release and exposure potential from the 3D printing processes applied. However, a crucially important parameter in assessing the risk present from these emissions is the inherent danger of the particles. No directly applicable/derivable results to the ones to be produced in this measurement campaign can be found in the literature, due to the prototype materials used. Nevertheless, the presence of cytotoxic potential has been demonstrated for PLA-emitted particles in the scientific literature [18], leading to the assumption that cytotoxic effects are possible for the ultrafine particle emissions of the PLA-based materials used within the scope of this study.
Between filament Ingeo 3D850/3052D and filament Ingeo 3D850/BASF ecovio IS133, any estimate on different levels of threat is unclear since no clear comparison between the hazardousness of PBAT- and PLA- emitted particles can be performed. Similarly, the difference in the expected size of the particles emitted within the ultrafine size range (1–100 nm) is also unclear. The hazard potential of these two materials can reasonably be assumed to be equal, in view of the absence of data.
However, the presence of rGO in the Ingeo 3D850/reduced Graphene Oxide(rGO) filament may be an indication of increased risk. Nano-reinforcement particles have been reported to be emitted from nano-reinforced filaments [62]. This may be the source of increased risk for this specific filament. It is also unknown if the presence of rGO will impact the thermal stability of the composite filament as a whole, resulting in a different pattern or magnitude of general ultrafine particle emission. Additionally, an increased risk may also be present due to the protrusion of rGO particles from the printed objects, an issue that has been identified for similar CNT-reinforced 3D printed objects [62]. No significant dermal exposure is expected since the application (a microfluidic device) is not one that necessitates lengthy manual interaction (e.g., hand tools); however, precautions against dermal irritation are applicable. The use of gloves is commonly suggested for handling graphene-containing filament or printed objects [63]. Quite importantly, mechanical stress (e.g., post-processing) of the objects printed using this specific filament may lead to the small-scale release of airborne particles containing rGO. These additional hazards are absent from the non-nanomaterial-containing filaments. Therefore, from the preliminary stages, and following a precautionary approach, the rGO-containing filament is indicated as displaying the potential for higher risk compared to the other two filament types.
In terms of VOC species emitted, the general findings from the literature show that for PLA, the main VOC species emitted is lactide [13,64]. The emission of methyl methacrylate and acetaldehyde is also possible, in lower but considerable concentrations [64]. Other, less hazardous, or negligible quantities of VOC species have been identified in PLA VOC emissions [13,64], such as decanal [64].

2.6. Measurement Campaign Design

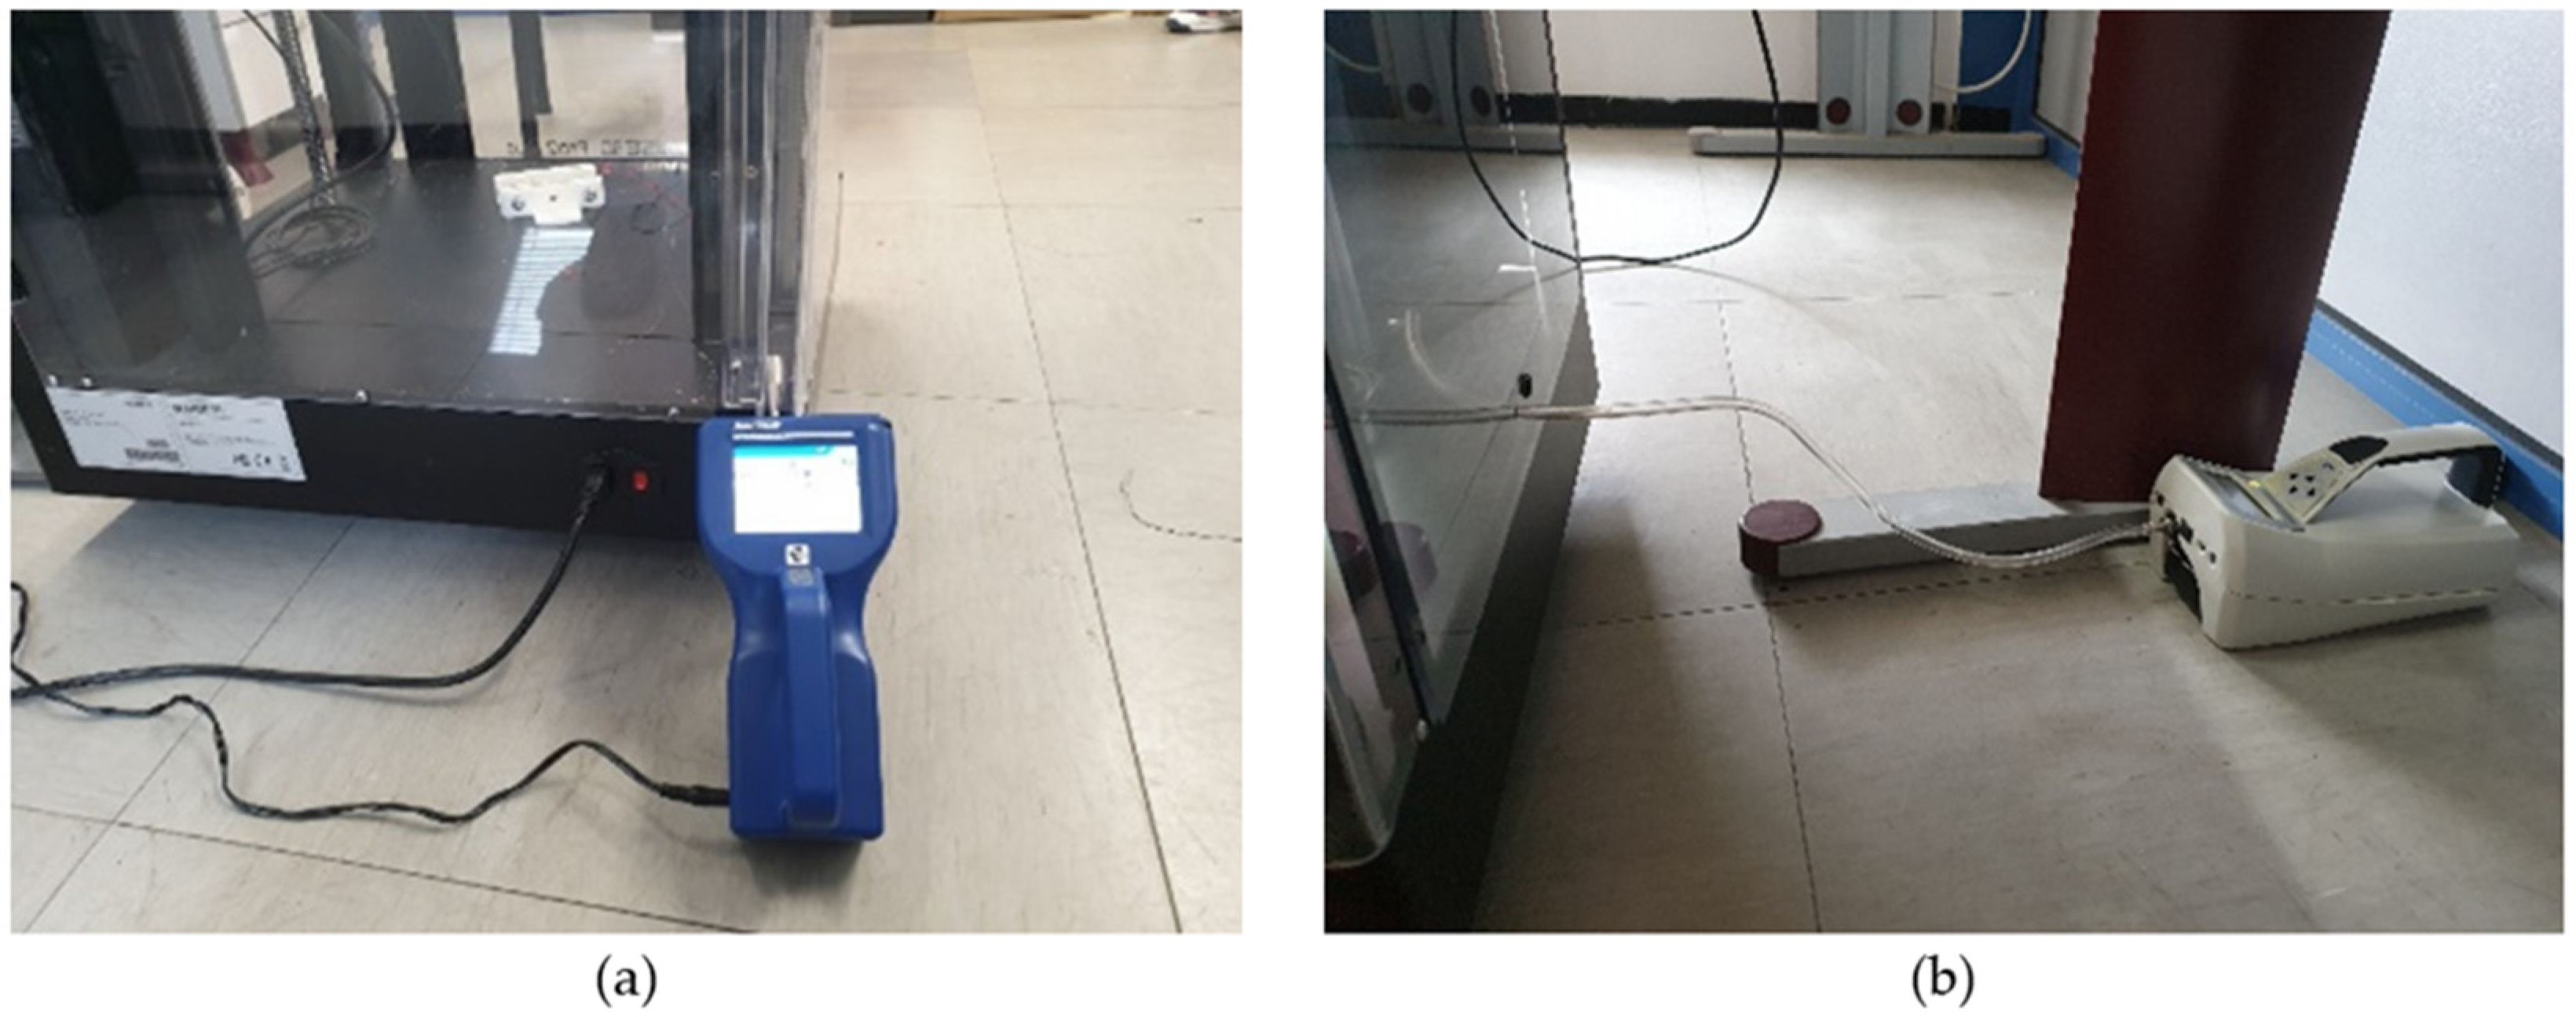
2.6.1. Instrument Placement

The data-gathering process described in the previous section informed the design of emission and exposure assessment experiments. Based on the objectives of each measurement, two different instrument placement configurations (Figure 2 and Figure 3) were employed in order to examine both the exposure and emission capabilities of print processes. Setup I (Figure 2) was targeted at identifying the main emission events and the qualitative comparison of the emissions among the three different filaments. Thus, instruments were placed with inlets within the printer enclosure. For Setup I measurements, the Dylos instrument was positioned on a nearby desk to display data for the “far-field” concentrations. Setup II (Figure 3) was used for the assessment of the occupational exposure for an operator of a 3D printer during a microfluidic object-relevant print procedure. It involved instruments being placed within the operator’s “breathing zone” [46] (a hypothetical 30-centimeter sphere around the potential location of an employee’s head). The placement of an Ionscience Tiger device followed the aforementioned configuration, although it should be mentioned that the enclosure’s exhaust control does not filter out VOC emissions, and the air purifier only possesses HEPA filtration, therefore the output acquired is not impacted by controls, irrespective of the placement.

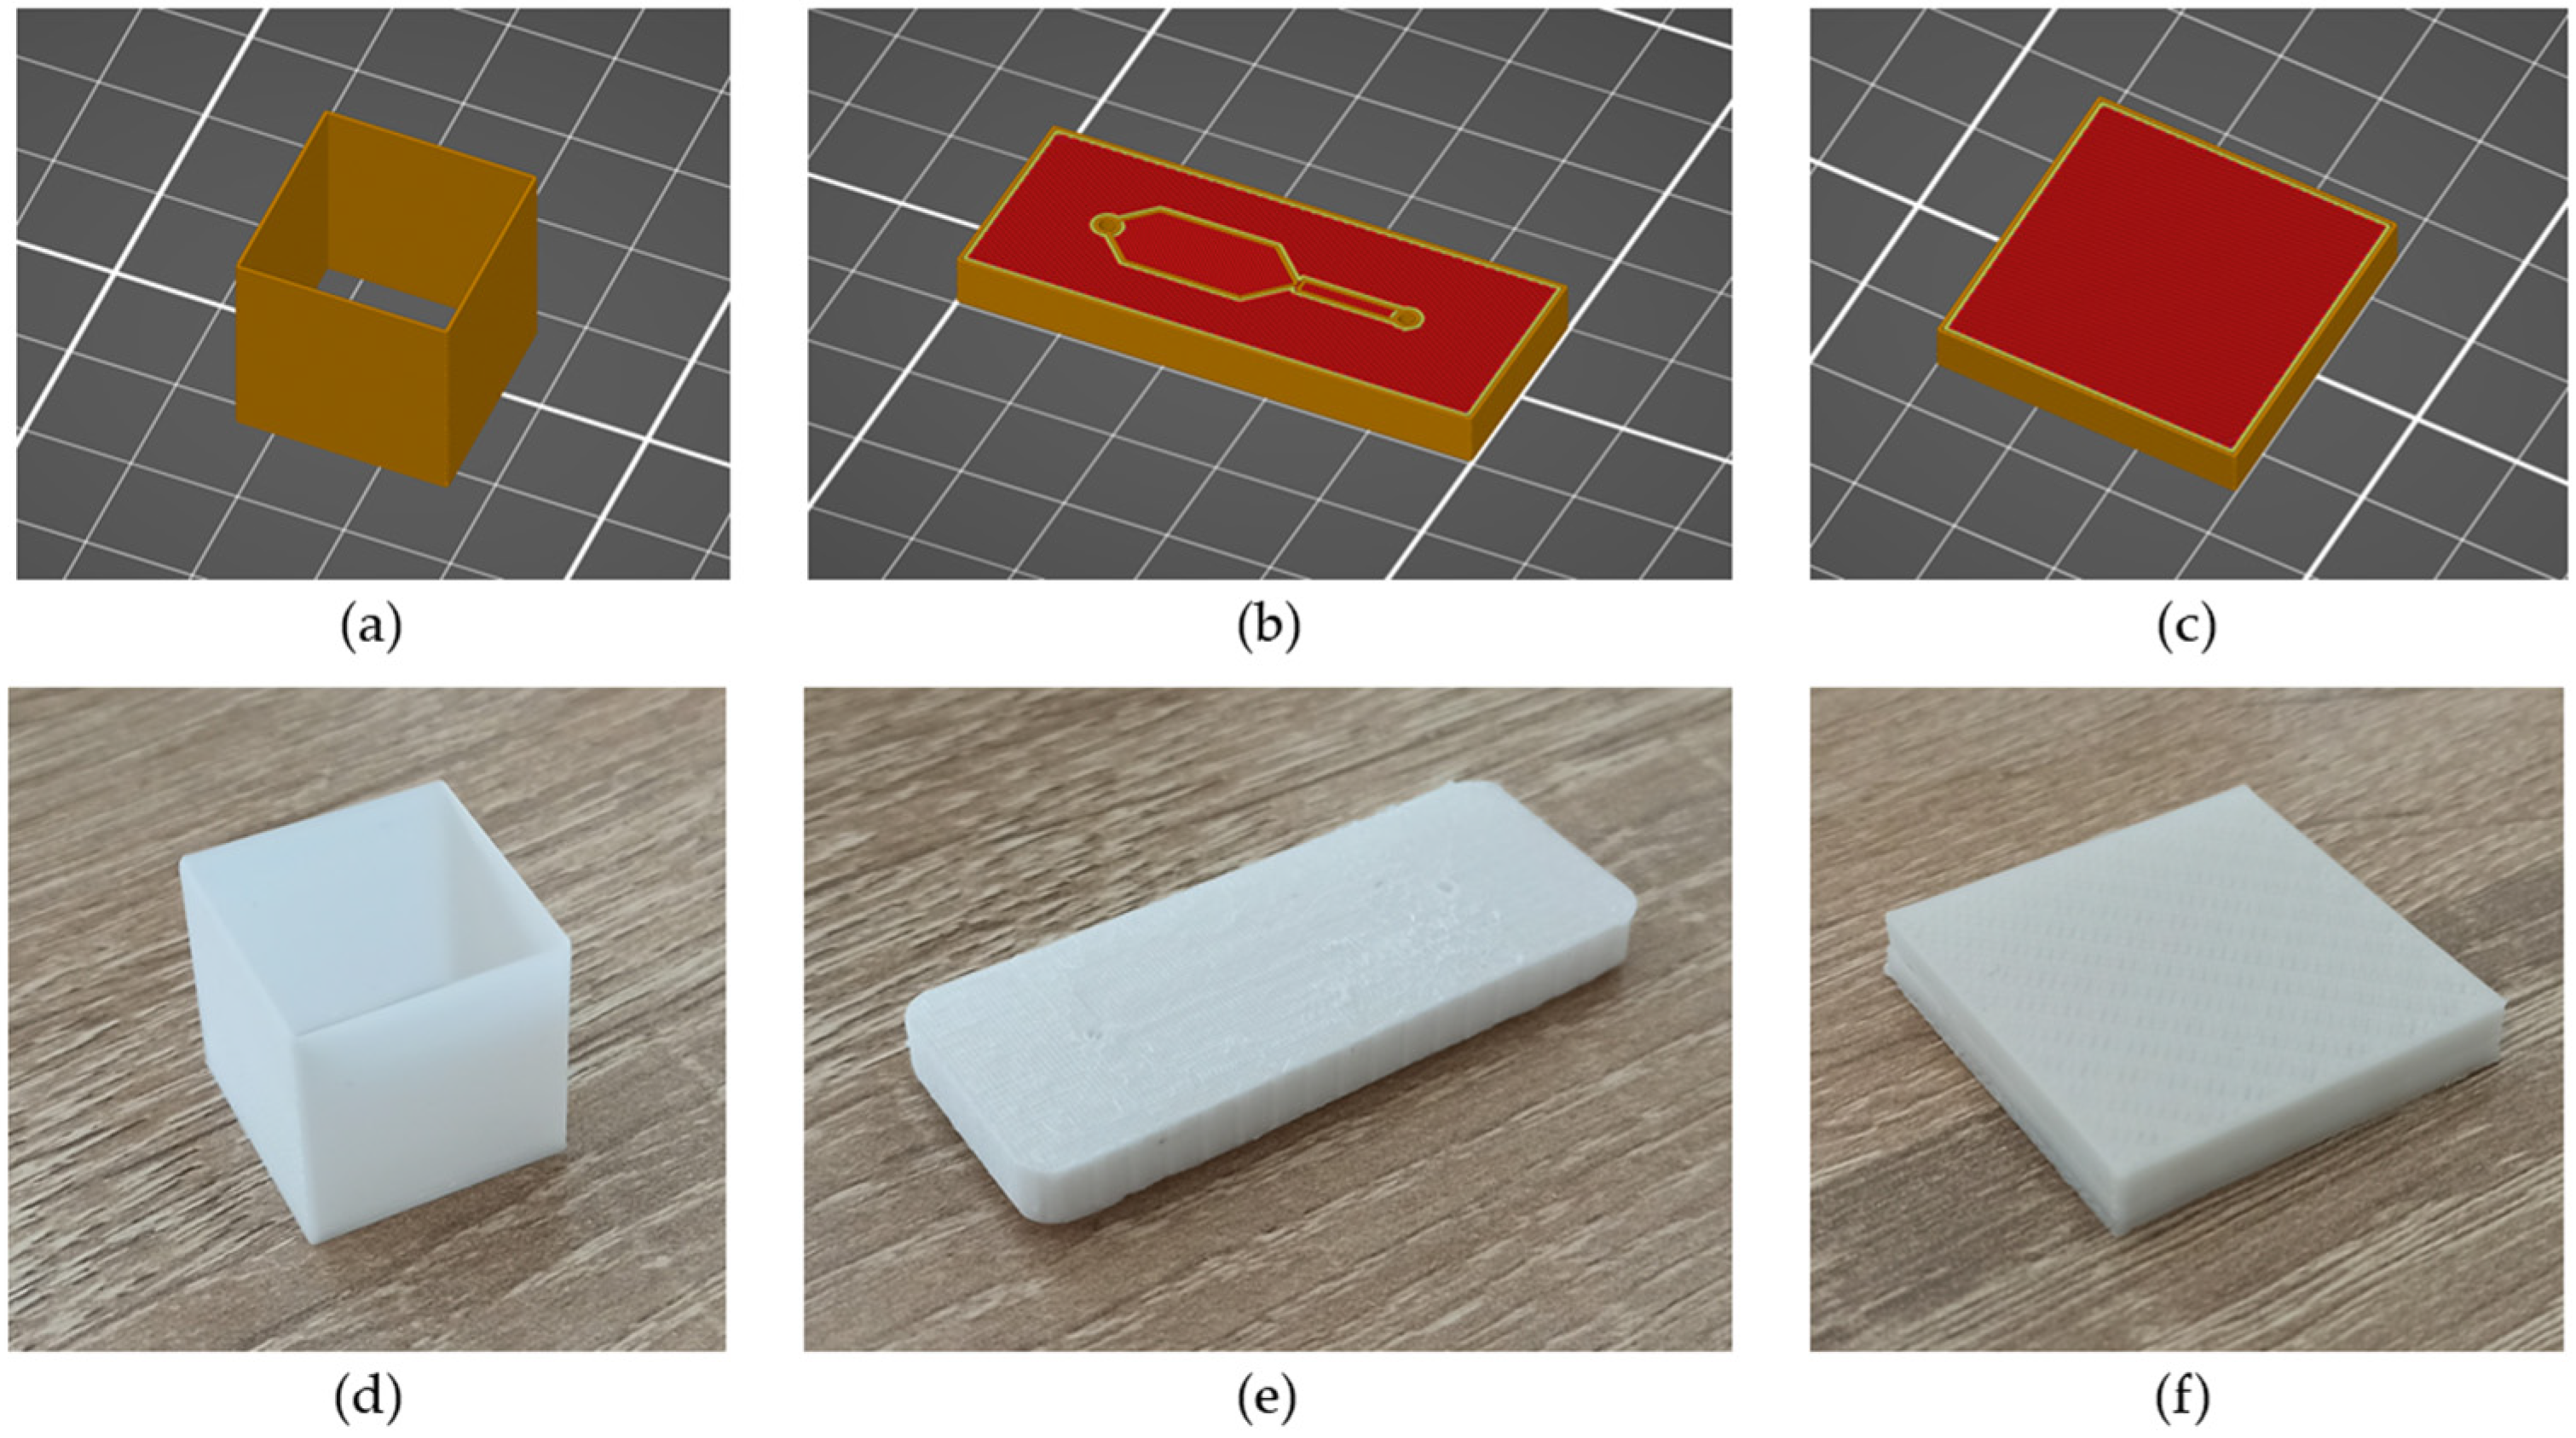
2.6.2. Print Object Shape and Print Settings

For the purposes of these measurements, three types of test objects were printed (Figure 4). Type A objects were single-wall square towers with no top or bottom solid layers and 0% infill, which may be used for temperature printability tests. A separate tower was printed at four different temperatures (205 to 235 °C) for each filament. The print time for these objects is 17–18 min, but this may be influenced by disruptions or failed prints. The choice of nozzle temperature as the main influential parameter in emission potential has been selected as this has been reported as a general conclusion in 3D printing emission studies.
The Type B design was based on a typical microfluidic device configuration but with the infill percentage adjusted, based on material and time constraints. The Type B design aimed to demonstrate whether the manufacturing of shapes relevant to microfluidics would influence the emission profile of the process. Shape complexity, as well as size and details, may have a high impact on the magnitude of emissions [65,66]. The Type B design possesses the corresponding lab-on-a-chip (LoC) unique characteristics, such as small-diameter pathways and small cavities, approximating the lower dimensional limit range of the FFF technique, which could incite higher emissions. Type B objects were printed at 215 °C using Ingeo 3D850/3052D and Ingeo 3D850/BASF ecovio IS133 filaments. The Type C object was a square with 15% infill, printed at a single temperature (215 °C) for the purpose of TVOC measurements. Object height was adapted based on the target print time. By applying a measurement setup to each applicable object type, the following measurement scheme is generated (Table 3).

3. Results

The following sections describe the results of the measurements with regard to airborne particle emissions and exposures. The TVOC concentrations measured by the PID instrument (Measurement 4) remained within very low levels; thus, the data are not discussed.

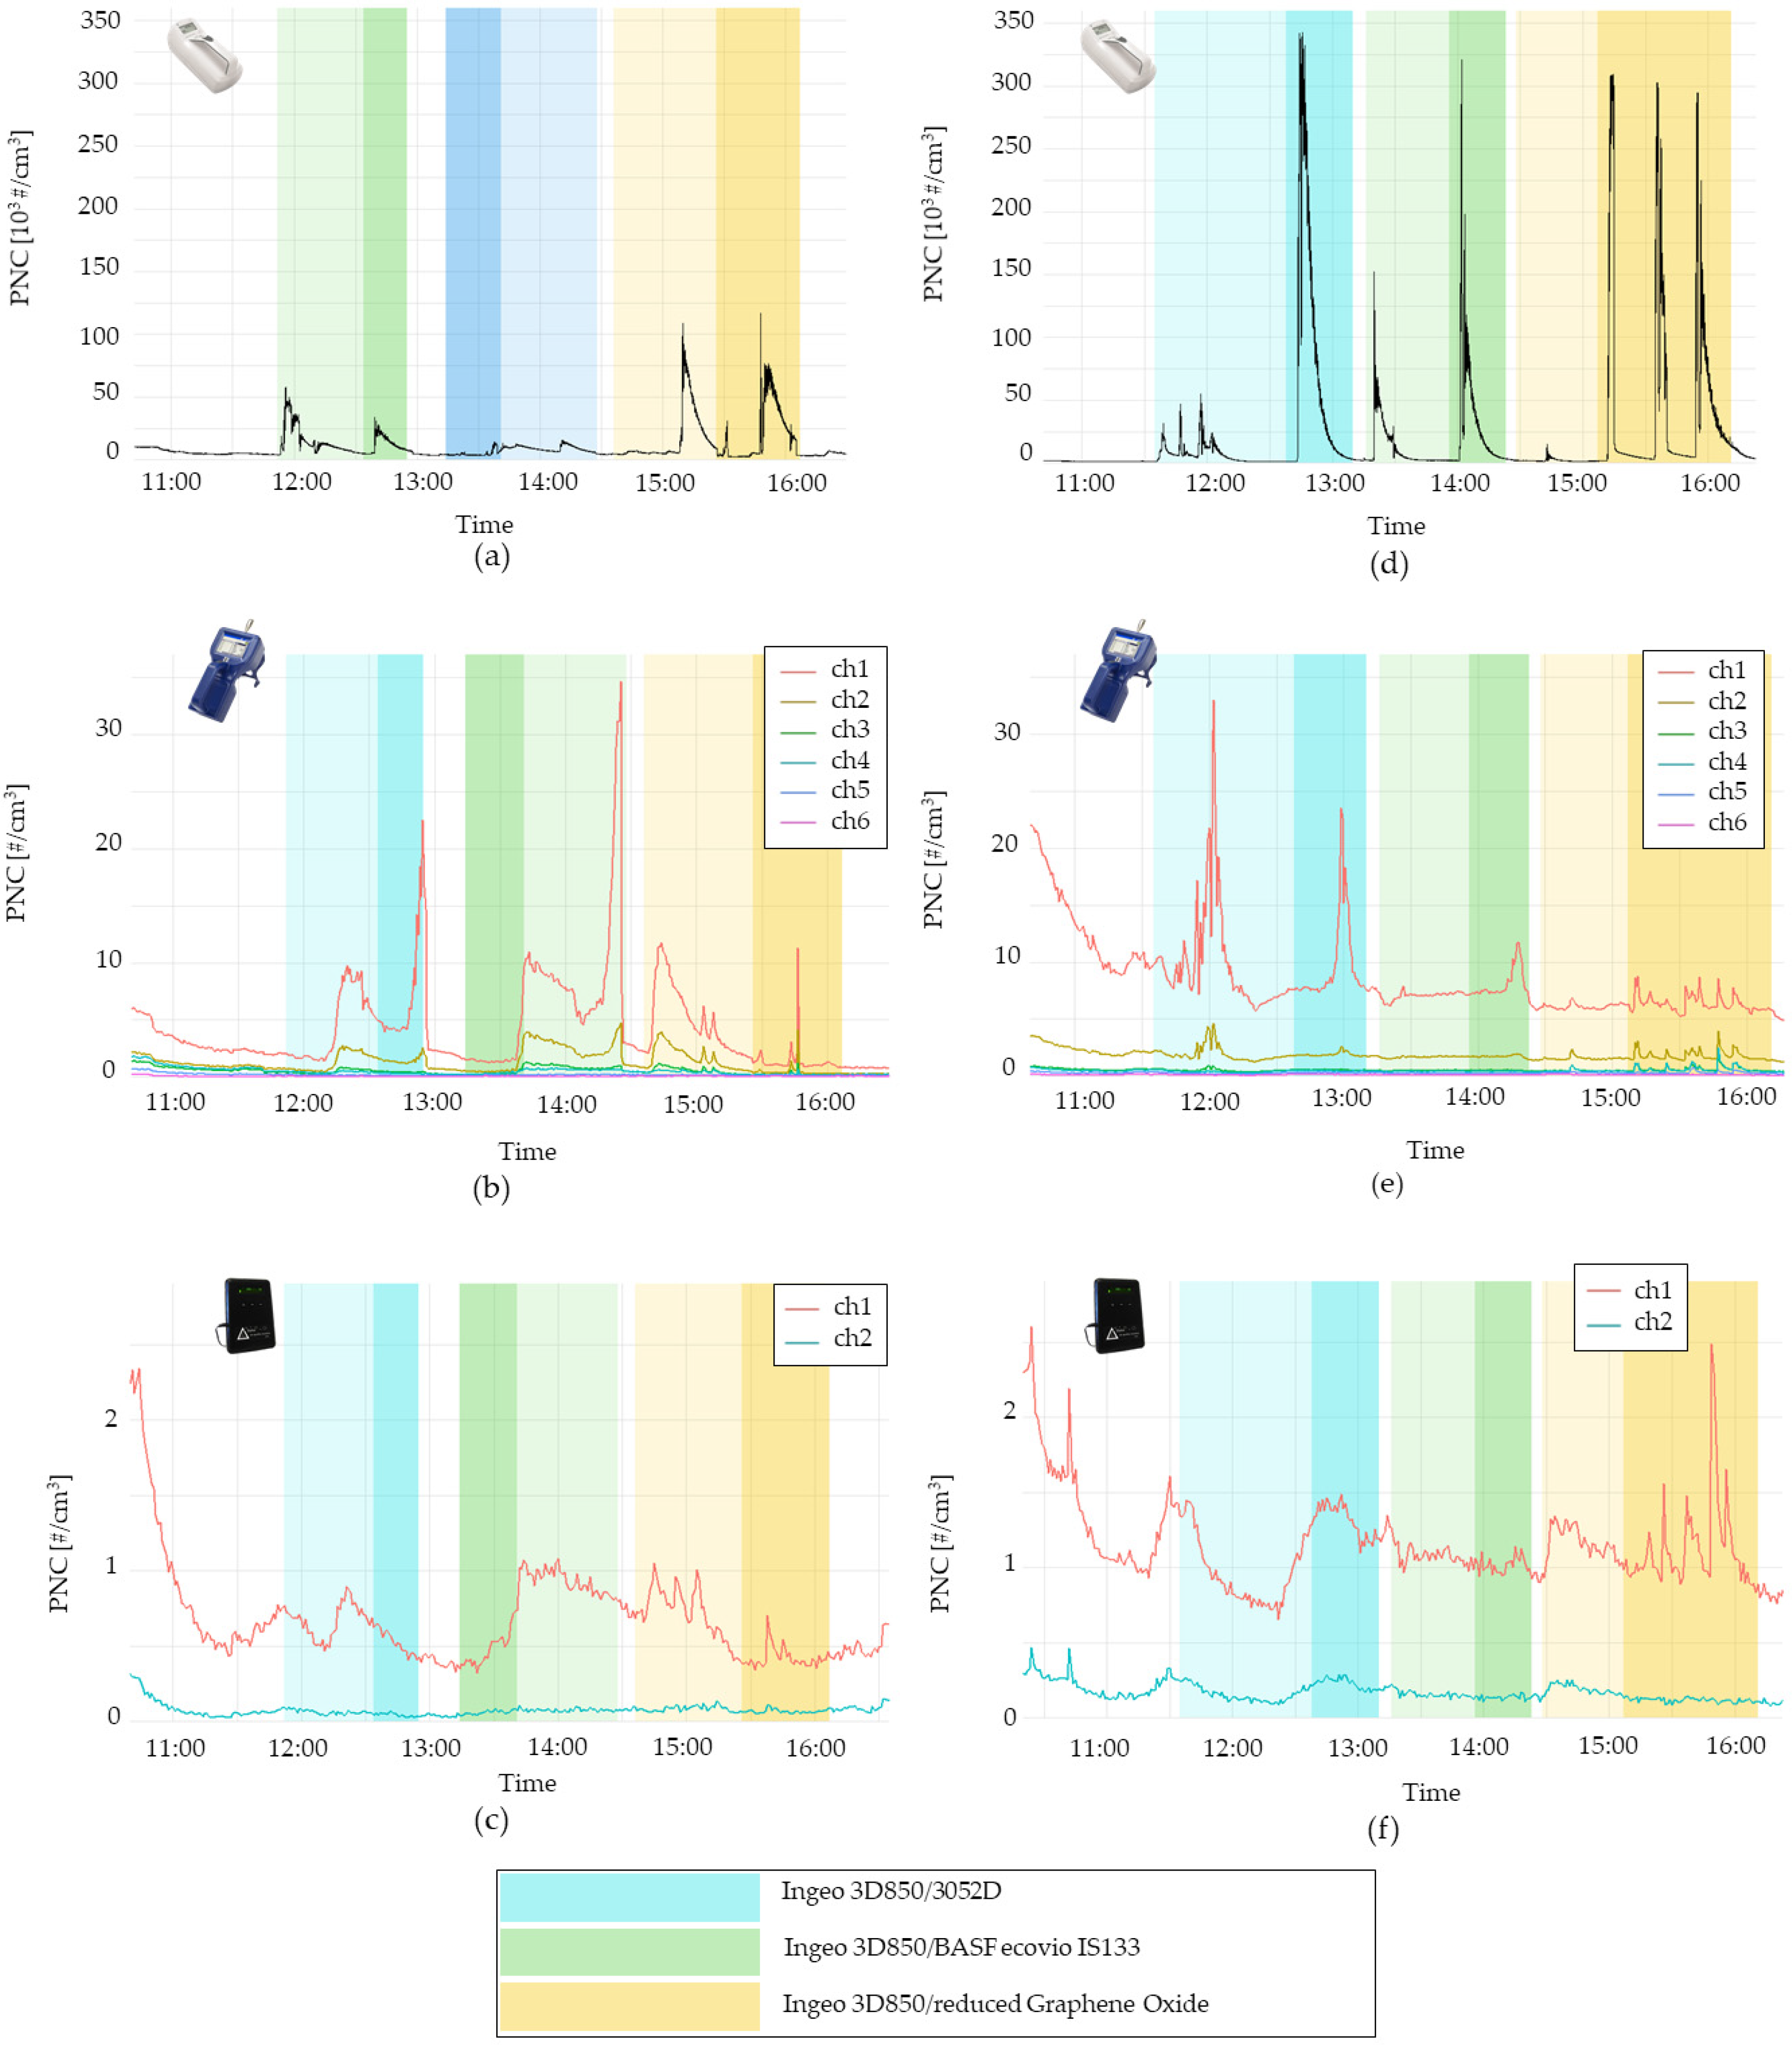
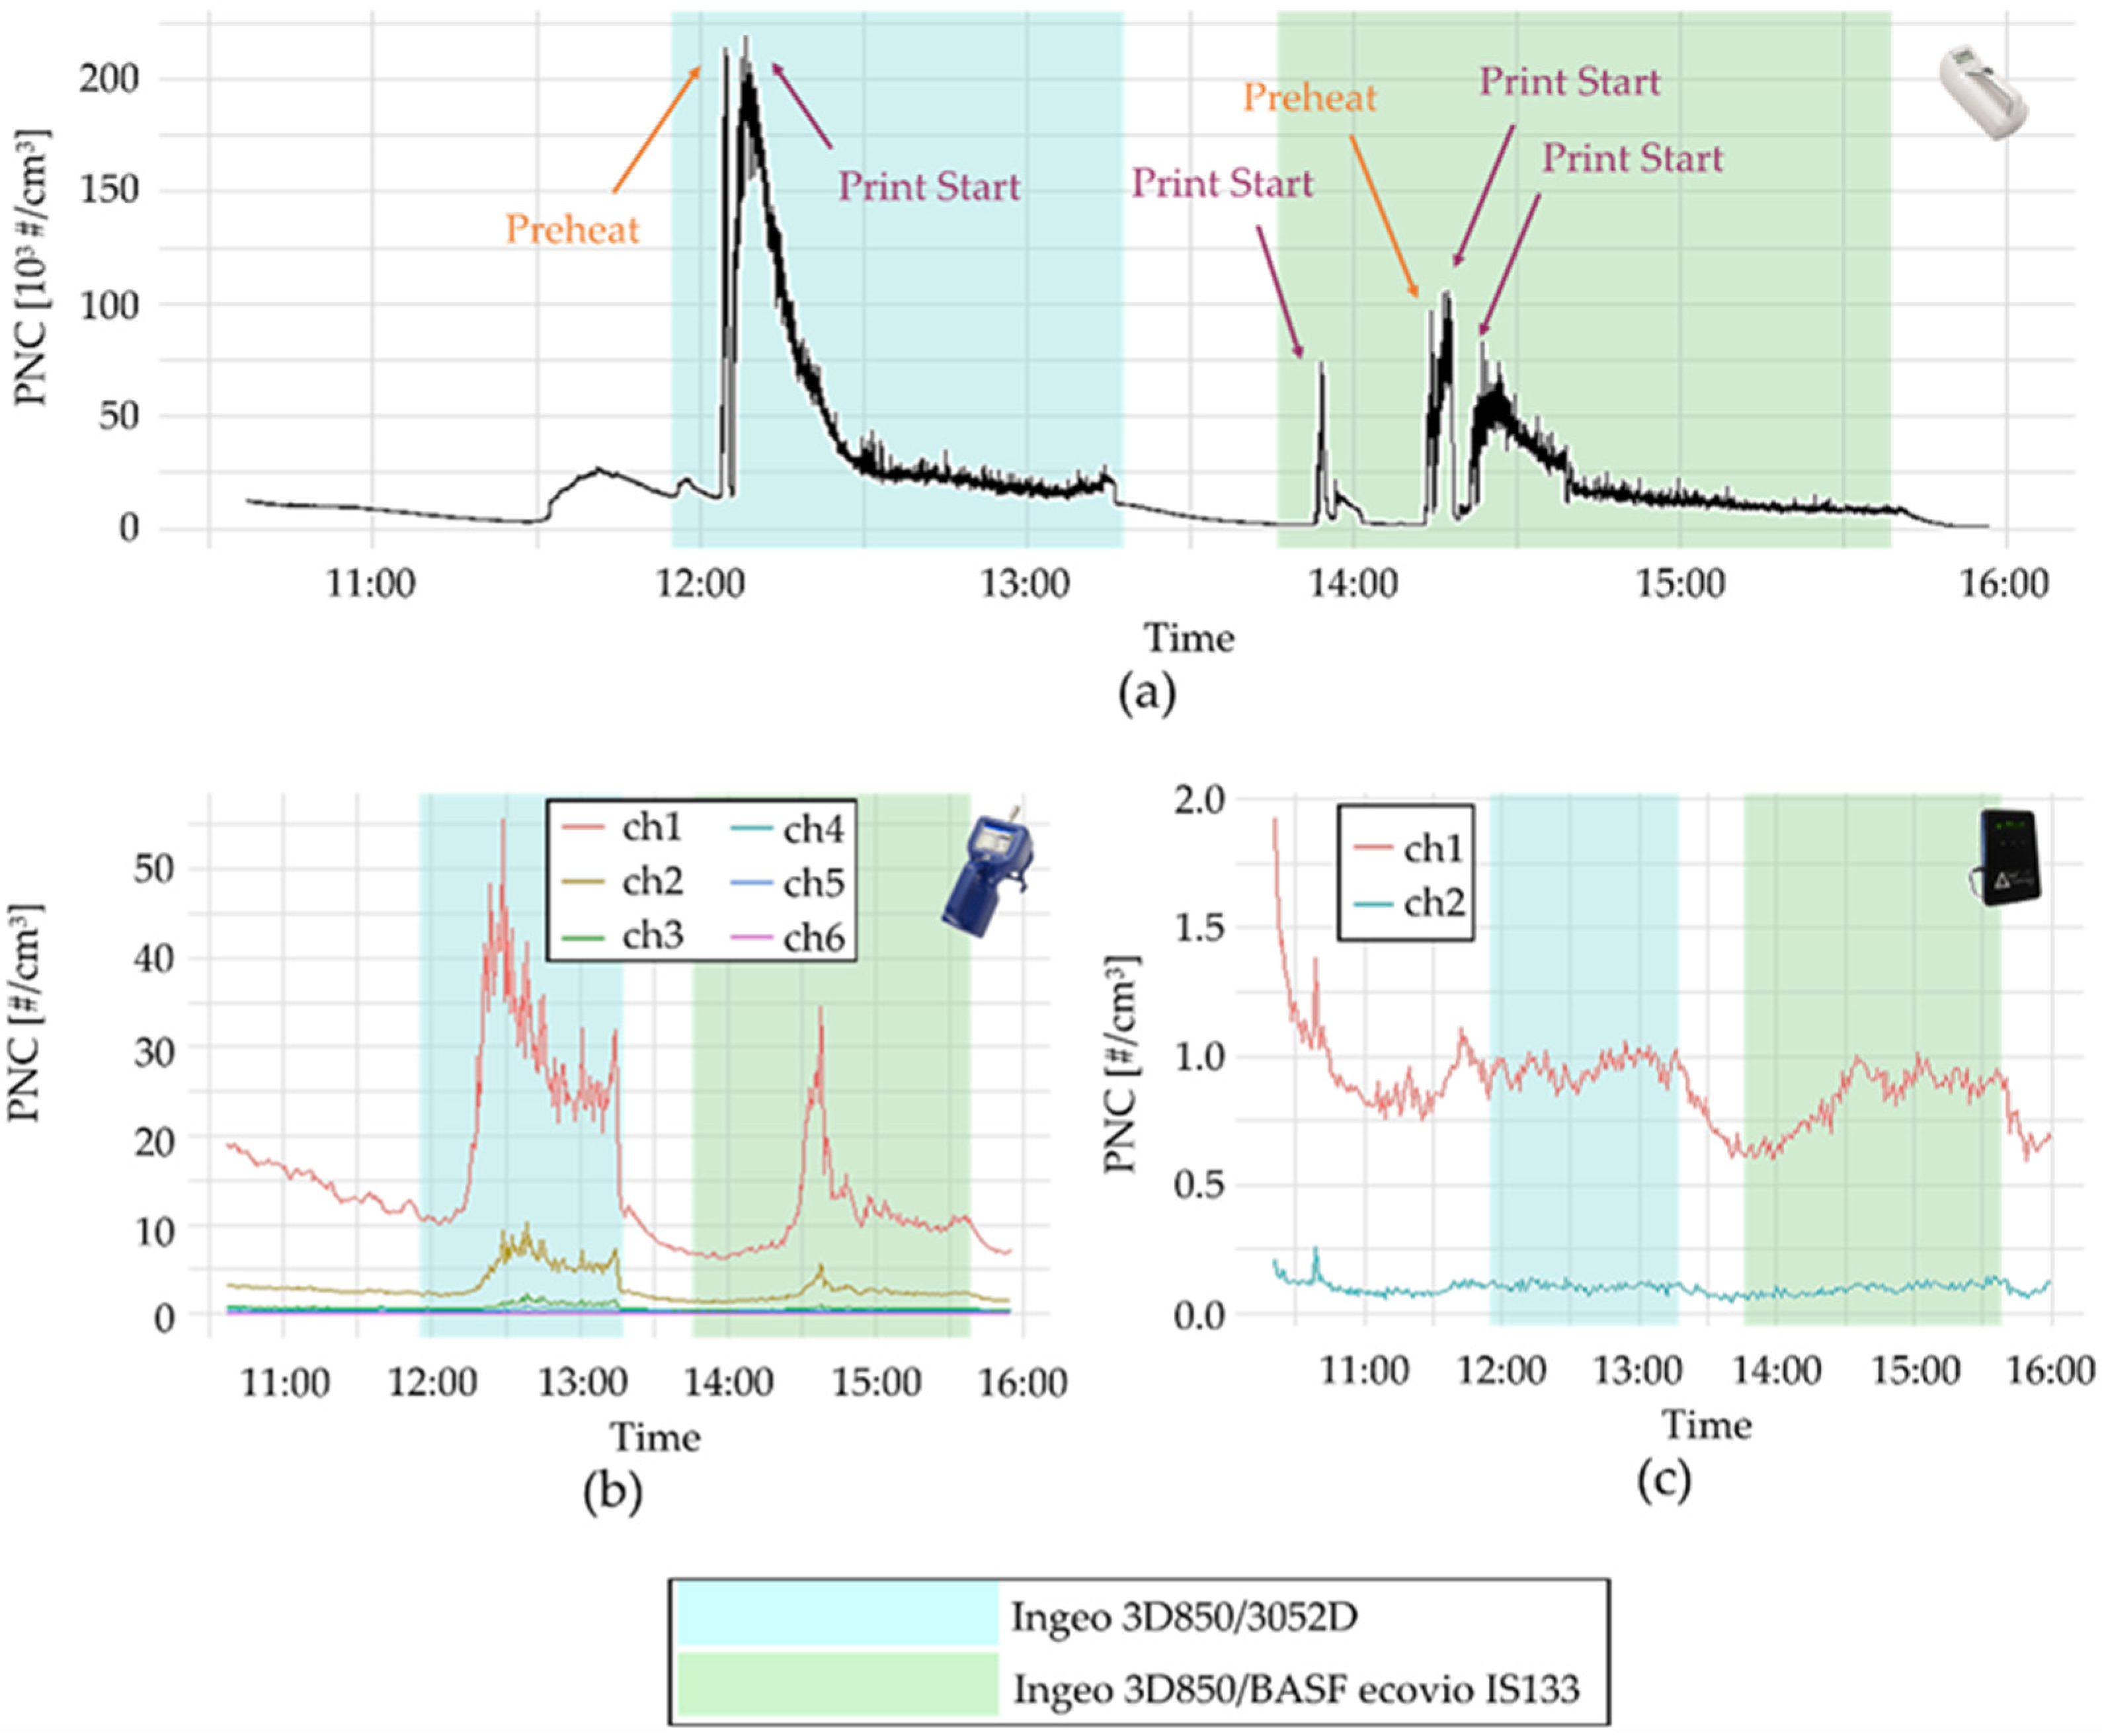
3.1. Measurements 1 and 2 (Impact of Temperature)

For Type A objects, a typical FFF 3D printing nozzle diameter of 0.4 mm was used. Nozzle temperatures of 215 and 225 °C are considered preferable to 205 and 235 °C in terms of filament properties, with 215 °C being the recommended printing temperature, as reported by the process operators, through information gathered by printability tests that had previously been conducted. In these tests, additional parameters such as print speed were also optimized; these are used as print parameters for our work and are constant for all performed experiments. The print processes were performed for the three filament types in succession, within one session per measurement.
The general emission profile of the print process seems consistent, involving a high magnitude peak at the initial print phases, and showing a general decrease afterward. After print completion, the concentrations reach approximate levels to the background until the initiation of the next print cycle. Based on this observation, and comparing similar experiments only, these peaks can be considered as a means for characterizing the corresponding material/temperature combination in terms of exposure potential. The progressive decrease in UFP concentration after these high-emitting process phases can be attributed to the synergistic result of particle removal (mechanical or natural) and collection by the HEPA filter, particle settling, and agglomeration [26]. At these temperatures, the rGO-reinforced filament leads to much higher UFP concentrations than the other two filaments, as measured by the CPC. UFP concentrations reached peak values of 109 and 113 × 103 #/cm3 at 215 and 225 °C, respectively, while Ingeo 3D850/BASF ecovio IS133 appears to have the lowest emission impact, displaying a maximum concentration of 15.9 × 10³ #/cm3 (Figure 2). A nozzle temperature of 225 °C results in the lowest observed peak values for Ingeo 3D850/3052D and Ingeo 3D850/BASF ecovio IS133. At 235 °C, UFP concentrations exceed 300,000 particles per cm3, regardless of the filament used. Overall, most UFP concentration peaks appear around the print start, except for the first two peaks for Ingeo 3D850/rGO at 235 °C, which are caused by filament loading and unloading. Large spikes in UFP number concentrations at the start of the printing process is an observation that is commonly reported in the literature [25] and is closely connected to the mechanism of UFP generation. The mechanisms responsible for the decrease in particle number concentration after print start can be attributed to the condensation of SVOCs onto newly formed particles (lowering, in this way, the SVOC concentration), as well as to particle diffusion, deposition, and agglomeration (rather than a decrease in emissions from the printing procedure) [26,67].
While the rGO filament displays high concentration peaks for print temperatures at 215–235 °C, an interesting observation is that this filament has the lowest peak concentration values of all filaments for a 205 °C nozzle temperature. The influence of higher temperatures on increasing the emission potential is more pronounced on this filament since it is the only one for which one level of temperature increase (205–215 °C) led to such a leap in emissions; this fact can be attributed to the hydrolysis and oxidative chain scissions of PLA [68] chains, attributed to the C-OH groups in rGO.
For larger particles (300–400 nm), the emission profiles are quite different, with the highest peak appearing for Ingeo 3D850/BASF ecovio IS133 at 215 °C. At most temperatures, Ingeo 3D850/rGO results in the lowest peaks, with all of them close to 10 particles per cm3. Dylos DC1700 recordings show one clear increase for particles larger than 500 nm when printing with Ingeo 3D850/rGO at 235 °C. Since the instrument was placed outside the enclosure, this peak can be attributed to the agglomeration of UFPs exiting the non-airtight enclosure after the repeated high peaks. It is observed that the Dylos instrument concentration readings do not immediately follow the pattern of those of the Aerotrak. This can also be also attributed to the placement of the Dylos outside the enclosure, in the "far field" region.
The fluctuations of concentrations for all instruments, filaments, and temperatures are presented in Figure 5, followed by a summary of the recorded peak concentrations in Table 4. From this set of results, Ingeo 3D850/rGO seems to be the filament that is most sensitive to temperature changes, in terms of the impact on emissions. Ingeo 3D850/rGO displays the highest emission potential in temperatures close to the optimal printability-wise, while Ingeo 3D850/BASF ecovio IS133 displays the lowest values, diminished by an order of magnitude compared to the rGO-containing filament. Larger particles seem to display a completely different emission profile. However, the focus of the study remains on the UFPs, as these first larger particle channels (300–500 nm) correspond to the lower priority sizes in terms of decreased respiratory system deposition capability [69], and the emissions are of much lower magnitude.

3.2. Measurement 3, 5 and 6 Results

The Type B experiments were performed with a 0.2 nozzle so that the results would be more representative of microfluidic-relevant print conditions. The Type B experiments were conducted with Ingeo 3D850/ 3052D and Ingeo 3D850/ BASF ecovio IS1335 only. Regarding the Ingeo 3D850/rGO filament, the emission profile that was revealed from the previous measurements, coupled with its increased hazard potential, led to the exclusion of the material from the subsequent experiments. Two rounds of measurements were conducted in order to record and compare the concentrations near the emission source (measurement 3) and in an operator’s breathing zone (measurements 5 and 6), evaluating the efficiency of controls (Figure 6 and Figure 7). These measurements were targeted at assessing the effects of longer-duration prints of objects close to those intended for mass production. A comparison of the observed peak concentrations inside and outside the enclosure is presented in Table 5.

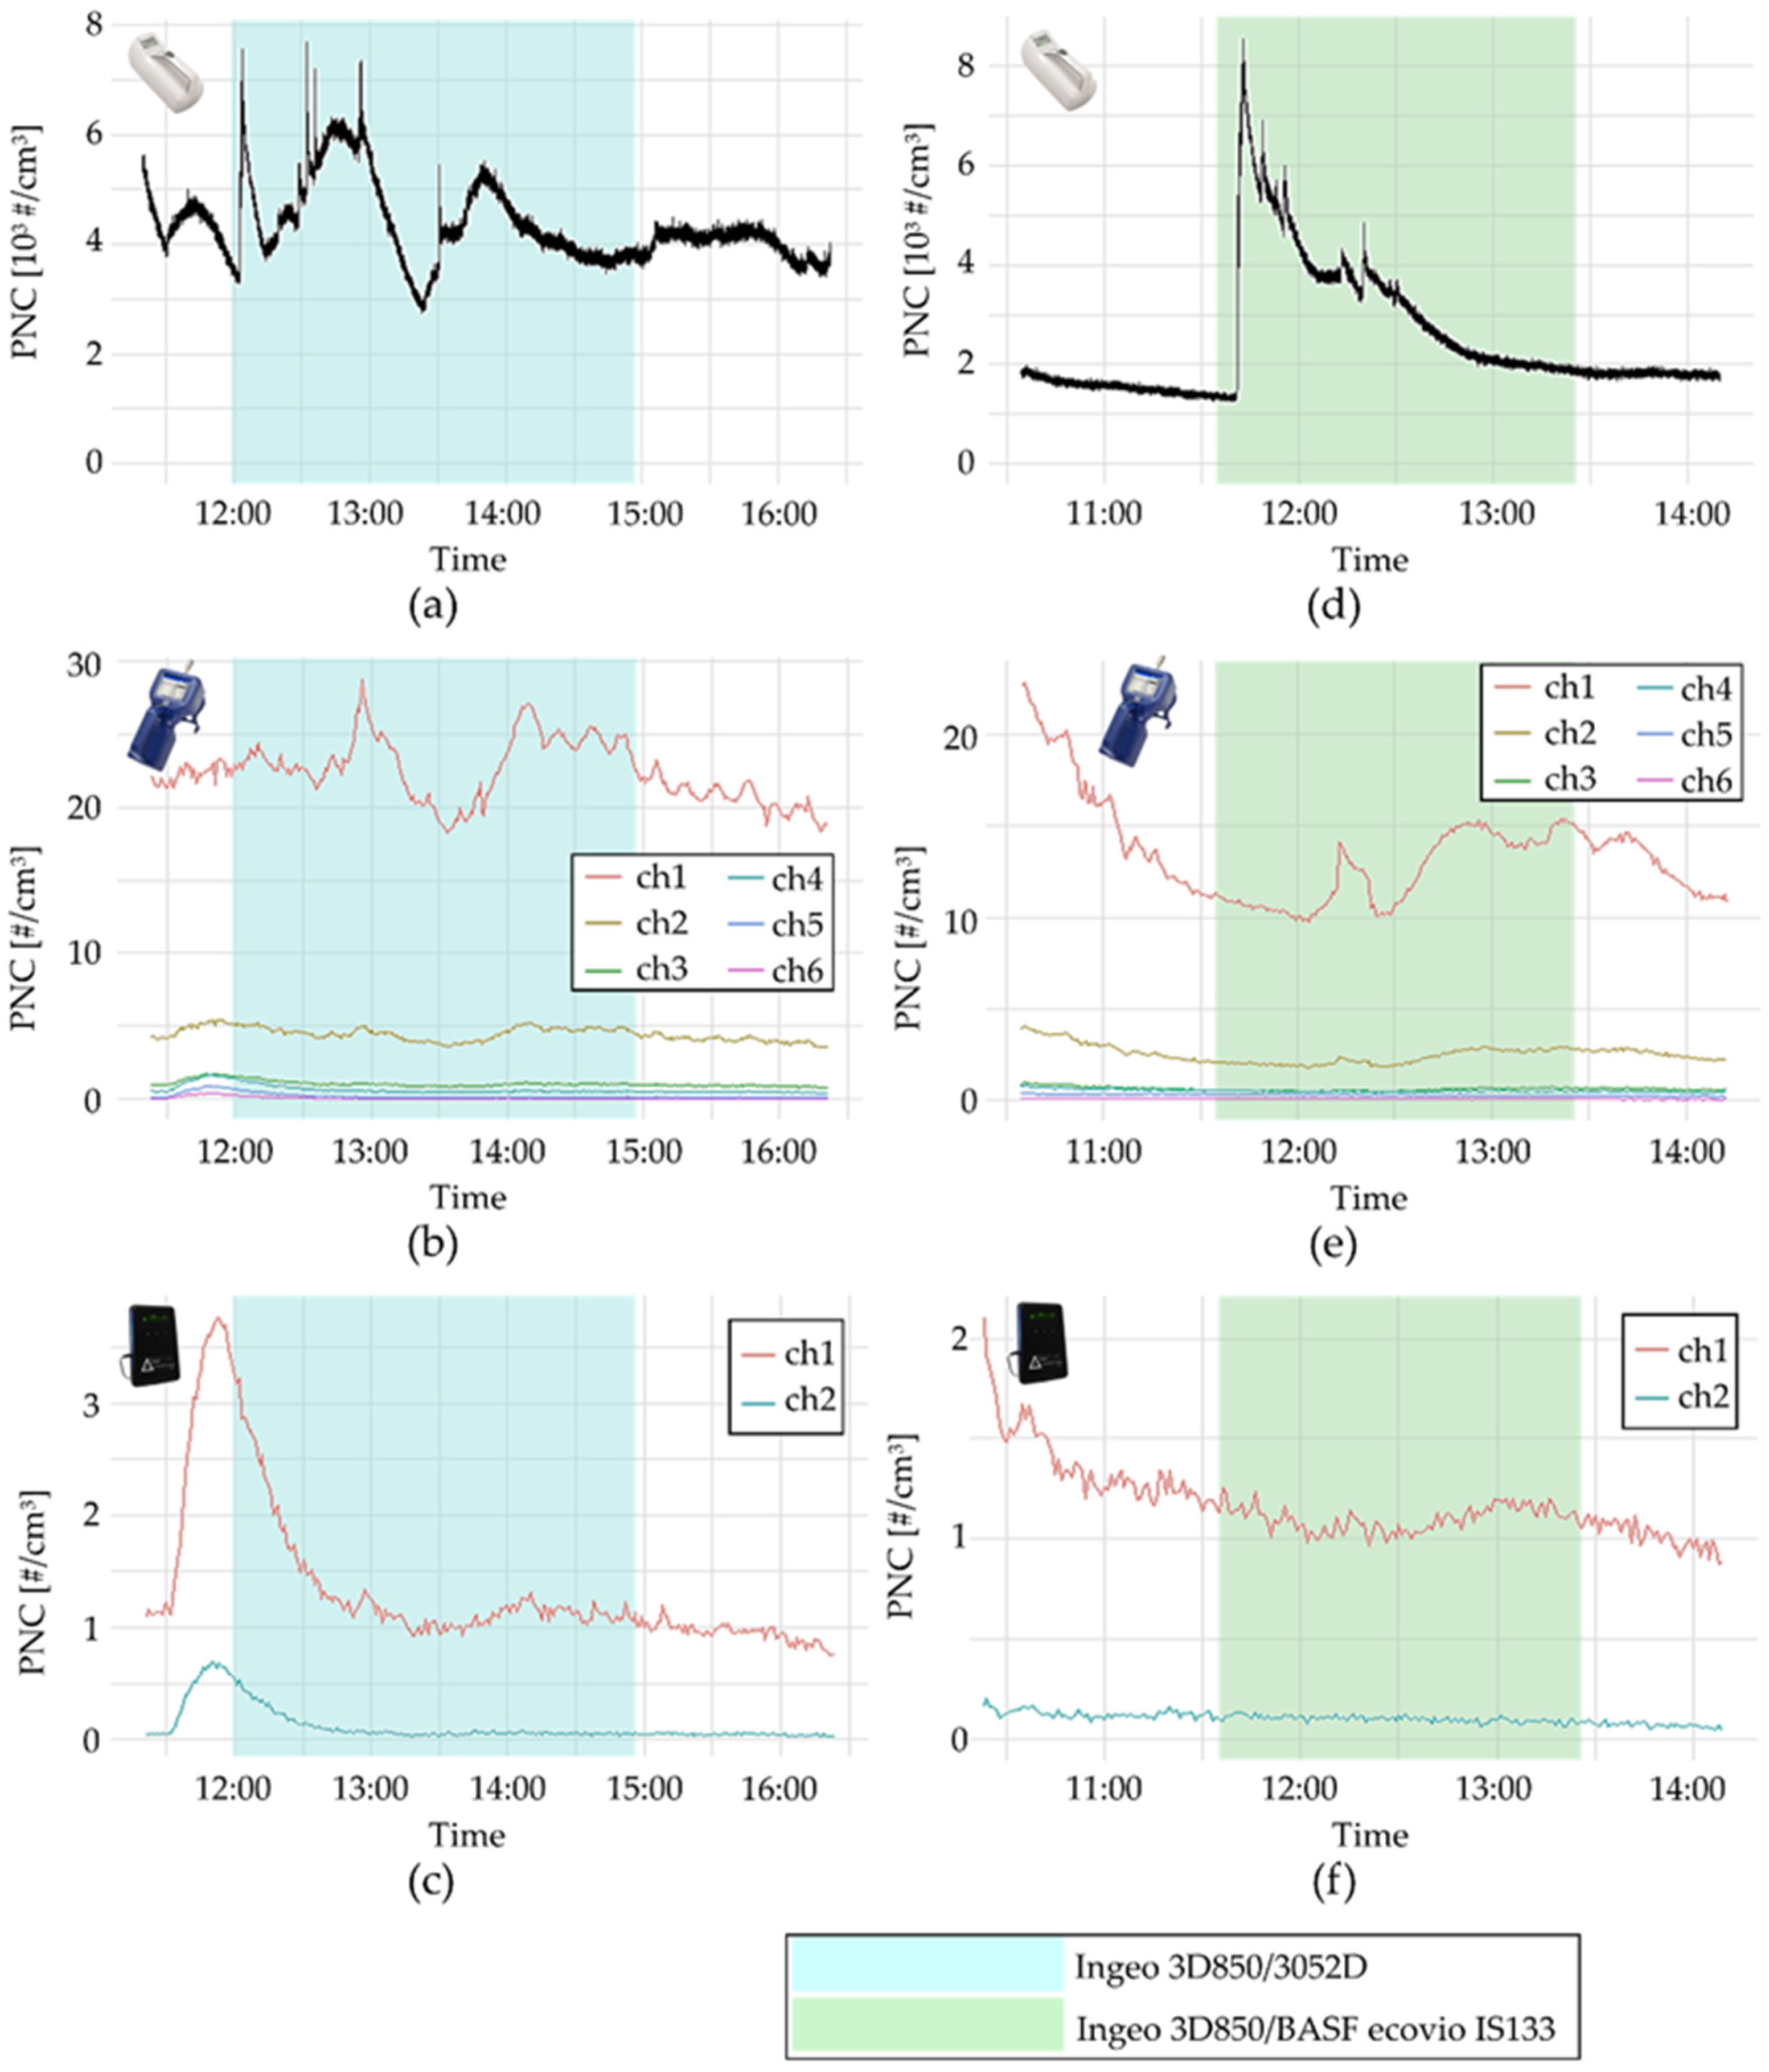
3.2.1. Measurement 3 (Impact of Shape)

In measurement 3, for all size bins under a 500 nm printing, Ingeo 3D850/3052D generated concentration peaks that were about twice as high as those observed while printing with Ingeo 3D850/BASF ecovio IS133, reaching values as high as 200 × 103 #/cm3 for UFPs. This higher emission potential of Ingeo 3D850/3052D compared to 3D850/BASF ecovio IS133 for temperatures close to the optimal is consistent with the results of measurement 1. Concentration peaks appear around the print start, indicating a high number of initial emissions. The values gradually drop off during the printing time. Faster decreases occur immediately after each printing ends. Values recorded by Dylos DC1700 show no significant increases.

3.2.2. Measurements 5 and 6 (Operator Exposure)

Very low fluctuations appear for particles larger than 500 nm outside the enclosure, while UFP peak concentrations are about fifty times lower than those inside the enclosure (Figure 7). It should be noted that the door of the enclosure is briefly opened around each attempted print start, coinciding with the measured sudden upsurges of the concentrations. This is performed as a necessary handling activity by the printer operator. As noted in the first peak of the Ingeo 3D850/BASF ecovio IS133 print cycle, which represents a print that failed very rapidly, even this quick print termination can lead to a spike of emissions. Particularly when testing a completely novel filament material, where limited printability guidelines are applicable, this emission episode can occur quite a few times, since failed/incomplete prints may require frequent enclosure disruptions.
From this set of experiments, we can conclude that printing objects with microfluidic design elements leads to significantly higher emission potential. Additionally, the enclosure is an effective barrier in removing the largest part of the particles emitted. However, the necessary enclosure disruption in high-emission process phases is directly reflected in the exposure measurements and can lead to potential high-exposure episodes.

3.3. Comparison with the Literature

Numerous FFF emission or exposure assessment studies have been described in the literature [13,15]; however, the ones that have generated results that can be applicable for comparison with the data produced in this study are those works that involved the measurement of a printer within a workroom, excluding those measurements performed in a clean room or an environmental chamber. The comparison-valid results can be compared with the “breathing zone” particle measurements (measurements 5 and 6). The first study that investigated 3D printing emissions was performed by Stephens et al. [17]. The measurements were performed in a small office space (45 m3) and several operating configurations were evaluated. These included 2 printers with PLA material feedstock functioning, as well as another setup where 2 PLA-material and 3 ABS-printing devices were functioning at the same time. For a UFP concentration-measuring instrument, they used the TSI Nanoscan scanning mobility particle sizer (SMPS) 3910, which has a similar operating function as the CPC used in our study. The objects manufactured were small-sized test objects (approximately 3 × 3 × 3 cm shapes), although not displaying any LoC characteristics. It is worth mentioning that the air exchange rate of the workroom in this study was not monitored; therefore, there is uncertainty about the particle removal capabilities. The volume of the office space was also approximately 45 m3 and the instrument was similarly positioned in a location close to the printer. The UFP concentrations were sustained at a mean 27,800 #/cm3 for the entire course of the PLA filament measurements. It is worth noting that the concentration increase profile is different from the one observed in our study. In the measurements taken by Stephens et al., the concentration is progressively increasing for part of the print process, and reaches a generally steady value, resulting in this relatively high mean. Concentrations only decreased after the print finished. Conversely, as already described, in the presently measured case, the peak (7660 and 8560 #/cm3, corresponding to the two materials tested) is reached for the print start phase, followed by a tendency to a general concentration decrease afterward. This significant difference can be attributed to the enclosure and particle-filtering exhaust system of the printer used in this study, as opposed to [17], where it is not specified if the printers that were used were enclosed. Additionally, seeing that the workroom was a commercial office, the general ventilation may not have been adequate to support sufficient removal, leading to the prolonged sustaining of higher concentrations in the room.
Zontek et al. [66] evaluated two types of print environments, a “well-ventilated” workroom accommodating a 3D printer with PLA feedstock material, and a “poorly ventilated” office space in which a 3D printer with ABS filament material was used. For the “well-ventilated” room, the concentration at the breathing zone spiked at 3780 #/cm3, at the print start phase, in accordance with our measurements. For the “poorly ventilated” workroom, the authors noted a quick concentration increase to 10,000 #/cm3 close to the printer, which was observed in the surrounding room as well, while the process continued. The particle concentration mapping showed that particle concentrations were increased throughout the poorly ventilated room, while they remained locally increased around the printer for the room with good ventilation. Quite importantly, although both printers used in the study were equipped with enclosures, there was still a release of particles in the work environment.
Similar peaks were also observed for the measurements inside the enclosures, between the findings of [66] and our study. The authors report “print start” peaks higher than 300 × 103 #/cm3 when printing PLA at 230 °C, as is similar to our measurements at a 235 °C print temperature for all three filaments tested. Printing PLA material at 180 °C led to concentration peaks of 200–250 × 103 #/cm3, which were significantly higher than the ones observed for our set of “low print temperatures” at 205 °C, which ranged from 15.3 to 152 × 103 #/cm3. However, it should be noted that the difference in enclosure sizes and clearance effectiveness or particle settling potential in enclosure walls is not accounted for. The printers used in this study are significantly smaller than the one we examined. The Makerbot Replicator X2 has a volume of 95,468 cm3 (52 × 44 × 41 cm) vs the 404,209 cm3 (62 × 59 × 110.5 cm) of the Raise3D Pro2Plus. In terms of instrumentation, the instrument used for the UFP concentrations was a CPC 3007, similar to our study. Finally, the authors also applied a photoionization detector instrument to assess the VOC emissions inside the printer enclosures, reporting that no fluctuations were detected for any print scenario, as is consistent with our findings.
For both of these comparisons, it should be noted that none of the printers examined in the literature studies were confirmed to be equipped with a HEPA filter. In the Stephens et al. study [17], the data for the specific commercial device or enclosure has not been defined, while in the Zontek et al. study [66], the MakerBot Replicator X2 possesses an enclosure but no HEPA filtration capabilities. This can be considered an additional factor for the difference in particle clearance effectiveness that was observed between the findings of the study by Zontek et al. [66] and our findings.

3.4. Comparison with Exposure Limits

The Type B experiments performed through the Setup II (breathing zone), which are represented by measurements 5 and 6, are the ones that most closely correspond to the actual operating conditions of tests performed for printing microfluidic-relevant objects, involving a series of interrupted, failed, and successful prints, over the course of some hours. Additionally, these are the measurement locations that can most closely reproduce actual concentrations in the breathing air of employees. As such, these are the measurements that can be directly compared to exposure thresholds.
As of the time of the composition of this work, no health-based exposure limits have been established for 3D printing particle emissions. Only one exposure limit related to 3D printing emissions has been proposed, at 40,000 ultrafine particles/cm3 [70]. The exposure limit is derived from a general exposure limit proposed for bio-persistent nanoparticles of a density lower than 6000 kg/m3 that was generated in nanosafety research [71]. As such, it should be noted that the applicability, as well as the preciseness of this limit with regard to 3D printing-generated ultrafine particles, is questionable. In terms of a comparison of the exposure data with this limit, the full array of controls applied in the studied experimental setup leads to lower exposure levels than the proposed threshold. However, substantial emission peaks are detected; therefore, it is reasonable to define a number of exposure scenarios.

3.5. Exposure Scenarios

Based on the process description and the initial information collection activities, in conjunction with the measurement results a number of exposure scenarios can be formulated (Table 6). These scenarios describe occurrences that are realistically feasible in the context of the occupational setting and their connection with exposure. Through cross-evaluation of the scenarios with the measurement results, guidance on which process tasks and activities may present the highest priority for safety measures can be developed.
As also expressed in the information-gathering table (Table 2), exposure scenarios correspond to different employees and different task responsibilities within the workplace.

4. Discussion

In this study, a site-specific series of measurements were performed, including emission (within the enclosure) and exposure (outside the enclosure) measurements. A number of goals were attained:
  • Lay out a methodology for a basic-level, but highly informative emission/exposure assessment without the use of instruments, which, although very accurate and producing detailed input, may be out of reach for a small-scale 3D printing workspace (e.g., SMPS, GCMS).
  • Enable basic-level emission assessments without the need for additional installations and controlled chambers, utilizing printer enclosure features.
  • Enable the identification of emission issues through the fewest possible experiments, requiring minimal interference and with normal productivity or process disruption.
  • Provide an additional dimension of supporting data on the printability test workflow, which is a well-established and widely practiced methodology in most 3D printing workplaces.
  • Minimize the material required, enabling comparative assessment of multiple filament feedstock samples and reducing time-investment requirements.
  • Produce data that can be highly valuable in the setting-up of a safe production capacity in FFF 3D printing
The output is a series of insights and findings that are generated from the measurements, which could assist in the selection of the optimal alternative between the three materials, fine-tune the printing parameters, and reveal issues regarding occupational safety.
This integrated methodology leads to the conclusion that the optimal alternative for mass production of the parts, out of all the options studied, is the Ingeo-ecovio blend, which displayed the lowest potential for emissions within the optimal temperature range. Nozzle temperatures at 235 °C or higher should be avoided for the presently studied materials since they led to higher peak emissions (Figure 2).
In terms of occupational exposure, results showed that although the 3D printing of microfluidic items can lead to an increase in emission potential compared to simple objects, the fully enclosed 3D printing process leads to a concentration increase within the workplace that does not lead to surpassing the proposed exposure limits. However, in view of the uncertainties and the non-health-based status of the exposure limit, it is suggested that operators should keep exposures to a minimum. Particularly in the high-emitting phases, enclosure disruptions can lead to high short-term exposure; therefore, a standard operating procedure (SOP) using an FFP3 respirator for these events is suggested. As already defined, this disruption may be needed for print monitoring purposes. Interestingly, the high-emitting and more hazardous rGO-reinforced filament can be used in a low-emission process profile, since the use of lower-range nozzle temperatures has been reported to result in a substantially lower emission potential.

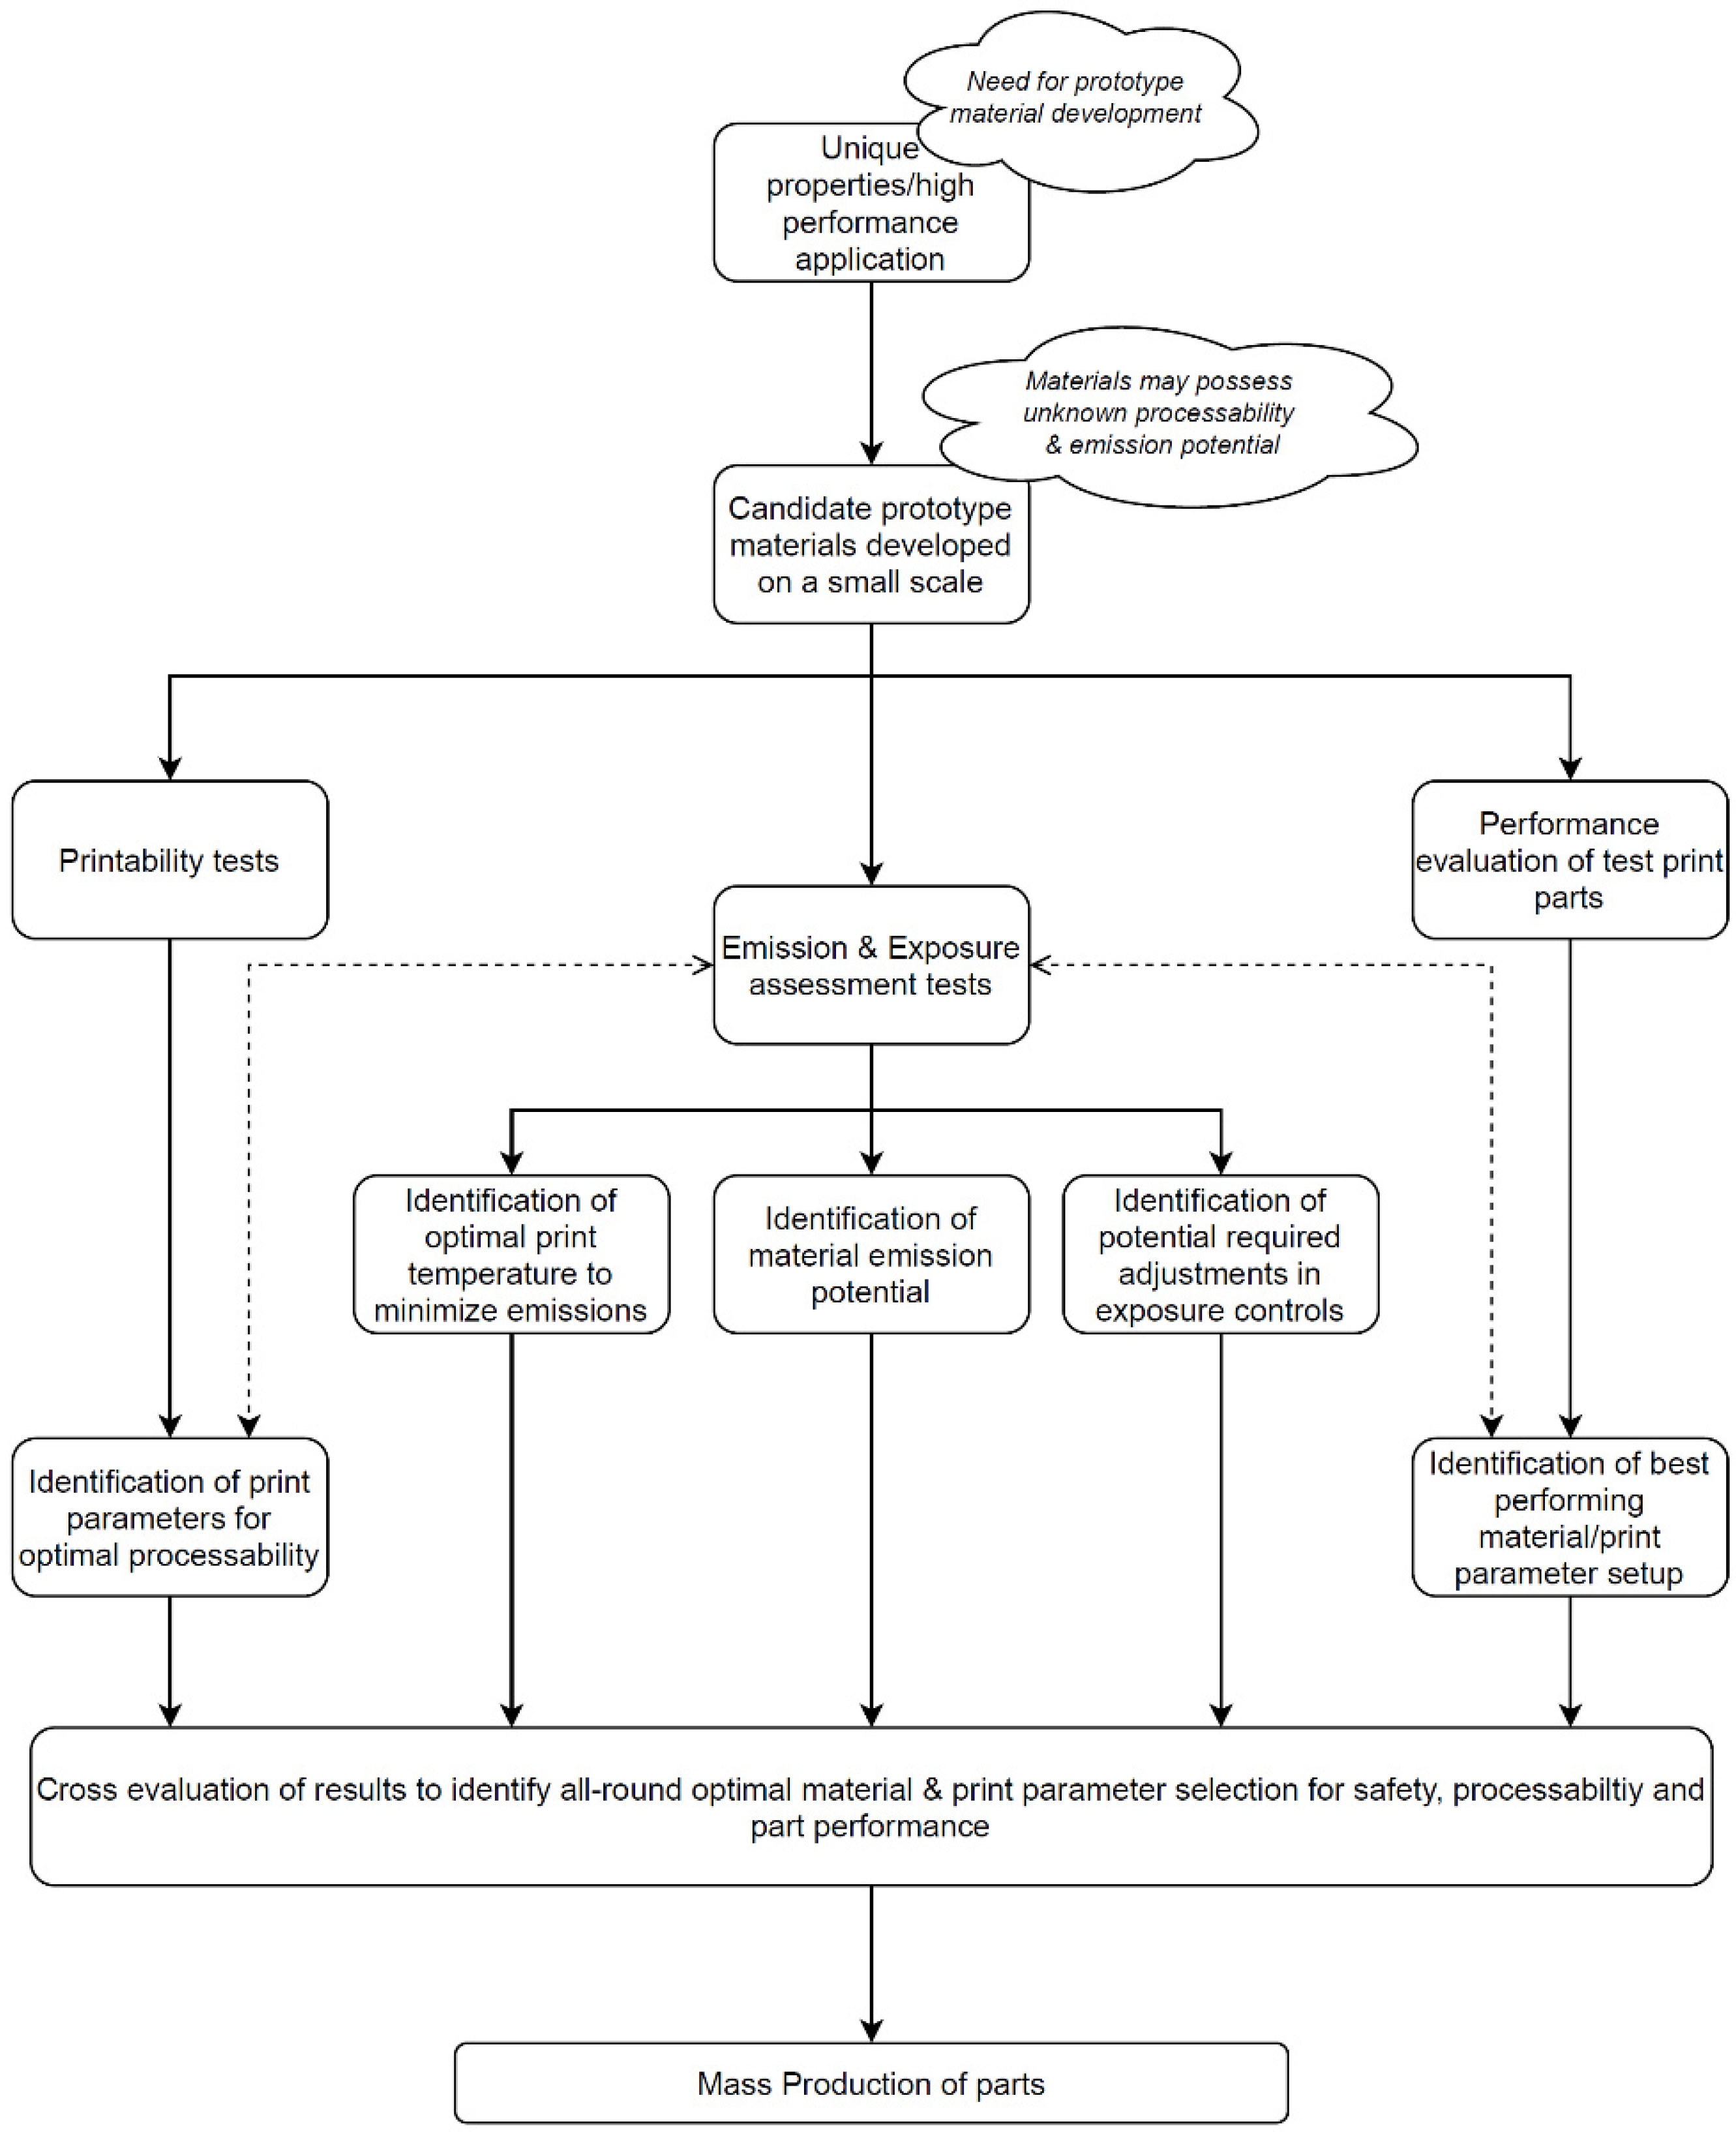
4.1. Suggesting a Methodology

The methodologies developed for the assessment of FFF process sustainability ought to be aligned with the primary characteristics of the FFF method. In essence, they need to be fast, uncomplicated, customizable, economical, and low in waste, in order to promote the equivalent attributes of the FFF approach [4]. This applies if they are to be employed widely and commonly in 3D printing workplaces.
Based on the objectives and the results of the measurement cycle, we have compiled the main concepts of our approach into a proposed workflow for pre-assessment, leading to optimized print processes. The proposed methodology, as implemented in this work, is summarized in the following step-by-step workflow (Figure 8).
  • Perform emission assessment in print objects of low complexity (e.g., hollow cubes) to assess the different peak emission potential of the various candidate materials, as well as the impact of different temperatures on emission potential.
  • Perform an emission assessment in the objects to be produced, or objects displaying similar structural properties, to assess if specific object qualities could lead to higher emissions.
  • Perform cross-evaluation of emission assessment with printability test results, to assess if there is any agreement or compromise between properties/printability and reduced emission potential. Conclude with an optimal set of parameters.
  • Use the optimal set of parameters to perform exposure assessment for prolonged prints of the structurally relevant objects, to assess the efficiency of controls, and evaluate potentially needed adjustments to work practices. Evaluation of the adequacy of controls and the performance of amendments if this is deemed necessary.
  • Compile data generated from the printability assessment, material performance, and emission/exposure studies, to support the selection of all-around viable options in terms of material selection, print parameter definition, and work practice refinement.
In scenarios where the candidate materials are numerous, each step can lead to the exclusion of materials for use in subsequent steps, given that they exceed specific criteria (e.g., a substantial increase in emission potential for a specific material, as revealed in our study). Therefore, feedback circuits from the different experiment sets can be maintained, to minimize the tests needed (e.g., not performing emission assessment in temperatures that do not produce the required properties).
The conducted printability tests that are performed to arrive at a set of print temperatures/settings for acceptable printability and quality should be cross-evaluated with the above-produced results, as well as with any experiments related to the performance of the test parts. This will lead to the definition of a balanced option between print quality, part effectiveness, and emission safety.

4.2. Study Limitations and Potential for Refinement

One of the limitations of this work is related to the limited repeatability of the experiments. This is attributable to limited material availability before deciding on mass production, within the constraints of small-scale research and development (R&D) activities. However, the comparison of maximum peak concentration emission potential, as defined by the maximum concentration peaks reached per experiment run for UFP, is proposed as a means by which to prioritize the materials in terms of their capability of producing hazardous levels of emissions.
Additionally, our approach is not based on quantifying emission rates, as defined in the 3D printing emission assessment standard [49]. If the performance of such a measurement campaign is feasible, this would reasonably generate an additional level of useful data, aside from the set of experiments that we propose. Advanced instruments can also assist in producing more detailed data. A size distribution within the ultrafine range (e.g., obtained by an SMPS) could potentially reveal additional information on which of the filament alternatives emits the most hazardous particles, as impacted by their size. The collection of filter-based samples and their characterization using electronic microscopes (e.g., through a scanning electron microscope) could inform researchers on the potential of nanomaterial release, or its state upon release in our case, or highlight the structural characteristics of emitted particles, which may impact their risk potential (e.g., high aspect-ratio emitted particles).
CPC and OPC are, however, the absolute minimum, as defined in the 3D printing emission assessment standard as well [49], and may be quite an effective investment for a 3D printing workplace. This is not only due to their accessible cost but also because the process operational cost or the cost for exposure controls may be significantly reduced after the long-term implementation of an emission assessment and reduction optimization strategy.
Based on the OECD methodology targeting engineered nanomaterials [51], high-tiered assessments are applied when there are indications of significant emissions during initial screening assessments. An expansion of the methodology presented in this work could be an “advanced” level of assessment in cases where the highest-emitting material is ultimately selected on the grounds that it outperforms every alternative selection in all other aspects, necessitating further study of its emissions. Alternatively, the expanded methodology could be applied if a certain threshold of emissions is exceeded, to provide further data on the nature of the emissions.
One of the sources of uncertainty during 3D printing exposure assessment studies is related to the shape of the print objects. Emission assessment should include prints of the final objects; however, assessing the impact of temperature and object type at the same time is impractical. Our methodology suggests assessing the most basic elements of the print characteristic setup, such as the temperature and shape. However, this may not be applicable in different cases, therefore adjustments to the assessment parameters of the methodology may be required. Furthermore, in the case examined in this study, the results were moderately conclusive in terms of the most optimal choice. In cases of additional complexity, significant conflicting results may be generated between the sustainability elements. This would present an opportunity for refinement of the approach.
The example used in the present study was the printing of a small LoC device. In the process of performing this methodology for different scenarios and larger/longer prints, it is reasonable to assume that a significant variation will be observed in the results for the impact of the shape on emissions. Additionally, the printer that was employed possessed HEPA filtration capabilities. Adaptations may be needed to the methodology and interpretation of results when studying systems employing other emission control schemes (e.g., simple enclosure, HEPA and activated carbon filter, outflow fan only, saturated/clogged HEPA filter, etc.), which will result in a high impact on the concentration fluctuations.
The position and the flow rate of the air purifier equipped with a HEPA filter were maintained as constant throughout this study in the different scenarios. Additional exposure experiments varying the position and the inlet velocity of the air purifier would benefit the optimization of the room layout since changing these parameters greatly influenced the airflow patterns in the room [72,73,74].

5. Conclusions

In this work, we performed an exposure assessment in a 3D printing workspace as an assistive activity to material and process optimization. We identified the optimal materials and print conditions and suggested safety practices. Based on our findings and lessons learned from the measurement process, we propose a sequential workflow for assessment before establishing the materials to be used and print properties to be applied for full-scale mass production, using basic instrumentation for exposure assessment.
We identified the highest-emitting materials, the impact of the projected printed object on emissions, and the temperatures to avoid and determined a set of exposure scenarios through the cross-evaluation of work practices and measurement outputs. The main target group for applying this methodology is research and development (R&D) 3D printing workspaces, where the development and use of such novel filament materials would be one of the key objectives. However, these findings are not limited to research environments; 3D printing workspaces that aim for mass production using conventional materials can gain benefits from following such an approach as well. The experiments that we describe can be performed initially on a small scale, informing the researchers about material selection and printing condition setups for upscaled production. Considering there are quite a few filament material types that have been minimally or not studied at all, and producing emission data for all commercially available filaments is a highly complicated task, this can be informative for a quick selection between safer commercial materials even if no specialized property or unique filaments are used. The exclusive use of low-emitting materials can also reduce the need for the installation and maintenance of costly engineering controls for emission removal, supporting a more cost-effective production setup.
Given that effective feedback channels between 3D printing operators, exposure assessment engineers, and filament producers are established, extensive emission studies on different filament formulations can lead to directions for developing low-emitting, safer-by-design filament materials. Structured occupational exposure studies are invaluable in defining the appropriate controls for emission clearance and safe 3D printing processes, and are a crucial enabler for safe innovations in 3D printing materials.

Author Contributions

Conceptualization, P.K. and E.P.K.; methodology, P.K. and S.S.; investigation, P.K., S.S., S.D. and I.K.; resources, P.K., E.G. and E.P.K.; material preparation, J.G.; writing—original draft preparation, P.K., S.S., S.D., E.G. and I.K.; writing—review and editing, C.C. and E.P.K.; visualization, P.K., S.S., S.D. and I.K; supervision, E.P.K. and C.C.; project administration E.P.K. and C.C.; funding acquisition, E.P.K. and C.C. All authors have read and agreed to the published version of the manuscript.

Funding

This research was partially funded by the European Union’s Horizon 2020 Research and Innovation Program, MEDLOC, a project under grant number 760662.

Institutional Review Board Statement

Not applicable.

Informed Consent Statement

Not applicable.

Data Availability Statement

Not applicable.

Acknowledgments

The authors express their appreciation towards BioG3D, for the FFF system provision and technical support in the 3D printing of testing specimens used for experiments.

Conflicts of Interest

The authors declare no conflict of interest.

References

  1. ISO/ASTM 52900:2015; Additive Manufacturing—General Principles—Terminology. International Organization for Standardization: Geneva, Switzerland, 2015.
  2. Simons, M. Additive manufacturing—A revolution in progress? Insights from a multiple case study. Int. J. Adv. Manuf. Technol. 2018, 96, 735–749. [Google Scholar] [CrossRef]
  3. Masters, W.E. Computer Automated Manufacturing Process and System. U.S. Patent 4,665,492, 12 May 1987. [Google Scholar]
  4. Tofail, S.A.; Koumoulos, E.P.; Bandyopadhyay, A.; Bose, S.; O’Donoghue, L.; Charitidis, C. Additive manufacturing: Scientific and technological challenges, market uptake and opportunities. Mater. Today 2018, 21, 22–37. [Google Scholar] [CrossRef]
  5. Sreehitha, V. Impact of 3D printing in automotive industry. Int. J. Mech. Prod. Eng. 2017, 5, 91–94. [Google Scholar]
  6. Javaid, M.; Haleem, A. Additive manufacturing applications in medical cases: A literature based review. Alex. J. Med. 2018, 54, 411–422. [Google Scholar] [CrossRef] [Green Version]
  7. Singamneni, S.; Lv, Y.; Hewitt, A.; Chalk, R.; Thomas, W.; Jordison, D. Additive Manufacturing for the Aircraft Industry: A Review. J. Aeronaut. Aerosp. Eng. 2019, 8, 1–13. [Google Scholar] [CrossRef] [Green Version]
  8. Zhang, Q.; Zhang, F.; Medarametla, S.P.; Li, H.; Zhou, C.; Lin, D. 3D Printing of Graphene Aerogels. Small 2016, 12, 1702–1708. [Google Scholar] [CrossRef]
  9. Noor, N.; Shapira, A.; Edri, R.; Gal, I.; Wertheim, L.; Dvir, T. 3D Printing of Personalized Thick and Perfusable Cardiac Patches and Hearts. Adv. Sci. 2019, 6, 1900344. [Google Scholar] [CrossRef] [Green Version]
  10. Attaran, M. The rise of 3-D printing: The advantages of additive manufacturing over traditional manufacturing. Bus. Horiz. 2017, 60, 677–688. [Google Scholar] [CrossRef]
  11. Dombroski, C.E.; Balsdon, M.E.R.; Froats, A. The use of a low cost 3D scanning and printing tool in the manufacture of custom-made foot orthoses: A preliminary study. BMC Res. Notes 2014, 7, 443. [Google Scholar] [CrossRef] [Green Version]
  12. Xu, J.; Ding, L.; Love, P. Digital reproduction of historical building ornamental components: From 3D scanning to 3D printing. Autom. Constr. 2017, 76, 85–96. [Google Scholar] [CrossRef]
  13. Karayannis, P.; Petrakli, F.; Gkika, A.; Koumoulos, E.P. 3D-Printed Lab-on-a-Chip Diagnostic Systems-Developing a Safe-by-Design Manufacturing Approach. Micromachines 2019, 10, 825. [Google Scholar] [CrossRef] [PubMed] [Green Version]
  14. Schraufnagel, D.E. The health effects of ultrafine particles. Exp. Mol. Med. 2020, 52, 311–317. [Google Scholar] [CrossRef] [PubMed]
  15. Dobrzyńska, E.; Kondej, D.; Kowalska, J.; Szewczyńska, M. State of the art in additive manufacturing and its possible chemical and particle hazards—Review. Indoor Air 2021, 31, 1733–1758. [Google Scholar] [CrossRef] [PubMed]
  16. Wojtyła, S.; Klama, P.; Śpiewak, K.; Baran, T. 3D printer as a potential source of indoor air pollution. Int. J. Environ. Sci. Technol. 2019, 17, 207–218. [Google Scholar] [CrossRef]
  17. Stephens, B.; Azimi, P.; El Orch, Z.; Ramos, T. Ultrafine particle emissions from desktop 3D printers. Atmos. Environ. 2013, 79, 334–339. [Google Scholar] [CrossRef]
  18. Zhang, Q.; Pardo, M.; Rudich, Y.; Kaplan-Ashiri, I.; Wong, J.P.S.; Davis, A.Y.; Black, M.S.; Weber, R.J. Chemical Composition and Toxicity of Particles Emitted from a Consumer-Level 3D Printer Using Various Materials. Environ. Sci. Technol. 2019, 53, 12054–12061. [Google Scholar] [CrossRef] [Green Version]
  19. Jeon, H.; Park, J.; Kim, S.; Park, K.; Yoon, C. Effect of nozzle temperature on the emission rate of ultrafine particles during 3D printing. Indoor Air 2019, 30, 306–314. [Google Scholar] [CrossRef]
  20. Bernatikova, S.; Dudacek, A.; Prichystalova, R.; Klecka, V.; Kocurkova, L. Characterization of Ultrafine Particles and VOCs Emitted from a 3D Printer. Int. J. Environ. Res. Public Health 2021, 18, 929. [Google Scholar] [CrossRef]
  21. Dunn, K.L.; Hammond, D.; Lo, S. Three-dimensional printer emissions and employee exposures to ultrafine particles during the printing of thermoplastic filaments containing carbon nanotubes or carbon nanofibers. J. Nanoparticle Res. 2020, 22, 46. [Google Scholar] [CrossRef]
  22. Zhu, Q.; Yao, Q.; Liu, J.; Sun, J.; Wang, Q. Emissions from the fused filament fabrication 3D printing with lignocellulose/polylactic acid filament. BioResources 2020, 15, 7560–7572. [Google Scholar] [CrossRef]
  23. Alberts, E.; Ballentine, M.; Barnes, E.; Kennedy, A. Impact of metal additives on particle emission profiles from a fused filament fabrication 3D printer. Atmos. Environ. 2021, 244, 117956. [Google Scholar] [CrossRef]
  24. Katz, E.F.; Goetz, J.D.; Wang, C.; Hart, J.L.; Terranova, B.; Taheri, M.L.; Waring, M.S.; Decarlo, P.F. Chemical and Physical Characterization of 3D Printer Aerosol Emissions with and without a Filter Attachment. Environ. Sci. Technol. 2020, 54, 947–954. [Google Scholar] [CrossRef] [PubMed]
  25. Zhang, Q.; Wong, J.P.S.; Davis, A.Y.; Black, M.S.; Weber, R.J. Characterization of particle emissions from consumer fused deposition modeling 3D printers. Aerosol Sci. Technol. 2017, 51, 1275–1286. [Google Scholar] [CrossRef] [Green Version]
  26. Ding, S.; Ng, B.F.; Shang, X.; Liu, H.; Lu, X.; Wan, M.P. The characteristics and formation mechanisms of emissions from thermal decomposition of 3D printer polymer filaments. Sci. Total Environ. 2019, 692, 984–994. [Google Scholar] [CrossRef]
  27. Farcas, M.T.; Stefaniak, A.B.; Knepp, A.K.; Bowers, L.; Mandler, W.K.; Kashon, M.; Jackson, S.R.; Stueckle, T.A.; Sisler, J.D.; Friend, S.A.; et al. Acrylonitrile butadiene styrene (ABS) and polycarbonate (PC) filaments three-dimensional (3-D) printer emissions-induced cell toxicity. Toxicol. Lett. 2019, 317, 1–12. [Google Scholar] [CrossRef]
  28. Farcas, M.T.; McKinney, W.; Qi, C.; Mandler, K.W.; Battelli, L.; Friend, S.A.; Stefaniak, A.B.; Jackson, M.; Orandle, M.; Winn, A.; et al. Pulmonary and systemic toxicity in rats following inhalation exposure of 3-D printer emissions from acrylonitrile butadiene styrene (ABS) filament. Inhal. Toxicol. 2020, 32, 403–418. [Google Scholar] [CrossRef]
  29. Stefaniak, A.; LeBouf, R.; Duling, M.; Yi, J.; Abukabda, A.; McBride, C.; Nurkiewicz, T. Inhalation exposure to three-dimensional printer emissions stimulates acute hypertension and microvascular dysfunction. Toxicol. Appl. Pharmacol. 2017, 335, 1–5. [Google Scholar] [CrossRef]
  30. Gümperlein, I.; Fischer, E.; Dietrich-Gümperlein, G.; Karrasch, S.; Nowak, D.; Jörres, R.A.; Schierl, R. Acute health effects of desktop 3D printing (fused deposition modeling) using acrylonitrile butadiene styrene and polylactic acid materials: An experimental exposure study in human volunteers. Indoor Air 2018, 28, 611–623. [Google Scholar] [CrossRef]
  31. Umans, J.G.; Levi, R. Nitric Oxide in the Regulation of Blood Flow and Arterial Pressure. Annu. Rev. Physiol. 1995, 57, 771–790. [Google Scholar] [CrossRef]
  32. Furchgott, R.F.; Zawadzki, J.V. The obligatory role of endothelial cells in the relaxation of arterial smooth muscle by acetylcholine. Nature 1980, 288, 373–376. [Google Scholar] [CrossRef]
  33. Chan, F.L.; House, R.; Kudla, I.; Lipszyc, J.C.; Rajaram, N.; Tarlo, S. Health survey of employees regularly using 3D printers. Occup. Med. 2018, 68, 211–214. [Google Scholar] [CrossRef] [PubMed] [Green Version]
  34. House, R.; Rajaram, N.; Tarlo, S. Case report of asthma associated with 3D printing. Occup. Med. 2017, 67, 652–654. [Google Scholar] [CrossRef] [PubMed] [Green Version]
  35. Ferreira, I.; Machado, M.; Alves, F.J.L.; Marques, A.T. A review on fibre reinforced composite printing via FFF. Rapid Prototyp. J. 2019, 25, 972–988. [Google Scholar] [CrossRef]
  36. Shalom, H.; Kapishnikov, S.; Brumfeld, V.; Naveh, N.; Tenne, R.; Lachman, N. Strong, tough and bio-degradable polymer-based 3D-ink for fused filament fabrication (FFF) using WS2 nanotubes. Sci. Rep. 2020, 10, 1–8. [Google Scholar] [CrossRef]
  37. Zhang, D.; Chi, B.; Li, B.; Gao, Z.; Du, Y.; Guo, J.; Wei, J. Fabrication of highly conductive graphene flexible circuits by 3D printing. Synth. Met. 2016, 217, 79–86. [Google Scholar] [CrossRef]
  38. Spinelli, G.; Kotsilkova, R.; Ivanov, E.; Petrova-Doycheva, I.; Menseidov, D.; Georgiev, V.; Di Maio, R.; Silvestre, C. Effects of Filament Extrusion, 3D Printing and Hot-Pressing on Electrical and Tensile Properties of Poly(Lactic) Acid Composites Filled with Carbon Nanotubes and Graphene. Nanomaterials 2019, 10, 35. [Google Scholar] [CrossRef] [Green Version]
  39. Love, L.J.; Kunc, V.; Rios, O.; Duty, C.E.; Elliott, A.M.; Post, B.K.; Smith, R.J.; Blue, C.A. The importance of carbon fiber to polymer additive manufacturing. J. Mater. Res. 2014, 29, 1893–1898. [Google Scholar] [CrossRef] [Green Version]
  40. LW-PLA BLACK. Available online: https://colorfabb.com/lw-pla-black (accessed on 20 July 2021).
  41. Tothill, A.M.; Partridge, M.; James, S.W.; Tatam, R. Fabrication and ptimization of a fused filament 3D-printed microfluidic platform. J. Micromech. Microeng. 2017, 27, 035018. [Google Scholar] [CrossRef] [Green Version]
  42. Pranzo, D.; Larizza, P.; Filippini, D.; Percoco, G. Extrusion-Based 3D Printing of Microfluidic Devices for Chemical and Biomedical Applications: A Topical Review. Micromachines 2018, 9, 374. [Google Scholar] [CrossRef] [Green Version]
  43. Kotz, F.; Mader, M.; Dellen, N.; Risch, P.; Kick, A.; Helmer, D.; Rapp, B.E. Fused Deposition Modeling of Microfluidic Chips in Polymethylmethacrylate. Micromachines 2020, 11, 873. [Google Scholar] [CrossRef]
  44. Morgan, A.J.L.; Jose, L.H.S.; Jamieson, W.; Wymant, J.M.; Song, B.; Stephens, P.; Barrow, D.A.; Castell, O. Simple and Versatile 3D Printed Microfluidics Using Fused Filament Fabrication. PLoS ONE 2016, 11, e0152023. [Google Scholar] [CrossRef] [PubMed] [Green Version]
  45. M3DloC—Additive Manufacturing of 3D Microfluidic MEMS for Lab-on-a-Chip Applications. Available online: https://www.m3dloc.net/ (accessed on 15 June 2021).
  46. Gomez, J.; Villaro, E.; Navas, A.; Recio, I. Testing the influence of the temperature, RH and filler type and content on the universal power law for new reduced graphene oxide TPU composites. Mater. Res. Express 2017, 4, 105020. [Google Scholar] [CrossRef] [Green Version]
  47. Hummers, W.S., Jr.; Offeman, R.E. Preparation of Graphitic Oxide. J. Am. Chem. Soc. 1958, 80, 1339. [Google Scholar] [CrossRef]
  48. Maddalena, L.; Gomez, J.; Fina, A.; Carosio, F. Effects of graphite oxide nanoparticle size on the functional properties of layer-by-layer coated flexible foams Nanomaterials. Nanomaterials 2021, 11, 266. [Google Scholar] [CrossRef]
  49. ANSI/CAN/UL 2904; Standard Method for Testing and Assessing Particle and Chemical Emissions from 3D Printers. UL; LLC: Northbrook, IL, USA, 2019.
  50. ISO/ASTM CD 52932; Additive Manufacturing—Environmental Health and Safety—Standard Test Method for Determination of Particle Emission Rates from Desktop 3D Printers Using Material Extrusion. International Organization for Standardization: Geneva, Switzerland, 2015.
  51. OECD-ENV/JM/MONO(2015)19; Harmonized Tiered Approach to Measure and Assess the Potential Exposure to Airborne Emissions of Engineered Nano-Objects and Their Agglomerates and Aggregates at Workplaces; Series on the Safety of Manufactured Nanomaterials No. 55. OECD Environment Directorate, Environment, Health and Safety Division: Paris, France.
  52. Concentration Particle Counter 3007|TSI. Available online: https://www.tsi.com/condensation-particle-counter-3007/ (accessed on 10 June 2021).
  53. Aerotrak Handheld Particle Counter|TSI. Available online: https://www.tsi.com/aerotrak-handheld-particle-counter-9306/ (accessed on 10 June 2021).
  54. DC1700-PM PM2.5/PM10 AQM. Available online: http://www.dylosproducts.com/dcpmaqm.html (accessed on 10 June 2021).
  55. Handheld VOC Gas Detector. Available online: https://www.ionscience.com/products/tiger-handheld-voc-detector/ (accessed on 10 June 2021).
  56. RAE Systems. The PID Handbook Theory and Applications of Direct-Reading Photoionization Detectors (PIDs), 3rd ed.; RAE Systems Inc.: San Jose, CA, USA, 2013. [Google Scholar]
  57. Laboratory Evaluation Dylos-DC1700 PM Sensor, AQ-SPEC Air Quality Sensor Performance Evaluation Center. Available online: http://www.aqmd.gov/docs/default-source/aq-spec/laboratory-evaluations/dylos---lab-evaluation.pdf?sfvrsn=2 (accessed on 10 June 2021).
  58. Park, H.-Y.; Gilbreath, S.; Barakatt, E. Respiratory outcomes of ultrafine particulate matter (UFPM) as a surrogate measure of near-roadway exposures among bicyclists. Environ. Health 2017, 16, 6. [Google Scholar] [CrossRef] [Green Version]
  59. Urban Air Quality Monitoring: Number-and Mass-Based Solutions from TSI Application Note ENV-002 (US). Available online: https://tsi.com/getmedia/f1da0f65-4d63-46d6-8caa-5f8a5969b8aa/Application-Note-ENV-002-(US)-Rev-A_Web_2 (accessed on 18 August 2021).
  60. Kim, Y.; Yoon, C.; Ham, S.; Park, J.; Kim, S.; Kwon, O.; Tsai, P.-J. Emissions of Nanoparticles and Gaseous Material from 3D Printer Operation. Environ. Sci. Technol. 2015, 49, 12044–12053. [Google Scholar] [CrossRef]
  61. Large Format 3D Printer Raise3d Pro2 Plus. Available online: https://www.raise3d.com/products/pro2-plus-3d-printer/ (accessed on 3 August 2021).
  62. Stefaniak, A.B.; Bowers, L.N.; Knepp, A.K.; Virji, M.A.; Birch, E.M.; Ham, J.E.; Wells, J.R.; Qi, C.; Schwegler-Berry, D.; Friend, S.; et al. Three-dimensional printing with nano-enabled filaments releases polymer particles containing carbon nanotubes into air. Indoor Air 2018, 28, 840–851. [Google Scholar] [CrossRef]
  63. Graphene Enhanced PLA Filament. Available online: http://3dfilaprint.com/msds-for-haydale-graphene-enhanced-pla-filament/ (accessed on 1 August 2021).
  64. Davis, A.; Black, M.; Zhang, Q.; Wong, J.P.S.; Weber, R. Fine Particulate and Chemical Emissions from Desktop 3D Printers. In NIP & Digital Fabrication Conference; Society for Imaging Science and Technology: Virginia, VA, USA, 2016; pp. 121–123. [Google Scholar]
  65. Steinle, P. Characterization of emissions from a desktop 3D printer and indoor air measurements in office settings. J. Occup. Environ. Hyg. 2016, 13, 121–132. [Google Scholar] [CrossRef]
  66. Zontek, T.L.; Ogle, B.R.; Jankovic, J.T.; Hollenbeck, S.M. An exposure assessment of desktop 3D printing. ACS Chem. Health Saf. 2017, 24, 15–25. [Google Scholar] [CrossRef] [Green Version]
  67. Deng, Y.; Cao, S.-J.; Chen, A.; Guo, Y. The impact of manufacturing parameters on submicron particle emissions from a desktop 3D printer in the perspective of emission reduction. Build. Environ. 2016, 104, 311–319. [Google Scholar] [CrossRef]
  68. Pal, N.; Banerjee, S.; Roy, P.; Pal, K. Reduced graphene oxide and PEG-grafted TEMPO-oxidized cellulose nanocrystal reinforced poly-lactic acid nanocomposite film for biomedical application. Mater. Sci. Eng. C 2019, 104, 109956. [Google Scholar] [CrossRef] [PubMed]
  69. ICRP. Human Respiratory Tract Model for Radiological Protection; ICRP Publication 66. Ann.; ICRP: Stockholm, Sweden, 1994; Volume 24, pp. 1–3. [Google Scholar]
  70. Mendes, L.; Kangas, A.; Kukko, K.; Mølgaard, B.; Säämänen, A.; Kanerva, T.; Ituarte, I.F.; Huhtiniemi, M.; Stockmann-Juvala, H.; Partanen, J.; et al. Characterization of Emissions from a Desktop 3D Printer. J. Ind. Ecol. 2017, 21, 94–106. [Google Scholar] [CrossRef]
  71. Hendrikx, B.; Van Broekhuizen, P. Nano reference values in the Netherlands. Gefahrst. Reinhalt. Luft. 2013, 73, 407–414. [Google Scholar]
  72. Quang, T.N.; He, C.; Morawska, L.; Knibbs, L. Influence of ventilation and filtration on indoor particle concentrations in urban office buildings. Atmos. Environ. 2013, 79, 41–52. [Google Scholar] [CrossRef] [Green Version]
  73. D’Alicandro, A.C.; Mauro, A. Effects of operating room layout and ventilation system on ultrafine particle transport and deposition. Atmos. Environ. 2021, 270, 118901. [Google Scholar] [CrossRef]
  74. MacCuspie, R.I.; Hill, W.C.; Hall, D.R.; Korchevskiy, A.; Strode, C.D.; Kennedy, A.J.; Ballentine, M.L.; Rycroft, T.; Hull, M.S. Prevention through design: Insights from computational fluid dynamics modeling to predict exposure to ultrafine particles from 3D printing. J. Toxicol. Environ. Health Part A 2021, 84, 458–474. [Google Scholar] [CrossRef]
Figure 1. Methodology applied for the release and exposure measurements.
Sustainability 14 03046 g001
Figure 2. Measurement setup I. (a)—Aerotrak 9306, (b)—CPC 3007.
Sustainability 14 03046 g002
Figure 3. Measurement setup II: (a) particle count instruments, (b) Ionscience Tiger.
Sustainability 14 03046 g003
Figure 4. Printing object types. (ac)—slicer view, object types A, B and C, respectively. (df)—printed object view, object types A, B and C, respectively.
Sustainability 14 03046 g004
Figure 5. Particle concentrations for all instruments for measurements 1 and 2. Background color denotes the filament used at any time, with lower opacity representing lower temperature. (ac)—measurement 1 readings of instruments: CPC 3007, Aerotrak 9306, Dylos DC1700, respectively, (df)—measurement 2 readings of instruments: CPC 3007, Aerotrak 9306, Dylos DC1700, respectively.
Sustainability 14 03046 g005
Figure 6. Particle concentrations inside the printer enclosure for all instruments (measurement 3). Background color denotes the filament used at any time. (a)—CPC 3007 readings (b)—Aerotrak 9306 readings (c)—Dylos DC1700 readings.
Sustainability 14 03046 g006
Figure 7. Particle concentrations inside the breathing zone for all instruments (measurements 5, 6). Background color denotes the filament used at any time. (ac)—measurement 5 readings of instruments: CPC 3007, Aerotrak 9306, Dylos DC1700, respectively, (df)—measurement 6 readings of instruments: CPC 3007, Aerotrak 9306, Dylos DC1700, respectively.
Sustainability 14 03046 g007
Figure 8. Workflow suggested as preparatory work before mass production.
Sustainability 14 03046 g008
Table 1. Filaments used as 3D printer feedstocks during the exposure assessment experiments.
Material NameCompositionType of MaterialQuantity of Filament
Ingeo 3D850/3052D4:1 blend (20 wt %)PLA/PLA8 m
Ingeo 3D850/BASF ecovio IS13354:1 blend (20 wt %)PLA/PBAT/inorganic filler8 m
Ingeo 3D850/reduced graphene oxide (rGO)0.05 wt % rGOPLA/reduced graphene oxide8 m
Table 2. Information-gathering for the 3D printing workplace being studied.
Basic Exposure-Related Information
ProcessFused filament fabrication 3D printing
Release/exposure expectedEmission of particles (ultrafine and microscale) and VOCs due to partial decomposition and the thermal degradation of polymer filament.
Workroom characteristicsVolume: ≈45 m3
Air conditioning in function during the whole workday
Temperature: 24 °C–30 °C
Relative Humidity: 43–48%
Secondary processes conducted within the workroomOffice work supportive to the printer (e.g., STL file preparation, print video capture), print post-processing (e.g., support removal), print test result evaluation.
Materials usedIngeo 3D850/3052D—8 m of filament
Ingeo 3D850/BASF ecovio IS133—8 m of filament
Ingeo 3D850/reduced Graphene Oxide(rGO)—8 m of filament
Process automationManual process initiation (print start) and finish (print removal); printing itself requires only progress monitoring. Manual stop and object removal in the case of critical defects.
Process containmentPrinter (Raise3D Pro2 Plus 3D [61]) is fully enclosed while operating. Specific process sub-phases require short-term enclosure disruption.
Process durationFull 8 h workday. Long prints may continue overnight, being monitored remotely.
Employees associated with the process2 employees are directly involved (applicable for exposure scenarios 1–5—see Section 3.5) and 2 employees are indirectly involved (applicable for exposure scenarios 3–5—see Section 3.5).
Work patternsSpecific print phases or maintenance, repair, and process optimization activities require employees to work in close proximity to the printer, and with the main exposure control (printer enclosure) disabled.
Maintenance scheduleCleaning of the printer bed every day, removal of filament waste after every print, regular hot-end replacement, regular HEPA (high-efficiency particulate absorbing filter) filter replacement (printer outflow and air purifier).
Primary particle emission sourceMain 3D printing process
Incidental particle emission sourcesNo other instruments that can lead to particle generation are used within the specific workroom during print operations. No apparent sources of significant incidental ultrafine particle emissions. General workplace dust particles may be present. Disturbance of settled/deposited particles on work surfaces may occur (e.g., due to air conditioning airflow).
Primary VOC emission sourceMain 3D printing process
Incidental VOC emission sourcesPrint bed adhesion sprays, print object coloring sprays
Current controls appliedGeneral Ventilation, Mechanical ventilation, HEPA filter in printer enclosure exhaust, Air purifier equipped with HEPA filter, filtering facepiece respirators (FFP3) masks available in the workplace.
Table 3. Measurement characteristics and objectives.
ParameterMeasurement 1Measurement 2Measurement 3Measurement 4Measurement 5Measurement 6
Instrument setupSetup I. Emission source and far fieldSetup I. Emission source and far fieldSetup I. Emission source and far fieldSetup II. Breathing ZoneSetup II. Breathing ZoneSetup II. Breathing Zone
Nozzle diameter0.4 mm0.4 mm0.2 mm0.4 mm0.2 mm0.2 mm
Print objectType AType AType BType CType BType B
Controls ActiveAll controlsAll controlsAll controlsAll controlsAll controlsAll controls
Materials testedIngeo 3D850/3052DIngeo 3D850/BASF ecovio IS133
Ingeo 3D850/reduced Graphene Oxide(rGO)
Ingeo 3D850/3052DIngeo 3D850/BASF ecovio IS133
Ingeo 3D850/reduced Graphene Oxide(rGO)
Ingeo 3D850/3052DIngeo 3D850/BASF ecovio IS133Ingeo 3D850/3052DIngeo 3D850/BASF ecovio IS133
Ingeo 3D850/reduced Graphene Oxide(rGO)
Ingeo 3D850/3052DIngeo 3D850/BASF ecovio IS133
Print nozzle temperature215 °C
225 °C
205 °C
235 °C
215 °C215 °C215 °CC215 °CC
ObjectiveDetermine the comparative particle emission potential of the 3 filament materials at temperatures close to the optimalDetermine the comparative particle emission potential of the 3 filament materials at temperatures farther from the optimal (higher and lower)Determine the particle emission potential when printing objects relevant to microfluidics and comparison to test objectsDetermine the comparative TVOC emission potential of the 3 filament materialsDetermine the employee airborne particle exposure magnitude and control efficiency, compared to Measurement 3, for Ingeo 3D850/3052DDetermine the employee airborne particle exposure magnitude and control efficiency, compared to Measurement 3, for Ingeo 3D850/BASF ecovio IS133
Table 4. Type A Results Summary.
MaterialTemperatureMax. Peak conc. Value (UFPs) × 103 #/cm3Process Phase (Time)Max. Peak conc. Value (300–400 nm) #/cm3Process Phase (Time)
Ingeo 3D850/3052D20547.4Print Start
(11:58)
33Print Start
(12:00)
21558Preheat
(11:55)
9.8During printing
(12:17)
22531.3Print Start
(12:37)
22.5Print End
(12:55)
235343Print Start
(12:43)
23.5Print End
(12:59)
Ingeo 3D850/BASF ecovio IS1335205152Filament Loading
(13:19)
79.1Preheat
(13:26)
21515.9Print Start
(14:07)
34.7Print End
(14:25)
22514.3During printing
(13:35)
11Filament Unloading
(13:41)
235321Print Start
(14:00)
11.7Print End
(14:18)
Ingeo 3D850/reduced Graphene Oxide (rGO)20515.3Print Start
(14:41)
6.9Print Start
(14:41)
215109Print Start
(15:07)
11.7Preheat
(14:38)
225113Preheat
(15:47)
11.3Preheat
(15:45)
235308Print Start
(15:11)
8.8Print Start
(15:11)
Table 5. Type B Results Summary.
MaterialInstrument PlacementMax. Peak conc. Value (UFPs) × 103 #/cm3Process PhaseMax. Peak conc. Value (300–400 nm) #/cm3Process Phase
Ingeo 3D850/3052DSource219Preheat/Print Start55.7During Printing
Breathing Zone7.66Preheat28.8Print Start
Ingeo 3D850/BASF ecovio IS1335Source106Print Start34.5During Printing
Breathing Zone8.56Print Start15.3During Printing
Table 6. Exposure scenarios.
Scenario No.Scenario DescriptionExposure duration and PatternApplicable ControlsComments
1Employee performing printer and office work within the printing room for the whole duration of the working day.Employee exposed to workplace concentrations for an 8h shift.Administrative controls, shift optimization, minimization of employee presence during print operations.Exposure to both peaks and sustained workroom concentration. Can be easily mitigated through proper risk awareness and administrative controls.
2Employee controlling the printer during crucial print stages
(print failure removal, process inspection, and monitoring)
but not present during the whole print operation.
Employee potentially repeatedly exposed to high concentration peaks for short timeframes.Ventilation, personal protective equipment, remote monitoring.Employee presence and interference with the printer is needed for specific processes and tests, so many administrative controls are inapplicable.
3Employee regularly checking print status but not present during the whole print operation.If print proceeds successfully, very short exposure time. In case of failure, see scenario 2.Ventilation, personal protective equipment (in case of peak stage entry).Can be eliminated as a need with remote monitoring.
4Printer Cleaning and maintenance.If performed during an inappropriate print phase (e.g., high emission event), it can lead to high exposure.Administrative controls, ventilation, personal protective equipment.Proper scheduling of cleaning activities can remove exposure risk.
5Employee enters workspace after print completion (e.g., long “overnight” prints).Particle decay and removal is expected to lead to negligible exposure levels, provided that a level of ventilation remains in place.Additional controls not needed.-
Publisher’s Note: MDPI stays neutral with regard to jurisdictional claims in published maps and institutional affiliations.

