Review

The Contribution of Data-Driven Technologies in Achieving the Sustainable Development Goals

Center of Excellence for Smart Production, Research Group Operations Management, University of Applied Sciences Upper Austria, Wehrgrabengasse 1-3, 4400 Steyr, Austria
*
Author to whom correspondence should be addressed.
Sustainability 2022, 14(5), 2497; https://doi.org/10.3390/su14052497
Submission received: 13 January 2022 / Revised: 16 February 2022 / Accepted: 20 February 2022 / Published: 22 February 2022
(This article belongs to the Collection Digitalization and Sustainable Development)

Abstract

:
The United Nations’ Sustainable Development Goals (SDGs) set out to improve the quality of life of people in developed, emerging, and developing countries by covering social and economic aspects, with a focus on environmental sustainability. At the same time, data-driven technologies influence our lives in all areas and have caused fundamental economical and societal changes. This study presents a comprehensive literature review on how data-driven approaches have enabled or inhibited the successful achievement of the 17 SDGs to date. Our findings show that data-driven analytics and tools contribute to achieving the 17 SDGs, e.g., by making information more reliable, supporting better-informed decision-making, implementing data-based policies, prioritizing actions, and optimizing the allocation of resources. Based on a qualitative content analysis, results were aggregated into a conceptual framework, including the following categories: (1) uses of data-driven methods (e.g., monitoring, measurement, mapping or modeling, forecasting, risk assessment, and planning purposes), (2) resulting positive effects, (3) arising challenges, and (4) recommendations for action to overcome these challenges. Despite positive effects and versatile applications, problems such as data gaps, data biases, high energy consumption of computational resources, ethical concerns, privacy, ownership, and security issues stand in the way of achieving the 17 SDGs.

1. Introduction

The Sustainable Development Goals (SDGs) formulated by the United Nations (UN) are internationally agreed goals to improve the quality of life for billions of people in developed, emerging, and developing countries by covering the social and economic aspects of human society, with a focus on economic security and environmental sustainability [1]. The SDGs comprise 17 agendas with 169 targets and 232 indicators that apply to all countries and regions of the world and that are planned to be implemented by 2030. When the goals were adopted in 2015, it was agreed that their progress would be reviewed regularly at the regional, national, and global levels [2]. Despite qualitative and quantitative assessments at national government levels, a cross-country study (sample of 26 countries) by Allen et al. [3] shows that while good progress has been made in the implementation stage, there are large gaps in further stages.
Since (big) data-driven analytics, artificial intelligence (AI), the Internet of Things (IoT), deep learning (DL), and machine learning (ML) influence our lives in all areas and have caused fundamental change processes in recent years [4], this study is concerned with the research question of the extent to which such data-driven technologies have enabled or inhibited the successful achievement of the 17 SDGs to date. For this purpose, a comprehensive review of the relevant scientific literature on the impact of data-driven approaches on sustainable development in the context of each of the 17 SDGs was conducted. Our findings show that data-driven analytics and tools are primarily used for data collection, monitoring, forecasting, and mapping or modeling.
The paper is structured as follows: First, the applied methods (i.e., literature review, content analysis) are described. Second, the results of our literature review are summarized by presenting the state of research separately for each of the 17 SDGs. Third, we summarize the state of research based on the literature, address the potential uses of data-driven methods, and present the resulting positive effects as well as arising challenges. We derive recommendations for action to overcome these problems and to set priorities that should be pursued over the next decade to enhance the positive impact of data-driven approaches on achieving the SDGs by 2030. The paper ends with the discussion of results and conclusion.

2. Materials and Methods

Our study aimed to identify and summarize the current state of research on the extent to which data-driven technologies have enabled or inhibited the successful achievement of the 17 SDGs to date. To answer our research question, an exploratory literature search, loosely based on the method of Tranfield et al. [5] for systematic literature reviews, was conducted to identify relevant articles in the field and to provide a comprehensive overview of the state of research. The exploratory search for publications covered the two topics of data-driven technologies and sustainable development (cf. SDGs). Articles were identified that contained a combination (AND conjunction) of two groups of keywords, either of which was included in the title, the keywords, or the abstract. The first group of keywords referred to data-driven technologies (e.g., AI, big data, data mining, DL, ML, etc.), and the second group of keywords referenced SDGs or sustainability. Separate searches were conducted for each SDG, and keywords were assigned for each that encompassed the SDG’s topic. To give an example: For SDG 6 (Clean Water and Sanitation), these were the keywords “Water stress; water resources management; water scarcity; water security; wastewater; sanitation; hygiene”. We searched several databases (e.g., Google Scholar) to obtain an initial sample of English-language journal articles published between 2015 and 2021. The search was not limited to journals in a particular scientific discipline. Our inclusion criteria were broad, as in addition to journal articles, also conference proceedings, working papers, and book chapters were included. Care was taken to include mostly ranked journals and/or frequently cited articles. No specific class of journals was preselected with respect to their ranking (e.g., top-ranked journals). This approach is based on Kubíček and Machek [6], who argue that “innovative research ideas may even appear in lower-ranked journals” (p. 967). A total of 193 papers were identified as being relevant to the review. Despite its limited representativeness, the exploratory literature review shows that there is a vast body of knowledge from different disciplines regarding data-driven models and their influence on helping to achieve the SDGs.
In an attempt to identify and synthetize the state of research on the extent to which data-driven technologies have enabled or inhibited the successful achievement of the 17 SDGs, we followed the process of qualitative content analysis presented by Finfgeld-Connett [7]: We conscientiously read each article to identify data segments and codes (step 1: identification of data segments) and organized these findings in a spreadsheet (step 2: data matrices and coding). As data analysis progressed, coded findings were interpreted, synthesized across studies, and continuously recorded (step 3: memoing). Subsequently, the apparent relation between codes and accompanying memos was compiled in a diagram (step 4: diagramming), on the basis of which our results were later aggregated into a conceptual framework. Through the iterative process of reflecting on ideas and their interconnections (step 5: reflection), concepts were gradually constructed. We synthesized findings into the following categories: (1) uses of data-driven methods, (2) resulting positive effects, (3) arising challenges, and (4) recommendations for action to overcome these challenges. The content analysis of the identified articles was carried out systematically, organized by the respective SDGs, and summarized in the following chapters. In the presentation of the 17 SDGs, selected targets and indicators are mentioned whose inclusion is based on the fact that they are named in the sampled literature or can be clearly identified. However, covering all 169 targets and 232 indicators would go far beyond the scope of this paper.

3. Results of the Literature Analysis: The 17 Sustainable Development Goals

3.1. SDG 1: No Poverty

In achieving the SDGs, poverty eradication (SDG 1) is one of the biggest challenges globally. According to recent estimates, 10% of the world’s population lived on less than 1.90 USD/d in 2015 [8], and 55% of the world’s population did not receive any form of social protection in 2016. The current COVID-19 pandemic has led to the first increase in extreme poverty in over 20 years, and 119–124 million people have been pushed back into extreme poverty, as measured by living on less than 1.25 USD/d. The global poverty rate is projected to reach 7% by 2030, missing the goal of eradicating poverty (targets 1.1 and 1.2) [9].
Income and consumption levels are simple—albeit unidimensional—indicators that have been developed and used in various studies [10,11,12,13] to estimate the number of people living below the poverty line and the extent of poverty-related problems. However, economists criticize such unidimensional approaches and call for the development of multidimensional ones that incorporate monetary and non-monetary attributes to measure poverty. Data-driven and big data models are applied to map poverty among individuals, households, and regions [14,15,16], to make and implement poverty alleviation policies [17], and to monitor and forecast the impact of such policies and schemes [18].
A significant challenge in achieving SDG 1 is to obtain appropriate data for poverty-afflicted regions, communities, households, and individuals. At present, such data are absent or irregular, and often inaccurate: Jean et al. [15] point out the lack of data for various sub-Saharan countries where economic surveys are not regularly conducted, and data are not curated and unavailable to the public. High-quality data enable an accurate estimation of the impact and prevalence of poverty, provide an understanding of the socioeconomic causes of poverty, and thereby support decision-making that leads to the implementation of effective countermeasures (e.g., policies and social benefit schemes) and the monitoring of poverty alleviation.
Cell phone usage data (cf. digital footprint) and ML models are used in determining the distribution of wealth at the macro- and micro-levels in a region and to estimate the socioeconomic status of the population. Blumenstock et al. [14] used cell phone usage and log data from a telecommunications operator in Rwanda, which they transformed into quantitative input features to derive a composite wealth index, asset prediction, and classification. Prediction model outputs were determined by a telephone survey of 856 respondents. Such predictions were utilized to estimate micro-level wealth distribution, to identify poverty-affected regions, and to allow governments and local administrations to focus on the most affected regions at a much lower cost than with conventional methods [17].
Satellite imagery data (e.g., nighttime lights) are used as a proxy to study a region’s economic activities: Topological characteristics of the geography that can be mapped using satellite data are related to economic activities, wealth distribution, and poverty measures [16]. For example, nighttime lights data are positively correlated with the gross regional product [19]. Data are used, with the aid of DL and ML models, for the temporal and spatial prediction of wealth in economically deprived regions and for the estimation of household income and other poverty indices [15,20,21,22].
One of the greatest challenges in sustainable poverty alleviation programs is to prevent from falling back into poverty those families who previously benefitted from poverty eradication policies and benefit schemes. Sheng et al. [18] proposed a combined DL neural network to automatically forecast the likelihood of a household falling back into poverty in the future based on a model considering the family dependence graph (for Graph Neural Network) and locality, income, and expenditure information (for Gated Recurrent Unit). The output labels in the model were determined based on the probability of sinking back into poverty in a particular year. Rule-based measures can help sustain local governments’ poverty alleviation efforts, while requiring the performance of regular surveys, the monitoring of beneficiaries, and the development of databases that help assess the effect of poverty eradication policies and monitor individuals’ socioeconomic status.
Vinuesa et al. [23] discuss the positive and negative effects of AI in the context of achieving the 17 SDGs. Concerning SDG 1, positive effects of AI were observed regarding poverty prediction, implementation of social protection/benefit systems and access to essential services for economically disadvantaged and marginalized people, worldwide collaboration in poverty alleviation programs, mobilization of resources, and development of a robust policy framework. Negative effects included increased economic and social inequalities in emerging and developing countries due to digital technologies and a lack of access for economically disadvantaged and marginalized people to basic services due to data biases in the model and resulting biased policy implementation. Data bias is a systematic distortion of sample data that affects the representativeness and predictability of the data [24] and might reflect biases based on race, gender, religion, or disability [25,26]. Fair and efficient model development using data-driven AI and ML models offers the potential to resolve poverty-related challenges by allowing higher level understanding and prediction-based decision-making. The collaborative and focused attention of policymakers, government agencies, economists, service providers, and technology/AI developers is required to maximize AI and ML models’ potential to alleviate poverty.

3.2. SDG 2: Zero Hunger

SDG 2 sets out to end hunger (target 2.1), achieve food security and improved nutrition (i.e., end all forms of malnutrition) (target 2.2), and promote sustainable agriculture (target 2.4). The unavailability of food in the required quantity causes people to consume less food, which can lead to severe malnutrition and starvation [27]. The reasons for hunger in regions and communities where this problem is acute are complex and include food insecurity caused by poverty, political instability, the lack of social benefit systems, low agricultural productivity, unemployment, famine, natural disasters, wars and conflicts, social discrimination, and gender inequality. Food security is particularly important for the sustainable development of countries, which can be supported by increasing production efficiency. Far-reaching measures are needed, such as (1) comprehensive reduction in grain consumption across all channels, (2) effective intersectoral cooperation among national and regional organizations, and (3) allocation of public funds for intensification of agricultural production and development of industrial infrastructure [28]. To achieve zero hunger goals in the short and long term, the problem must be addressed at multiple levels: Robust policy making and policy implementation [29,30] are needed that ensure food supply by increasing agricultural productivity (target 2.3) and sustainable food production (target 2.4). In addition, efficient supply chain management is needed that can respond to short product life, large fluctuations in supply and demand, seasonal production, and quality issues (target 2.c) [31]. The problem of food insecurity could be addressed by establishing robust social benefit systems as well as food distribution systems that enable people struggling with acute hunger to purchase food at affordable prices and in sufficient quantity and quality.
AI and ML models are being widely used to achieve various SDG 2-related targets and to provide efficient management techniques to address hunger at the primary level, e.g., mapping macro- and micro-level poverty (cf. SDG 1), monitoring sustainable benefit schemes, monitoring food and nutritional supply, and increasing sustainable agricultural production whilst ensuring minimal environmental damage. Addressing malnutrition requires a well-resourced data and information system that includes multisectoral actions [32]. However, data related to hunger and nutrition are sparse, incomplete, and scattered. A framework that can integrate, curate, and analyze data is therefore needed to provide insights into regions experiencing undernutrition and to address challenges in eradicating malnutrition. Data-driven analytics and tools are useful for understanding hunger-related issues and taking action to prevent them. DataDent [33] proposes a visualization tool based on a robust data value chain (e.g., prioritization of measurements, data creation and collection, data curation, and data analysis) to address nutrition-related challenges and enable effective policymaking, evidence-based decision-making, and collaboration.
A key issue in addressing hunger is increasing agricultural production (target 2.3) and developing an efficient and sustainable distribution system. The European Commission’s Farm to Fork (F2F) strategy under the European Green Deal aims to make food systems fair, healthy, and environmentally friendly and to reduce food waste [34]. One of the goals of the F2F strategy is healthy food from healthy soils [35]. Data-driven analytics and ML models are applied in recommendation systems for crop identification, selection, and protection, crop growth monitoring, yield maximization and optimization, fertilizer recommendation, and soil quality [36,37,38,39,40,41,42]. To measure progress in implementing a reduction in chemical/hazardous pesticide and fertilizer use in agriculture, a monitoring, reporting, and verification system for organic carbon in agricultural soils is needed [43]. The use of pulsed electric fields could improve energy and yield efficiency of tomato processing by using less energy in pressing tomatoes and reducing greenhouse gas emissions [44,45]. AI- and ML-based models and technologies are being used for sustainable livestock farming, such as monitoring animal health and well-being, predicting disease, and optimizing dietary supply, intake, and consumption of nutrients [46,47,48,49,50,51]. To determine where and how to target efforts most effectively, it is necessary to capture where along the food chain, in which foods, and in which countries the greatest losses occur [52]. However, the lack of comprehensive data on the amount of food wasted makes it difficult to determine the effectiveness of prevention and reduction efforts [53].
The current food system is under pressure due to various challenges, such as growing population, climate change, soil degradation and erosion, eradication of all forms of hunger, price instability, and environmental regeneration [54,55]. These challenges could be met with sustainable intensification (SI) of food production, but implementing SI strategies can involve trade-offs with environmental issues, land use, marketing of agricultural products, and other governance and policy issues. Purnhagen et al. [56] indicate that achieving SDG 2 would benefit from incorporating innovations in biotechnology into organic agriculture, as otherwise, the desired increase in organic production could lead to less sustainable food systems. Minimizing trade-offs in the sustainable food system can be achieved through the application of cutting-edge technologies of AI, data-driven and ML models, and computational methods. Fanzo et al. [57] present a food systems dashboard and visualization tool that provides detailed information for 140 indicators for global, national, and regional food systems, integrates them, and makes them comparable. As a result, it helps prioritize actions to improve diet quality and nutrition and to make decisions based on high-quality data. The dashboard is based on the interconnectedness of various components of the food system, including consumer behavior and diet, individual factors (economic, cognitive, aspirational, and situational), external factors (environmental, political, social, and economic), and the food supply chain. AI and ML models for descriptive, predictive, and prescriptive methods are applied to analyze economic, social, and environmental indicators of the agriculture supply chain (ASC) using soil, weather, yield, and geographic information systems, as well as satellite, irrigation, livestock, and economic data [58,59]. Gardas et al. [60] propose interpretive structural modeling for exploring the indirect impact of different variables, using the influence matrix and reachability matrix in the ASC as a decision support system for policymakers to improve the performance of the ASC. Liu et al. [61] discuss supply chain (re)structuring utilizing big data and blockchain applicable for pricing and investment decisions in the green agri-food supply chain.
Smart farming, precision farming, digital agriculture, and precision irrigation are emerging areas where big data, sensors and IoT infrastructure, robotics, and data analytics are key components of the smart agriculture infrastructure. These applications minimize cost, improve farmers’ profit, enable faster and robust supply chain management, and improve transparency. Agricultural activities are driven by AI and ML models used for predicting future outcomes, making real-time operational decisions [62,63], and developing novel business models. In order to meet the requirement of sustainability, these agricultural business models also need to be sustainable. In general, the importance of sustainable business models is increasing due to emerging framework conditions such as environmental legislation, access to raw materials, or decarbonization [64]. Sarker et al. [65] examine the prerequisites for deploying big data in sustainable agricultural production, address technical and organizational challenges associated with implementing big data technologies, and develop a conceptual framework for big data-driven sustainable agriculture. Approaches such as Farmbeats, an IoT data platform for agriculture, enable data collection from digital devices and the effective use of sensors for smart and precision farming [66]. The implementation of data-driven models in smart farming brings concerns about data quality, privacy and ownership, data integration, and the interpretability and acceptability of AI and ML models in decision-making. There are gaps in the reach of data-driven technologies to small farmers, landowners, and remote areas worldwide, which is why Mehrabi et al. [67] recommend that governments, agricultural organizations, entrepreneurs, and researchers adopt policies, make investments, and conduct research focused on the availability, access, and use of technologies that can lead to inclusive and sustainable agriculture and food systems.

3.3. SDG 3: Good Health and Wellbeing

SDG 3 aims to ensure healthy lives and promote the well-being of all people at all ages, including reducing maternal mortality (target 3.1), lowering neonatal and under-5 mortality (target 3.2), combating epidemics (e.g., AIDS, tuberculosis, malaria) and communicable diseases (e.g., hepatitis) (target 3.3), and decreasing deaths from traffic accidents (target 3.6). Target 3.1 of SDG 3 is to reduce global maternal mortality, which is currently at 211 per 100,000 births, to fewer than 70 per 100,000 births. The main reason for maternal mortality is pregnancy complications, which are often the result of inadequate knowledge about maternal health care, a lack of screening, and the failure to provide timely hospital treatment for complications. Countries with high maternal mortality rates tend to have poor health infrastructure, a lack of technologies and skilled health workers, and an overburdened medical system [68,69]. To address these issues, big data-driven health systems can be used to fill gaps in resource mobilization and enable early prediction, monitoring, online diagnosis, and medical consultation. Providing affordable access to technology for health care through digital services to countries that do not have robust information technology (IT) and healthcare infrastructures is a challenge. Increased investment in general health coverage is essential for establishing centers for IT/technology-enabled health services that are available to the population in remote regions.
Cloud-based data mining and IoT services [70,71,72], data-driven ML models (e.g., biomarkers, neural network models, Bayesian networks and classifiers, rule-based tree models, random forest approaches, particle swarm optimization, boosting models) [73,74,75,76,77,78,79,80], and mobile healthcare (mHealth) applications are used to monitor maternal health data, provide adequate maternal healthcare, and predict pregnancy risks (e.g., hypertension, preeclampsia, gestational diabetes). mHealth services are applied to detect early risk of maternal mortality using social, demographic, gynecological, and obstetric predictor variables [81], to identify maternity risks based on a pregnancy database to support decision-making [82], and to improve maternal care through mobile diagnostics by accessing data that predict early symptoms of hypertension and recommending countermeasures [83]. It has been shown that mHealth can be successfully used to treat hypertensive disorders in pregnancy and improve clinical care [84]. Mobile apps such as PIERS on the Move can assist healthcare professionals in performing prenatal screening, measuring blood pressure and dipstick proteinuria, and assessing symptoms [85]. Wu et al. [86] present an early warning diagnostic tool that uses ML methods and biomarker studies to provide highly accurate results for early prediction of gestational diabetes. Although national/regional, well-maintained, and regularly updated longitudinal data in the form of electronic health records can be used for maternal and clinical purposes [87,88,89], missing data, insufficient sample size, class imbalance, misclassification of socioeconomic features, and ML algorithms can lead to severe prediction bias [90].
To reduce neonatal and under-5 mortality rates (target 3.2), its causes such as premature births, poor nutrition, poverty, and lack of medical facilities and health care must be addressed. Research shows that AI-based and data-driven decision support systems in neonatal intensive care units can provide affordable, accessible, and highly accurate systems to support neonatal care (e.g., diagnosis, prognosis, monitoring) [91,92,93,94,95,96]. However, early warning models for predicting infant mortality that incorporate biological, social, demographic, and ethnicity characteristics [97,98] are not without challenges, as the clinical application and interpretability of ML models require high-quality data and a deep understanding of clinical data.
Target 3.3 is to prevent deaths from epidemics (e.g., AIDS) and airborne and waterborne diseases. AI and data-driven models can be applied in various tools to prevent the spread of disease, enable online tracking, monitoring, and diagnosis, and provide access to affordable drugs/medical products. Digital systems can be effective in raising awareness of HIV prevention, increasing accessibility of testing services, improving uptake of preexposure prophylaxis, and developing technologies and big data algorithms for efficient monitoring of incidence, deaths, mental health, and patient care [99]. Medical imaging, computed tomography, magnetic resonance imaging, echocardiography, and mammography with DL models are state-of-the-art techniques for predicting communicable and non-communicable diseases with higher accuracy, such as tuberculosis from chest radiographs, various cancers from tissue images, neurological diseases, bone fractures, and hemorrhages [100,101,102]. The current use of AI in diagnosis, patient mortality risk assessment, disease outbreak prediction, surveillance, and policy-making may improve healthcare facility performance, resource allocation, and healthcare management in the future [103]. While AI and DL models have the potential to improve predictive accuracy, productivity, performance, and cost-effectiveness in medicine, they also raise concerns related to patient–physician relationships, data security, and privacy [104]. The large-scale adoption of AI technologies poses potential threats that should be considered in the development of AI so that the security, traceability, transparency, explainability, validity, and verifiability of AI applications are ensured in our everyday lives [105]. In low- and middle-income countries, there is an increased need for research on user-centered AI and ML models, with implementation and adherence to statistical, ethical, and regulatory global standards and guidelines being essential [103].
Traffic accidents are a public health issue and cause many deaths and injuries worldwide each year, so reducing them is part of SDG 3 (target 3.6). A large proportion of traffic accidents are due to human error, weak enforcement of traffic laws, poor management of traffic systems, bad infrastructure, and inadequate driver education. AI and data-driven models, such as automated systems, IoT-based ML models for traffic accident risk prediction and smart transportation, and models for collision avoidance, pedestrian movement prediction, and traffic monitoring systems, can be used for traffic control, early prediction of traffic congestion, and driver safety training, thus contributing to a reduction in traffic fatalities and injuries [106,107].

3.4. SDG 4: Quality Education

Free, equitable, and quality primary and secondary education for all is the first target (target 4.1) of SDG 4. The data show that in many countries, a large proportion of children—especially girls (cf. gender inequality)—do not receive formal primary and secondary education, and the dropout rate among these children is high. The level of education is directly correlated with economic and social outcomes, mainly poverty reduction, health improvement, agricultural productivity, and skilled human resources. Data-driven and AI-enabled systems can be game changers in providing high-quality primary and secondary education for all, especially in remote regions where a formal education infrastructure is inadequate.
In digital learning (D-learning)—including electronic learning (E-learning) and mobile learning (M-learning)—teaching, learning, and study activities are supported by digital and electronic means [108]. In D-learning, AI and data-driven frameworks provide access to educational resources, monitor the progress of students, and allow self-regulated, flexible, and effective learning. This requires the development of a robust digital framework for AI and data-driven learning that is accessible to all. DigCompOrg is such a conceptual meta-framework applied as an evaluation tool for governmental, educational, and other institutions to effectively adapt and integrate digital technologies into teaching [109]. Blayone et al. [110] discuss a theoretical framework for democratized, collaborative D-learning that facilitates socially and cognitively rich multidimensional learning. Yen et al. [111] discuss a digital framework for domain-specific and domain-general self-learning systems. D-learning offers the possibility of a student-centereD-learning environment, which is not possible in a classroom setting where teacher-centereD-learning is the predominant approach. Student-centereD-learning—i.e., students participate in the learning process in a self-determined and proactive manner and compile their own course of study [112,113,114]—can be useful in cases where expert educators are scarce. Yin et al. [115] analyze students’ learning behavior with ML models using their eBook learning log data. Such studies can help improve D-learning platforms and user-centric, customizable digital environments for academic applications.
Emerging areas in D-learning are AI-based education systems, AI tutors, AI chatbots, smart AI classrooms, personalized and adaptive learning environments, technologies to support learners with cognitive disabilities, online distance learning, mobile game-baseD-learning and gamification, augmented reality (AR)-, virtual reality (VR)-, and extended reality (XR)-baseD-learning, anD-learning by design [116,117,118,119,120,121,122,123,124,125,126,127]. Advances in these technologies offer potential for learning complex topics at the school/university level by enabling simulations of rare geographical, ecological, and other complex events. AR, VR, XR, and other interactive visualization tools enable a multimodal, collaborative work environment where learners can build a deep and detailed understanding of a subject, become motivated, develop positive attitudes towarD-learning, and improve critical thinking. AI-based technologies with robust infrastructure and common, unified data standards can be applied to educational tasks in school/university settings or in online virtual environments. They provide quality education for all by enabling systematic and collaborative learning and increasing productivity, performance, and creativity [128], by improving the level of services (e.g., distribution of learning materials, instructional activities by pedagogical agents) [119], by using chatbots as teaching assistants, by providing language support to teachers interacting with foreign students, by translating educational materials into each student’s native language, and by helping teachers assess student performance (e.g., automated grading, online exams) [129,130].
Worldwide accessibility of D-learning platforms would democratize education, increase equity, reduce learning costs, decrease time and emissions from travel/commuting, allow freedom and flexibility to students, and enable continuous learning and rapid access to information from diverse sources. The challenges in D-learning environments are to achieve a viable universal design for a functional, systematically implemented digital framework, to ensure acceptance of the learning environment, to provide broad accessibility around the world [131], and to prepare educators/teachers to use AI technologies safely and effectively to avoid bias [132]. The impact of D-learning on the psychological, emotional, social, and cognitive skills of students in different age groups has not yet been explored in detail. The AI-based education system should incorporate a learning science-driven approach that can fully realize the potential of AI in education. Luckin et al. [128] emphasize that learning is an interdisciplinary science, and therefore designing and developing AI-based technology and tools should involve interdisciplinary collaboration (e.g., psychology, sociology, computer science, pedagogy, and cognitive science) between AI developers, researchers, educators, and learners.

3.5. SDG 5: Gender Equality

SDG 5 calls for gender equality and empowerment of all women and girls. The UN criticize the fact that women worldwide do not participate equally in political and corporate decision-making and are threatened by physical and sexual violence and child marriages. Regarding the question of the extent to which data-driven methods have supported equality, it can be noted that data collection has already proven to be problematic: Information and data gaps are often a barrier to achieving the 17 SDGs, and SDG 5 is no exception, as progress on gender equality depends on closing the so-called “gender data gap” [133]. Criticisms within the SDG context include the lack of diversity in datasets [23], existing data gaps (e.g., 44 out of 54 gender equality indicators are globally not reliably monitored), and the lack of gender-disaggregated statistics [133,134]. As long as discussions around big data and new data technologies remain “gender-blind” [133], the potential of big data and AI to reduce gender inequality and gender bias [135] will not be fully realized. Efforts to address these issues include the creation of Equal Measures 2030 to put data and data-driven tools into practice, such as the SDG Gender Index, which was created as a new tool for data collection and advocacy [136].
Areas in which data-driven approaches have already contributed to partial achievement of SDG 5 targets are: (1) Big data analytics enable the real-time monitoring of gender discrimination worldwide [137] (target 5.1); (2) AI systems can help eliminate gender bias in recruitment decisions [4] (target 5.5); and (3) Internet access, blockchain, and mobile banking support women’s (economic) empowerment [4] (target 5.b). In a pilot program by microfinance firm Swadhar, Fidelity Information Services (FIS), and Citibank, women receive free phones along with a money management app called Saathi to track their income and expenses. On the one hand, the app helps women better understand their financial behavior and spend responsibly; on the other hand, it collects data that can be analyzed to provide services that subsequently offset smartphone and internet access expenses [138].
In addition to the positive impact that data-driven technologies can have on achieving SDG 5, there are also drawbacks. Natural language processing (NLP) and ML tools (e.g., smart algorithms, word embeddings, image recognition) may disseminate, reinforce, and amplify gender bias found in text data [139]: ML algorithms [23] and word embeddings [140] uncritically trained on news articles as well as current image captioning models [141] exhibit gender stereotypes and tend to amplify gender bias in training data. Gender debiasing methods to recognize and mitigate gender bias in NLP are relatively new and not yet sufficient to consistently debias models end-to-end for many applications [139], or to provide gender-neutral modeling [142].

3.6. SDG 6: Clean Water and Sanitation

SDG 6 envisions ensuring water security, i.e., the sustainable management and availability of water in sufficient quantities and of acceptable quality, and achieving sanitation and hygiene for all. Climate change, overpopulation, agricultural demands, and pollution have significant impacts on the quality and availability of water resources [143,144]. According to the UN, billions of people worldwide suffer from water scarcity and lack access to safe drinking water, even in places where water is abundant (e.g., the Brazilian Amazon region) [143]—creating a water security crisis that will exacerbate water stress in agriculture and energy production. Dealing with this crisis requires integrated strategies that focus on water management, improving water availability, security, and quality [145].
Monitoring progress toward SDG 6 is challenging, as methods for measuring the quality and use of water and sanitation services are expensive and complex [146]—for example, because of the necessity to collect and evaluate large amounts of spatial data. In order to globally assess water security, Giupponi and Gain [147] present a geographical information system software tool that is used to process huge amounts of spatial information, and by which a spatial multi-criteria analysis framework is derived [145]. To improve the performance of water reservoirs under climate change (e.g., water scarcity), Elhassnaoui et al. [148] propose a program for the real-time control of dams that can help determine optimal schedules and project strategies in terms of drought, mitigation, water security, energy conservation, and agricultural development. Rainfall and evaporation data are provided by temporal downscaling and used by a real-time algorithm (based on water balance equations and rule curves) in conjunction with a hydrologic modeling system [148]. The program was applied to the Hassan-Addakhil reservoir in Morocco, and the study shows that its efficiency could be improved [148]. This successful application links to the call by Moumen et al. [144] for Morocco to develop advanced tools for water management, such as the establishment of a national database whose data on soil, land use, land cover, hydrology, etc. could be incorporated into mathematical tools for modeling and assisting decision-makers in determining appropriate management strategies.
To achieve data-driven policymaking, data management is employed to decide how and what to localize: The localization of SDG 6 is explored by disaggregating Key Performance Indicators (KPI) and interlinkages between SDGs, by which also new KPIs are developed [149]. Requejo-Castro et al. [150] propose a data-driven Bayesian network approach to identify and interpret SDG 6 interlinkages across the 2030 Agenda, as monitoring SDGs requires combining conventional indicator-based frameworks with approaches that capture the links and interdependencies between the SDGs and their targets. Such data-driven indicators are used to disaggregate water stress at higher spatial and temporal resolution [151] and to better assess hydro-political risks [152]—during the risk analysis in managing water systems, real-time data provided by IoT systems are applied [4].
In addition to data collection and analysis, AI technologies are applied in monitoring and forecasting: (1) Satellite data are used for remote water supply monitoring [153]; (2) In situ and remote sensing technologies linked to IoT are applied to improve the monitoring of water and sanitation interventions to achieve targets more cost-effectively and efficiently [146]; and (3) ML is utilized for water quality monitoring and forecasting [154,155]. In hydrological forecasting, artificial neural networks are employed in various forms—for example, in network structures including feed forward neural networks, adaptive neuro fuzzy inference systems, extreme learning machines, and recurrent neural networks [156].
AI technologies are currently applied in clean water test systems to detect water contamination and in smart water management (SWM) systems to help address the water crisis [157] and to provide water to the population [23]. Arsenic, fluoride, and nitrate contamination of groundwater and drinking water is a global problem that negatively impacts the lives of more than 300 million people [158,159]. For example, exposure to arsenic can cause arsenic poisoning in the short term [158] and lead to long-term health problems such as higher rates of bladder cancer [160]. AI (e.g., ML, DL, logistic regression, and random forests) is utilized to develop prediction models for groundwater contamination and can be used as a decision-support system as well as for devising proactive environmental management strategies, with hybrid ML-DL models being useful given the multidimensional nature of environmental data [159]. Complex water systems benefit by AI by being better modeled and simplified, and by becoming more reliable and robust (through blockchain) [4]. Urbanization could have a negative impact on water infrastructure and water resource management in the coming decades due to the associated greater water consumption and pollution and degradation of water quality [143]. In the future, urban water resilience might be improved by further developing existing big data-driven SWM systems into cyber-physical systems, which collect and analyze water data in real time and control water infrastructures based on technologies such as web-ready sensors, IoT-driven solutions, big data mining, or cloud computing [161].

3.7. SDG 7: Affordable and Clean Energy

The goal of SDG 7 is to make affordable, reliable, and modern energy accessible to all, whereby advanced technologies can help to significantly reduce energy consumption. Big data-driven approaches—such as geographical information system software tools [147]—are used for modeling and forecasting climatic and geo-ecological situations and allow conclusions regarding global access to energy over time. According to the UN, 759 million people lack access to electricity (so-called “energy poverty”), about three-quarters of whom live in sub-Saharan Africa. Hassani et al. [162] employ big data technologies to identify and predict energy poverty using satellite imagery, and their findings identify sub-Saharan Africa as the region most affected. Big data can contribute to the fight against energy poverty by combining different data sets (e.g., satellite photography, money transfers, mobile telecommunications) to provide information about current and future energy demand. Mastrucci et al. [163] conclude that the energy poverty gap is broader than indicated by the SDG 7 definition, when the need for indoor cooling is considered. To estimate the energy required to meet these cooling needs, they apply the variable degree days method on a global grid. Closing this cooling gap with minimal environmental damage would require solutions such as innovative cooling technologies.
SDG 7 is not only aimed at universal access to energy, but to meet the sustainability target, energy should come primarily from renewable sources (target 7.2), and energy efficiency should be improved (target 7.3). Ryan et al. [164] explore how smart information systems (SIS)—technologies that build on big data analytics, typically facilitated by AI techniques (e.g., ML)—used in the energy sector can help solve the “energy trilemma” (i.e., energy security, energy equity, and environmental sustainability). The use of SIS in smart grid systems enables renewable energy integration, can provide energy security, and ensures affordable and sustainable energy for an ever-increasing demand (energy distribution). By guaranteeing energy efficiency and timely energy supply at optimal cost, smart grids will likely facilitate the achievement of SDG 7 in the future [4]—a goal that will require a massive deployment of mini-grids in rural areas of developing countries. Lorenzoni et al. [165] present a shared database for load profiles of 61 rural mini-grids and identify five archetypal load profile clusters using a clustering procedure. This approach allowed the lack of available data and the difficulties in identifying demand to be overcome. For the design of energy systems, ANN is utilized as a forecast model for available renewable resources [156], and in the provision of energy services to the population, the integration of variable renewables can be supported by smart grids that match electricity demand to times when the sun is shining or the wind is blowing [23]. AI technologies are already contributing to SDG 7 by predicting renewable energy source performance and management needs and by enabling sustainable energy consumption through smart meters [4]. However, AI-based technologies can also compromise outcomes by requiring computational resources that are only available in large computing centers, which have very high energy requirements and carbon footprints [23].
SDG 7 is closely connected to SDG 11 (sustainable cities and communities), as smart sustainable cities depend on the provision of clean and sustainable energy: Targets of SDG 7 should accordingly promote investment in clean energy technologies (target 7.a) and should expand infrastructure for the provision of sustainable energy services to all (especially in developing countries) (target 7.b). Research is exploring the potential of data-driven smart solutions (e.g., IoT and big data technologies) to improve energy efficiency and environmental sustainability of smart sustainable cities (cf. data-driven urbanism): Chui et al. [166] present pilot systems and prototypes that demonstrate how AI, cognitive computing, IoT, and big data analytics can support the process of energy sustainability in smart cities. A case study conducted by Bibri and Krogstie [167] shows that SDG 7 is supported by establishing a big data ecosystem as part of information and communication technology architectures, even before data-driven applications are adopted. Based on routinely collected data and the use of a new urban intelligence function, models of smart sustainable cities are created to monitor, understand, analyze, and plan such cities to improve their energy efficiency and environmental sustainability [167].

3.8. SDG 8: Decent Work and Economic Growth

SDG 8 calls for the promotion of “sustainable economic growth, full and productive employment and decent work for all”. Sustainable economic growth can only be achieved by decoupling economic growth from environmental degradation, i.e., by improving global resource efficiency in consumption and production (target 8.4). The achievement of SDG 8 is significantly impaired by the ongoing COVID-19 crisis. The UN report that the pandemic has led to the loss of 255 million jobs and will likely lead to an increase in youth unemployment in the future. Global real GDP collapsed in 2020, and in many countries economic growth is not expected to return to pre-pandemic levels until 2022 or 2023. Big data can contribute to achieving the goal of economic growth (target 8.1) through data analytics and the monitoring of indicators [168]—for example, through network analyses of logistical networks that contain information about economic growth [169]. AI can promote job creation, entrepreneurship, and innovation (target 8.3)—for instance, in the bio-based economy, which is likely to be one of the main beneficiaries of the AI-driven acceleration of data mining and forecasting and the resulting creation of new companies and jobs in the microbial biotechnology sector [170].
Advances in financial technology facilitate opportunities for “digitized financial inclusion” [171]: (1) ML is applied in financial market forecasting (e.g., to predict stock trends) [172] and (2) AI, combined with the now widespread use of smart phones in developing countries, gives access to digital financial services to people who were previously unbanked [171], thereby promoting and expanding access to banking and financial services for all (target 8.10). In this context, microfinance needs to be mentioned, which provides microcredit to economically disadvantaged customers who do not have access to conventional banking services. Microfinance plays an important role in developing countries, and in the future, the use of AI technologies could contribute to broader access to finance for economically disadvantaged population segments. Technologies in microfinancing have evolved from management information systems, online lending, and the use of mobile banking to AI use in dynamic information systems in recent years: ML and DL technologies speed up and simplify the lending process by making faster decisions about potential customers and automatically calculating the likelihood of default, even for customers with no formal credit history and no bank account. To do this, the customer installs an app on their smart phone, and the lender can use the information on the customer’s phone and browser to assess risk and, if approved, disburse funds within minutes [138].
AI technologies have multiple fields of application in the workplace, with a focus on STEM (science, technology, engineering, and math) job creation [4] and improving employees’ working conditions: Smart information systems (SIS) can help workers by reducing demanding work, supporting the completion of complex tasks, and increasing productivity in the workplace [164]. AI technologies can simplify workers’ lives, e.g., through intelligent transportation systems that lead to more efficient commuting and flexible working [4], but there are also downsides to the adoption of AI in the workplace: While SDG 8 aims at strengthening the relationship between an organization and its employees, Braganza et al. [173] find that the adoption of AI has the opposite effect and is detrimental to decent work. SIS and AI raise ethical concerns and carry risks that could hinder achieving SDG 8, such as algorithmic bias, job loss, power asymmetries, and inequality [164]. Automated decision-making algorithms have been shown to be biased, to lack ethical oversight, and to have limited transparency, which would reinforce unequal access to funding [171].

3.9. SDG 9: Industry, Innovation, and Infrastructure

According to the UN, investing in basic, sustainable infrastructure is essential for improving the living standards of communities worldwide [174]. This refers to the fundamentals—that is, the issues that comprise common human needs around the world. However, just because we are talking about basics does not mean that addressing these concerns properly is simple. In the case of infrastructure, this requires coordinated, long-term planning that spans geographic, political, and cultural boundaries. Although innovation comes last in the description of SDG 9—“Build resilient infrastructure, promote inclusive and sustainable industrialization and foster innovation”—it can be argued that innovation will underpin the entire SDG 9 agenda in the future, because without innovation we are left with current infrastructure technologies and industrialization models that remain on an unsustainable path [175]. Denoncourt [176] illustrates the important connection between SDG 9 targets, social responsibility, intellectual property rights, and corporate longevity.
In Kynčlová et al. [177], a data-driven metric is introduced to measure the progress of a country towards achieving industry-related targets of SDG 9. The SDG 9 index represents a comprehensive but straightforward approach for assessing the extent to which countries have industrialized while promoting social inclusiveness and minimizing natural resource use and environmental impacts. The selection of indicators is based on the global indicator framework for the goals and targets of the 2030 Agenda adopted by the UN General Assembly. The resulting SDG 9 index benchmarks inclusive and sustainable industrial development in 128 economies over the period 2000–2016. Industrialized economies outperform other countries, with the top five leading the 2016 ranking being Ireland, Germany, the Republic of Korea, Switzerland, and Japan. The calculated scores of the SDG 9 index show in which dimensions countries are leading or lagging behind other economies. Thus, the SDG 9 index forms a valuable tool for policy makers and analysts.
Raut et al. [178] studied the predictors of sustainable business performance through big data analytics in the context of developing countries. Data were collected from manufacturing firms that adopted sustainable practices. A hybrid Structural Equation Modelling—Artificial Neural Network model was used to analyze 316 responses of Indian professional experts. The study’s findings show that management and leadership style, as well as state and central government policies are the most important predictors of big data analytics and sustainability practices. The study provides theoretical and practical insights into how manufacturing firms can improve their sustainable business performance from an operations management perspective and details big data implementation issues when accomplishing sustainability practices in businesses in emerging economies.
Ilie et al. [179] suggest monitoring SDG 9 with global open data and open software. They present training materials for using open-source software, along with freely available high-resolution global geospatial datasets. These training materials provide step-by-step guidance on calculating the status of SDG indicators to support monitoring of SDG progress. To demonstrate the usefulness of their approach, they conducted a case study in rural Tanzania. Malhotra et al. [180] propose that data from GPS devices can be used to control traffic and improve public transport to achieve indicators, such as indicator 9.1.1. “Proportion of the rural population who live within 2 km of an all-season road”.

3.10. SDG 10: Reduced Inequalities

SDG 10 aims to “reduce inequality within and among countries” and refers to all types of discrimination and lack of access in the broadest sense. Inequality within and between countries is a persistent problem, and while much progress has been made globally, it remains one of the most problematic challenges even for developed economies. In the EU—which has adopted numerous policies and directives prohibiting inequality and discrimination based on race or ethnic origin, gender, religious belief, age, disability, or sexual orientation—the legal framework has numerous gaps that prevent it from adequately addressing discrimination [181]. In Europe, there is increasing inequality in terms of economic performance (measured by GDP) and social cohesion (measured by income, employment rates, and opportunities) not only between metropolitan areas but also within these between affluent central and economically disadvantaged peripheral districts [182]. Lelo et al. [182] emphasize the need for data-driven policies that enable national and local authorities to identify needs and address diverse and emerging forms of marginality and social exclusion.
The inclusion of SDG 10 is not based on broad agreement among member states but was only included as a stand-alone goal against considerable opposition [183,184]. This contestation is reflected in a relatively weak SDG 10 that is characterized by imprecise language and that is missing a road map to achieve the goal [185,186]. For example, there is not a single indicator that explicitly refers to inequality. Not surprisingly, official progress reported by the UN on SDG 10 is a challenging issue due to the complexity and impreciseness of its targets. In the 2018 Sustainable Development Report, the progress on SDG 10 is described only in an overview chapter concentrating on SDGs 10.1, 10.a, 10.b, and 10.c [187]. SDG 10 might be the data-weakest SDG, as globally available and comparable data are rare. There are a few data-driven approaches, such as a speech-to-text analysis of local radio content to uncover discrimination issues [180] and an SDG 10 index score applied to India [188].
Truby [171] argues that data-driven and AI-driven technologies have a great impact on inequality. Multiple AI-driven apps and digital services have been established to benefit the developing world, such as through AI-powered medical diagnosis. Critics, however, liken the growth of tech start-ups to “tech colonialism” [189], as AI is developed in and creates revenue for developed countries but disrupts markets in emerging and developing countries at the expense of existing service providers and workers. Examples include firms that were founded in Africa with the intention of benefiting Africa but ended up being owned and managed by Europeans and Americans, who provided most of the capital and receive most of the profits. Despite the best intentions of AI developers with respect to the software’s goals, AI may not directly benefit developing countries for several reasons: The software may be so successful in disrupting the market and providing an attractive service for consumers that existing service providers are unable to compete. For example, Uber does create opportunities for individual freelance employment in developing countries, but at the expense of local taxi companies. This drives up profits for company owners, who are often based in Silicon Valley or London because of the opportunity to obtain seed start-up funding there. Developed countries thus have a continuing advantage in the advancement of AI technologies, which in turn generate further revenue that can be used to develop even better AI. Moreover, AI may replace existing jobs without providing opportunities for upskilling people in the economically most disadvantaged communities. When designed with sustainable development in mind, AI can instead provide people with employment and more skilled and interesting opportunities, making them more productive by eliminating unnecessary labor-intensive jobs.

3.11. SDG 11: Sustainable Cities and Communities

Projections indicate that two-thirds of the world’s population will live in urban areas by 2050, creating an urgent need to apply sound urban planning approaches to create communities that can thrive sustainably [190]. According to Vaidya and Chatterji [191], the world at large is gradually taking an urban turn, as more and more people are moving to cities. Cities account for 55% of the population and produce 85% of the global GDP but also produce 75% of the greenhouse gas emissions. The issues of global sustainability cannot be addressed without focusing on sustainability at the urban level. Rozhenkova et al. [192] argue that there is a critical need for large-scale comparative urban policy data that could be used in conjunction with outcome data to identify where policies are working and where improvements are needed. Based on a comprehensive scoping review, they evaluated existing urban policy databases and concluded that they are inadequate for the purposes of comparative analysis. They developed an “ideal” urban policy database, which they argue is a key tool for achieving SDG 11. Thomas et al. [193] examined 484 data-driven indicators of urban and regional environmental sustainability drawn from 40 indexes and online data repositories to determine their suitability for measuring both urban environmental performance and equity. Despite the large number of existing indicators related to urban environmental monitoring, they found that all indicators were inadequate for evaluating progress regarding SDG 11’s targets of inclusive, accessible, and sustainable urban areas (targets 11.3 and 11.7) due to a lack of benchmarks and explicit equity measures. Thomas et al. [193] recommend that future research should focus on collecting data that can be geographically disaggregated to measure distributional equity and establish locally appropriate benchmarks and realistic indicators for urban sustainability targets. Malhotra et al. [180] suggest satellite remote sensing to track encroachment on public land or spaces, such as parks and forests.
The European Commission–Joint Research Centre has developed a suite of (open and free) data and tools named Global Human Settlement Layer (GHSL) that maps the human presence on Earth (built-up areas, population distribution, and settlement typologies) between 1975 and 2015. The GHSL provides information on the progressive expansion of built-up areas on Earth and population dynamics in human settlements, with both sources of information serving as baseline data to quantify land use efficiency, listed as an indicator for SDG 11 (indicator 11.3.1) [194]. Schiavina et al. [194] show that (1) the GHSL framework allows the estimation of land use efficiency (LUE) for the entire planet at several territorial scales, opening the opportunity of lifting the LUE indicator from its Tier II classification; (2) the current formulation of the LUE is substantially subject to path dependency; and (3) it requires additional spatially explicit metrics for its interpretation. They propose the “Achieved Population Density in Expansion Areas” and the “Marginal Land Consumption per New Inhabitant” metrics for this purpose. Their study is planetary and multi-temporal in coverage, demonstrating the value of well-designed, open, and free, fine-scale geospatial information on human settlements in supporting policy and monitoring progress made towards meeting the SDGs.
Knowledge of the global spatial distribution and evolution of human settlements has become one of the most important requirements for monitoring progress in sustainable development of urban and rural areas. Corbane et al. [195] present recent developments in processing big Earth observation data to improve GHSL data, and they outline the results from two experiments with Sentinel-1 and Landsat datasets based on the Joint Research Centre Earth Observation Data and Processing Platform. A comparative analysis of the results of extracting built-up areas from remote sensing data and through processing workflows shows how information production—supported by a data-intensive computing infrastructure for optimization and multiple tests—can improve mapping capabilities, the handling and processing of such datasets, and the reliability and consistency of output information within the GHSL domain. The approach supports powerful comparative monitoring of land use efficiency and access to basic services under SDG 11.
Gue et al. [156] state that the largest number of journal articles addressing AI is available for SDG 11. The articles cover a wide range of applications, such as urban transport air pollution, prediction of house rental prices, prediction of energy consumption, green building design, simulation of soundscape, prediction of walkability, categorization of slum areas, prediction of air emissions, estimation of flood susceptibility and damages, and characterization of generated waste.

3.12. SDG 12: Responsible Consumption and Production

Responsible consumption and production are critical to a sustainable world [196]. Human and environmental systems interact through the economic system in various ways that have caused many unsustainable issues. Solving these problems is a non-trivial exercise and could be considered one of the world’s “wicked” problems. SDG 12 aims to ensure sustainable consumption and production patterns and has a long history in various international conferences and actions. Dubey et al. [197] show that organizations engaged in sustainable development programs are increasingly paying attention to synergistic relationships between focal firms and their partners to achieve SDG 12. They conclude that (1) big data and predictive analytics have a significant positive impact on sustainable consumption and production among partners, and (2) organizational compatibility and resource complementarity have positive moderating effects on linking data and predictive analytics to sustainable consumption and production. Gunawan et al. [198] identify a high correlation between CSR and SDG 12.
Gasper et al. [199] state that SDG 12 indicators have major deficiencies—in particular, inadequate coverage of corresponding targets and a checklist orientation that privileges counting of reports over examining their content and quality. In their study, Carlsen [200] focused on five main indicators selected by Eurostat as key factors for the development of SDG 12, i.e., (1) resource productivity, (2) average CO2 emissions from new passenger cars, (3) circular material use rate, (4) generation of waste excluding major mineral wastes, and (5) consumption of toxic chemicals.
Hermann [201] addresses the relevant relation between marketing, data (especially AI), and SDG 12. Marketing claims to help consumers by satisfying wants and needs, but the endless pursuit of satisfying them can further fuel consumption, which in turn depletes resources, pollutes the environment, and drives climate change. In light of the environmental imperative and the stance of sustainable development, AI in marketing is a double-edged sword: On the one hand, AI applications and systems pursue sales’ objectives and increase consumption and its (negative) externalities. For instance, Amazon’s—whose e-commerce platform relies on AI-driven recommender systems and collaborative filtering—ratio of carbon footprint in CO2 equivalents and of gross merchandise sales (carbon intensity) was 122.8 g/USD in 2019 [202]. Given Amazon’s multi-billion sales volume, the carbon footprint of the world’s largest e-commerce company alone equals dozens of tons of CO2 emissions annually. Moreover, energy consumption and emissions related to AI development, production, and deployment induce adverse rebound effects. On the other hand, AI in marketing can be a powerful force in promoting supply- and demand-side sustainability efforts. AI’s potential to foster sustainability in marketing should be leveraged across the four Ps of the marketing mix—that is, product, price, place (distribution), and promotion (communication). AI in marketing should support consumers in making better-informed and more sustainable decisions. Hermann [201] proposes AI-powered devices and applications to continuously update and provide a current ecological footprint (e.g., CO2 emissions, water consumption) based on our purchase history and decisions. In addition, the individual ecological footprint could be compared with an individually defined social comparison group to induce a certain degree of social pressure.
Beier et al. [203] identify potential big data use cases for corporate environmental management by using the example of the German automotive industry. The use cases found are: (1) Improved creation of life cycle assessments; (2) measuring energy consumption and increasing energy efficiency; (3) measurement of emissions and their reduction; (4) measurement of water consumption and its reduction; and (5) optimization of waste management. For SDG 12, a large number of journal articles addressing AI are available [156] that cover a wide range of applications such as additive manufacturing, specific production processes, cleaner production, predicting product life, renewable resource management, manufacturing practices, material flow, energy flow, energy consumption, and green technologies. Wang et al. [204] adopted fuzzy interpretive structural modeling to develop a precise evaluation framework and provide a theoretical basis for enhancing the understanding of responsible consumption and production. Malhotra et al. [180] suggest online search patterns or e-commerce transactions to reveal the pace of transition to energy efficient products.

3.13. SDG 13: Climate Action

SDG 13 presents five targets, with this work focusing on the targets 13.1, 13.2, and 13.3, as they seem to have the highest potential to be achieved through digitalization. Target 13.1 aims to strengthen the resilience and adaptive capacity to climate-related hazards and natural disasters in all countries. The number of deaths or missing persons per 100,000 people is one of this target’s indicators (indicator 13.1.1). Prediction and in-time warning of upcoming climate hazards is needed to reduce the number of fatalities or missing persons. Poolman et al. [205] used data-driven deterministic unified models to increase the warning lead-time for flash floods from 1–6 h to 18 h. Digitalization helps data from different influencers to be obtained and merged into a model. Weyn et al. [206] followed a more generic approach and used a convolutional neural network to forecast several atmospheric variables. The authors stated that their model was not as accurate as operational numerical weather prediction models but that it outperformed dynamic numerical weather prediction models for short- and medium-range forecasts. Computing power and ongoing research on data-driven DL approaches are likely to support the achievement of SDG 13.
Target 13.2 is to integrate climate change measures into national policies, strategies, and planning. In the face of extreme weather events, the public sector needs to prepare, yet few actions are taken, and a significant number of public authorities do not have integrated disaster management plans, despite the availability of data and predictions about potential threats [207]. Using five case studies, Saulnier et al. [208] highlighted the complexity of measuring disaster mortality and the apparent need for disaster mortality data, demonstrating that by combining multiple data sources to accurately estimate mortality, a standardized definition of mortality can be provided. This will assist policy makers in implementing appropriate measures to prevent disaster mortality and strengthen disaster risk reduction for a country’s citizens.
Target 13.3 aims to improve education, raise awareness, and build human and institutional capacity for climate change mitigation, adaption, impact reduction, and early warning. Climate change mitigation is a challenge that must be faced not only by policy makers or specific industrial sectors but also by all of mankind. Climate change mitigation cannot be accomplished at the household level; thus, broader integration is needed, with all actions requiring support of innovation, infrastructure, development, and industrialization [209].

3.14. SDG 14: Life below Water

Digitization can support the achievement of SDG 14 on the protection and sustainable use of oceans, seas, and marine resources for sustainable development. The implementation of water pollution indicators in coastal areas is a step toward helping coastal managers prevent pollution [210]. A clear understanding of cause and effect is essential, and network-based approaches can support this understanding. However, Del Río Castro et al. [211] point out that there are still research gaps in the application of digital paradigms (e.g., big data or AI) to achieve SDG 14. They identify governance hurdles and technological white spots in the application of digital paradigms that require a multidisciplinary effort. The reduction in coastal pollution index values could be achieved through several measures, but the connections in such a network are missing. Approaches from other sectors, such as industry or computer science, where the cause-and-effect connection is more elaborated, should be applied to measures to achieve SDG 14.
Emerging digitalization and IT are being used to leverage environmental supply chain sustainability. Sarkis et al. [212] show how digitalization is affecting supply chain greening and present two frameworks with exemplary practices that can advance research. Target 14.4 calls for an end to overfishing the oceans. As the fishing industry is the starting point of a supply chain, greening measures of supply chains could be applied, similar to those in the automotive industry. IoT technologies provide promising opportunities for organizations by connecting and enabling collaborations between physical objects, devices, systems, platforms, and applications [213]. Vollen and Haddara [213] investigated the benefits and challenges of an internet-based refrigerated seawater system that kept the catch at a specific temperature until delivery. Such internet-based systems offer the potential to monitor catch quotas in addition to monitoring temperature control. A transmission of the data to a monitoring system makes it possible to get a real-time overview of the quotas in specific coastal areas.
Ocean acidification poses a threat to marine fauna and flora, which is why minimizing acidification is one of the targets of SDG 14 (target 14.3). Kroeker et al. [214] conducted a meta-analysis on the reaction of organisms to acidification. By synthesizing 228 studies, they found that organisms in a laboratory environment reacted differently to acidification than in a multi-organism environment, such as that prevalent in the ocean. However, when trying to reach a comprehensive understanding, the researchers found that the variability in organisms’ responses grows exponentially. Digitalization and data analytics could support this research field with forecasting approaches such as those applied in production [215] or finance [216] and in recently published approaches for well forecasting and groundwater quality [217]. Given the huge amounts of data on the organisms’ possible responses in an ocean environment, data analytics approaches from other research fields could help visualize the effects of acidification on organisms.

3.15. SDG 15: Life on Land

SDG 15 calls for protecting, restoring, and promoting the sustainable use of terrestrial ecosystems, managing forests sustainably, combating desertification, halting and reversing land degradation, and halting biodiversity loss. The protection and the sustainable use of terrestrial ecosystems (targets 15.1 and 15.2) can benefit from approaches (e.g., quality management measures) that are already being implemented in various sectors of the economy, such as in the production industry. Quality management is omnipresent in this industry, and a connection can be made between quality management and sustainable use of land. Carnerud et al. [218] show changes over the past 40 years in how IT has influenced the recent trend toward sustainability and thereby changed contact quality management.
In the production industry, resources such as raw materials or spare parts are constantly monitored to avoid shortcomings, and a shortcoming could be seen in the overuse of terrestrial resources. SDG 15 formulates the need for the sustainable use of terrestrial ecosystems. An exploitation of a renewable resource can be connected to quality management in the same way that it is necessary to avoid shortcomings in industry. It might be concluded that overuse of a resource is an indicator of low quality, so that the resource cannot renew itself independently. Information technologies can assist in monitoring natural resource utilization: Applying IT measures to monitor resource use can support the achievement of SDG 15 and can prevent over-utilization, leading to sustainable use of terrestrial resources.
One of SDG 15’s targets is to progress towards sustainable forest management (target 15.b). On the one hand, an exit from fossil fuels is necessary to reduce the carbon footprint [219]. On the other hand, people need alternatives for heating. One alternative to fossil heating systems such as oil, gas, or coal could be cellulosic fuel-like wood-based products, but this results in a higher forest usage. Antonescu and Stanescu [219] present technical insights for retrofitting heating chambers to switch from fossil fuels to cellulosic ones such as wood pallets. However, a switch from fossil fuels to wood pallets, in addition to increasing wood consumption, would also increase transportation by delivering the pallets to households. Digitalization measures can open up solutions to this problem. Early research papers [220,221] present optimization approaches that can be adapted to achieve SDG 15. Based on the travelling salesman problem, Petersen and Madsen [221] present a heuristic optimization for complex routing networks. Perpiñá et al. [220] discuss in their paper an approach for mapping potential locations for biomass plants and optimizing transportation. This approach could be applied to wood pallet heating systems, so that a map of all users of these heaters and a visualization of user demand could help reduce transportation. Gejdoš et al. [222] address this problem in more detail and present a mathematical optimization approach based on three criteria: time, cost, and fuel consumption per volume of forest biomass. We argue that there are several ways to overcome hurdles, such as increased transportation costs when switching from fossil to cellulosic fuels. Digitalization, i.e., increasing the computational power of heuristic optimization approaches of complex networks, has the potential to solve this problem. Science is applying various optimization approaches—for example, in the production industry—and these approaches could also be used to achieve SDG 15.

3.16. SDG 16: Peace, Justice, and Strong Institutions

SDG 16 aims at promoting peaceful and inclusive societies for sustainable development, access to justice for all, and building effective, accountable, and inclusive institutions at all levels. Van der Velden [223] makes a connection between the smartphone and the relation to the SDGs, and points out the correlation between upcoming digitalization, represented by the smartphone, and inequality in society. An increase in smartphone usage is linked to an increased usage of raw materials and components. Both raw materials and components can have a negative impact on poverty or child labor, as the production sites are located in countries where this is tolerated by society and the judiciary. Nevertheless, digitalization and especially the use of smartphones can also have positive effect on the achievement of the SDGs, e.g., SDG 1 [14], SDG 5 [138], and SDG 8 [171].
SDG 16 states, among other targets, the targets of overall reduction in death rates (target 16.1), reduction in violence against children (target 16.2), equal access to justice for all (target 16.3), reduction in crime (target 16.4), and reduction in corruption and bribery (target 16.5). Big data and related technologies are being used, albeit still to a limited extent, in the justice systems to fight crime [224,225]. Further, predictive algorithms could help improve accuracy, efficiency, and fairness [226]. Laberge and Touihri [227] show that there are opportunities to increase CSR by integrating people. Indicators of SDG 16 were derived for Tunisia, and people are part of all measures, as stated in the goal description. However, the authors mention that there are major challenges in measuring the success of all inclusion measures and the possible overload and skepticism of people. The outcome of this action in Tunisia can only be evaluated after some time, but it is a first step to connect and fully include people. Digitalization has the potential to provide connectivity to foster education and inclusion in society.

3.17. SDG 17: Partnerships for the Goals

SDG 17 occupies a special position, as the formation of partnerships and collaborations to fully implement the other SDGs is to be achieved through this SDG. Strong, global partnerships at all levels are often cited as a key mechanism for achieving the other goals, so strengthening the means for their implementation, as well as shared values and inclusion, is crucial [228,229]. Despite being of central importance, indicators for SDG 17 targets have been criticized as being vague, unspecified, and difficult to measure, which is why the increasing number of partnerships reported in the SDG partnership registry might do little to change practices and behaviors [228]. Therefore, initiatives to promote interdisciplinary and cross-border data-driven collaboration and networking, as well as knowledge sharing via freely available datasets, need to be supported.
Advanced cloud computing and the use of big data processing platforms could help establish global partnerships that work on the same SDGs and realize the potential of big data in the context of sustainable development [230]. Concerns about fair data sharing, data ownership, and data privacy hinder partnership collaboration and full use of existing data but could be addressed—alongside mutually consenting policies and agreements—through multi-party computation (MPC) protocols and blockchain technology [168,231]. MPC protocols are an important technical tool for implementing the mechanisms that guarantee the increased utility or accuracy of data [231]. The use of blockchain technology can facilitate the secure exchange and processing of big data—as it was invented to support and record transactions of value without the approval of a central authority (cf. Sharing Economy)—and thus support the building of global partnerships [168,232].

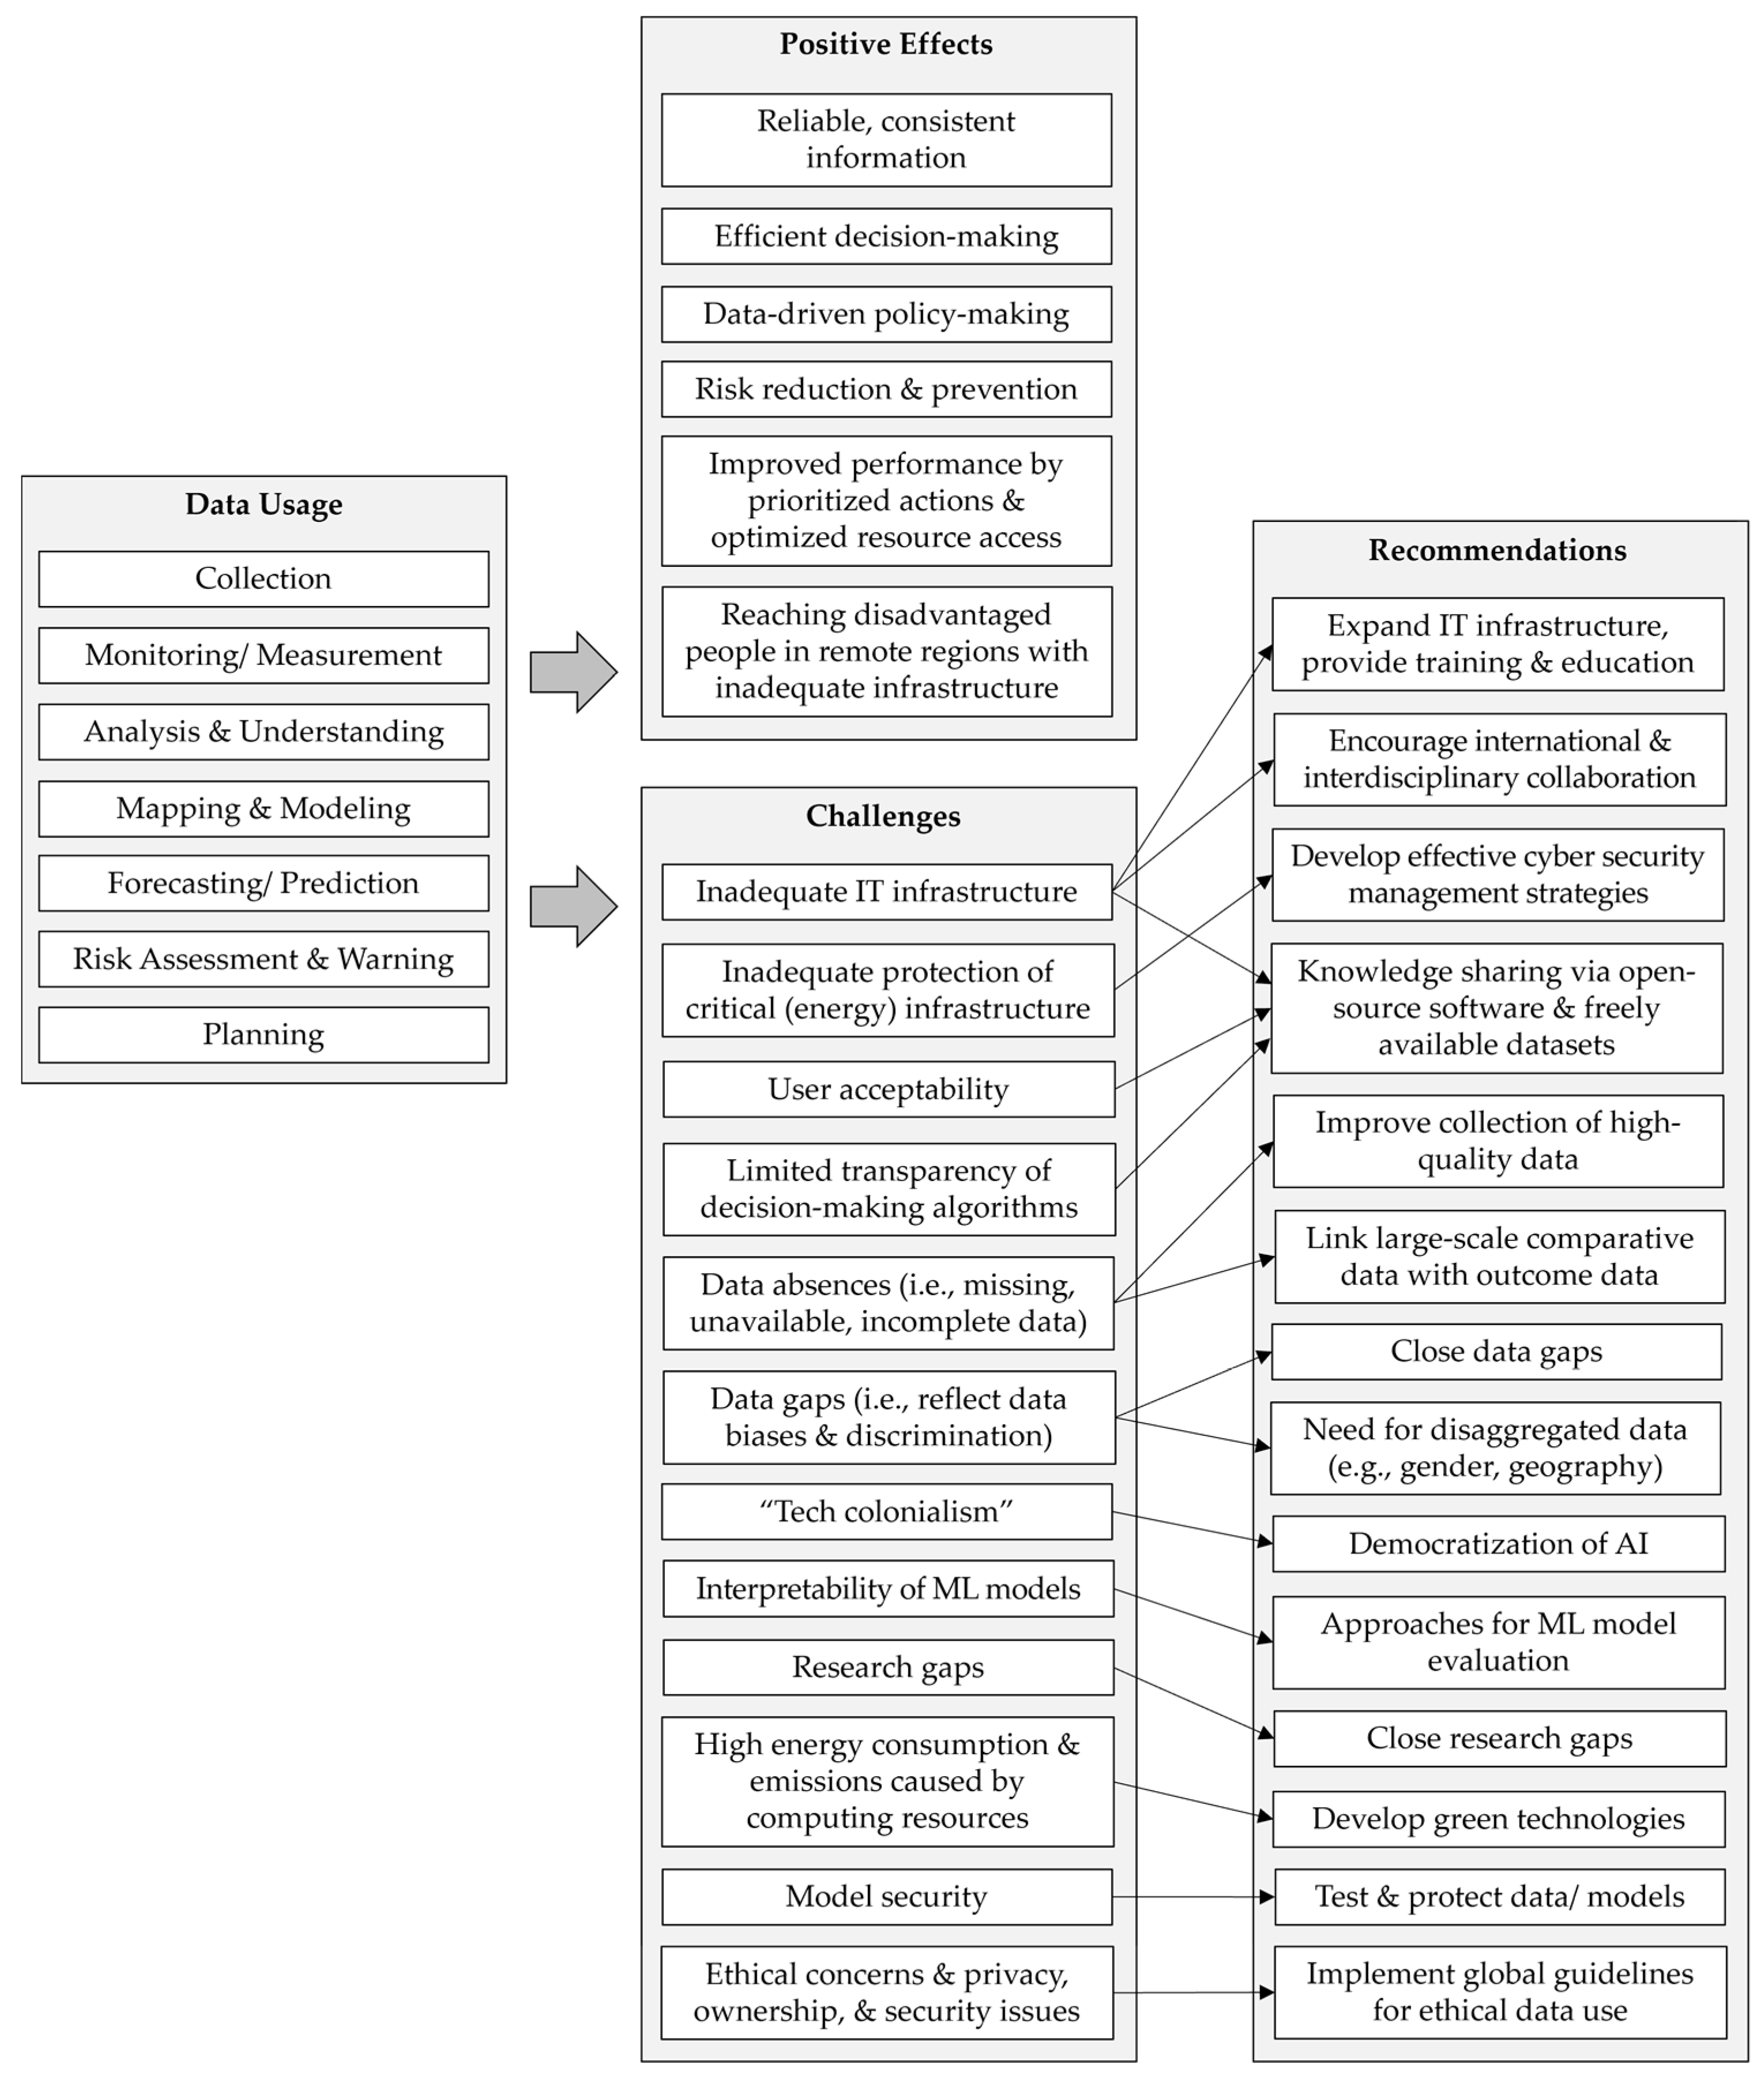
4. Contribution and Recommendations

This paper contributes to the existing literature by examining the extent to which data-driven technologies have contributed to the achievement of the 17 SDGs to date. The purpose was not to present all existing studies, but to summarize the most current findings and derive insights for future research. The conducted literature analysis shows that data-driven approaches contribute to achieving these goals and could become even more important in the future, provided that currently unused potential can be exploited. The results of our content analysis are summarized and visualized below (see Figure 1).
At present, data usage consists of collecting data [136,138] primarily for monitoring [167,193] and measurement [177,203] purposes, performing data analyses [161,169], based on which maps [16,195] and models [60,142] are created, forecasts [18,217] and risk assessments [4,107] are derived, and plans are made [103].
These fields of application bring positive effects: They support the achievement of the 17 SDGs by making available information more reliable and coherent [195], thus promoting better-informed decision-making and data-based policy implementation [15,25,26]. Furthermore, the use of data can thus contribute to the reduction in risks or even to their prevention [81,106,107,208]. Performance improves as actions can be prioritized, and access or distribution of available resources is optimized [43,104,128]. Digitalization and the expansion of IT networks make it possible to reach economically disadvantaged people living in remote regions with inadequate infrastructure, e.g., in terms of medical or educational facilities [67].
Despite many positive effects and versatile application possibilities, several challenges persist: (1) Despite global expansion, IT infrastructures are still inadequate in many regions, especially in developing countries [68,69]. (2) With the number of internet users increasing worldwide, cyber attacks are also a growing phenomenon, and IT and operational technology protection is becoming increasingly important: Many countries, including developed economies, are struggling to fully implement cybersecurity, especially with regard to protecting critical (energy) infrastructures [233]. Although many countries have published cybersecurity strategies, Tvaronavičienė et al. [233] evaluated five selected national strategies using the six-tier model of [234] and showed that the protection of critical infrastructure and the cybersecurity that depends on it is very inadequate in most countries. (3) There is a lack of user acceptability of technologies that address human concerns (e.g., safety of self-driving cars) [66]. (4) Transparency of decision-making is limited with automated decision-making algorithms [171]. (5) One challenge is “data absences” [235] due to missing, unavailable, and/or incomplete data material [15,53,133]. (6) Data gaps mean that data are imperfect and may reflect existing data biases that arise from the reproduction of societal biases that can reinforce inequalities and discrimination [23,24,236]. (7) Increasing inequality affects emerging and developing countries, as they are not benefiting from the deployment of AI technologies but are experiencing a “tech colonialism” [189]. (8) A general challenge is the low interpretability of various ML models, for which it is important for data scientists to explain the models and understand results and for developers to debug and improve the models [97,98]. (9) Research gaps exist regarding the application of data-driven methods to achieve the 17 SDGs [211]. (10) Another challenge arises from the high energy consumption and emissions caused by the computing resources required for technology development and deployment, which counteracts the goal of sustainability [23]. (11) Another concern is ensuring model security, i.e., that malware does not manipulate data and lead to incorrect decisions of ML models [104,171]. (12) Lastly, ethical concerns, as well as privacy, ownership, and security issues, are prevalent [104,164,168].
Based on the challenges, recommendations for countermeasures can be derived from the literature: (1) A full-coverage IT infrastructure is necessary to enable systematic data collection in the form of data repositories and/or information systems and subsequently to be used for AI and data-driven applications in the context of the 17 SDGs. With the regionally prioritized expansion of IT infrastructure and AI capacity, open training (e.g., adult education, professional training) on the use of data-driven models (e.g., AI) [179] should occur to guarantee their correct application. Consistently, education should be the starting point to ensure the supply of qualified AI/ML/IT human resources. Investment in research and training, especially in economically deprived regions, is therefore advisable. (2) To further support the aim of accessibility, worldwide collaboration and networking needs to be encouraged, not only internationally but also interdisciplinarily. Advanced cloud computing, big data processing platforms, and blockchain technology can facilitate the secure exchange and processing of big data and can thus help establish global partnerships [168,230,232]. To achieve the 17 SDGs, the planning and implementation of measures should take place at the global level, e.g., in the form of a globally accepted multisectoral action plan [32,231]. (3) In order to protect critical (energy) infrastructures from cyber attacks, the development of effective cybersecurity management strategies is of great importance. Concrete recommendations for action relate to improving planning management and extensive employee training to provide the necessary knowledge about the components and the functioning of critical infrastructures, thus ensuring that volatile and susceptible parts are adequately protected when developing new solutions [233]. (4) Knowledge sharing via open-source software and freely available datasets should be encouraged [179] to advance the rollout of a full-coverage IT infrastructure, to increase user acceptability, and to make decision-making algorithms more transparent. Approaches that could be used here include interpretable models, human-centric AI, fair ML, explainable AI (cf. explainability) [25,237], and causability [238]. In addition to security and reliability, causability is a key criterion for the effective application of a model. It is a measure of how well the ML model clarifies the causal understanding of a specific problem for a user in a particular context based on its proposed explanation (determining causal relations between input features and model predictions) [239,240,241]. In determining causability, three important criteria must be considered: effectiveness, efficiency, and satisfaction for a specific context in which ML is used [239,240,241]. In terms of SDG-related tasks, data-driven approaches need to provide a contextual understanding of various problems, as they can have a variety of causes depending on geography, social structure, governance, the economy of the region, and various other reasons. For example, hunger, health, and social problems may look the same but have different causal relations to input data in different societies. In such cases, causability is a valuable measure for isolating the most appropriate model when multiple models predict outcomes equally well and have reasonable explainability but have different outcomes in terms of understanding context. Nilsson et al. [242] discuss various contextual factors in terms of positive and negative interactions of SDGs; it is important that AI/ML are able to understand such contextual factors. (5) To compensate for data absences, it is recommended that high-quality data [15] are collected and (6) linked to large-scale comparative data with outcome data [192]. (7) An urgent recommendation for action is to close existing data gaps [211]. To address data absences as well as data gaps, the following recommendations can be made: widely accessible education; increased awareness of biases; better domain understanding of the field; and effective collaboration between developers, policy makers, and experts (e.g., business, data, law) [236,243]. (8) To specifically address data biases and discrimination, it is recommended that data be collected that can be disaggregated by gender [134] or geography [193]. Other measures include strict evaluation and benchmarking of AI/ML models, a robust framework for fair training, evaluation, and testing of ML, algorithmic transparency [244,245], and data transparency. (9) Democratization of AI, i.e., free and fair access to models [246], could be helpful for combatting “tech colonialism”. (10) There are different approaches for solving the problem of low interpretability of various ML models, such as application-grounded, human-grounded, functionally grounded, or model-agnostic evaluation [247]. (11) To close research gaps, multidisciplinary efforts that draw on already proven application fields from other disciplines are recommended [67,211]. (12) In order to reduce energy consumption and emissions from the operation of computing resources, the development of more energy-efficient technologies (cf. green technology) [44,45] is recommended. (13) To ensure model security, model security evaluation is required first, and reactive and proactive approaches for protecting models are permissible [248]. It is recommended that data and models are tested and protected, as well as warning users about data compromises [86,195]. (14) Implementing global guidelines for the secure and ethical use of data would be a step toward addressing ethical concerns as well as privacy, ownership, and security issues [103]. Concerns about fair data sharing, data ownership, and data privacy could be addressed—alongside mutual-consent policies and agreements—through MPC protocols and blockchain technology [168,231].

5. Discussion and Conclusions

Although the SDGs are receiving growing attention worldwide, our research found that there are wide disparities in the achievement of the 17 SDGs, especially when comparing developed, emerging, and developing countries. The latter require measures adapted to their specific needs to further advance the achievement of the SDGs. Furthermore, it cannot be overemphasized that knowledge sharing should be encouraged and supported through all reliable channels. Country- or region-specific strategies are already being applied to develop appropriate policy and regulatory frameworks for AI, as well as AI-based tools, products, and services: The “Smart Africa” government alliance is pursuing the implementation of these plans for its 30 African member countries, while the International Research Centre on Artificial Intelligence (IRCAI) is working to implement these plans for UNESCO member states [249]. The following actions could make a significant contribution to achieving the SDGs: an extensive rollout of a full-coverage IT network, strong collaborative efforts to share knowledge across borders and disciplines, integration and support of actions at all levels, further development and use of AI in line with the SDGs, as well as implementing ethical, legal, and policy guidelines.
The 17 SDGs are closely interrelated, and the data-driven methods used in achieving them overlap or are applicable to multiple SDGs simultaneously. This illustrates that a sustainable environment and a just, secure, and thriving society can only be created if all SDGs are addressed. This is particularly true for the SDGs that have received less research attention compared with others (e.g., SDG 16 and 17). Therefore, for future research, it is suggested that research gaps with regard to neglected SDGs are filled and that their connections to the other SDGs are explored. Ideally, data-driven methods and tools should contribute to the achievement of multiple SDGs simultaneously and should be mutually reinforcing or complementary. Another area of future research should focus on examining the role of AI in accelerating innovations that contribute to achieving the SDGs. Data-driven technologies are innovations in their own right and contribute to change in living and business environments. They open up opportunities that may accelerate developments but also may cause new challenges.
There are certain limitations resulting from the scope of the study and the chosen method that should be addressed by future research: (1) Although it is known that there are complex interrelationships between the 17 SDGs and that they influence each other, the interactions between them are not sufficiently discussed [250,251,252]. Several questions are not conclusively addressed, such as: How does the decision to use AI to perform tasks to achieve one SDG impact the achievement of the other 16 SDGs as they are interlinked? How can AI optimize the overall impact of the SDGs, considering the trade-offs among them? (2) There is a lack of a data-driven framework that enables the use of AI and allows for a robust and comprehensive evaluation of AI methods for making effective decisions about which SDGs should be prioritized in terms of AI use. Therefore, there is no consensus on how AI/ML methods can be applied to SDG problems. (3) AI models vary in their effectiveness in achieving the 17 SDGs and present us with different challenges: For example, DL can be used in healthcare (cf. SDG 3) with high prediction accuracy, but given the lack of explainability and causability, as well as concerns about patient–physician relationships, data security, and privacy [104], the question remains whether or not AI models should be used or how they should be used. In other cases, AI models are only moderately effective, have redundant or negative effects, or may lead to (data) problems. Especially in developing countries, data are often unavailable or insufficient. How useful or effective is the use of AI models in these cases? Accordingly, the use of AI requires a very detailed and systematic understanding of the challenges in its use and the potential impact, both positive and negative. Defining a generally acceptable framework for the use of data-driven approaches to realize their full potential to achieve the 17 SDGs with minimal risk will be one of the upcoming challenges. Future research should analyze the interrelationships between the SDGs, identify and prioritize the most important SDGs, and evaluate whether the use of data-driven approaches/AI is effective in achieving the prioritized SDGs.
In conclusion, it can be stated that data-driven and AI approaches have been and are likely to continue to be instrumental in achieving the SDGs, although the potential remains untapped to date. For this reason, the achievement of the UN’ 17 SDGs by 2030 must be considered ambitious but not very likely. It should be in all of our interests to continue to work towards achieving the SDGs.

Author Contributions

Conceptualization, H.J. and M.B.; data curation, S.T. and N.B.; formal analysis, N.B., S.T., M.B. and H.J.; investigation, M.B. and H.J.; methodology, S.T. and N.B.; project administration, H.J.; resources, M.B. and H.J.; supervision, H.J.; validation, S.T.; visualization, N.B. and S.T.; writing—original draft preparation, N.B., S.T., M.B. and H.J.; writing—review and editing, N.B., S.T., H.J. and M.B. All authors have read and agreed to the published version of the manuscript.

Funding

This research received no external funding.

Institutional Review Board Statement

Not applicable.

Informed Consent Statement

Not applicable.

Conflicts of Interest

The authors declare no conflict of interest.

References

  1. Arora, N.K.; Mishra, I. United Nations Sustainable Development Goals 2030 and environmental sustainability: Race against time. J. Environ. Sustain. 2019, 2, 339–342. [Google Scholar] [CrossRef] [Green Version]
  2. United Nations General Assembly. Transforming our World: The 2030 Agenda for Sustainable Development; A/RES/70; United Nations: New York, NY, USA, 2015. [Google Scholar]
  3. Allen, C.; Metternicht, G.; Wiedmann, T. Initial progress in implementing the Sustainable Development Goals (SDGs): A review of evidence from countries. Sustain. Sci. 2018, 13, 1453–1467. [Google Scholar] [CrossRef]
  4. Palomares, I.; Martínez-Cámara, E.; Montes, R.; García-Moral, P.; Chiachio, M.; Chiachio, J.; Alonso, S.; Melero, F.J.; Molina, D.; Fernández, B.; et al. A panoramic view and swot analysis of artificial intelligence for achieving the sustainable development goals by 2030: Progress and prospects. Appl. Intell. 2021, 51, 6497–6527. [Google Scholar] [CrossRef] [PubMed]
  5. Tranfield, D.; Denyer, D.; Smart, P. Towards a methodology for developing evidence-informed management knowledge by means of systematic review. Br. J. Manag. 2003, 14, 207–222. [Google Scholar] [CrossRef]
  6. Kubíček, A.; Machek, O. Gender-related factors in family business succession: A systematic literature review. Rev. Manag. Sci. 2019, 13, 963–1002. [Google Scholar] [CrossRef]
  7. Finfgeld-Connett, D. Use of content analysis to conduct knowledge-building and theory-generating qualitative systematic reviews. Qual. Res. 2014, 14, 341–352. [Google Scholar] [CrossRef]
  8. World Bank. Decline of Global Extreme Poverty Continues but Has Slowed: World Bank; Press Release No: 2019/030/DEC-GPV; The World Bank: Washington, DC, USA, 2018; Available online: https://www.worldbank.org/en/news/press-release/2018/09/19/decline-of-global-extreme-poverty-continues-but-has-slowed-world-bank (accessed on 31 January 2022).
  9. United Nations. The Sustainable Development Goals Report 2021; United Nations Publications: New York, NY, USA, 2021; Available online: https://unstats.un.org/sdgs/report/2021/The-Sustainable-Development-Goals-Report-2021.pdf (accessed on 31 January 2022).
  10. Alkire, S.; Kanagaratnam, U.; Suppa, N. The Global Multidimensional Poverty Index (MPI) 2020; OPHI MPI Methodology Notes; Oxford Poverty and Human Development Initiative, University of Oxford: Oxford, UK, 2020; Volume 51, pp. 1–39. [Google Scholar]
  11. Alkire, S.; Kovesdi, F.; Mitchell, C.; Pinilla-Roncancio, M.; Scharlin-Pettee, S. Changes over Time in the Global Multidimensional Poverty Index; OPHI MPI Methodology Notes; Oxford Poverty and Human Development Initiative, University of Oxford: Oxford, UK, 2020; Volume 50, pp. 1–114. [Google Scholar]
  12. Bourguignon, F.; Chakravarty, S.R. The measurement of multidimensional poverty. In Poverty, Social Exclusion and Stochastic Dominance; Chakravarty, S.R., Ed.; Springer: Singapore, 2019; pp. 83–107. [Google Scholar] [CrossRef]
  13. Santos, M.E.; Villatoro, P. A multidimensional poverty index for Latin America. Rev Income Wealth 2018, 64, 52–82. [Google Scholar] [CrossRef] [Green Version]
  14. Blumenstock, J.; Cadamuro, G.; On, R. Predicting poverty and wealth from mobile phone metadata. Science 2015, 350, 1073–1076. [Google Scholar] [CrossRef] [Green Version]
  15. Jean, N.; Burke, M.; Xie, M.; Davis, W.M.; Lobell, D.B.; Ermon, S. Combining satellite imagery and machine learning to predict poverty. Science 2016, 353, 790–794. [Google Scholar] [CrossRef] [Green Version]
  16. Levin, N.; Kyba, C.C.; Zhang, Q.; de Miguel, A.S.; Román, M.O.; Li, X.; Portnov, B.A.; Molthan, A.L.; Jechow, A.; Miller, S.D.; et al. Remote sensing of night lights: A review and an outlook for the future. Remote Sens. Environ. 2020, 237, 111443. [Google Scholar] [CrossRef]
  17. On, R. Data-Driven Development: Essays on the Use of Mobile Phone Data and Information to Measure and Reduce Poverty; University of California: Berkeley, CA, USA, 2018. [Google Scholar]
  18. Sheng, B.; Chen, S.; Si, H.; Zhu, Y.; Bai, Z.; Li, S. A Feature-based Deep Neural Framework for Poverty Prediction. In Proceedings of the CONF-CDS 2021: The 2nd International Conference on Computing and Data Science, Stanford, CA, USA, 28–30 January 2021; pp. 568–573. [Google Scholar] [CrossRef]
  19. Zhang, G.; Guo, X.; Li, D.; Jiang, B. Evaluating the potential of LJ1-01 nighttime light data for modeling socio-economic parameters. Sensors 2019, 19, 1465. [Google Scholar] [CrossRef] [Green Version]
  20. Pandey, S.M.; Agarwal, T.; Krishnan, N.C. Multi-task deep learning for predicting poverty from satellite images. In Proceedings of the 30th IAAI Conference on Innovative Applications of Artificial Intelligence, New Orleans, LA, USA, 2–7 February 2018; pp. 7793–7798. [Google Scholar]
  21. Watmough, G.R.; Marcinko, C.L.; Sullivan, C.; Tschirhart, K.; Mutuo, P.K.; Palm, C.A.; Svenning, J.C. Socioecologically informed use of remote sensing data to predict rural household poverty. Proc. Natl. Acad. Sci. USA 2019, 116, 1213–1218. [Google Scholar] [CrossRef] [Green Version]
  22. Yeh, C.; Perez, A.; Driscoll, A.; Azzari, G.; Tang, Z.; Lobell, D.; Ermon, S.; Burke, M. Using publicly available satellite imagery and deep learning to understand economic well-being in Africa. Nat. Commun. 2020, 11, 2583. [Google Scholar] [CrossRef]
  23. Vinuesa, R.; Azizpour, H.; Leite, I.; Balaam, M.; Dignum, V.; Domisch, S.; Felländer, A.; Langhans, S.D.; Tegmark, M.; Nerini, F.F. The role of artificial intelligence in achieving the Sustainable Development Goals. Nat. Commun. 2020, 11, 233. [Google Scholar] [CrossRef] [Green Version]
  24. Olteanu, A.; Castillo, C.; Diaz, F.; Kıcıman, E. Social data: Biases, methodological pitfalls, and ethical boundaries. Front. Big Data 2019, 2, 13. [Google Scholar] [CrossRef] [Green Version]
  25. Mehrabi, N.; Morstatter, F.; Saxena, N.; Lerman, K.; Galstyan, A. A survey on bias and fairness in machine learning. ACM Comput. Surv. 2021, 54, 1–35. [Google Scholar] [CrossRef]
  26. Saleiro, P.; Kuester, B.; Hinkson, L.; London, J.; Stevens, A.; Anisfeld, A.; Rodolfa, K.T.; Ghani, R. Aequitas: A bias and fairness audit toolkit. arXiv 2018, arXiv:1811.05577. [Google Scholar]
  27. Welthungerhilfe. Hunger: Facts & Figures. 2020. Available online: https://www.welthungerhilfe.org/hunger/ (accessed on 31 January 2022).
  28. Tireuov, K.; Mizanbekova, S.; Kalykova, B.; Nurmanbekova, G. Towards food security and sustainable development through enhancing efficiency of grain industry. Entrep. Sustain. Issues 2018, 6, 446–455. [Google Scholar] [CrossRef] [Green Version]
  29. Blesh, J.; Hoey, L.; Jones, A.D.; Friedmann, H.; Perfecto, I. Development pathways toward “zero hunger”. World Dev. 2019, 118, 1–14. [Google Scholar] [CrossRef]
  30. Zeigermann, U. Policy Coherence for Sustainable Development–A Promising Approach for Human Security in Fragile States? J. Peacebuilding Dev. 2020, 15, 282–297. [Google Scholar] [CrossRef]
  31. Shukla, M.; Jharkharia, S. Agri-fresh produce supply chain management: A state-of-the-art literature review. Int. J. Oper. Prod. Manag. 2013, 33, 114–158. [Google Scholar] [CrossRef]
  32. Heidkamp, R.A.; Piwoz, E.; Gillespie, S.; Keats, E.C.; D’Alimonte, M.R.; Menon, P.; Das, J.K.; Flory, A.; Clift, J.W.; Ruel, M.T.; et al. Mobilising evidence, data, and resources to achieve global maternal and child undernutrition targets and the Sustainable Development Goals: An agenda for action. Lancet 2021, 397, 1400–1418. [Google Scholar] [CrossRef]
  33. DataDENT. Data for Decisions to Expand Nutrition Transformation. 2017. Available online: https://datadent.org/ (accessed on 31 January 2022).
  34. F2F. Farm to Fork Strategy. 2020. Available online: https://ec.europa.eu/food/farm2fork_en (accessed on 31 January 2022).
  35. Montanarella, L.; Panagos, P. The relevance of sustainable soil management within the European Green Deal. Land Use Policy 2021, 100, 104950. [Google Scholar] [CrossRef]
  36. Hossain, M.A.; Siddique, M.N.A. Online fertilizer recommendation system (OFRS): A step towards precision agriculture and optimized fertilizer usage by smallholder farmers in Bangladesh. Eur. J. Environ. Sci. 2020, 1, 1–9. [Google Scholar] [CrossRef]
  37. Kulkarni, N.H.; Srinivasan, G.N.; Sagar, B.M.; Cauvery, N.K. Improving Crop Productivity Through A Crop Recommendation System Using Ensembling Technique. In Proceedings of the 2018 3rd International Conference on Computational Systems and Information Technology for Sustainable Solutions (CSITSS), Bengaluru, India, 20–22 December 2018; pp. 114–119. [Google Scholar] [CrossRef]
  38. Lacasta, J.; Lopez-Pellicer, F.J.; Espejo-García, B.; Nogueras-Iso, J.; Zarazaga-Soria, F.J. Agricultural recommendation system for crop protection. Comput. Electron. Agric. 2018, 152, 82–89. [Google Scholar] [CrossRef] [Green Version]
  39. Pawar, M.; Chillarge, G. Soil toxicity prediction and recommendation system using data mining in precision agriculture. In Proceedings of the 2018 3rd International Conference for Convergence in Technology (I2CT), Pune, India, 6–8 April 2018; pp. 1–5. [Google Scholar] [CrossRef]
  40. Pudumalar, S.; Ramanujam, E.; Rajashree, R.H.; Kavya, C.; Kiruthika, T.; Nisha, J. Crop recommendation system for precision agriculture. In Proceedings of the 2016 Eighth International Conference on Advanced Computing (ICoAC), Chennai, India, 19–21 January 2017; pp. 32–36. [Google Scholar] [CrossRef]
  41. Rajak, R.K.; Pawar, A.; Pendke, M.; Shinde, P.; Rathod, S.; Devare, A. Crop recommendation system to maximize crop yield using machine learning technique. Int. Res. J. Eng. Technol. 2017, 4, 950–953. [Google Scholar]
  42. Suchithra, M.S.; Pai, M.L. Data mining based geospatial clustering for suitable recommendation system. In Proceedings of the 2020 International Conference on Inventive Computation Technologies (ICICT), Coimbatore, India, 26–28 February 2020; pp. 132–139. [Google Scholar] [CrossRef]
  43. Smith, P.; Soussana, J.-F.; Angers, D.; Schipper, L.; Chenu, C.; Rasse, D.P.; Batjes, N.H.; van Egmond, F.; McNeill, S.; Kuhnert, M.; et al. How to measure, report and verify soil carbon change to realize the potential of soil carbon sequestration for atmospheric greenhouse gas removal. Glob. Chang. Biol. 2020, 26, 219–241. [Google Scholar] [CrossRef] [Green Version]
  44. Arnal, Á.J.; Royo, P.; Pataro, G.; Ferrari, G.; Ferreira, V.J.; López-Sabirón, A.M.; Ferreira, G.A. Implementation of PEF treatment at real-scale tomatoes processing considering LCA methodology as an innovation strategy in the agri-food sector. Sustainability 2018, 10, 979. [Google Scholar] [CrossRef] [Green Version]
  45. Xue, L.; Cao, Z.; Scherhaufer, S.; Östergren, K.; Cheng, S.; Liu, G. Mapping the EU tomato supply chain from farm to fork for greenhouse gas emission mitigation strategies. J. Ind. Ecol. 2021, 25, 377–389. [Google Scholar] [CrossRef]
  46. Alonso, J.; Villa, A.; Bahamonde, A. Improved estimation of bovine weight trajectories using Support Vector Machine Classification. Comput. Electron. Agric. 2015, 110, 36–41. [Google Scholar] [CrossRef] [Green Version]
  47. Borgonovo, F.; Ferrante, V.; Grilli, G.; Pascuzzo, R.; Vantini, S.; Guarino, M. A data-driven prediction method for an early warning of coccidiosis in intensive livestock systems: A preliminary study. Animals 2020, 10, 747. [Google Scholar] [CrossRef] [PubMed]
  48. Colles, F.M.; Cain, R.J.; Nickson, T.; Smith, A.L.; Roberts, S.J.; Maiden, M.; Lunn, D.; Dawkins, M.S. Monitoring chicken flock behaviour provides early warning of infection by human pathogen Campylobacter. Proc. R. Soc. B. Biol. Sci. 2016, 283, 20152323. [Google Scholar] [CrossRef] [PubMed] [Green Version]
  49. Jaddoa, M.A.; Al-Jumaily, A.A.; González, L.A.; Cuthbertson, H. Automatic temperature measurement for hot spots in face region of cattle using infrared thermography. In Proceedings of the ICINCO 2019-Proceedings of the 16th International Conference on Informatics in Control, Automation and Robotics, Prague, Czech Republic, 29–31 July 2019. [Google Scholar]
  50. Neethirajan, S. The role of sensors, big data and machine learning in modern animal farming. Sens. Bio-Sens. Res. 2020, 29, 100367. [Google Scholar] [CrossRef]
  51. VanderWaal, K.; Morrison, R.B.; Neuhauser, C.; Vilalta, C.; Perez, A.M. Translating big data into smart data for veterinary epidemiology. Front. Vet. Sci. 2017, 4, 110. [Google Scholar] [CrossRef]
  52. Nicastro, R.; Carillo, P. Food Loss and Waste Prevention Strategies from Farm to Fork. Sustainability 2021, 13, 5443. [Google Scholar] [CrossRef]
  53. Chaboud, G.; Daviron, B. Food losses and waste: Navigating the inconsistencies. Glob. Food Sec. 2017, 12, 1–7. [Google Scholar] [CrossRef]
  54. Godfray, H.C.J.; Crute, I.R.; Haddad, L.; Lawrence, D.; Muir, J.F.; Nisbett, N.; Pretty, J.; Robinson, S.; Toulmin, C.; Whiteley, R. The future of the global food system. Philos. Trans. R. Soc. B Biol. Sci. 2010, 365, 2769–2777. [Google Scholar] [CrossRef] [Green Version]
  55. Godfray, H.C.J.; Garnett, T. Food security and sustainable intensification. Philos. Trans. R. Soc. B Biol. Sci. 2014, 369, 20120273. [Google Scholar] [CrossRef]
  56. Purnhagen, K.P.; Clemens, S.; Eriksson, D.; Fresco, L.O.; Tosun, J.; Qaim, M.; Visser, R.G.; Weber, A.P.; Wesseler, J.H.; Zilberman, D. Europe’s Farm to Fork Strategy and Its Commitment to Biotechnology and Organic Farming: Conflicting or Complementary Goals? Trends Plant Sci. 2021, 26, 600–606. [Google Scholar] [CrossRef]
  57. Fanzo, J.; Haddad, L.; McLaren, R.; Marshall, Q.; Davis, C.; Herforth, A.; Jones, A.; Beal, T.; Tschirley, D.; Bellows, A.; et al. The Food Systems Dashboard is a new tool to inform better food policy. Nat. Food 2020, 1, 243–246. [Google Scholar] [CrossRef]
  58. Kamble, S.S.; Gunasekaran, A.; Gawankar, S.A. Achieving sustainable performance in a data-driven agriculture supply chain: A review for research and applications. Int. J. Prod. Econ. 2020, 219, 179–194. [Google Scholar] [CrossRef]
  59. Sharma, R.; Kamble, S.S.; Gunasekaran, A.; Kumar, V.; Kumar, A. A systematic literature review on machine learning applications for sustainable agriculture supply chain performance. Comput. Oper. Res. 2020, 119, 104926. [Google Scholar] [CrossRef]
  60. Gardas, B.B.; Raut, R.D.; Cheikhrouhou, N.; Narkhede, B.E. A hybrid decision support system for analyzing challenges of the agricultural supply chain. Sustain. Prod. Consum. 2019, 18, 19–32. [Google Scholar] [CrossRef]
  61. Liu, P.; Long, Y.; Song, H.C.; He, Y.D. Investment decision and coordination of green agri-food supply chain considering information service based on blockchain and big data. J. Clean. Prod. 2020, 277, 123646. [Google Scholar] [CrossRef]
  62. Adhitya, Y.; Prakosa, S.W.; Köppen, M.; Leu, J.S. Convolutional Neural Network Application in Smart Farming. In International Conference on Soft Computing in Data Science; Springer: Singapore, 2019; pp. 287–297. [Google Scholar]
  63. Tantalaki, N.; Souravlas, S.; Roumeliotis, M. Data-driven decision making in precision agriculture: The rise of big data in agricultural systems. J. Agric. Food Inf. 2019, 20, 344–380. [Google Scholar] [CrossRef]
  64. Jodlbauer, H. Geschäftsmodelle Erarbeiten: Modell zur Digitalen Transformation Etablierter Unternehmen; Springer Gabler: Wiesbaden, Germany, 2020. [Google Scholar] [CrossRef]
  65. Sarker, M.N.I.; Wu, M.; Chanthamith, B.; Yusufzada, S.; Li, D.; Zhang, J. Big data driven smart agriculture: Pathway for sustainable development. In Proceedings of the 2019 2nd International Conference on Artificial Intelligence and Big Data (ICAIBD), Chengdu, China, 25–28 May 2019; pp. 60–65. [Google Scholar] [CrossRef]
  66. Vasisht, D.; Kapetanovic, Z.; Won, J.; Jin, X.; Chandra, R.; Sinha, S.; Kapoor, A.; Sudarshan, M.; Stratman, S. Farmbeats: An iot platform for data-driven agriculture. In Proceedings of the 14th USENIX Symposium on Networked Systems Design and Implementation (NSDI 17), Boston, MA, USA, 27–29 March 2017; pp. 515–529. [Google Scholar]
  67. Mehrabi, Z.; McDowell, M.J.; Ricciardi, V.; Levers, C.; Martinez, J.D.; Mehrabi, N.; Wittman, H.; Ramankutty, N.; Jarvis, A. The global divide in data-driven farming. Nat. Sustain. 2021, 4, 154–160. [Google Scholar] [CrossRef]
  68. Khan, K.S.; Wojdyla, D.; Say, L.; Gülmezoglu, A.M.; Van Look, P.F. WHO analysis of causes of maternal death: A systematic review. Lancet 2006, 367, 1066–1074. [Google Scholar] [CrossRef]
  69. Ronsmans, C.; Graham, W.J. Lancet Maternal Survival Series steering group. Maternal mortality: Who, when, where, and why. Lancet 2006, 368, 1189–1200. [Google Scholar] [CrossRef]
  70. Castillo, A.G.; Telan, S.M.; Palaoag, T. Cloud-based data mining framework: A model to improve maternal healthcare. In Proceedings of the 2nd International Conference on Cryptography, Security and Privacy, Guiyang, China, 16–19 March 2018; pp. 21–28. [Google Scholar] [CrossRef]
  71. Li, X.; Lu, Y.; Shi, S.; Zhu, X.; Fu, X. The Impact of Healthcare Monitoring Technologies for Better Pregnancy. In Proceedings of the 2021 IEEE 4th International Conference on Electronics Technology (ICET), Chengdu, China, 7–10 May 2021; pp. 731–736. [Google Scholar] [CrossRef]
  72. Ngiam, K.Y.; Khor, W. Big data and machine learning algorithms for health-care delivery. Lancet Oncol. 2019, 20, e262–e273. [Google Scholar] [CrossRef]
  73. Adebayo, I.P. Predictive model for the classification of hypertension risk using decision trees algorithm. Am. J. Math. Comput. Model. 2017, 2, 48–59. [Google Scholar] [CrossRef]
  74. Campero-Jurado, I.; Robles-Camarillo, D.; Simancas-Acevedo, E. Problems in pregnancy, modeling fetal mortality through the Naïve Bayes classifier. Int. J. Comb. Optim. Probl. Inform. 2020, 11, 121–129. [Google Scholar]
  75. Mathew, N. A Boosting Approach for Maternal Hypertensive Disorder Detection. In Proceedings of the 2018 Second International Conference on Inventive Communication and Computational Technologies (ICICCT), Coimbatore, India, 20–21 April 2018; pp. 1474–1477. [Google Scholar] [CrossRef]
  76. Moreira, M.W.; Rodrigues, J.J.; Oliveira, A.M.; Ramos, R.F.; Saleem, K. A preeclampsia diagnosis approach using Bayesian networks. In Proceedings of the 2016 IEEE International Conference on Communications (ICC), Kuala Lumpur, Malaysia, 22–27 May 2016; pp. 1–5. [Google Scholar] [CrossRef]
  77. Moreira, M.W.; Rodrigues, J.J.; Oliveira, A.M.; Saleem, K.; Neto, A.J.V. An inference mechanism using bayes-based classifiers in pregnancy care. In Proceedings of the 2016 IEEE 18th International Conference on e-Health Networking, Applications and Services (Healthcom), Munich, Germany, 14–17 September 2016; pp. 1–5. [Google Scholar] [CrossRef]
  78. Moreira, M.W.; Rodrigues, J.J.; Oliveira, A.M.; Saleem, K.; Neto, A.J.V. Predicting hypertensive disorders in high-risk pregnancy using the random forest approach. In Proceedings of the 2017 IEEE International Conference on Communications (ICC), Paris, France, 21–25 May 2017; pp. 1–5. [Google Scholar] [CrossRef]
  79. Prema, N.S.; Pushpalatha, M.P. An Ensemble Model for the Prediction of Gestational Diabetes Mellitus (GDM). Indian J. Public Health Res. Dev. 2019, 10, 430–439. [Google Scholar] [CrossRef]
  80. Tahir, M.; Badriyah, T.; Syarif, I. Classification Algorithms of Maternal Risk Detection For Preeclampsia With Hypertension During Pregnancy Using Particle Swarm Optimization. Emitter Int. J. Eng. Technol. 2018, 6, 236–253. [Google Scholar] [CrossRef]
  81. Rodríguez, E.A.; Estrada, F.E.; Torres, W.C.; Santos, J.C.M. Early prediction of severe maternal morbidity using machine learning techniques. In Ibero-American Conference on Artificial Intelligence; Springer: Cham, Switzerland, 2016; pp. 259–270. [Google Scholar] [CrossRef]
  82. Moreira, M.W.; Rodrigues, J.J.; Marcondes, G.A.; Neto, A.J.V.; Kumar, N.; Diez, I.D.L.T. A preterm birth risk prediction system for mobile health applications based on the support vector machine algorithm. In Proceedings of the 2018 IEEE International Conference on Communications (ICC), Kansas City, MO, USA, 20–24 May 2018; pp. 1–5. [Google Scholar] [CrossRef]
  83. Oprescu, A.M.; Miro-Amarante, G.; García-Díaz, L.; Beltrán, L.M.; Rey, V.E.; Romero-Ternero, M. Artificial intelligence in pregnancy: A scoping review. IEEE Access 2020, 8, 181450–181484. [Google Scholar] [CrossRef]
  84. Rivera-Romero, O.; Olmo, A.; Muñoz, R.; Stiefel, P.; Miranda, M.L.; Beltrán, L.M. Mobile health solutions for hypertensive disorders in pregnancy: Scoping literature review. JMIR mHealth uHealth 2018, 6, e9671. [Google Scholar] [CrossRef] [Green Version]
  85. Lim, J.; Cloete, G.; Dunsmuir, T.D.; Payne, A.B.; Scheffer, C.; Von Dadelszen, P.; Dumont, A.G.; Ansermino, M.J. Usability and feasibility of PIERS on the move: An mHealth app for pre-eclampsia triage. JMIR mHealth uHealth 2015, 3, e37. [Google Scholar] [CrossRef] [Green Version]
  86. Wu, Y.-T.; Zhang, C.-J.; Mol, B.W.; Kawai, A.; Li, C.; Chen, L.; Wang, Y.; Sheng, J.-Z.; Fan, J.-X.; Shi, Y.; et al. Early prediction of gestational diabetes mellitus in the Chinese population via advanced machine learning. J. Clin. Endocrinol. Metab. 2021, 106, e1191–e1205. [Google Scholar] [CrossRef]
  87. Artzi, N.S.; Shilo, S.; Hadar, E.; Rossman, H.; Barbash-Hazan, S.; Ben-Haroush, A.; Balicer, R.D.; Feldman, B.; Wiznitzer, A.; Segal, E. Prediction of gestational diabetes based on nationwide electronic health records. Nat. Med. 2020, 26, 71–76. [Google Scholar] [CrossRef]
  88. Qiu, H.; Yu, H.-Y.; Wang, L.-Y.; Yao, Q.; Wu, S.-N.; Yin, C.; Fu, B.; Zhu, X.-J.; Zhang, Y.-L.; Xing, Y.; et al. Electronic health record driven prediction for gestational diabetes mellitus in early pregnancy. Sci. Rep. 2017, 7, 16417. [Google Scholar] [CrossRef] [Green Version]
  89. Ren, H.; Wang, J.; Zhao, W.X.; Wu, N. RAPT: Pre-training of Time-Aware Transformer for Learning Robust Healthcare Representation. In Proceedings of the 27th ACM SIGKDD Conference on Knowledge Discovery & Data Mining, Singapore, 14–18 August 2021; pp. 3503–3511. [Google Scholar] [CrossRef]
  90. Gianfrancesco, M.A.; Tamang, S.; Yazdany, J.; Schmajuk, G. Potential biases in machine learning algorithms using electronic health record data. JAMA Intern. Med. 2018, 178, 1544–1547. [Google Scholar] [CrossRef]
  91. Betts, K.S.; Kisely, S.; Alati, R. Predicting neonatal respiratory distress syndrome and hypoglycaemia prior to discharge: Leveraging health administrative data and machine learning. J. Biomed. Inform. 2021, 114, 103651. [Google Scholar] [CrossRef] [PubMed]
  92. Kefi, Z.; Aloui, K.; Naceur, M.S. The early prediction of neonates mortality in Intensive Care Unit. In Proceedings of the 2019 International Conference on Advanced Systems and Emergent Technologies (IC_ASET), Hammamet, Tunisia, 19–22 March 2019; pp. 304–306. [Google Scholar] [CrossRef]
  93. Malak, J.S.; Zeraati, H.; Nayeri, F.S.; Safdari, R.; Shahraki, A.D. Neonatal intensive care decision support systems using artificial intelligence techniques: A systematic review. Artif. Intell. Rev. 2019, 52, 2685–2704. [Google Scholar] [CrossRef]
  94. Rinta-Koski, O.P.; Särkkä, S.; Hollmén, J.; Leskinen, M.; Andersson, S. Gaussian process classification for prediction of in-hospital mortality among preterm infants. Neurocomputing 2018, 298, 134–141. [Google Scholar] [CrossRef] [Green Version]
  95. Sheikhtaheri, A.; Zarkesh, M.R.; Moradi, R.; Kermani, F. Prediction of neonatal deaths in NICUs: Development and validation of machine learning models. BMC Med. Inform. Decis. Mak. 2021, 21, 131. [Google Scholar] [CrossRef] [PubMed]
  96. Song, W.; Jung, S.Y.; Baek, H.; Choi, C.W.; Jung, Y.H.; Yoo, S. A Predictive Model Based on Machine Learning for the Early Detection of Late-Onset Neonatal Sepsis: Development and Observational Study. JMIR Med. Inform. 2020, 8, e15965. [Google Scholar] [CrossRef] [PubMed]
  97. Brahma, D.; Mukherjee, D. Early warning signs: Targeting neonatal and infant mortality using machine learning. Appl. Econ. 2021, 54, 57–74. [Google Scholar] [CrossRef]
  98. Saravanou, A.; Noelke, C.; Huntington, N.; Acevedo-Garcia, D.; Gunopulos, D. Predictive modeling of infant mortality. Data Min. Knowl. Discov. 2021, 35, 1785–1807. [Google Scholar] [CrossRef]
  99. Cao, B.; Bao, H.; Oppong, E.; Feng, S.; Smith, K.M.; Tucker, J.D.; Tang, W. Digital health for sexually transmitted infection and HIV services: A global scoping review. Curr. Opin. Infect. Dis. 2020, 33, 44–50. [Google Scholar] [CrossRef]
  100. Aggarwal, R.; Sounderajah, V.; Martin, G.; Ting, D.S.W.; Karthikesalingam, A.; King, D.; Ashrafian, H.; Darzi, A. Diagnostic accuracy of deep learning in medical imaging: A systematic review and meta-analysis. NPJ Digit. Med. 2021, 4, 65. [Google Scholar] [CrossRef]
  101. Lakhani, P.; Sundaram, B. Deep learning at chest radiography: Automated classification of pulmonary tuberculosis by using convolutional neural networks. Radiology 2017, 284, 574–582. [Google Scholar] [CrossRef]
  102. Ting, D.S.; Liu, Y.; Burlina, P.; Xu, X.; Bressler, N.M.; Wong, T.Y. AI for medical imaging goes deep. Nat. Med. 2018, 24, 539–540. [Google Scholar] [CrossRef]
  103. Schwalbe, N.; Wahl, B. Artificial intelligence and the future of global health. Lancet 2020, 395, 1579–1586. [Google Scholar] [CrossRef]
  104. Topol, E.J. High-performance medicine: The convergence of human and artificial intelligence. Nat. Med. 2019, 25, 44–56. [Google Scholar] [CrossRef]
  105. Holzinger, A.; Weippl, E.; Tjoa, A.M.; Kieseberg, P. Digital Transformation for Sustainable Development Goals (SDGs)—A Security, Safety and Privacy Perspective on AI. In Machine Learning and Knowledge Extraction; Lecture Notes in Computer Science; Holzinger, A., Kieseberg, P., Tjoa, A.M., Weippl, E., Eds.; Springer: Cham, Switzerland, 2021; Volume 12844, pp. 1–20. [Google Scholar] [CrossRef]
  106. Ren, H.; Song, Y.; Wang, J.; Hu, Y.; Lei, J. A deep learning approach to the citywide traffic accident risk prediction. In Proceedings of the 2018 21st International Conference on Intelligent Transportation Systems (ITSC), Maui, HI, USA, 4–7 November 2018; pp. 3346–3351. [Google Scholar] [CrossRef] [Green Version]
  107. Zantalis, F.; Koulouras, G.; Karabetsos, S.; Kandris, D. A review of machine learning and IoT in smart transportation. Future Internet 2019, 11, 94. [Google Scholar] [CrossRef] [Green Version]
  108. Kumar Basak, S.; Wotto, M.; Belanger, P. E-learning, M-learning and D-learning: Conceptual definition and comparative analysis. E-Learn. Digit. Media 2018, 15, 191–216. [Google Scholar] [CrossRef]
  109. Kampylis, P.; Punie, Y.; Devine, J. Promoting Effective Digital-Age Learning-A European Framework for Digitally-Competent Educational Organisations (No. JRC98209); Joint Research Centre (Seville Site): Ispra, Italy, 2015. [Google Scholar]
  110. Blayone, T.J.; Barber, W.; DiGiuseppe, M.; Childs, E. Democratizing digital learning: Theorizing the fully online learning community model. Int. J. Educ. Technol. High. Educ. 2017, 14, 13. [Google Scholar] [CrossRef] [Green Version]
  111. Yen, M.H.; Chen, S.; Wang, C.Y.; Chen, H.L.; Hsu, Y.S.; Liu, T.C. A framework for self-regulated digital learning (SRDL). J. Comput. Assist. Learn. 2018, 34, 580–589. [Google Scholar] [CrossRef]
  112. Hernández-Velázquez, Y.; Mezura-Godoy, C.; Rosales-Morales, V.Y. M-Learning and Student-Centered Design: A Systematic Review of the Literature. In Proceedings of the International Conference on Software Process Improvement, Sinaloa, Mexico, 21–23 October 2020; Springer: Cham, Switzerland, 2020; pp. 349–363. [Google Scholar] [CrossRef]
  113. Overby, K. Student-centereD-learning. Essai 2011, 9, 109–112. [Google Scholar]
  114. Wright, G.B. Student-centereD-learning in higher education. Int. J. Teach. Learn. High. Educ. 2011, 23, 92–97. [Google Scholar]
  115. Yin, C.; Okubo, F.; Shimada, A.; Oi, M.; Hirokawa, S.; Yamada, M.; Kojima, K.; Ogata, H. Analyzing the features of learning behaviors of students using e-books. In Proceedings of the International Conference on Computers in Education, Hangzhou, China, 30 November–4 December 2015; pp. 617–626. [Google Scholar]
  116. Afzal, S.; Dhamecha, T.; Mukhi, N.; Sindhgatta Rajan, R.; Marvaniya, S.; Ventura, M.; Yarbro, J. Development and deployment of a large-scale dialog-based intelligent tutoring system. In Proceedings of the 2019 Conference of the North American Chapter of the Association for Computational Linguistics: Human Language Technologies, Minneapolis, MN, USA, 2–7 June 2019; Association for Computational Linguistics: Stroudsburg, PA, USA, 2019; Volume 2, pp. 114–121. [Google Scholar] [CrossRef]
  117. Akçayır, M.; Akçayır, G. Advantages and challenges associated with augmented reality for education: A systematic review of the literature. Educ. Res. Rev. 2017, 20, 1–11. [Google Scholar] [CrossRef]
  118. Huang, X.; Zou, D.; Cheng, G.; Xie, H. A Systematic Review of AR and VR Enhanced Language Learning. Sustainability 2021, 13, 4639. [Google Scholar] [CrossRef]
  119. Kim, Y.; Soyata, T.; Behnagh, R.F. Towards emotionally aware AI smart classroom: Current issues and directions for engineering and education. IEEE Access 2018, 6, 5308–5331. [Google Scholar] [CrossRef]
  120. Martin, F.; Dennen, V.P.; Bonk, C.J. A synthesis of systematic review research on emerging learning environments and technologies. Educ. Technol. Res. Dev. 2020, 68, 1613–1633. [Google Scholar] [CrossRef] [PubMed]
  121. Molnár, G.; Szűts, Z.; Biró, K. Use of augmented reality in learning. Acta Polytech. Hung. 2018, 15, 209–222. [Google Scholar]
  122. Mousavinasab, E.; Zarifsanaiey, N.; Niakan Kalhori, S.R.; Rakhshan, M.; Keikha, L.; Ghazi Saeedi, M. Intelligent tutoring systems: A systematic review of characteristics, applications, and evaluation methods. Interact. Learn. Environ. 2021, 29, 142–163. [Google Scholar] [CrossRef]
  123. Papanastasiou, G.; Drigas, A.; Skianis, C.; Lytras, M.; Papanastasiou, E. Virtual and augmented reality effects on K-12, higher and tertiary education students’ twenty-first century skills. Virtual Real. 2019, 23, 425–436. [Google Scholar] [CrossRef]
  124. Peng, H.; Ma, S.; Spector, J.M. Personalized adaptive learning: An emerging pedagogical approach enabled by a smart learning environment. Smart Learn. Environ. 2019, 6, 9. [Google Scholar] [CrossRef]
  125. Sailer, M.; Homner, L. The Gamification of Learning: A Meta-analysis. Educ. Psychol. Rev. 2020, 32, 77–112. [Google Scholar] [CrossRef] [Green Version]
  126. Vincent-Lancrin, S.; van der Vlies, R. Trustworthy Artificial Intelligence (AI) in Education: Promises and Challenges; OECD Education Working Papers, No. 218; OECD Publishing: Paris, France, 2020. [Google Scholar] [CrossRef]
  127. Zainuddin, Z.; Chu, S.K.W.; Shujahat, M.; Perera, C.J. The impact of gamification on learning and instruction: A systematic review of empirical evidence. Educ. Res. Rev. 2020, 30, 100326. [Google Scholar] [CrossRef]
  128. Luckin, R.; Holmes, W.; Griffiths, M.; Forcier, L.B. Intelligence Unleashed: An Argument for AI in Education; Pearson Education: London, UK, 2016. [Google Scholar]
  129. Ferreira-Mello, R.; André, M.; Pinheiro, A.; Costa, E.; Romero, C. Text mining in education. Wiley Interdiscip. Rev. Data Min. Knowl. Discov. 2019, 9, e1332. [Google Scholar] [CrossRef]
  130. Hannan, E.; Liu, S. AI: New source of competitiveness in higher education. Competitiveness Rev. 2021; ahead-of-print. [Google Scholar] [CrossRef]
  131. Zhang, T.; Shaikh, Z.A.; Yumashev, A.V.; Chłąd, M. Applied model of E-learning in the framework of education for sustainable development. Sustainability 2020, 12, 6420. [Google Scholar] [CrossRef]
  132. Grand-Clement, S. Digital Learning: Education and Skills in the Digital Age; RAND Europe: Cambridge, UK, 2017. [Google Scholar]
  133. Fuentes, L.; Cookson, T.P. Counting gender (in) equality? a feminist geographical critique of the ‘gender data revolution’. Gend. Place Cult. 2020, 27, 881–902. [Google Scholar] [CrossRef]
  134. Rose Taylor, S. UN Women’s feminist engagement with governance by indicators in the Millennium and Sustainable Development Goals. Glob. Soc. Policy 2020, 20, 352–366. [Google Scholar] [CrossRef]
  135. UN Women. Gender Equality and Big Data: Making Gender Data Visible. 2018. Available online: https://www.unwomen.org/en/digital-library/publications/2018/1/gender-equality-and-big-data (accessed on 2 February 2022).
  136. Connell, A.; Holder, A.; Kearney, H. Equal Measures 2030: A new approach for advocacy and influencing beyond Beijing+ 25. Gend. Dev. 2020, 28, 405–423. [Google Scholar] [CrossRef]
  137. Garcia, D.; Kassa, Y.M.; Cuevas, A.; Cebrian, M.; Moro, E.; Rahwan, I.; Cuevas, R. Analyzing gender inequality through large-scale Facebook advertising data. Proc. Natl. Acad. Sci. USA 2018, 115, 6958–6963. [Google Scholar] [CrossRef] [Green Version]
  138. Ashta, A.; Herrmann, H. Artificial intelligence and fintech: An overview of opportunities and risks for banking, investments, and microfinance. Strateg. Chang. 2021, 30, 211–222. [Google Scholar] [CrossRef]
  139. Sun, T.; Gaut, A.; Tang, S.; Huang, Y.; ElSherief, M.; Zhao, J.; Mirza, D.; Belding, E.; Chang, K.; Wang, W.Y. Mitigating gender bias in natural language processing: Literature review. arXiv 2019, arXiv:1906.08976. [Google Scholar]
  140. Bolukbasi, T.; Chang, K.W.; Zou, J.Y.; Saligrama, V.; Kalai, A.T. Man is to computer programmer as woman is to homemaker? debiasing word embeddings. Adv. Neural Inf. Process. Syst. 2016, 29, 4349–4357. [Google Scholar]
  141. Hendricks, L.A.; Burns, K.; Saenko, K.; Darrell, T.; Rohrbach, A. Women also snowboard: Overcoming bias in captioning models. In Proceedings of the European Conference on Computer Vision (ECCV), Munich, Germany, 8–14 September 2018; pp. 771–787. [Google Scholar]
  142. Gonen, H.; Goldberg, Y. Lipstick on a pig: Debiasing methods cover up systematic gender biases in word embeddings but do not remove them. arXiv 2019, arXiv:1903.03862. [Google Scholar]
  143. Monni, S.; Iorio, M.; Realini, A. Water as freedom in the Brazilian Amazon. Entrep. Sustain. Issues 2018, 5, 812–826. [Google Scholar] [CrossRef] [Green Version]
  144. Moumen, Z.; El Idrissi, N.E.A.; Tvaronavičienė, M.; Lahrach, A. Water security and sustainable development. Insights Reg. Dev. 2019, 1, 301–317. [Google Scholar] [CrossRef]
  145. Gain, A.K.; Giupponi, C.; Wada, Y. Measuring global water security towards sustainable development goals. Environ. Res. Lett. 2016, 11, 124015. [Google Scholar] [CrossRef]
  146. Andres, L.; Boateng, K.; Borja-Vega, C.; Thomas, E. A review of in-situ and remote sensing technologies to monitor water and sanitation interventions. Water 2018, 10, 756. [Google Scholar] [CrossRef] [Green Version]
  147. Giupponi, C.; Gain, A.K. Integrated spatial assessment of the water, energy and food dimensions of the sustainable development goals. Reg. Environ. Chang. 2017, 17, 1881–1893. [Google Scholar] [CrossRef]
  148. Elhassnaoui, I.; Moumen, Z.; Tvaronavičienė, M.; Ouarani, M.; Ben-Daoud, M.; Serrari, I.; Lahmidi, I.; Wahba, M.A.S.; Bouziane, A.; Ouazar, D.; et al. Management of water scarcity in arid areas: A case study (Ziz Watershed). Insights Reg. Dev. 2021, 3, 80–103. [Google Scholar] [CrossRef]
  149. Patole, M. Localization of SDGs through disaggregation of KPIs. Economies 2018, 6, 15. [Google Scholar] [CrossRef] [Green Version]
  150. Requejo-Castro, D.; Giné-Garriga, R.; Pérez-Foguet, A. Data-driven Bayesian network modelling to explore the relationships between SDG 6 and the 2030 Agenda. Sci. Total Environ. 2020, 710, 136014. [Google Scholar] [CrossRef]
  151. Fehri, R.; Khlifi, S.; Vanclooster, M. Disaggregating SDG-6 water stress indicator at different spatial and temporal scales in Tunisia. Sci. Total Environ. 2019, 694, 133766. [Google Scholar] [CrossRef]
  152. Farinosi, F.; Giupponi, C.; Reynaud, A.; Ceccherini, G.; Carmona-Moreno, C.; De Roo, A.; Gonzalez-Sanchez, D.; Bidoglio, G. An innovative approach to the assessment of hydro-political risk: A spatially explicit, data driven indicator of hydro-political issues. Glob. Environ. Chang. 2018, 52, 286–313. [Google Scholar] [CrossRef]
  153. Amitrano, D.; Martino, G.D.; Iodice, A.; Mitidieri, F.; Papa, M.N.; Riccio, D.; Ruello, G. Sentinel-1 for monitoring reservoirs: A performance analysis. Remote Sens. 2014, 6, 10676–10693. [Google Scholar] [CrossRef] [Green Version]
  154. Liu, P.; Wang, J.; Sangaiah, A.K.; Xie, Y.; Yin, X. Analysis and prediction of water quality using LSTM deep neural networks in IoT environment. Sustainability 2019, 11, 2058. [Google Scholar] [CrossRef] [Green Version]
  155. Rahim, M.S.; Nguyen, K.A.; Stewart, R.A.; Giurco, D.; Blumenstein, M. Machine learning and data analytic techniques in digital water metering: A review. Water 2020, 12, 294. [Google Scholar] [CrossRef] [Green Version]
  156. Gue, I.H.V.; Ubando, A.T.; Tseng, M.L.; Tan, R.R. Artificial neural networks for sustainable development: A critical review. Clean Technol. Environ. Policy 2020, 22, 1449–1465. [Google Scholar] [CrossRef]
  157. Goralski, M.A.; Tan, T.K. Artificial intelligence and sustainable development. Int. J. Manag. Educ. 2020, 18, 100330. [Google Scholar] [CrossRef]
  158. Nriagu, J.O.; Bhattacharya, P.; Mukherjee, A.B.; Bundschuh, J.; Zevenhoven, R.; Loeppert, R.H. Arsenic in soil and groundwater: An overview. Trace Met. Contam. Environ. 2007, 9, 3–60. [Google Scholar] [CrossRef]
  159. Singh, S.K.; Shirzadi, A.; Pham, B.T. Application of artificial intelligence in predicting groundwater contaminants. In Water Pollution and Management Practices; Springer: Singapore, 2021; pp. 71–105. [Google Scholar] [CrossRef]
  160. Fernández, M.I.; López, J.F.; Vivaldi, B.; Coz, F. Long-term impact of arsenic in drinking water on bladder cancer health care and mortality rates 20 years after end of exposure. J. Urol. 2012, 187, 856–861. [Google Scholar] [CrossRef]
  161. Zhang, X.; Chen, N.; Sheng, H.; Ip, C.; Yang, L.; Chen, Y.; Sang, Z.; Tadesse, T.; Lim, T.P.Y.; Rajabifard, A.; et al. Urban drought challenge to 2030 sustainable development goals. Sci. Total Environ. 2019, 693, 133536. [Google Scholar] [CrossRef]
  162. Hassani, H.; Yeganegi, M.R.; Beneki, C.; Unger, S.; Moradghaffari, M. Big data and energy poverty alleviation. Big Data Cogn. Comput. 2019, 3, 50. [Google Scholar] [CrossRef] [Green Version]
  163. Mastrucci, A.; Byers, E.; Pachauri, S.; Rao, N.D. Improving the SDG energy poverty targets: Residential cooling needs in the Global South. Energy Build. 2019, 186, 405–415. [Google Scholar] [CrossRef]
  164. Ryan, M.; Antoniou, J.; Brooks, L.; Jiya, T.; Macnish, K.; Stahl, B. The ethical balance of using smart information systems for promoting the United Nations’ Sustainable Development Goals. Sustainability 2020, 12, 4826. [Google Scholar] [CrossRef]
  165. Lorenzoni, L.; Cherubini, P.; Fioriti, D.; Poli, D.; Micangeli, A.; Giglioli, R. Classification and modeling of load profiles of isolated mini-grids in developing countries: A data-driven approach. Energy Sustain. Dev. 2020, 59, 208–225. [Google Scholar] [CrossRef]
  166. Chui, K.T.; Lytras, M.D.; Visvizi, A. Energy sustainability in smart cities: Artificial intelligence, smart monitoring, and optimization of energy consumption. Energies 2018, 11, 2869. [Google Scholar] [CrossRef] [Green Version]
  167. Bibri, S.E.; Krogstie, J. Environmentally data-driven smart sustainable cities: Applied innovative solutions for energy efficiency, pollution reduction, and urban metabolism. Energy Inform. 2020, 3, 29. [Google Scholar] [CrossRef]
  168. Hassani, H.; Huang, X.; MacFeely, S.; Entezarian, M.R. Big Data and the United Nations Sustainable Development Goals (UN SDGs) at a Glance. Big Data Cogn. Comput. 2021, 5, 28. [Google Scholar] [CrossRef]
  169. Li, B.; Gao, S.; Liang, Y.; Kang, Y.; Prestby, T.; Gao, Y.; Xiao, R. Estimation of regional economic development indicator from transportation network analytics. Sci. Rep. 2020, 10, 2647. [Google Scholar] [CrossRef]
  170. Timmis, K.; De Lorenzo, V.; Verstraete, W.; Ramos, J.L.; Danchin, A.; Brüssow, H.; Singh, B.; Timmis, J.K. The contribution of microbial biotechnology to economic growth and employment creation. Microb. Biotechnol. 2017, 10, 1137–1144. [Google Scholar] [CrossRef]
  171. Truby, J. Governing artificial intelligence to benefit the UN sustainable development goals. Sustain. Dev. 2020, 28, 946–959. [Google Scholar] [CrossRef]
  172. Henrique, B.M.; Sobreiro, V.A.; Kimura, H. Literature review: Machine learning techniques applied to financial market prediction. Expert Syst. Appl. 2019, 124, 226–251. [Google Scholar] [CrossRef]
  173. Braganza, A.; Chen, W.; Canhoto, A.; Sap, S. Productive employment and decent work: The impact of AI adoption on psychological contracts, job engagement and employee trust. J. Bus. Res. 2021, 131, 485–494. [Google Scholar] [CrossRef]
  174. Faremo, G. Build resilient infrastructure, promote inclusive and sustainable industrialization and foster innovation. UN Chron. 2015, 51, 21–22. [Google Scholar] [CrossRef]
  175. Steen, J. Build Resilient Infrastructure, Promote Inclusive and Sustainable Industrialization and Foster Innovation. In Mining, Materials, and the Sustainable Development Goals (SDGs); CRC Press: Boca Raton, FL, USA, 2020; pp. 83–92. [Google Scholar]
  176. Denoncourt, J. Companies and UN 2030 sustainable development goal 9 industry, innovation and infrastructure. J. Corp. Law Stud. 2020, 20, 199–235. [Google Scholar] [CrossRef]
  177. Kynčlová, P.; Upadhyaya, S.; Nice, T. Composite index as a measure on achieving Sustainable Development Goal 9 (SDG-9) industry-related targets: The SDG-9 index. Appl. Energy 2020, 265, 114755. [Google Scholar] [CrossRef]
  178. Raut, R.D.; Mangla, S.K.; Narwane, V.S.; Gardas, B.B.; Priyadarshinee, P.; Narkhede, B.E. Linking big data analytics and operational sustainability practices for sustainable business management. J. Clean. Prod. 2019, 224, 10–24. [Google Scholar] [CrossRef]
  179. Ilie, C.M.; Brovelli, M.A.; Coetzee, S. Monitoring SDG 9 with global open data and open software–A case study from rural Tanzania. In Proceedings of the ISPRS Geospatial Week 2019, Enschede, The Netherlands, 7–12 July 2019; International Society for Photogrammetry and Remote Sensing: Christian Heipke, Germany, 2019; pp. 1551–1558. [Google Scholar]
  180. Malhotra, C.; Anand, R.; Singh, S. Applying big data analytics in governance to achieve sustainable development goals (SDGs) in India. In Data Science Landscape; Springer: Singapore, 2018; pp. 273–291. [Google Scholar]
  181. Bublienė, R.; Jurkevičius, V. Multiple discrimination and inequality: A comparative analysis of the European Courts case law in the context of sustainable business development. Entrep. Sustain. Issues 2019, 7, 1246–1257. [Google Scholar] [CrossRef]
  182. Lelo, K.; Monni, S.; Tomassi, F. Urban inequalities in Italy: A comparison between Rome, Milan and Naples. Entrep. Sustain. Issues 2018, 6, 939–957. [Google Scholar] [CrossRef]
  183. Apel, H. Inequality in development: The 2030 Agenda, SDG 10 and the role of redistribution. Real-World Econ. Rev. 2020, 92, 228–237. [Google Scholar]
  184. Fukuda-Parr, S. Keeping out extreme inequality from the SDG Agenda–the politics of indicators. Glob. Policy 2019, 10, 61–69. [Google Scholar] [CrossRef]
  185. Anderson, E. Equality as a global goal. Ethics Int. Aff. 2016, 30, 189–200. [Google Scholar] [CrossRef] [Green Version]
  186. Saiz, I.; Donald, K. Tackling inequality through the Sustainable Development Goals: Human rights in practice. Int. J. Hum. Rights 2017, 21, 1029–1049. [Google Scholar] [CrossRef]
  187. Kuhn, H. Reducing inequality within and among countries: Realizing SDG 10—A developmental perspective. In Sustainable Development Goals and Human Rights; Kaltenborn, M., Krajewski, M., Kuhn, H., Eds.; Interdisciplinary Studies in Human Rights; Springer: Cham, Switzerland, 2020; Volume 5, pp. 137–153. [Google Scholar] [CrossRef] [Green Version]
  188. Hossen, Z.; Khondker, B.H. How Is India Flaring in Achieving SDG 10 on Reduced Inequality? In Sustainable Development Goals; Hazra, S., Bhukta, A., Eds.; Springer: Cham, Switzerland, 2020; pp. 153–165. [Google Scholar] [CrossRef]
  189. Müller, V.C. Risks of Artificial Intelligence; Chapman & Hall, CRC Press: London, UK, 2016. [Google Scholar]
  190. Russell, C. SDG 11: Sustainable Cities And Communities From Backyards To Biolinks: Royal Botanic Gardens Victoria’s Role In Urban Greening. BGjournal 2018, 15, 31–33. [Google Scholar]
  191. Vaidya, H.; Chatterji, T. SDG 11 Sustainable Cities and Communities. In Actioning the Global Goals for Local Impact; Isabel, B., Franco, I.B., Chatterji, T., Derbyshire, E., Tracey, J., Eds.; Springer: Singapore, 2020; pp. 173–185. [Google Scholar] [CrossRef]
  192. Rozhenkova, V.; Allmang, S.; Ly, S.; Franken, D.; Heymann, J. The role of comparative city policy data in assessing progress toward the urban SDG targets. Cities 2019, 95, 102357. [Google Scholar] [CrossRef]
  193. Thomas, R.; Hsu, A.; Weinfurter, A. Sustainable and inclusive–Evaluating urban sustainability indicators’ suitability for measuring progress towards SDG-11. Environ. Plan. B Urban Anal. City Sci. 2020, 48, 2346–2362. [Google Scholar] [CrossRef]
  194. Schiavina, M.; Melchiorri, M.; Corbane, C.; Florczyk, A.J.; Freire, S.; Pesaresi, M.; Kemper, T. Multi-scale estimation of land use efficiency (SDG 11.3. 1) across 25 years using global open and free data. Sustainability 2019, 11, 5674. [Google Scholar] [CrossRef] [Green Version]
  195. Corbane, C.; Pesaresi, M.; Politis, P.; Syrris, V.; Florczyk, A.J.; Soille, P.; Maffenini, L.; Burger, A.; Vasilev, V.; Dario Rodriguez, D.; et al. Big earth data analytics on Sentinel-1 and Landsat imagery in support to global human settlements mapping. Big Earth Data 2017, 1, 118–144. [Google Scholar] [CrossRef] [Green Version]
  196. Tseng, M.L.; Zhu, Q.; Sarkis, J.; Chiu, A.S. Responsible consumption and production (RCP) in corporate decision-making models using soft computation. Ind. Manag. Data Syst. 2018, 118, 322–329. [Google Scholar] [CrossRef]
  197. Dubey, R.; Gunasekaran, A.; Childe, S.J.; Luo, Z.; Wamba, S.F.; Roubaud, D.; Foropon, C. Examining the role of big data and predictive analytics on collaborative performance in context to sustainable consumption and production behaviour. J. Clean. Prod. 2018, 196, 1508–1521. [Google Scholar] [CrossRef]
  198. Gunawan, J.; Permatasari, P.; Tilt, C. Sustainable development goal disclosures: Do they support responsible consumption and production? J. Clean. Prod. 2020, 246, 118989. [Google Scholar] [CrossRef]
  199. Gasper, D.; Shah, A.; Tankha, S. The framing of sustainable consumption and production in SDG 12. Glob. Policy 2019, 10, 83–95. [Google Scholar] [CrossRef]
  200. Carlsen, L. Responsible consumption and production in the European Union. A partial order analysis of Eurostat SDG 12 data. Green Finance 2021, 3, 28–45. [Google Scholar] [CrossRef]
  201. Hermann, E. Artificial intelligence in marketing: Friend or foe of sustainable consumption? AI Soc. 2021, 1–2. [Google Scholar] [CrossRef]
  202. Amazon. 2020. Available online: https://sustainability.aboutamazon.com/environment/sustainable-operations/carbon-footprint (accessed on 2 February 2022).
  203. Beier, G.; Kiefer, J.; Knopf, J. Potentials of big data for corporate environmental management: A case study from the German automotive industry. J. Ind. Ecol. 2022, 6, 336–349. [Google Scholar] [CrossRef]
  204. Wang, L.; Ma, L.; Wu, K.J.; Chiu, A.S.; Nathaphan, S. Applying fuzzy interpretive structural modeling to evaluate responsible consumption and production under uncertainty. Ind. Manag. Data Syst. 2018, 118, 432–462. [Google Scholar] [CrossRef]
  205. Poolman, E.; Rautenbach, H.; Vogel, C. Application of probabilistic precipitation forecasts from a deterministic model towards increasing the lead-time of flash flood forecasts in South Africa. Water SA 2014, 40, 729–738. [Google Scholar] [CrossRef] [Green Version]
  206. Weyn, J.A.; Durran, D.R.; Caruana, R. Improving data-driven global weather prediction using deep convolutional neural networks on a cubed sphere. J. Adv. Model. Earth Syst. 2020, 12, e2020MS002109. [Google Scholar] [CrossRef]
  207. Warren, C.M. The role of public sector asset managers in responding to climate change: Disaster and business continuity planning. Prop. Manag. 2010, 28, 245–256. [Google Scholar] [CrossRef]
  208. Saulnier, D.D.; Green, H.K.; Ismail, R.; Chhorvann, C.; Mohamed, N.B.; Waite, T.D.; Murray, V. Disaster risk reduction: Why do we need accurate disaster mortality data to strengthen policy and practice? Disaster Prev. Manag. 2019, 28, 846–861. [Google Scholar] [CrossRef]
  209. Roy, J.; Some, S.; Das, N.; Pathak, M. Demand side climate change mitigation actions and SDGs: Literature review with systematic evidence search. Environ. Res. Lett. 2021, 16, 43003. [Google Scholar] [CrossRef]
  210. Mao, Z.; Xue, X.; Tian, H.; Michael, A.U. How will China realize SDG 14 by 2030?—A case study of an institutional approach to achieve proper control of coastal water pollution. J. Environ. Manag. 2019, 230, 53–62. [Google Scholar] [CrossRef] [PubMed]
  211. Del Río Castro, G.; González Fernández, M.C.; Uruburu Colsa, Á. Unleashing the convergence amid digitalization and sustainability towards pursuing the Sustainable Development Goals (SDGs). A holistic review. J. Clean. Prod. 2021, 280, 122204. [Google Scholar] [CrossRef]
  212. Sarkis, J.; Kouhizadeh, M.; Zhu, Q.S. Digitalization and the greening of supply chains. Ind. Manag. Data Syst. 2020, 121, 65–85. [Google Scholar] [CrossRef]
  213. Vollen, A.; Haddara, M. IoT Aboard Coastal Vessels: A Case Study in the Fishing Industry. In Proceedings of the International Conference on Mobile Web and Intelligent Information Systems, Istanbul, Turkey, 26–28 August 2019; Springer: Cham, Switzerland, 2019; pp. 163–177. [Google Scholar] [CrossRef]
  214. Kroeker, K.J.; Kordas, R.L.; Crim, R.; Hendriks, I.E.; Ramajo, L.; Singh, G.S.; Duarte, C.M.; Gattuso, J. Impacts of ocean acidification on marine organisms: Quantifying sensitivities and interaction with warming. Glob. Chang. Biol. 2013, 19, 1884–1896. [Google Scholar] [CrossRef] [Green Version]
  215. Wang, J.; Zhang, J. Big data analytics for forecasting cycle time in semiconductor wafer fabrication system. Int. J. Prod. Res. 2016, 54, 7231–7244. [Google Scholar] [CrossRef]
  216. Oztekin, A.; Kizilaslan, R.; Freund, S.; Iseri, A. A data analytic approach to forecasting daily stock returns in an emerging market. Eur. J. Oper. Res. 2016, 253, 697–710. [Google Scholar] [CrossRef]
  217. Sit, M.; Langel, R.J.; Thompson, D.; Cwiertny, D.M.; Demir, I. Web-based data analytics framework for well forecasting and groundwater quality. Sci. Total Environ. 2021, 761, 144121. [Google Scholar] [CrossRef]
  218. Carnerud, D.; Mårtensson, A.; Ahlin, K.; Slumpi, T.P. On the inclusion of sustainability and digitalisation in quality management–an overview from past to present. Total Qual. Manag. Bus. Excell. 2020, 1–23. [Google Scholar] [CrossRef]
  219. Antonescu, N.; Stanescu, D.P. Carbon Dioxide Footprint Reduction by Retrofitting Regional Heating Boilers from Gaseous to Biogenic Fuels; IOP Conference Series: Earth and Environmental Science; IOP Publishing: Bristol, UK, 2021; Volume 664, p. 012005. [Google Scholar] [CrossRef]
  220. Perpiñá, C.; Alfonso, D.; Pérez-Navarro, A.; Peñalvo, E.; Vargas, C.; Cárdenas, R. Methodology based on Geographic Information Systems for biomass logistics and transport optimisation. Renew. Energy 2009, 34, 555–565. [Google Scholar] [CrossRef]
  221. Petersen, H.L.; Madsen, O.B. The double travelling salesman problem with multiple stacks–formulation and heuristic solution approaches. Eur. J. Oper. Res. 2009, 198, 139–147. [Google Scholar] [CrossRef]
  222. Gejdoš, M.; Gergeľ, T.; Jeřábek, K.; Hřebíček, Z. Optimization of transport logistics for forest biomass. Naše More 2018, 65, 246–249. [Google Scholar] [CrossRef]
  223. Van der Velden, M. Digitalisation and the UN Sustainable Development Goals: What role for design. Interact. Des. Archit. 2018, 37, 160–174. [Google Scholar]
  224. Hassani, H.; Huang, X.; Silva, E.S.; Ghodsi, M. A review of data mining applications in crime. Stat. Anal. Data Min. ASA Data Sci. J. 2016, 9, 139–154. [Google Scholar] [CrossRef]
  225. Završnik, A. Algorithmic justice: Algorithms and big data in criminal justice settings. Eur. J. Criminol. 2021, 18, 623–642. [Google Scholar] [CrossRef] [Green Version]
  226. Simmons, R. Big data, machine judges, and the legitimacy of the criminal justice system. UC Davis Law Rev. 2018, 52, 1067. [Google Scholar] [CrossRef]
  227. Laberge, M.; Touihri, N. Can SDG 16 Data Drive National Accountability? A Cautiously Optimistic View. Glob. Policy 2019, 10, 153–156. [Google Scholar] [CrossRef]
  228. Bull, B.; McNeill, D. From market multilateralism to governance by goal setting: SDGs and the changing role of partnerships in a new global order. Bus. Polit. 2019, 21, 464–486. [Google Scholar] [CrossRef] [Green Version]
  229. Castle, D.; Hebert, P.D.; Clare, E.L.; Hogg, I.D.; Tremblay, C. Capturing the value of biosurveillance “big data” through natural capital accounting. Big Earth Data 2021, 5, 352–367. [Google Scholar] [CrossRef]
  230. Naz, M.; Al-zahrani, F.A.; Khalid, R.; Javaid, N.; Qamar, A.M.; Afzal, M.K.; Shafiq, M. A secure data sharing platform using blockchain and interplanetary file system. Sustainability 2019, 11, 7054. [Google Scholar] [CrossRef] [Green Version]
  231. Azar, P.D.; Goldwasser, S.; Park, S. How to incentivize data-driven collaboration among competing parties. In Proceedings of the 2016 ACM Conference on Innovations in Theoretical Computer Science, Cambridge, MA, USA, 14–16 January 2016; pp. 213–225. [Google Scholar] [CrossRef] [Green Version]
  232. Adams, R.; Kewell, B.; Parry, G. Blockchain for good? Digital ledger technology and sustainable development goals. In Handbook of Sustainability and Social Science Research; Leal Filho, W., Marans, R., Callewaert, J., Eds.; World Sustainability Series; Springer: Cham, Switzerland, 2018; pp. 127–140. [Google Scholar] [CrossRef]
  233. Tvaronavičienė, M.; Plėta, T.; Della Casa, S.; Latvys, J. Cyber security management of critical energy infrastructure in national cybersecurity strategies: Cases of USA, UK, France, Estonia and Lithuania. Insights Reg. Dev. 2020, 2, 802–813. [Google Scholar] [CrossRef]
  234. Limba, T.; Plėta, T.; Agafonov, K.; Damkus, M. Cyber security management model for critical infrastructure. Entrep. Sustain. Issues 2017, 4, 559–573. [Google Scholar] [CrossRef] [Green Version]
  235. Leszczynski, A.; Zook, M. Viral data. Big Data Soc. 2020, 7, 2053951720971009. [Google Scholar] [CrossRef]
  236. Barocas, S.; Selbst, A.D. Big data’s disparate impact. Calif. Law Rev. 2016, 104, 671. [Google Scholar] [CrossRef]
  237. Corbett-Davies, S.; Goel, S. The measure and mismeasure of fairness: A critical review of fair machine learning. arXiv 2018, arXiv:1808.00023. [Google Scholar]
  238. Holzinger, A.; Malle, B.; Saranti, A.; Pfeifer, B. Towards multi-modal causability with Graph Neural Networks enabling information fusion for explainable AI. Inf. Fusion 2021, 71, 28–37. [Google Scholar] [CrossRef]
  239. Chou, Y.L.; Moreira, C.; Bruza, P.; Ouyang, C.; Jorge, J. Counterfactuals and causability in explainable artificial intelligence: Theory, algorithms, and applications. Inf. Fusion 2022, 81, 59–83. [Google Scholar] [CrossRef]
  240. Holzinger, A.; Carrington, A.; Müller, H. Measuring the Quality of Explanations: The System Causability Scale (SCS). Künstl. Intell. 2020, 34, 193–198. [Google Scholar] [CrossRef] [Green Version]
  241. Holzinger, A.; Langs, G.; Denk, H.; Zatloukal, K.; Müller, H. Causability and explainability of artificial intelligence in medicine. Wiley Interdiscip. Rev. Data Min. 2019, 9, e1312. [Google Scholar] [CrossRef] [Green Version]
  242. Nilsson, M.; Chisholm, E.; Griggs, D.; Howden-Chapman, P.; McCollum, D.; Messerli, P.; Neumann, B.; Stevance, A.-S.; Visbeck, M.; Stafford-Smith, M. Mapping interactions between the sustainable development goals: Lessons learned and ways forward. Sustain. Sci. 2018, 13, 1489–1503. [Google Scholar] [CrossRef] [Green Version]
  243. Naudé, W.; Vinuesa, R. Data deprivations, data gaps and digital divides: Lessons from the COVID-19 pandemic. Big Data Soc. 2021, 8, 20539517211025545. [Google Scholar] [CrossRef]
  244. De Laat, P.B. Algorithmic decision-making based on machine learning from Big Data: Can transparency restore accountability? Philos. Technol. 2018, 31, 525–541. [Google Scholar] [CrossRef] [Green Version]
  245. Kearns, M. Fair algorithms for machine learning. In Proceedings of the 2017 ACM Conference on Economics and Computation, Cambridge, MA, USA, 26–30 June 2017. [Google Scholar] [CrossRef]
  246. Montes, G.A.; Goertzel, B. Distributed, decentralized, and democratized artificial intelligence. Technol. Forecast. Soc. Chang. 2019, 141, 354–358. [Google Scholar] [CrossRef]
  247. Tripathi, S.; Muhr, D.; Brunner, M.; Jodlbauer, H.; Dehmer, M.; Emmert-Streib, F. Ensuring the Robustness and Reliability of Data-Driven Knowledge Discovery Models in Production and Manufacturing. Front. Artif. Intell. 2021, 4, 22. [Google Scholar] [CrossRef]
  248. Wang, X.; Li, J.; Kuang, X.; Tan, Y.A.; Li, J. The security of machine learning in an adversarial setting: A survey. J. Parallel Distrib. Comput. 2019, 130, 12–23. [Google Scholar] [CrossRef]
  249. Van Roy, V.; Rossetti, F.; Perset, K.; Galindo-Romero, L. AI Watch—National Strategies on Artificial Intelligence: A European Perspective; EUR 30745 EN; Publications Office of the European Union: Luxembourg, 2021. [Google Scholar] [CrossRef]
  250. Fonseca, L.M.; Domingues, J.P.; Dima, A.M. Mapping the sustainable development goals relationships. Sustainability 2020, 12, 3359. [Google Scholar] [CrossRef] [Green Version]
  251. Kroll, C.; Warchold, A.; Pradhan, P. Sustainable Development Goals (SDGs): Are we successful in turning trade-offs into synergies? Palgrave Commun. 2019, 5, 140. [Google Scholar] [CrossRef] [Green Version]
  252. Pradhan, P.; Costa, L.; Rybski, D.; Lucht, W.; Kropp, J.P. A systematic study of sustainable development goal (SDG) interactions. Earth’s Future 2017, 5, 1169–1179. [Google Scholar] [CrossRef] [Green Version]
Figure 1. Overview of fields of usage, positive effects, challenges, and recommendations.
Sustainability 14 02497 g001
Publisher’s Note: MDPI stays neutral with regard to jurisdictional claims in published maps and institutional affiliations.

