Article

Adaptation Strategies to a Changing Resource Base: Case of the Gillnet Nile Perch Fishery on Lake Victoria in Uganda

by
Veronica Mpomwenda
1,2,3,*,
Tumi Tómasson
4,
Jón Geir Pétursson
2,
Anthony Taabu-Munyaho
5,
Herbert Nakiyende
1 and
Daði Mar Kristófersson
3
1
National Fisheries Resources Research Institute, Jinja 380052, Uganda
2
Environment and Natural Resources Program, School of Engineering and Natural Sciences, University of Iceland, 102 Reykjavik, Iceland
3
Faculty of Economics, School of Social Sciences, University of Iceland, 102 Reykjavik, Iceland
4
UNESCO-GRO Fisheries Training Programme, 220 Hafnarfjordur, Iceland
5
Lake Victoria Fisheries Organisation, Jinja 380052, Uganda
*
Author to whom correspondence should be addressed.
Sustainability 2022, 14(4), 2376; https://doi.org/10.3390/su14042376
Submission received: 15 November 2021 / Revised: 17 January 2022 / Accepted: 6 February 2022 / Published: 18 February 2022

Abstract

:
Sustainable management of fisheries has proven to be a daunting exercise for Lake Victoria. Exploitation patterns in the fishery are driven by fishers who adopt different strategies as a response to changing economic, management, socio-economic, and resource conditions. Fisheries managers, however, seldom consider these changes in management policies. The aim of the study, therefore, was to evaluate the adaptation strategies of the Nile perch gillnet fishers on Lake Victoria in Uganda using 8-year catch and effort data collected in the period from 2005 to 2015. Trends of the selected effort and catch variables in the study period identified two adaptive fishing strategies by gillnet fishers on the lake. The first group, the paddled fishermen whose gillnet use varied in the first half of the study, diverted to harvesting juvenile Nile perch by using smaller, mesh sizes, monofilament nets and gillnets of less depth in the second half of the study. Motorized fishers, on the other hand, maintained their mesh size, using multifilament gillnets, however, they increased the depth of their nets in the second half of the study period to maintain their targeted fish size. Fishers on Lake Victoria adapted strategies to cope with their constraints and opportunities based on the Nile perch population structure and their economic needs. It is important for fishery managers to consider that the fishers are an integral part of the fisheries ecosystems, and considering their behavior in management decisions will aid in devising adaptive policies for sustainable resource use and sustainable livelihood development of the fishers’ communities.

1. Introduction

1.1. Background

Sustainable management of fisheries has proven to be a daunting exercise for most African inland water fisheries which are largely small-scale (SSF), employing about 12% of world fishers and also playing a crucial role as a source of livelihoods, food security, and income for millions of people and national economies [1]. SSF fisheries are characterized by multiple harvesting patterns, being open access or common property resources with a growing population dependent on them, makes them complex and difficult to manage [2,3,4,5]. SSF are vulnerable to overexploitation, and they face environmental degradation as well as poor management outcomes [6,7].
To enable sustainable management of SSF, international legal and policy frameworks (e.g., FAOs code of conduct, voluntary guidelines for small scale fisheries, and Sustainable Development Goal (SDG) 14b) encourage the Ecosystem Approach to Fisheries (EAF) as a guiding principle to management. The EAF approach denotes the need for fisheries management as a holistic linkage across human and natural systems, identifying conflicts between competing ecosystem services and the direct and indirect impacts of fishing activities. The approach considers that the health of the aquatic ecosystem and associated biodiversity are a fundamental basis for fisher community livelihoods, recognizing the contribution of SSF to global food security and nutrition, equitable development of fishing communities and poverty eradication [8,9,10]. However, the international legal and policy frameworks do not guarantee any requirement for the SSF to adopt the approach unless this is specifically mandated in the individual country’s legal and policy frameworks.
Fishing is a highly uncertain activity and managers in SSF are still faced with the challenge of managing the dynamic and unpredictable interdependance between resource users and the fisheries resource. Understanding the interactions between the fishers and the fisheries resource can provide insights to enable holistic and sustainable fisheries management of SSF. Fishers are able to re-organize and develop strategies to adapt to resource changes, opportunities, and even address uncertainity associated with fishing activities [11,12,13]. Fishery managers, on the other hand, have focused on understanding biological fishery processes, neglecting fisher responses to changes in resource availability, market conditions, and also management regulations [12,13,14]. Managers therefore need to identify and understand the dynamics of fisher strategies, based on the contraints, goals and opportunities, to generate relevant information necessary to design sustainable fisheries management frameworks.
It is a common assumption that data or information on inland SSF are limited, and if they are available then they are considered to be highly unreliable in guiding authorities towards sustainable decision making in fisheries management [7,15,16,17]. However, a complete lack of data is not always the case for African inland fisheries. Lake Victoria accounts for more than 1% of global capture fisheries and the lake and its fisheries have been studied widely [18,19]. Substantial support has been provided for data collection, analysis, and governance structures. It is, however, still open to debate as to whether the acquired knowledge and information has led to the intended improvements in the fishery. Recurring challenges on the lake, such as perceived reduced catches, use of illegal gear and governance issues, have been reported in some studies [4,19]. Notwithstanding some inconsistencies in the data, the available information can be used to assess fishery management issues, such as the effectiveness of regulations and to explore different fisher strategies and their influence on fisheries production.
The aim of the paper was to evaluate the adaptative strategies of the Nile perch gillnet fishers and operators using 8-year catch and effort data collected in the period 2005 to 2015. The specific objectives of the study included determining the dynamics of gillnet use by vessel groups, identifying fishing strategies and evaluating the effects on the sustainability of the Nile perch fishery on Lake Victoria in Uganda.
Firstly, we looked at the trends in vessel characteristics in the Nile perch fishery based on mode of propulsion, i.e., paddled or motorized vessels. Secondly, fishing strategies were defined to include how the use of gillnets has changed over time in terms of mesh size, set up of the gillnet (adjusting depth), type of material, i.e., monofilament versus multifilament nets, and how changes in gillnet use affected the size and quantity of the Nile perch catch. The resultant adaptive strategies of fishers in the eight-year period were then used to reflect on the policy and livelihood implications of gillnet use in fishing Nile perch on the lake.
In the following sub-section, the paper illustrates the general context of the status of fisheries and a description of gillnet use on Lake Victoria in Uganda. Section 2 describes the data used for the study, the data attributes selected for analysis, and the method used for data analysis. Section 3 presents the study results, Section 4 presents the discussion, and finally the study’s conclusions are presented in Section 5.

1.2. Overview of the Lake Victoria Fisheries in Uganda

1.2.1. Background

In Uganda, Lake Victoria lies in the nation’s north-western quadrant, covering 31,000 km2 and a shoreline length of 1750 km. In 2014, the fisheries on the lake contributed more than half (54%) of the 467,000 MT of landings in Uganda. There were about 65,000 fishers, 16,745 boat owners (12% female), and many others involved in fisheries on the lake through trading, processing, transportation, and provision of fishing inputs and regulation [20]. Fishing vessels are locally made and operated using paddles (17,164), outboard engines (10,057), or sails (856). In addition, 162 fishers do not rely on vessels for their operation. Three species dominate commercial catches, including the small pelagic silver cyprinid, locally known as dagaa, Rastrineobola argentea (Pellegrin, 1904), Nile perch (Lates niloticus; Linnaeus, 1758), and Nile tilapia (Oreochromis niloticus; Linnaeus, 1758), all of which serve different markets. Nile perch is processed as chilled and frozen products to Europe, the Far East, the Middle East, the USA, and South America, while Nile tilapia is mainly consumed locally, either fresh or sundried. Dagaa is sundried and utilized as human food and in industrial feed mills as a raw material for production of feeds for poultry, fish, and livestock. The species is consumed locally and also exported regionally to the Democratic Republic of Congo, Kenya, South Sudan, and Rwanda [21,22,23]. Processing fish for local consumption is largely artisanal involving women mostly [24,25,26].
The number of fishing vessels targeting each species reflects their economic importance. Out of 28,239 vessels enumerated in 2014, 54% targeted Nile perch, 27% Nile tilapia, 16% dagaa, and 3% other species [20]. Consequently, most management measures on fishing are enforced on the lake mainly to protect the Nile perch, such as a ban on indiscriminate fishing gears and methods such as cast nets, beach seines, poison, <5 inch gillnets, and >9 hook size. Other regulations include licensing, closed seasons, and areas; however, these are seldom enforced [27].
Fisheries management on Lake Victoria has undergone institutional changes. In Uganda, the co-management system was disrupted when the local level Beach Management Units (BMUs) were abolished in November 2015 and replaced by military law enforcement. This was after a reportedly rampant increase in the use of illegal gears on the lake and the failure of BMUs in eliminating illegal fishing [27,28,29]. Military enforcement on the lake includes eliminating indiscrimanate fishing gears, vessels <28 ft and seine nets > eight panels for the dagaa fisheries. Natural resource management in the country, including in the fisheries, is reportedly structured to favour market values and revenue generation than social values. Therefore the need to protect Nile perch could explain the disbandment of the BMU system in Uganda [28,30,31]. The policy framework in the country relies on the Fish Act cap 197 of 2000 and its amendment in 2011, the Fisheries policy of 2004, and currently the fisheries and aquaculture bill of 2017, which will provide management measures in both capture fisheries and aquaculture.

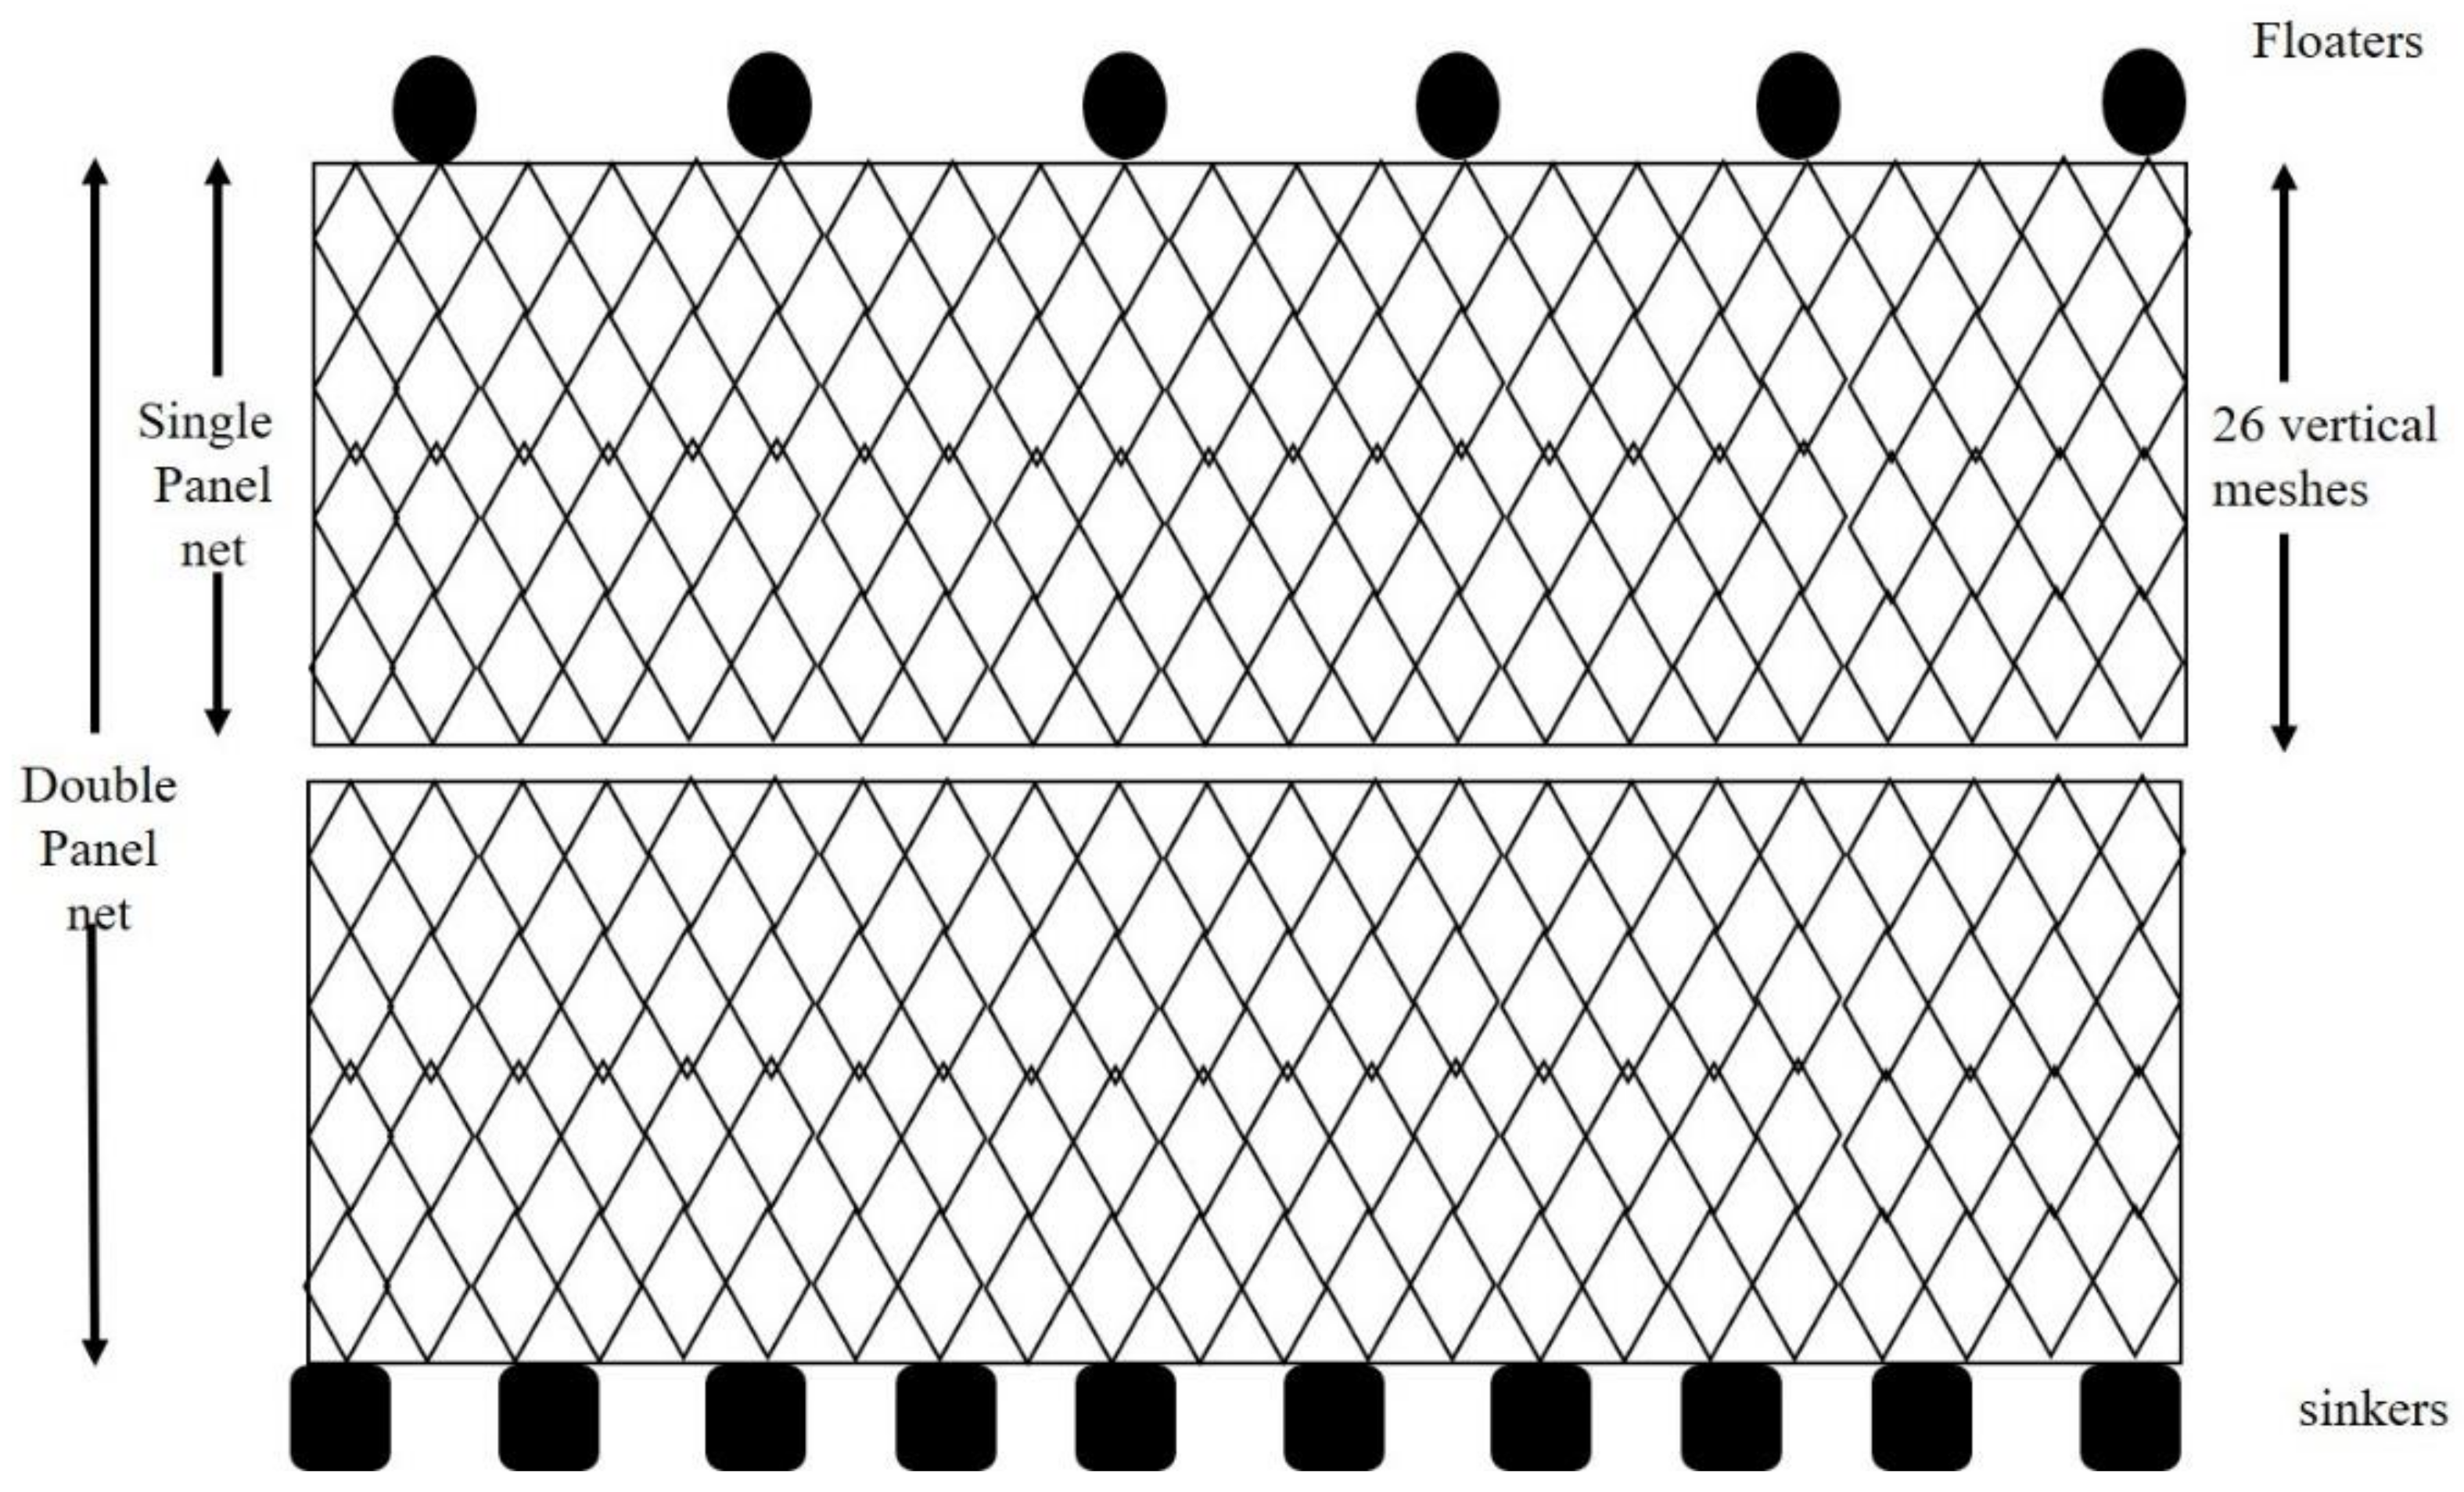
1.2.2. Gillnets on the Lake

Gillnets were introduced into Lake Victoria fisheries over a century ago due to their catch efficiency, replacing native fishing gears in exploiting the endemic tilapia species Oreochromis esculentus [32], which at the time was the most important commercially exploited fish species. However, with increased effort, catches soon declined. Surveys on the major fishing grounds showed a decline from 25 fish per net in 1925 to 5 fish in the late 1930s, which led to the introduction of a minimum mesh size of 5 inches for the fishery [33]. Nile perch was introduced into Lake Victoria in the 1960s, and the 5-inch minimum mesh size regulation was maintained for the developing Nile perch fishery [34] However, the circumstances for adopting the same regulation for the Nile perch were unclear, especially once the native tilapia stocks collapsed [35,36]. In the 1990s, a slot size of 50–<85 cm TL was introduced for commercial catches, aimed at protecting the juvenile and spawning stock of the Nile perch [32,34]. About half of the fishing vessels on the lake in Uganda target Nile perch, primarily using longlines and gillnets. In 2014, gillnets were the dominant fishing gear used by 40% of the fishing vessels, followed by hooks (32%), seine nets (21%), and 7% of vessels used other gear such as basket traps [20]. Boat ownership on the lake varies between species, with large boat owners mainly venturing more into fishing Nile perch than other commercial species. Boat owners in the perch business supply mainly to factories and employ their fishing crew mainly through kinship. Boat owners have a background in fishing or fish trading, and in cases where they own several vessels, they employ a boat manager and crew to fish on their behalf [37,38,39].

1.2.3. Description of Gillnet Use on the Lake Victoria

A gillnet on Lake Victoria consists of a series of panels, each being about 50 m long depending on the hanging ratio and 26 meshes deep. Panels can be joined, both horizontally to increase the length of the gillnet or vertically to increase the depth [height] of the net [20,40].
A net of one panel deep is recorded as a single panel net. As panels are joined vertically, the nets are recorded as double, triple, and so forth (Figure 1). The overall set is then a gillnet that is either bottom set or set at a certain depth in the water column using anchors like rocks, which must be sufficiently heavy to neutralize the buoyancy of the floats.
Fishers operate their gillnets in three main ways: firstly, through active fishing, where fishers, by beating the water using a heavy hardwood club, scare fish into the net and several hauls are made at different sites in one night. The second method is passive fishing, whereby a gillnet is set at the bottom of the lake, anchored at one site overnight, and the third method is drift fishing, where the net is set either in-surface or mid-waters and allowed to drift with the current throughout the fishing period. Active fishing is illegal and fishers using active fishing are reported to operate in the shallow inshore waters using monofilament nets <5″, which are also illegal [40,41,43]. Drift and set (passive) nets are mainly multifilament. Fishers using these two methods have also been known to connect nets vertically, enabling them to fish up to 50 m deep from the surface to the bottom. Multiple panel nets are mainly used on vessels equipped with outboard engines or sails, which are able to navigate in the coastal and deeper offshore parts of the lake [40,41].

2. Materials and Methods

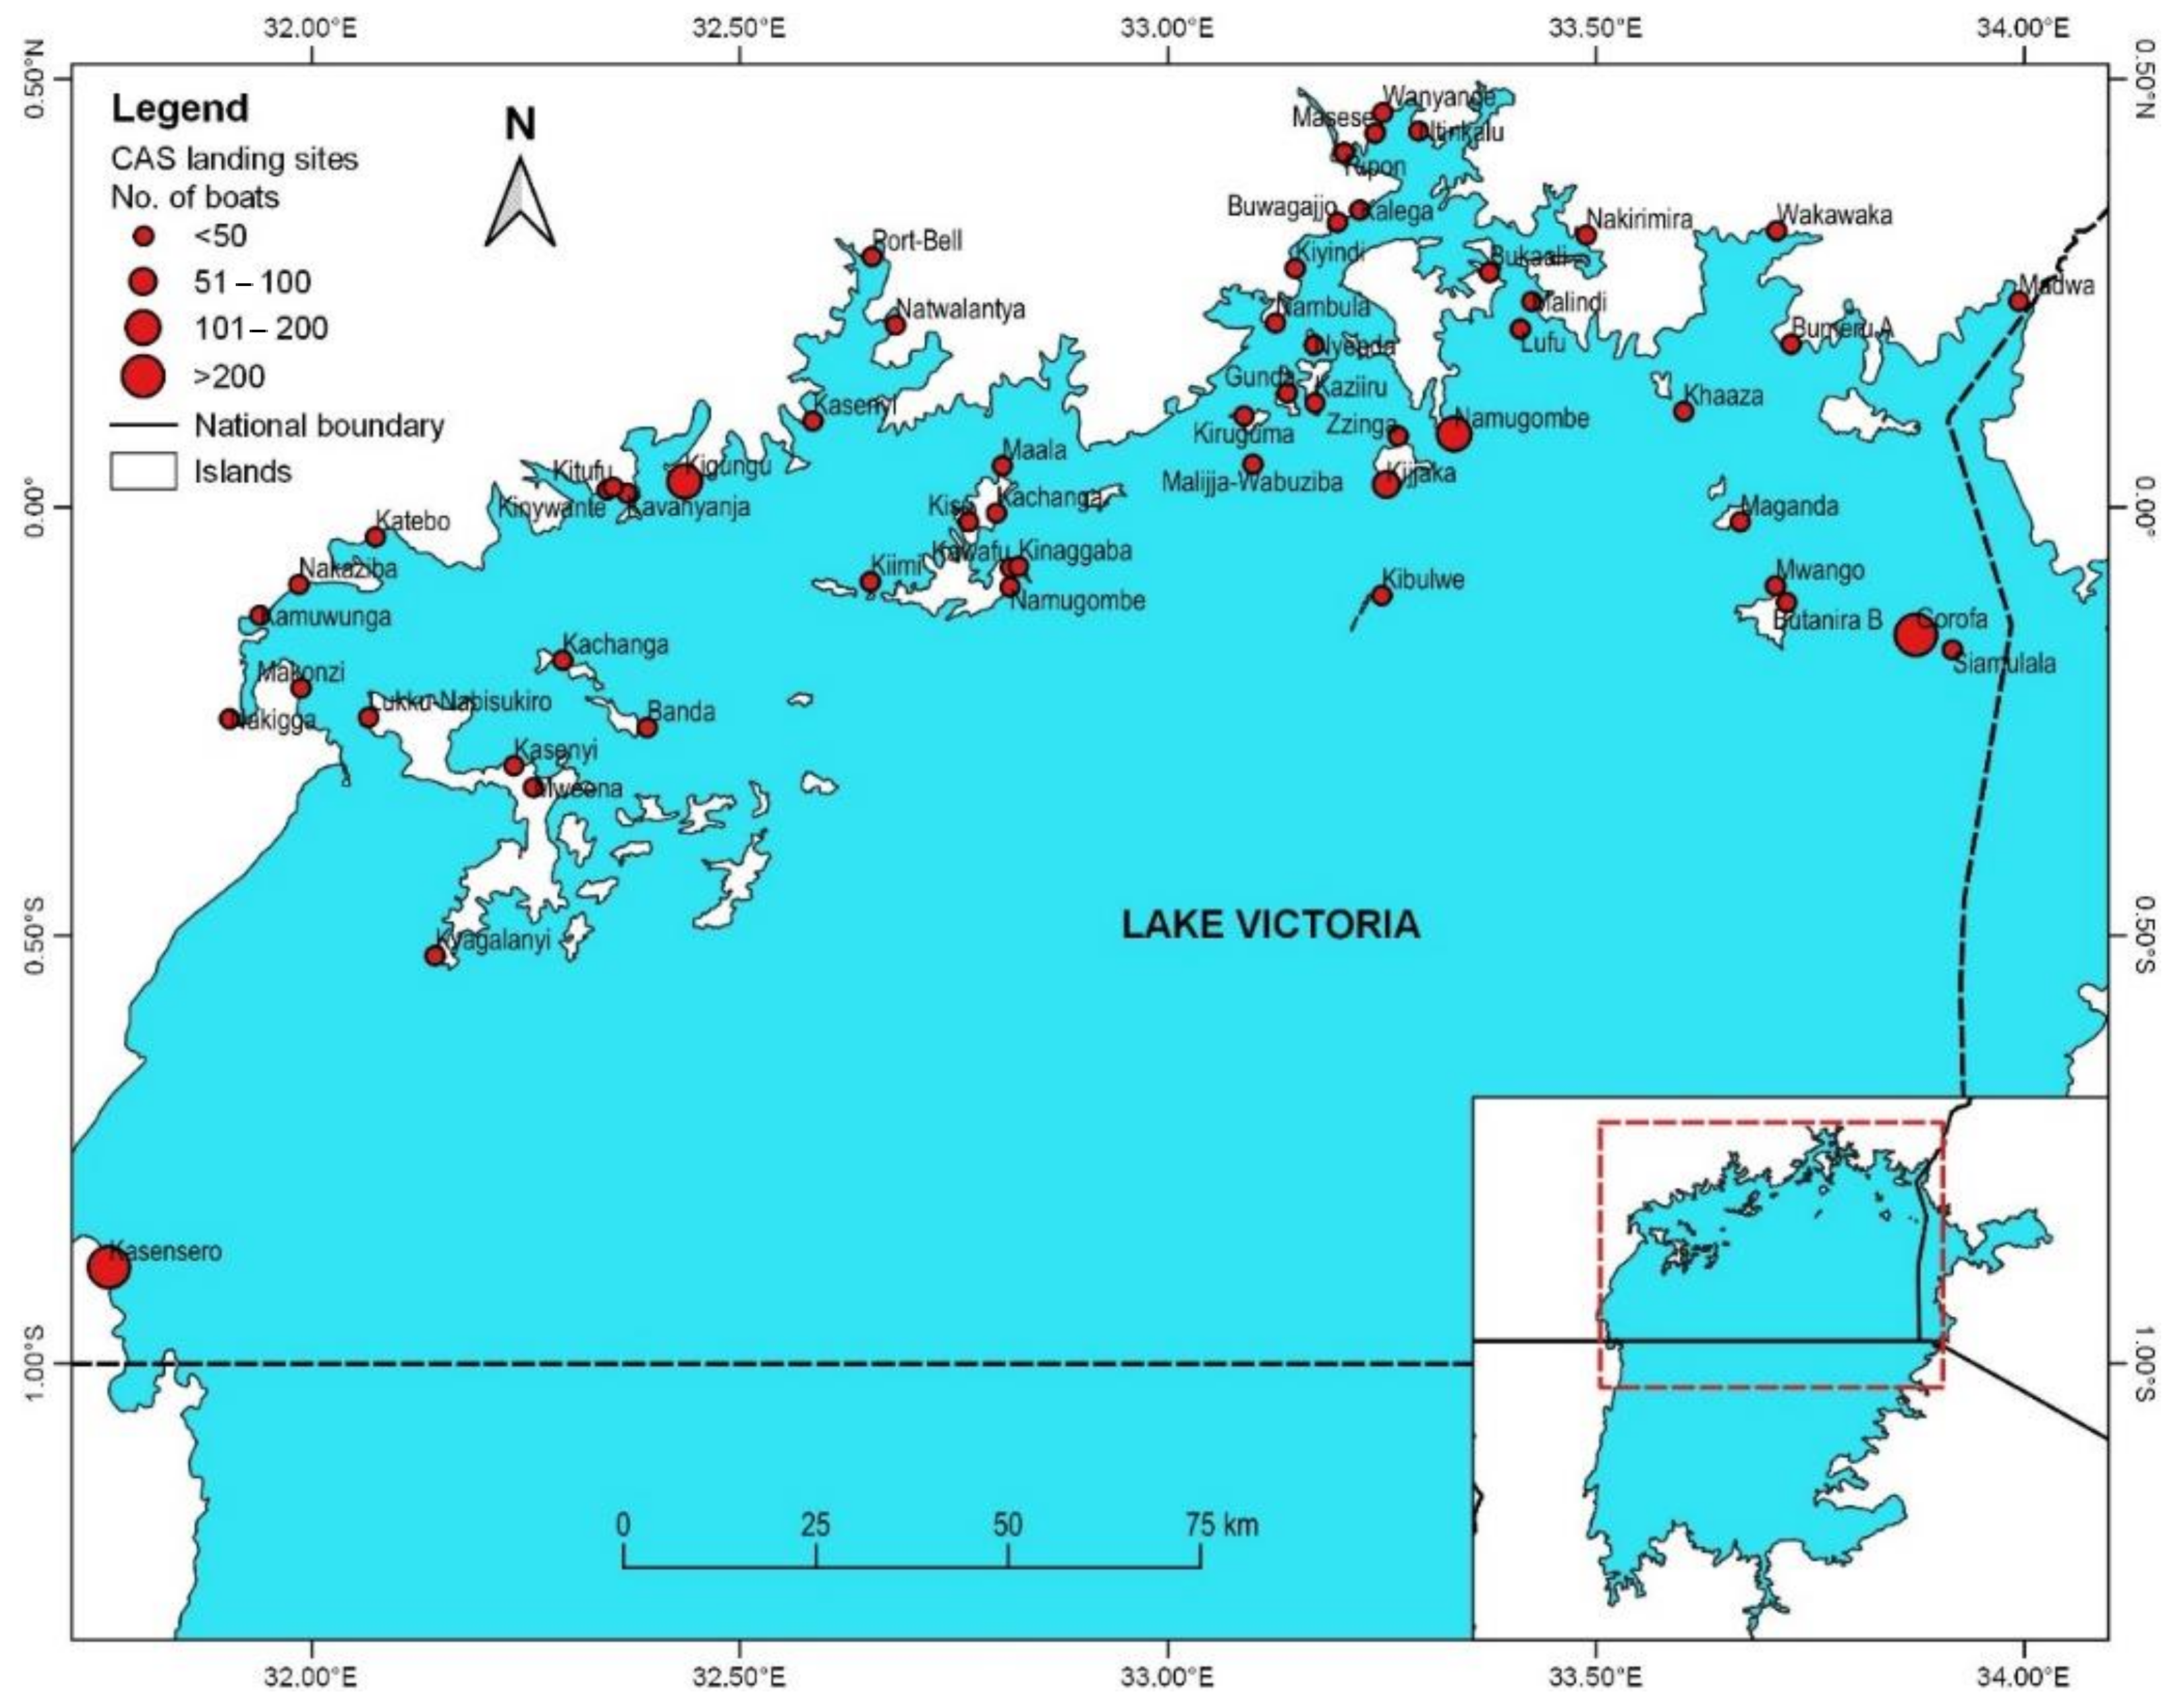
2.1. Data Collection

Data for the study were selected for vessels using gillnets at 54 landing sites (Figure 2). The Lake Victoria Fisheries Organisation (LVFO) monitors catch rates through periodic frame surveys when a census is made of the number of fishers, and the number, size, and propulsion mode of vessels and gear used. These surveys are termed frame surveys, which are then complemented with catch assessment surveys, where catch data from a sample of individual vessels are collected throughout the year at representative landing sites.
In this study, data were sourced from six frame surveys conducted every second year from 2004 to 2014. Catch assessment surveys were conducted at 54 landing sites in eight years, 2005–2008, 2010–2011, and 2014–2015. Both datasets were collected by trained enumerators and based on the Lake Victoria Fisheries Organisation (LVFO) harmonized Standard Operating Procedures and data forms [44].
From the frame survey, we selected two key vessel variables: mode of propulsion (paddled, motorized, or sailed) and target species. From the catch assessment survey, we selected gillnet vessels targeting Nile perch and data relating to effort and catch. These included the following:
(i)
vessel-specific characteristics, such as vessel length and mode of propulsion;
(ii)
gear specific information i.e., gillnet type [monofilament or multifilament], mode of operation [active, drift or stationary], mesh size, number of panels, and if panels were vertically joined;
(iii)
hours fished and catch specific information, such as the number of Nile perch caught and the total weight of the catch.
From the resulting set of data, we selected trips that operated with gillnets of only one mesh size (e.g, only 6 or 7 inches). This was done to eliminate any bias due to the uncertainty of identifying which mesh was used to capture fish at the time of sampling. Outliers and missing information rows were removed from the dataset. The final dataset comprised 14,630 trip records for eight years in the period 2005 to 2015.

2.2. Data Analysis

To analyse the data, we employed the trend analysis recommended in [45], and applied to compare catches between the recreational and commercial fishermen on Lake Annecy in France [46]. The trend analysis is based on a time series of catch, effort, and the catch per unit effort (CPUE) of the focal fishery. The catch and effort variables collected from the independent cross-sectional surveys in the eight-year period were merged to form time-series data to be used for further analysis. The selected variables were repeatedly sampled in the specified period, and this allows for the assessment and interpretation of effort in relation to catch trends and vice versa.
In the first stage of the analysis, we identified variables that would adequately describe operational differences (and later strategies) among the gillnet fishing vessels. These are specified in 2.1 above. Variables concerning general vessel characteristics were selected from the frame survey data, and gear characteristics, fish catch, hours fished, and vessel length were obtained from the catch assessment data.
In the second stage, two proxy variables were calculated—the average weight of fish landed, calculated as the recorded total weight of the catch divided by the number of fish, and illustration of CPUE (per kg and number of fish) using the number of gillnet panels and hours fished as measures of effort.
Lastly, interpretation of the trends was presented in graphs and tables, where changes in effort, catch and CPUE were used to explain the changing patterns of exploitation in the fishery.
Statistical analysis and graphical displays were performed using R software [47]. We compared the mean between variables i.e., mesh size and numbers of vertical panels versus fish size. The mean differences were tested using Analysis of Variance (ANOVA) and the level of significance (p values) denoted as; **** = <0.001, *** = 0.001, ** = 0.01, * = 0.05, not significant = >0.05.

3. Results

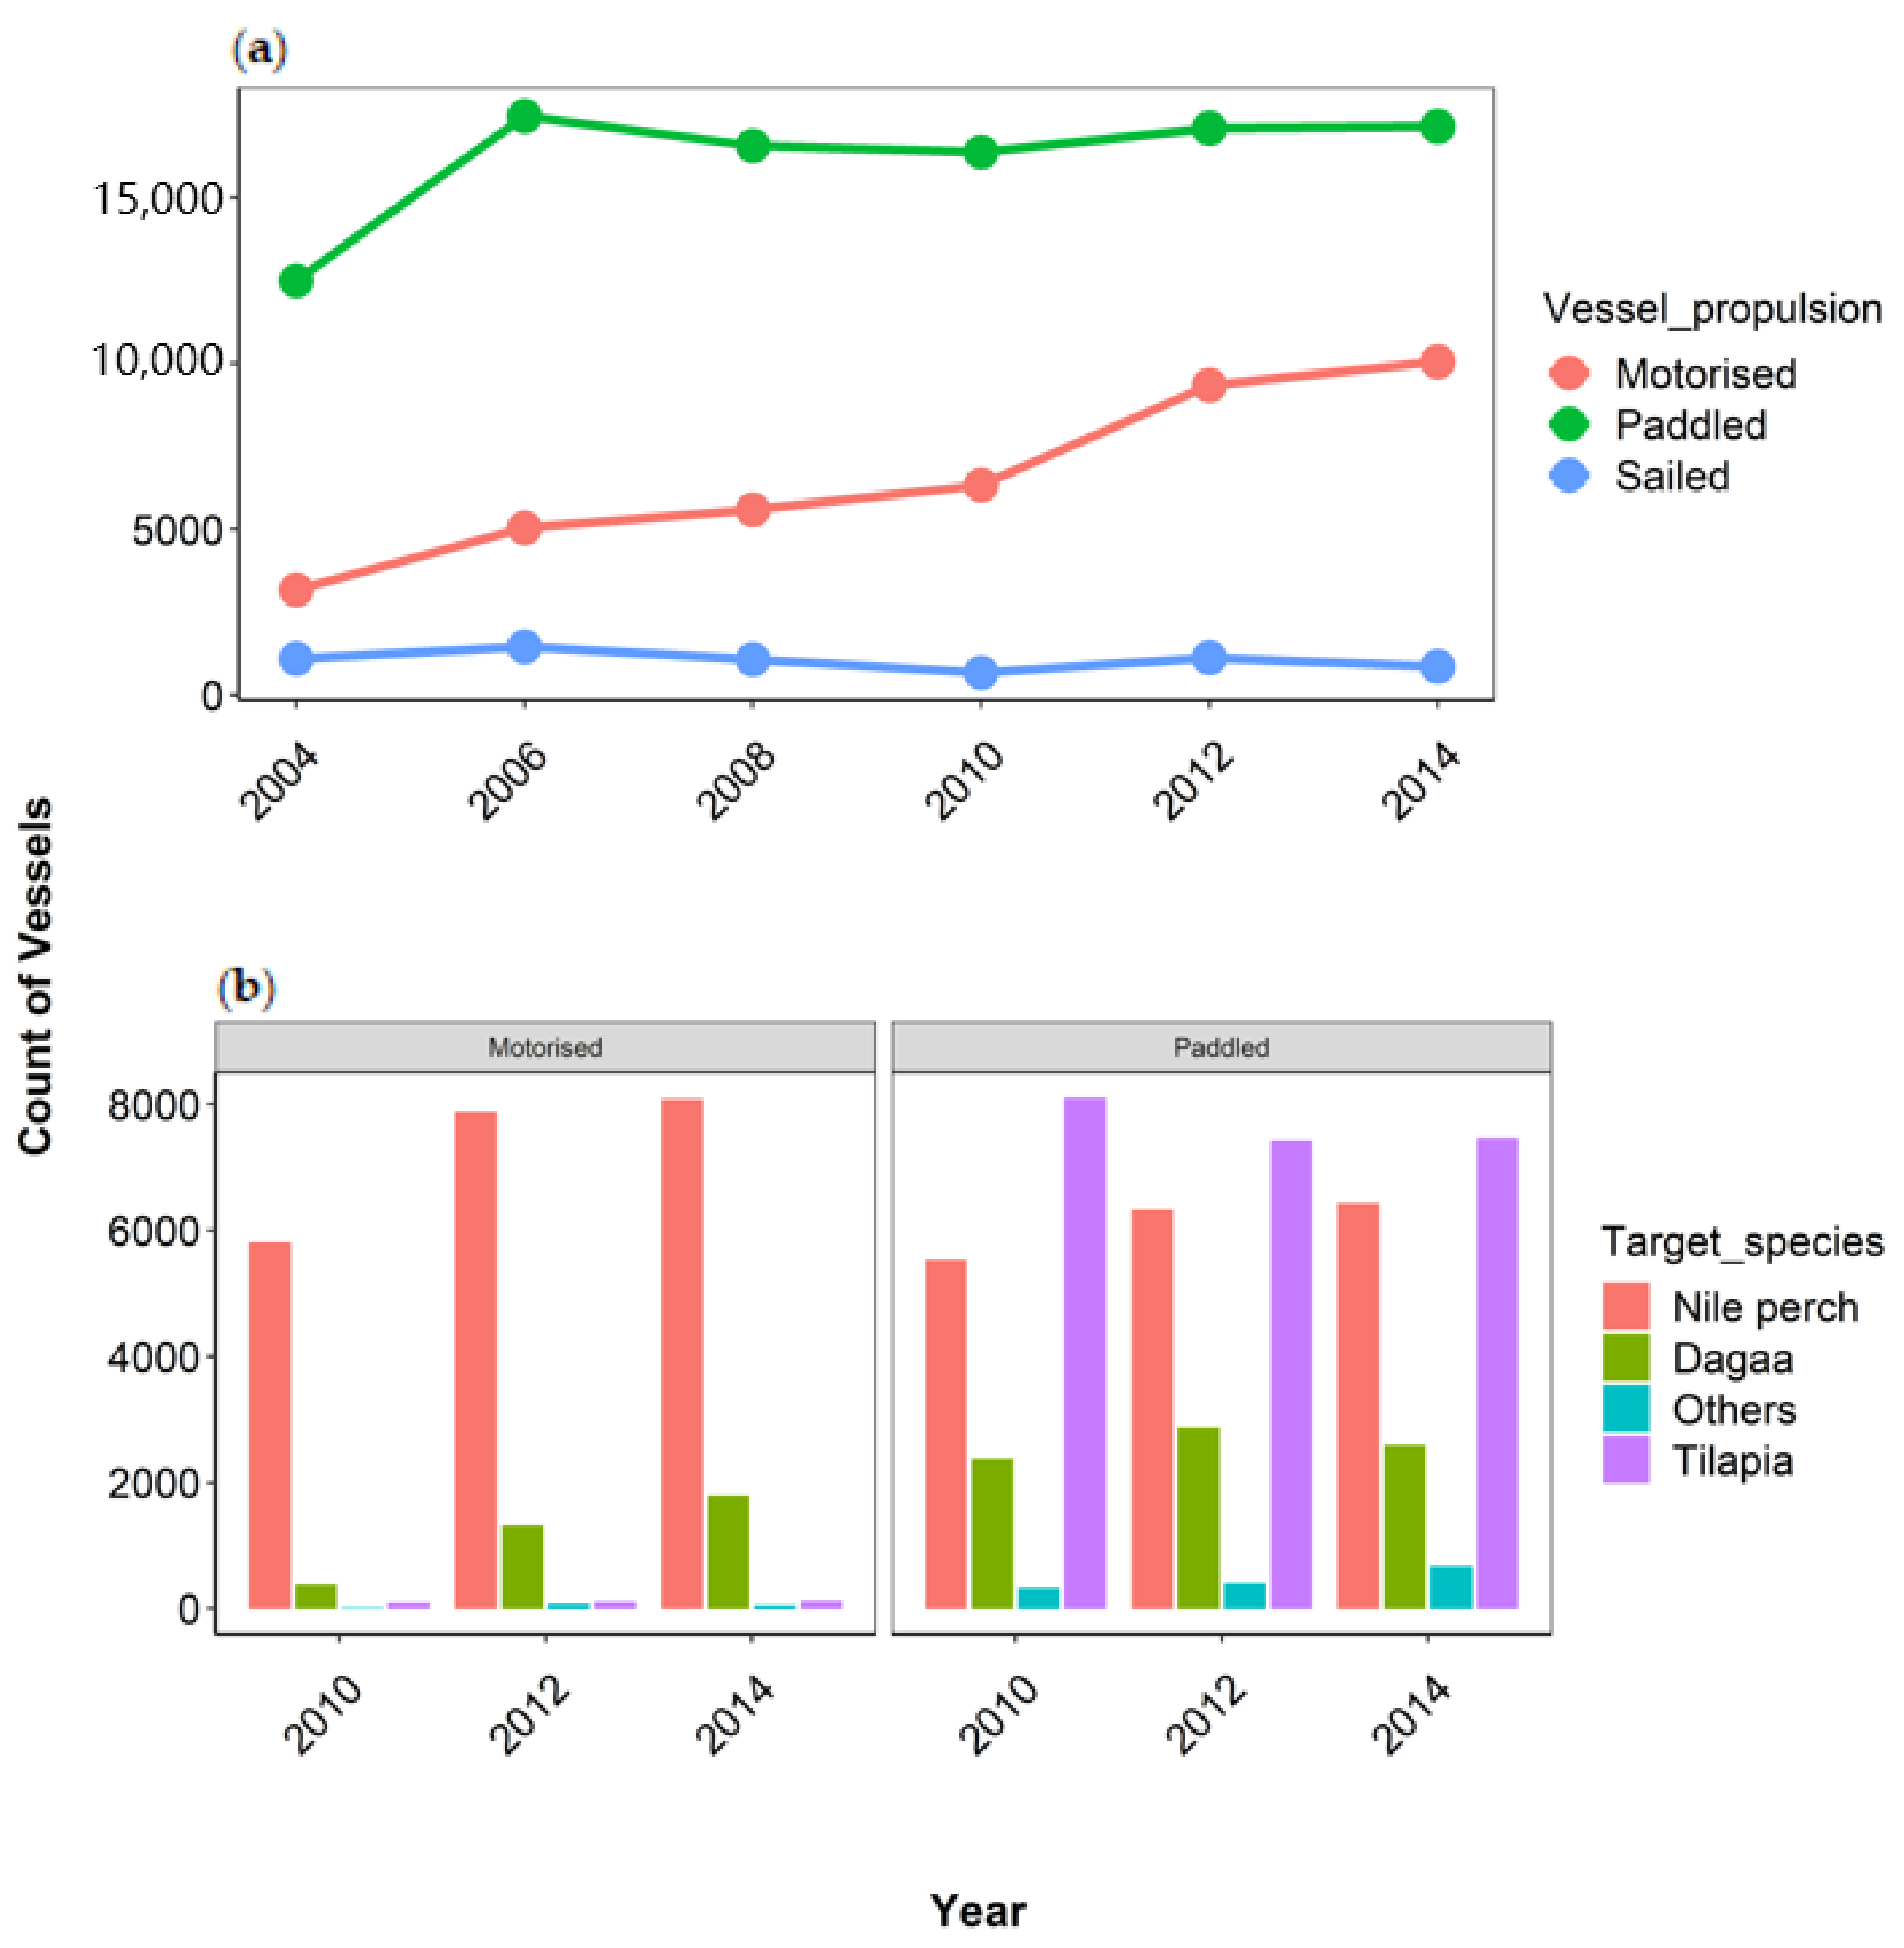
3.1. Vessel Characteristics on Lake Victoria in Uganda

Fishers on the lake operate their vessels using two dominant modes of propulsion, paddles, and outboard engines, while few operate using sails (Figure 3a). From 2004 to 2014, the number of motorized vessels more than trebled from around 3000 to over 10,000. The number of paddled vessels, on the other hand, increased by 40% between 2004 and 2006, but their numbers remained relatively constant for the rest of the study period. The number of sailed vessels was relatively low, with about 1000 vessels recorded with no significant changes over time.
Motorized vessels predominantly targeted Nile perch (>80%) throughout the study period, although the proportion of motorized dagaa vessels increased from 6% to 18% over the period 2010 to 2014 (Figure 3b). Paddled vessels targeted tilapia and Nile perch in almost equal proportions, with no significant changes in the number of vessels per target species from 2010 to 2014. The average length of a motorized vessel was approximately 10 m, about 4 m longer than a paddled vessel. Vessel length remained constant for both groups of vessels throughout the period of study (Appendix, Table A1). Nile perch vessels dominate in the fishery and thus were considered for further analysis.

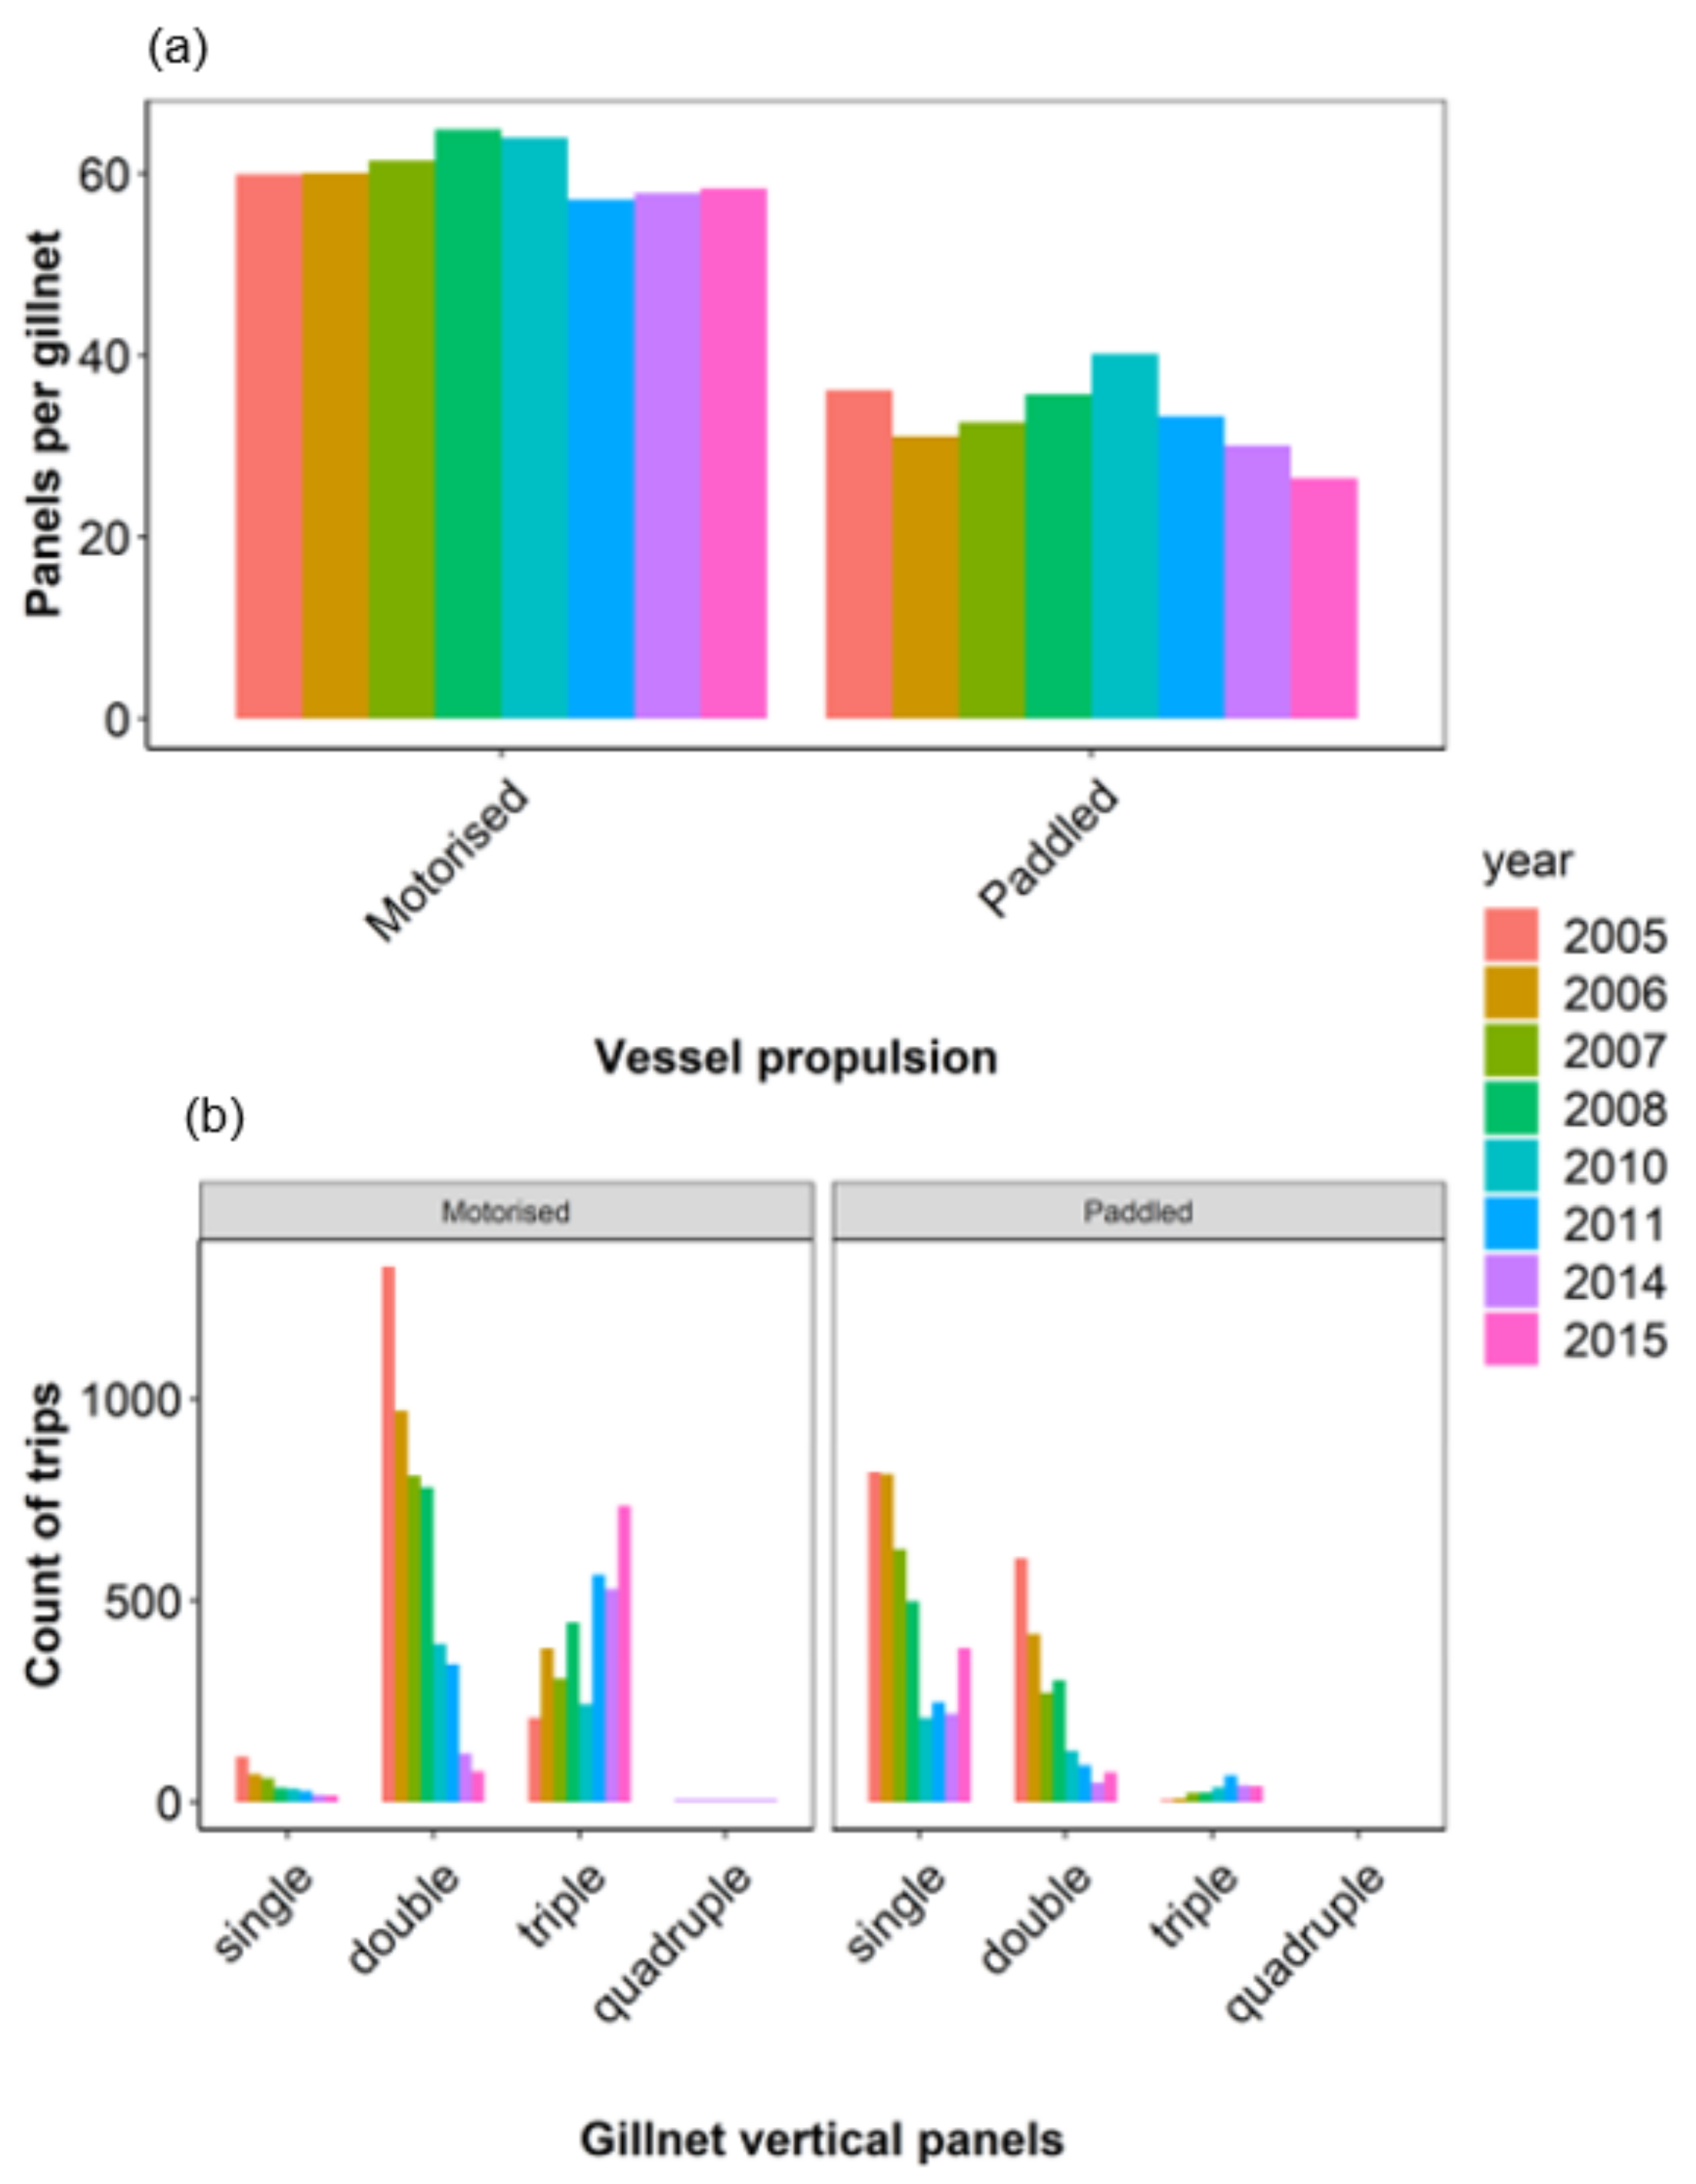
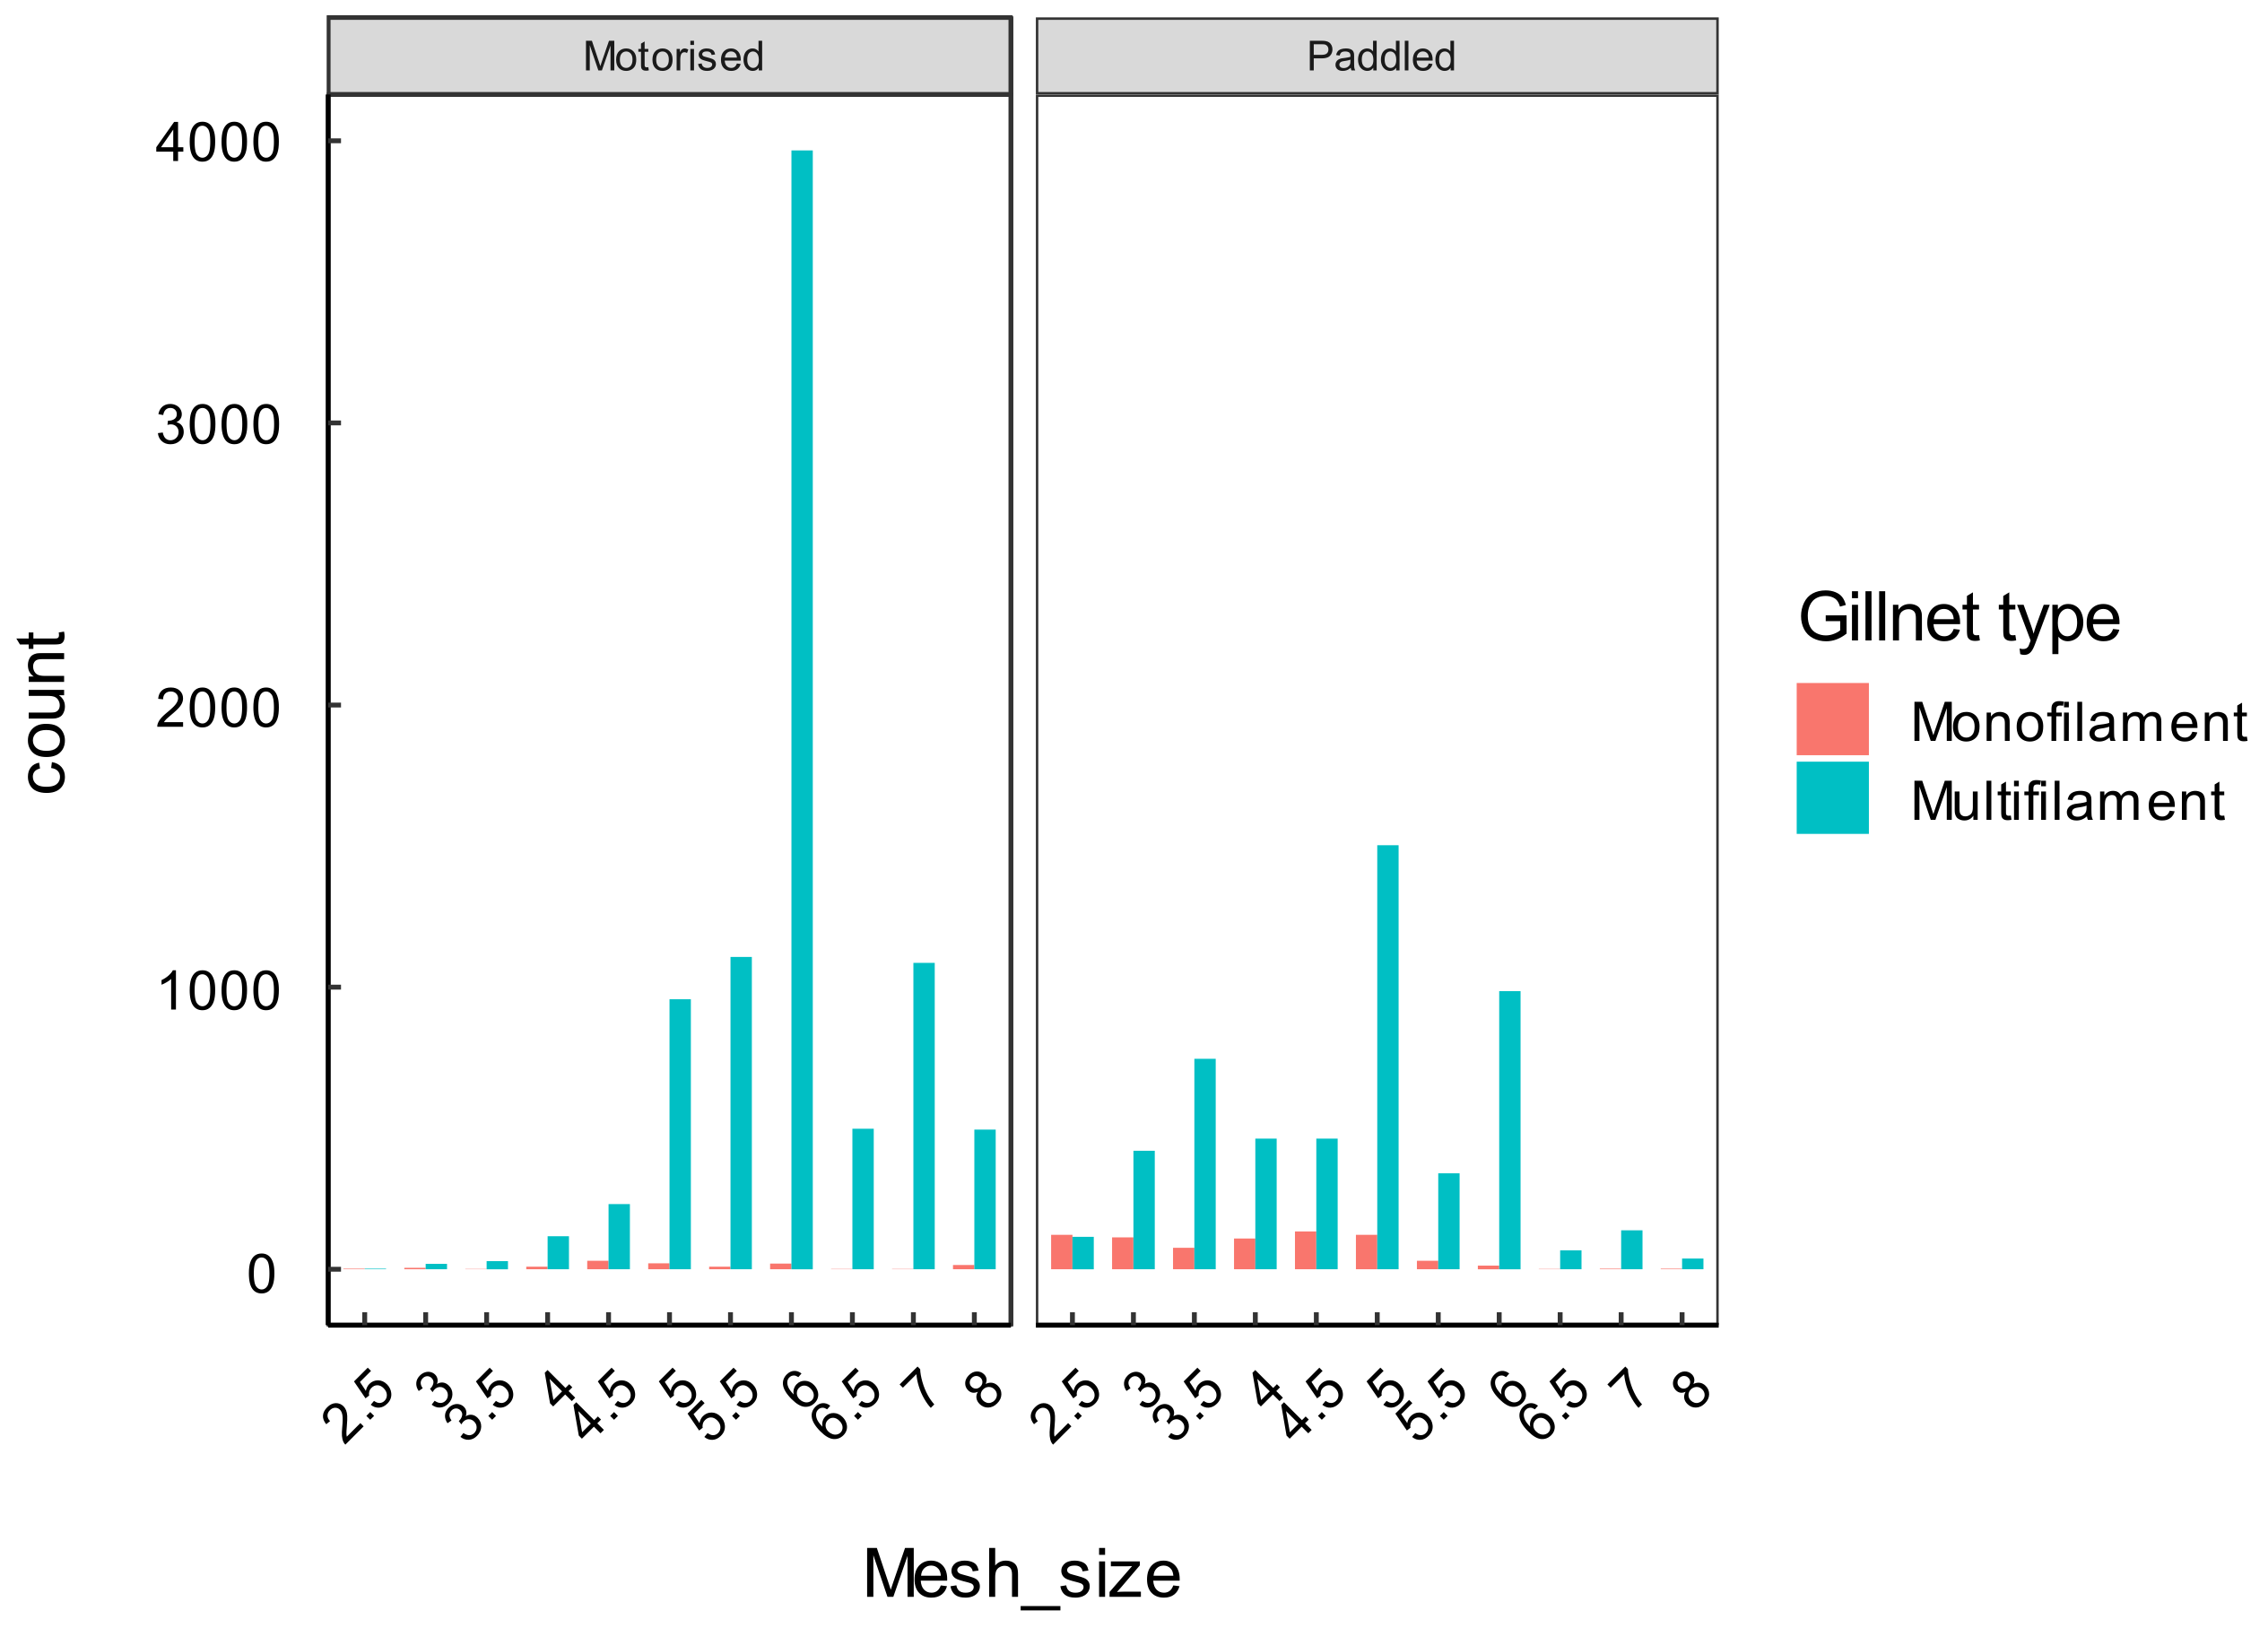
3.2. Gillnet Use in the Nile Perch Fishery
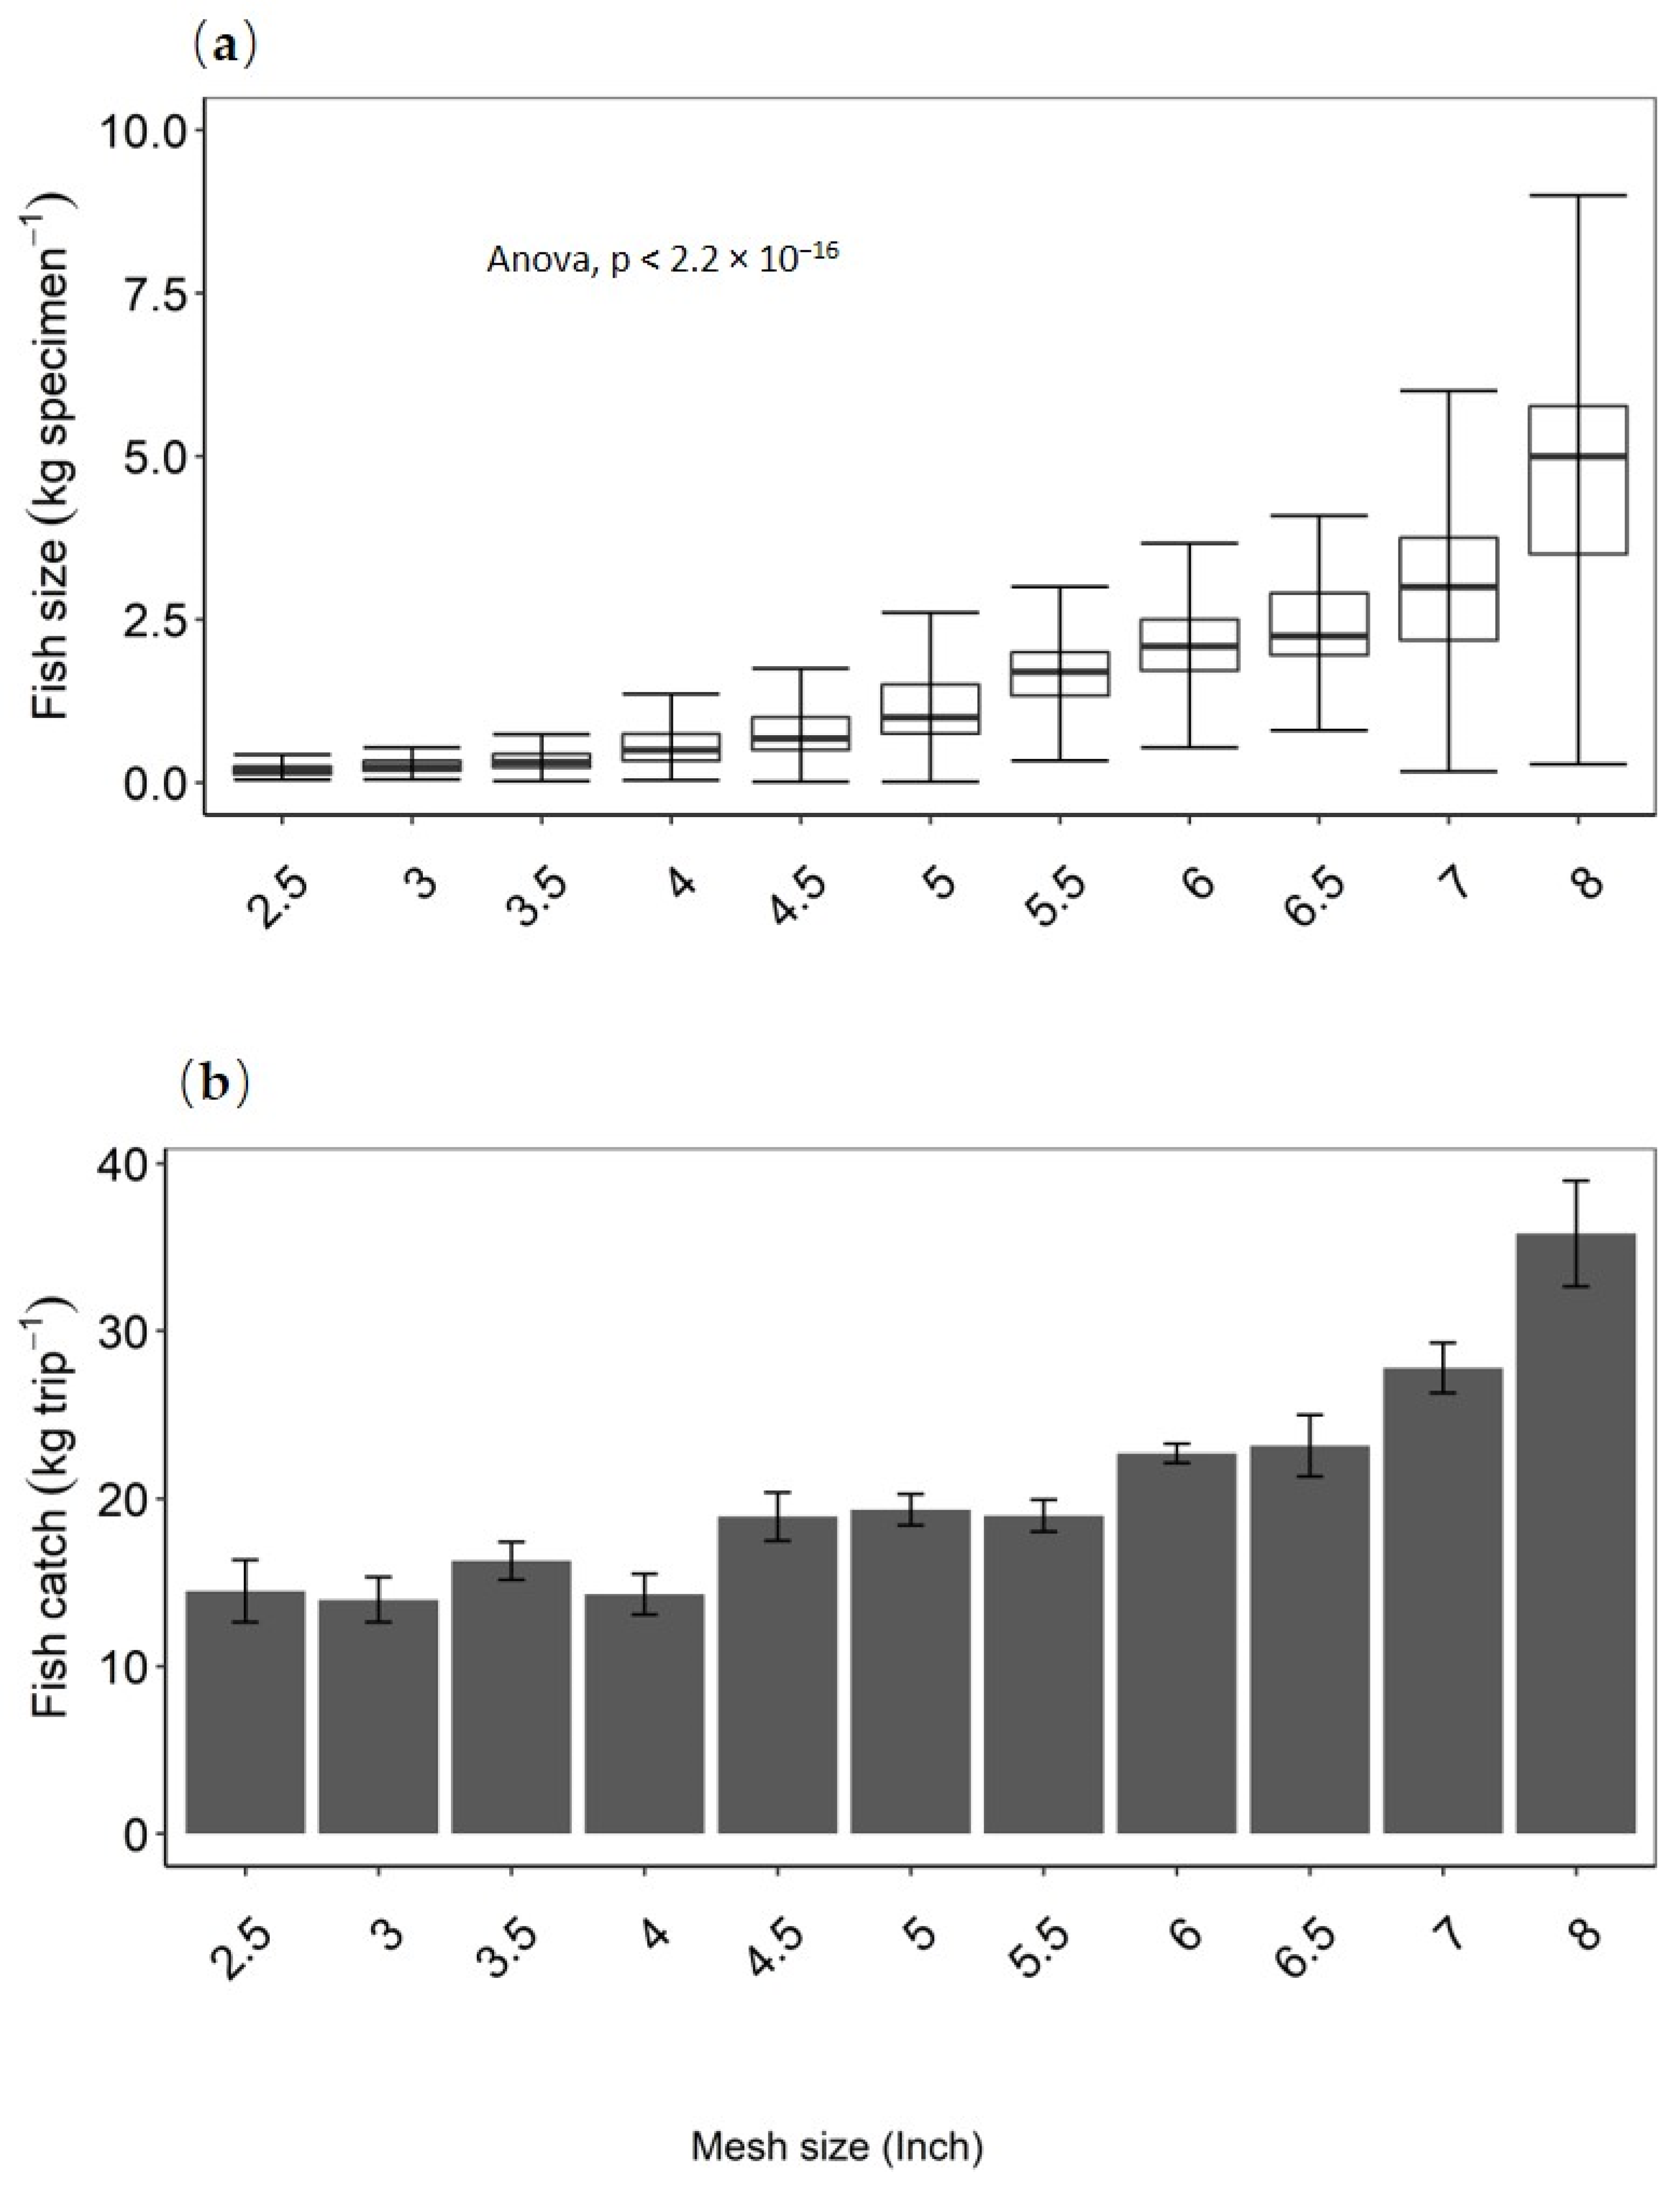
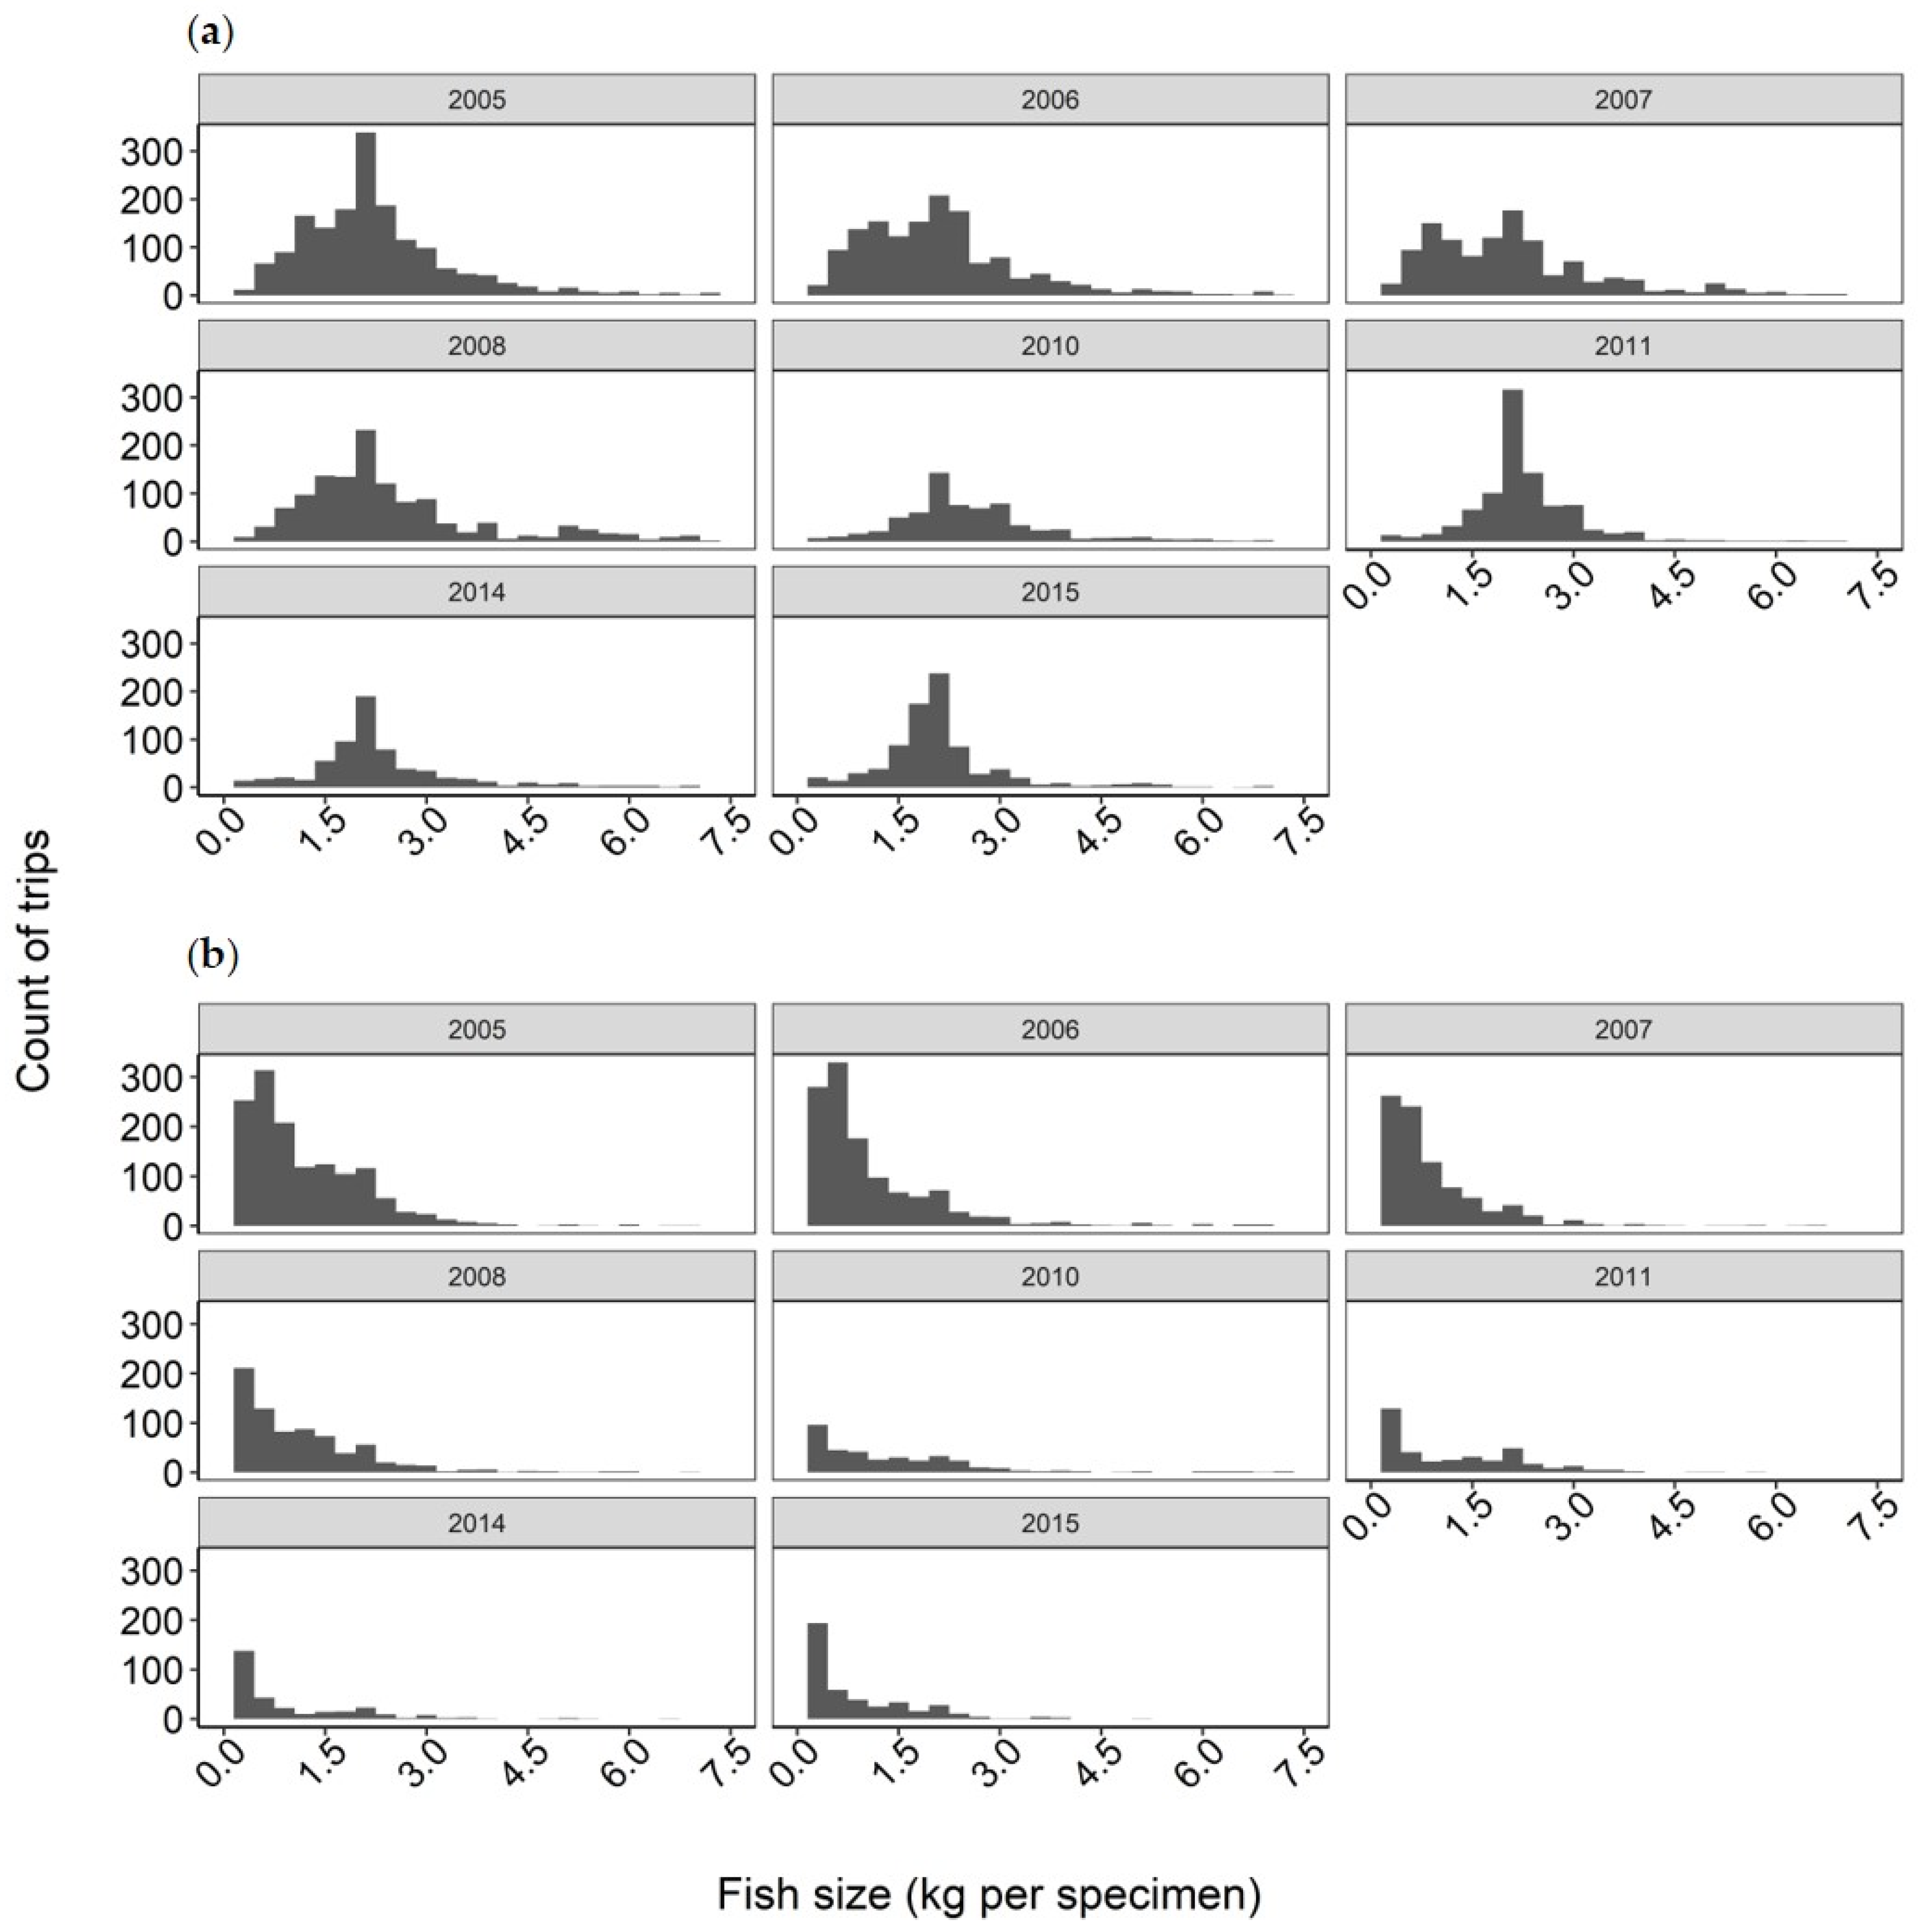
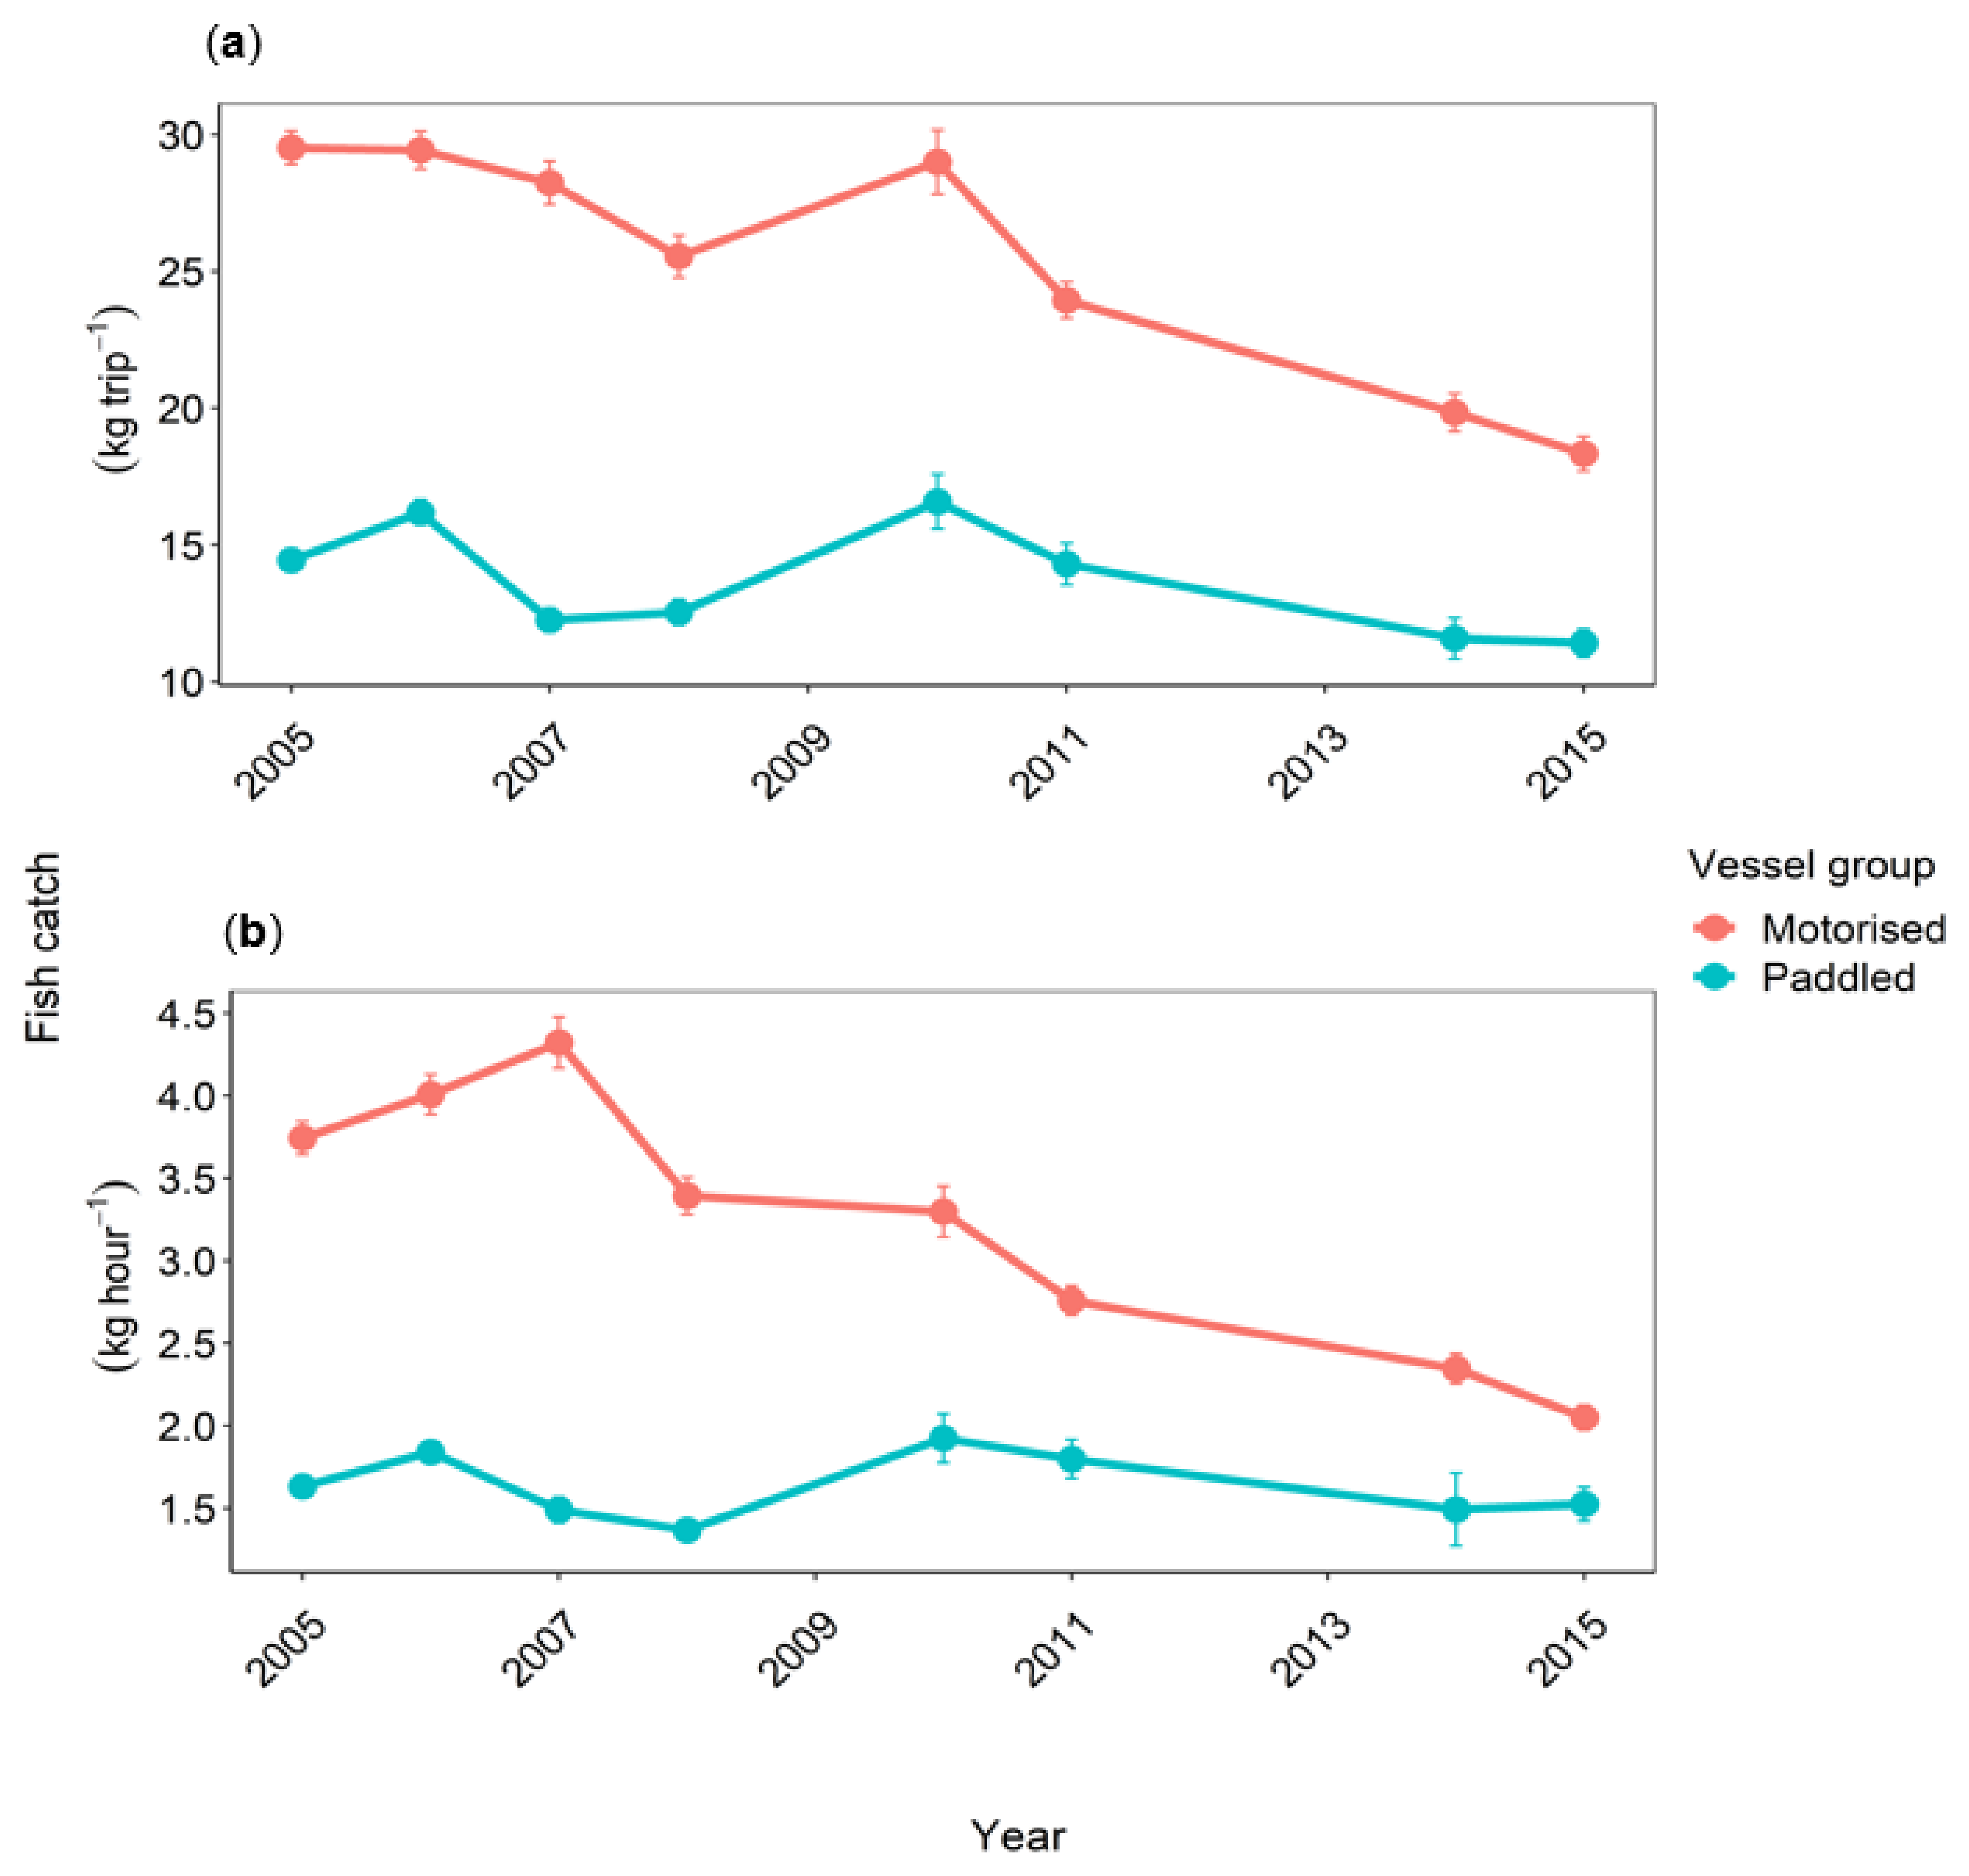
Motorized vessels used mesh sizes up to 8″ and only rarely <4″ with the modal mesh sizes between 5″ and 6″. The use of nets >6″ became less common over time. Paddled vessels in all years used a much wider range of mesh sizes, from 2.5″–8″. With time, two modes of mesh size used become apparent in the paddled fleet, a larger mode at 2.5″–3.5″ and a smaller mode at 5–6″ (Figure 4).
At the beginning of the study period, both vessel groups predominantly (>90%) used multifilament gillnets. However, from 2010, an increase in the proportion of the monofilament gillnets was evident for the paddled vessels, rising from 16% in 2011 to 42% in 2015 as paddled operators were increasingly using smaller meshes (Appendix, Table A1, Figure 4). Motorized vessels, on the other hand, maintained the use of multifilament gillnets and maintained the modal mesh size of 6″. The use of monofilament gillnets was dominant in mesh sizes <6″ (Appendix, Figure A1).
More than half of the paddled vessels operated using passive [stationery] set gillnets, followed by drift nets, however, in 2014–2015, there was a decline in fishers using drift nets. Motorized vessels primarily used drift and passively set gillnets, though, by 2015, sampled vessels using drift nets declined (39%) and were exceeded by those using passive nets (61%) (Appendix, Table A1).
Gillnets are made from panels of a standard dimension, but different mesh sizes. Motorized vessels, on average, used 60 panels while paddled vessels used 40 panels (Figure 5a). No increase in the number of panels per gillnet was observed throughout the study period for either vessel group, however, fishers were observed to alter the depth of the gillnets. Motorized vessels predominantly (>80%) used double vertical panel gillnets in 2005 and shifted to triple vertical panel gillnets in 2015. Paddled vessels, on the other hand, were observed to fish using both the single vertical and double vertical panel gillnets in the first four years of the study, but, a gradual shift to the use of single vertical panel gillnets occurred, with these constituting >80% of the sampled vessels in 2015 (Figure 5b).
The median mesh size between panels was significantly (p < 0.05) different as the number of gillnet panels increased with mesh size (Figure 6). Single panel nets had a wide range of mesh sizes from 2.5″ to 7″, double panel nets varied between 3.5″ to 7″, while the triple and quadruple nets were comprised of a narrow range of mesh sizes mainly >5″ to 8″ and 6″ to 7″, respectively.

3.3. Fish Catches

The average weight of fish harvested increased with increased mesh size (p value < 0.05), although the variation in average weight of individuals caught also increased with increasing mesh size. Fish sizes harvested with the 7- and 8-inch nets varied widely, with the largest average fish sizes of about 6 kg and 9 kg, respectively. The average catch per trip increased with mesh size, with vessels using 2.5″–4″ nets on average harvesting about 15 kg per trip. Those using 4.5″–5.5″ harvested on average around 20 kg, while the increase is greatest for the two largest mesh sizes, with about 25 kg in 7″ nets and 35 kg in 8″ nets (Figure 7b).
The average weight of individual fish caught increased significantly and differed (p < 0.05) from one to two and from two to three-panel gillnets (Figure 8). The average fish size in triple and quadruple gillnet panels was not significantly different (p > 0.05). Single panelled nets harvested fish sizes <2.5 kg, while the fish sizes in double panel gillnets varied most among all panels, with average fish sizes of up to 4.5 kg harvested.
From 2005 to 2007, there was a wide range of Nile perch weight harvested by motorized vessels, with modal weights observed at 1 kg, 2 kg, and 3 kg, however, from 2011 to 2015, the modal average fish size harvested by this vessel group was maintained at about 2 kg (Figure 9a).
Paddled vessels also caught a wide size range of Nile perch at the beginning of the study period, with the modal weights of about 1 and 2 kg. However, this is followed by a gradual decline over time, as the overall distribution became narrower, and by 2015 the modal average fish size was <1 kg (Figure 9b).
Fish catch per trip and hours fished was higher in motorized vessels than paddled vessels. Catches for both vessel groups show the same trend, though this fluctuated until 2010, followed by a continuous decline, especially for the motorized fishing vessels (Figure 10). By 2015, catch per trip and catch per hour reduced to almost half from about 30 kg per trip and approximately 4 kg per hour at the beginning of the study to less than 20 kg per trip and 2 kg per hour in 2015, respectively. The catch per trip and hours fished in paddled vessels, on the other hand, fluctuated throughout the study period, ranging between 10 to 15 kg per trip and 1.5 to 2 kg per hour, respectively.
Similar to the catches depicted in Figure 10 above, the CPUE kg per panel hours fished fluctuated for both vessel groups between 2005 to 2010. For motorized vessels, there was then continuous decline until 2015, when the vessels’ CPUE was <3 kg per panel compared to about 4.5 kg at the beginning of the study period. In contrast, the CPUE for paddled vessels stabilized at 4 kg per panel hours fished (Figure 11a). Motorized fishing vessels harvested about 3 fish per panel hour fished throughout the study period, with the number of specimens harvested per panel for the paddled vessel increasing gradually; in 2005, each panel of the gillnet captured about 5 fish, and by 2015 vessels harvested about 15 Nile perch specimen per panel (Figure 11b).

4. Discussion

4.1. Gillnet Use and Adaptive Fishing Strategies

To improve the understanding of fisher adaptive strategies in the gillnet Nile perch fishery, we analyzed the trends of selected effort and catch indicators to evaluate changes in the fisher’s exploitation environment. Evaluation of catch and effort statistics can help fisheries’ policies to become more consistent, acknowledging the diversity of fishing practices and identifying appropriate points of intervention, especially the formation of policies aimed at reducing fishing effort or even improving adaptive capacity within the fishing communities [45,48]. In the study, we identify fisher adaptive responses (changes in gillnet use) as a result of changes in the population structure and abundance (catches) of Nile perch in Lake Victoria. The comparison made between vessel groups in the study, i.e., motorized and paddled, was derived from earlier studies indicating spatial differences, with the motorized vessels mainly operating in the offshore and coastal areas of the lake, while the latter operate largely inshore [23,41]. The operational differences between the two vessel groups in the Nile perch gillnet fishery further reinforce the distinction between artisanal and commercial SSF [27,49]. Artisanal Nile perch fishers target fish sold to local and regional markets; here the fish is sold fresh, smoked, or deep fried, while commercial fishers target Nile perch purposely for the fish factories who process Nile perch as fillets destined for the export market [21,22,23]. Other distinctions include boat/vessel ownership. Owners of paddled vessels engage in fishing themselves, while owners of motorized vessels mostly employ their fishing crew. Irrespective, both are considered as fishers in this study, which assumes that a fishing strategy is a collective effort and the owners of motorized vessel are experienced fishers [38].
For the two vessel groups, fishers over time adapted their fishing operations according to resource constraints, i.e., their ability to harvest large fish or small Nile perch, and also as a result of opportunities availed to them to maximise their objectives. Operations of the motorized and paddled vessel groups reflect the dynamics behind the commercial gillnet fishery, which target the export market, and the artisanal fishers who focus on local and regional markets [22,38,49]. These are further described as follows.

4.1.1. Paddled Vessels

During the first four years of the study, gillnet use among the paddled fishers was diversified as some fishers employed larger mesh sizes, double vertical panels, and multifilament gillnets, characteristics observed in the motorized (commercial) fleet. However, over time, the fishers switched their gillnet use to smaller meshes and dominantly adapted to single vertical panels. The rationale for this development is two-fold. Firstly, it represented a resource opportunity based on the abundant stock of juvenile Nile perch; secondly, there was a constraint, with an inability to raise sufficient capital to compete with the motorized vessel group.
Generally, the status of Nile perch fish stocks (resource health) on Lake Victoria have been widely studied, with mixed opinions on abundance. Some argue that they are overfished [50,51,52] and some that they are not overfished [4,53]. Nile perch biomass estimates in the hydroacoustic surveys conducted in this period indicated that the population structure of Nile perch was by 2015 dominated (>90%) by small-sized Nile perch (<10 cm TL) found in shallow inshore areas [54]. In the study, paddled vessels switched to smaller meshes and changed depth of their gillnets and were able to maintain their fish catch and also increase the number of fish per panel (Figure 11). The strategy to target smaller fishes by the paddled vessels signifies an opportunity response of utilizing the abundant stock of the population to remain in the fishery. Paddled vessels operate mainly in inshore areas and also target Nile tilapia (Figure 3b), whose distribution is mostly areas that are < 10 m deep [52,55]). Juvenile Nile perch and Nile tilapia have a high market demand in the local and regional markets in the DRC and South Sudan, markets that provide an opportunity for fishers to maintain their livelihood [21,22].
It is also worth noting that the use of small mesh sizes (<5″) and monofilament nets is prohibited on the lake: however, enforcement of regulations was challenging, with the co-management system providing a comparative advantage for paddled fishers to shift strategy [39,56]. In terms of capital constraints, an average artisanal fisher, due to his largely intensive fishing methods and limited capital, can scarcely afford to match the efficiency of larger vessels, more nets, and an out board engine [38,57].

4.1.2. Motorized Vessels

A rapid increase in vessel motorization was observed since 2004 (Figure 3a), and this was particularly evident for the Nile perch fleet (Figure 3b), indicating a technological intensification in response to available resources and market opportunities [58]. Fishing pressure can directly affect a target species’ population; however, changes in market prices, management regulations and environmental and socio-economic conditions also generate synergies that affect fishing pressure over time, impacting the availability of resources [12,14,59]. In Uganda, the need for economic growth in terms of foreign exchange revenue is a major driver of resource exploitation.
Nile perch products are the major (>90%) fish exports in Uganda, thus fishers in this vessel group equip themselves to harvest for the export market. This is observed in the study as these fishersmaintained mesh size, used multifilament gillnets, and used double and triple panels of their gillnet, and on average caught 2 kg Nile perch throughout the study period. A development in the fishing strategy in this vessel group was observed, with the shift of gillnet panels from two to three vertical panels in the second half of the study (Figure 5). The increase in vertical panels is directly related to an increase in fishing depth and could be attributed to the increased competition in the fishery and a need to search for new fishing grounds. Large sized Nile perch (>40 cm TL) are mainly located in the deeper parts of the lake. Notwithstanding this, the size structure of large Nile perch in biomass estimates in that period reflected a small proportion of this population [55,60,61]. Salas et al., 2004 indicates that fishers tend to shift strategies if they perceive an increase in uncertainity in their catches and profits, especially when competition increases.
It is important to note that the development of the commercial Nile perch industry has existed for about 4 decades since the 1980s and this has been exacerbated by international market demand of white fish and donor-driven improvement in fish processing and exporting policies in the country [37,62]. In 2006, the factories established self-regulating policies, which included processing only of fish 50–85 cm to suit the demands of international markets. This meant that factory agents were only permitted to purchase fish sizes of 50–85 cm total length [37,62]. In a study of the Nile perch value chain, Bagumire et al., (2018) indicates that in the first stage of the value chain, at the beach, fish of processable quality and allowable slot-size is sold directly to factory agents, whilst poor quality fish and fish below and beyond the allowable size are then sold to the local traders. The allowable fish slot sizes of 50–85 cm correspond to about 2–10 kg fish from fish sampled in other commercial vessels [63,64], which also coincides with the modal fish size of the motorized fishers in this study. Fishers have mastered strategies, and with the use of triple panel gillnets, they were able to obtain fish sizes within this range (Figure 8). Besides, currently in Uganda and Lake Victoria, there is an emerging fish maw industry, where the value of the fish maw increases with the size of the Nile perch. Nile perch beyond the factory allowable size limit >85 cm TL are targeted for the fish maws and their price per kg (50 USD) is 10 times more than that of fish fillets (5 USD) [64]. Unregulated fishing of large fish sizes threatens the population of the spawning stock.

4.2. Effects of Strategies on Catch and CPUE

CPUE is a basic fisheries science measure used as the first-order evaluation of broad trends in the likely relative abundance or biomass of underlying fish stocks over time [7,65]. However, it is important to note that catches and CPUE are a resultant effect of the fishing strategies to maintain catches. Paddled vessels switched to smaller mesh sizes and single vertical panels to maintain their catch, while the motorized vessels aimed at maintaining a particular fish size by increasing the depth of the gillnet.
In terms of catches, the abundance of the small-sized fish enabled paddled vessels to maintain their catches over time while a decline was observed for the motorized vessels. By 2015, about half of the 20 fishing factories in Uganda had closed and those still in the business operated below their capacity due to the inadequate supply of fish [36]. The observed decline in the catches of the motorized vessels had a direct effect on the factories. The shift in fishing strategy from double to triple panels is also indicative of the measures the fishers devised to maintain their catch and supply the factories. CPUE as a measure of abundance assumes that changes in catch rates directly reflect the abundance and disregard the development of productivity due to improvements in technology or any changes in fishers’ behavior [45]. The fishers here were endogenously reacting to changes in the environment by changing their strategy on how they set their nets, and such responses in the future could greatly affect subsequent CPUE interpretations.
Individual fishermen will invest in new vessels, technology or methods of fishing if they will make more money by doing so or even fish illegally when it is profitable [14,16,66]. In the case of the Nile perch gillnet fishery, the motorized group is an example of increased investment and effort, while the paddled vessel group have resorted to illegal methods; however, both groups are reacting to changes in the size structure of Nile perch, leading possibly in both cases to negative resource impacts. Hydroacoustic surveys conducted in the period 2005–2015 indicated that Nile perch biomass estimates on the lake increased from about 500,000 MT in 2007 and more than doubled by 2015 [61]. Even if the total biomass of Nile perch appears to have increased, the absolute number of larger perch (>50 cm TL) decreased over the same period and constituted less than 5% of the total biomass, reflecting the resultant catch for the two vessel groups in this study. The strategy of the commercial fishers leads to the progressive harvest of larger individuals (spawning stock) while the artisanal fishers increase the fishing mortality of juvenile fish stocks [67,68]. Consequently, the paddled vessels have been a targeted group in enforcing fishery regulations in Uganda [27]. In terms of fisheries management, it is important to note that the regulations (e.g., mesh sizes) support the existence of the commercial export-oriented fishery, whose benefits are squandered if fish are instead sold to local markets and food chains [3,10,14,59]. Besides, the question of whether reduced fish catches on Lake Victoria are caused by illegal gears or reduced catch leads to the use of illegal gears could probably be explained by understanding the dynamics of fisher strategies on the Lake [23,36,52,53]. The impact on the fishery resource due to the collective effort of fishers adapting to operational strategies to maintain their fishery objective is an element that is seldom considered in fisheries management on Lake Victoria. Most fishers on the lake depend on the fisheries with limited alternative livelihood options available, necessitating adaptive strategies to fishing [22,27]. The sustenance of the fishery benefits to the fishing communities should be the goal of fisheries management.
Sustainable fisheries management must address the need to maintain and improve the economic, social, and ecological benefits of a fishery [8,9,10]. In the case of the Nile perch fishery, the fundamental question should be what the objective of fisheries management is, and why and how the stated objective can be achieved. The type of management system greatly influences the performance and overall sustainability of the fishery [7,69].

5. Conclusions

The study evaluates the adaptive strategies of Nile perch gillnet fishers on Lake Victoria, using 8-year data over the periods 2005–2007, 2010–2011, and 2014–2015. We note that the gillnet Nile perch fishery evolved over this period, with two fishing strategies evident on the lake. The artisanal fishers on paddled vessels adopted a safe strategy of harvesting the large numbers of juvenile Nile perch over time, mostly for local or regional markets, and the small-scale commercial gillnet fishers deployed motorized vessels, specializing their fishing effort to target larger fish purposely for the export market.
The use of catch and effort data in the study provides a means of understanding fisher behavior and its impact. It should also be noted that the study considers fishers as key decision makers; however, their behavior could be dependent on the vessel owners, especially for the larger vessels. Irrespective of whether it is the decision of the crew or the vessel owner, both aim to maximize the benefits from the fishery.
It is important to acknowledge that the Nile perch fishery is a source of livelihood to over 30,000 (50%) fishers on lake Victoria in Uganda and many fishing communities on the shores of the Lake are involved in its value chain [20]. Therefore, any negative effects on the Nile perch fish stocks directly affect the livelihoods of these fishers, their dependents, and everyone involved in the value chain.
The strategies used by both motorized and paddled fishers on Lake Victoria have driving factors that can mostly be attributed to the economic value of the Nile perch. Based on the fisheries’ legal and policy framework, motorized vessels in the study fish legally (≥5″ mesh size multifilament), while paddled vessels fish illegally (<5″ mesh size, monofilament) [70]. Managing the lake’s fishing effort, however, should offer a balanced view of not only eliminating illegal fishers but also managing the capacity of legal ones and what drives changes in the strategies employed by the two groups. The key to maintaining or improving the biological health of fish stocks necessitates studying and restricting fisher behaviour, which is expected to reduce profitability in the short run but improve profits in the long run [10,14]. The expansion of motorized fishing leads to competition, and increasing the depth of the gillnet indicates a strategy that reflects the need for short-term profit margins at the expense of sustaining the Nile perch stocks.
It is important for fishery managers to understand the changes in fisher strategies as these provide important insights for envisioning fishers responses to other factors, such as management measures and resource uncertainities. Additionally, it is important to consider that people (fishers) are an integral part of the fishery ecosystem. Considering their behavior in management decisions will aid in devising adaptive policies to fishery conditions for sustainable resource use, as well as ensuring the livelihood development of the fishers’ communities.

Author Contributions

Conceptualization, V.M., H.N., A.T.-M. and D.M.K.; methodology, D.M.K. and V.M.; validation, D.M.K., T.T. and J.G.P.; formal analysis, V.M.; investigation, V.M.; data curation, V.M. and H.N.; writing—original draft preparation, V.M.; writing—review and editing, D.M.K., T.T., A.T.-M., H.N. and J.G.P.; visualization, V.M.; supervision, D.M.K., T.T., A.T.-M. and J.G.P. All authors have read and agreed to the published version of the manuscript.

Funding

The data provided in this paper accrued from Catch Assessment and Frame surveys conducted under the Implementation of a Fisheries Management Plan (IFMP) project for Lake Victoria and the Lake Victoria Environmental Management Plan II (LVEMP II), both funded by the EU through NaFIRRI and the LVFO. Article written under a PhD scholarship from the UNESCO affiliated GRO-Fisheries Training Programme in Iceland.

Institutional Review Board Statement

Not applicable.

Informed Consent Statement

Not applicable.

Data Availability Statement

Data for the study will be available upon request from the author.

Acknowledgments

All staff at National Fisheries Resources Research Institute, Directorate of Fisheries Resources and Lake Victoria Fisheries Organization that contributed to the collection and collation of data used in the study are hereby acknowledged. The article benefited from comments of two anonymous reviewers and language review by David Cook of the University of Iceland, much appreciated.

Conflicts of Interest

The authors declare no conflict of interest.

Appendix A

Table A1. Trend of vessel length and gillnet construction code for the paddled and motorized vessel groups.
Vessel GroupVariableDescription
/Measure
Survey Years
20052006200720082010201120142015
MotorizedVessel lengthmeters9.8110.039.9910.0010.249.7210.1110.03
Gillnet construction codeMonofilament2 (0.2%)27 (2%)62 (5%)4 (0.6%)0 (0%)3 (0.3%)5 (0.7%)11 (1.3%)
Multifilament1649 (99.8%)1396 (98%)1115 (95%)1258 (99.6%)671 (100%)932 (99.7%)668 (99.3%)819 (98.7%)
Gillnet operation codeActive5 (0.3%)10 (0.7%)2 (0.3%)3 (0.2%)0 (0.0%)27 (3.1%)3 (0.4%)2 (0.2%)
Drift8634 (49.1%)778 (56.0%)697 (59.5%)719 (56.8%)323 (47.0%)537 (56.9%)367(54.7%)322 (38.7%)
Passive812 (50.6%)635 (43.3%)478 (40.2%)540 (42.9%)348(53.0%)371 (40.1%)303 (44.9%)506 (61.1%)
Sample sizeSub-total1651142311771262671935673830
PaddledVessel lengthmeters6.696.586.446.486.736.806.585.91
Gillnet construction codeMonofilament21 (2.1%)138 (11.3%)139 (15.6%)25 (3.1%)23 (7.1%)65 (16.1%)107 (35.2%)211 (42.4%)
Multifilament408 (97.9%)1103 (88.7%)783 (84.4%)800 (96.9%)351 (92.9%)343 (83.9%)204 (64.8%)287 (57.6%)
Gillnet operation codeActive121 (8.7%)184 (14.9%)144 (15.5%)100 (12.0%)31 (9.2%)46 (11.0%)40 (13.2%)86 (17.3%)
Drift439 (28.9%)313 (24.2%)252 (26.6%)178 (21.4%)105 (27.0%)110 (26.4%)57 (17.9%)63 (12.5%)
Passive869 (62.5%)744 (61.9%)526 (57.9%)547 (67.6%)238 (64.4%)255 (64.3%)214 (68.9%)349 (70.1%)
Sample sizeSub-total14291241922825374408311498
Total trips sampled3080266420992087104513439841328
Figure A1. Gillnet construction type across mesh sizes for the paddled and motorized vessel groups.
Sustainability 14 02376 g0a1

References

  1. FAO. The State of World Fisheries and Aquaculture 2020, Sustainability in Action; Food & Agriculture Org.: Rome, Italy, 2020. [Google Scholar] [CrossRef]
  2. Berkes, F.; Mahon, R.; McConney, P.; Pollnacc, R.; Pomeroy, R.S. Managing Small-Scale Fisheries: Alternative Directions and Methods. IDRC: Ottawa, ON, Canada, 2001. [Google Scholar]
  3. Arnason, R. Fisheries management and operations research. Eur. J. Oper. Res. 2009, 193, 741–751. [Google Scholar] [CrossRef]
  4. Kolding, J.; Van Zwieten, P.A.M. Sustainable fishing of inland waters. J. Limnol. 2014, 73, 132–148. [Google Scholar] [CrossRef]
  5. Jentoft, S.; Chuenpagdee, R. Exploring Challenges in Small-Scale Fisheries Governance. In Interactive governance for small-scale fisheries edited by; Jentoft, S., Chuenpagdee, R., Eds.; Springer: Berlin/Heidelberg, Germany, 2015; Volume 13. [Google Scholar]
  6. Purcell, S.W.; Pomeroy, R.S. Driving small-scale fisheries in developing countries. Front. Mar. Sci. 2015, 2, 1–7. [Google Scholar] [CrossRef]
  7. Cooke, S.J.; Allison, E.H.; Beard, T.D.; Arlinghaus, R.; Arthington, A.H.; Bartley, D.M.; Cowx, I.G.; Fuentevilla, C.; Leonard, N.J.; Lorenzen, K.; et al. On the sustainability of inland fisheries: Finding a future for the forgotten. Ambio 2016, 45, 753–764. [Google Scholar] [CrossRef] [PubMed]
  8. FAO. Voluntary Guidelines for Securing Sustainable Small-Scale Fisheries in the context of Food Security and Poverty Eradication; FAO Fisheries and Aquaculture; Food & Agriculture Org.: Rome, Italy, 2015; p. 34. [Google Scholar]
  9. Chuenpagdee, R. Thinking big on small-scale fisheries, Ecosystem Approach to Fisheries: A Global Perspective; Christensen, V., Maclean, J., Eds.; University of Cambridge Press: Cambridge, UK, 2011; pp. 226–240. [Google Scholar]
  10. Asche, F.; Garlock, T.M.; Anderson, J.L.; Bush, S.R.; Smith, M.D.; Anderson, C.M.; Chu, J.; Garrett, K.A.; Lem, A.; Lorenzen, K.; et al. Three pillars of sustainability in fisheries. Proc. Natl. Acad. Sci. USA 2018, 115, 11221–11225. [Google Scholar] [CrossRef]
  11. Pomeroy, R.S.; Andrew, N. Small-Scale Fisheries Management: Frameworks and Approaches for the Developing World; Cabi: London, UK, 2011. [Google Scholar]
  12. Salas, S.; Gaertner, D. The behavioural dynamics of fishers: Management implications. Fish Fish. 2004, 5, 153–167. [Google Scholar] [CrossRef]
  13. Saldaña, A.; Salas, S.; Arce-Ibarra, A.M.; Torres-Irineo, E. Fishing operations and adaptive strategies of small-scale fishers: Insights for fisheries management in data-poor situations. Fish. Manag. Ecol. 2017, 24, 19–32. [Google Scholar] [CrossRef]
  14. Hilborn, R. Managing fisheries is managing people: What has been learned? Fish Fish. 2007, 8, 285–296. [Google Scholar] [CrossRef]
  15. Pilling, G.M.; Apostolaki, P.; Failler, P.; Floros, C.; Large, P.A.; Morales-Nin, B.; Reglero, P.; Stergiou, K.I.; Tsikliras, A.C. Assessment and Management of Data-Poor Fisheries. Adv. Fish. Sci. 2009, 50, 280–305. [Google Scholar] [CrossRef]
  16. Bartley, D.M.; de Graaf, G.J.; Valbo-Jørgensen, J.; Marmulla, G. Inland capture fisheries: Status and data issues. Fish. Manag. Ecol. 2015, 22, 71–77. [Google Scholar] [CrossRef]
  17. Fluet-Chouinard, E.; Funge-Smith, S.; McIntyre, P.B. Global hidden harvest of freshwater fish revealed by household surveys. Proc. Natl. Acad. Sci. USA 2018, 115, 7623–7628. [Google Scholar] [CrossRef] [PubMed]
  18. Nyamweya, C.S. Ecological Modelling of Lake Victoria; University of Iceland: Reykjavik, Iceland, 2017. [Google Scholar]
  19. Onyango, P.O. Governability, Self-Governance and Co-governance in the Context of Lake Victoria Fisheries, Tanzania. In Interactive Governance for Small-Scale Fisheries; Jentoft, S., Chuenpagdee, R., Eds.; Springer International Publishing: Cham, Switzerland, 2015; Volume 13, pp. 179–198. [Google Scholar]
  20. DiFR. National Report of the Frame Survey 2014 on the Ugandan Side of Lake Victoria; Directorate of Fisheries Resources: Entebbe, Uganda, 2015. [Google Scholar]
  21. DFR. Department of Fisheries Annual Report 2010/2011; Department of Fisheries Resources: Entebbe, Uganda, 2011. [Google Scholar]
  22. Odongkara, K. Strategies to Improve Trade in Dagaa (Rastrineobola argentea) from Lake Victoria O. African J. Trop. Hydrobiol. Fish. 2018, 71, 63–71. [Google Scholar]
  23. Kolding, J.; Medard, M.; Mkumbo, O.C.; van Zwieten, P.A.M. Status, trends and management of the Lake Victoria Fisheries. Inland fisheries evolution and management—case studies from four continents. FAO Fish. Aquac. Tech. Paper. 2014, 579, 49–62. [Google Scholar]
  24. Medard, M.; van Dijk, H.; Hebinck, P. Competing for kayabo: Gendered struggles for fish and livelihood on the shore of Lake Victoria. Marit. Stud. 2019, 18, 321–333. [Google Scholar] [CrossRef]
  25. Geheb, K.; Kalloch, S.; Medard, M.; Nyapendi, A.T.; Lwenya, C.; Kyangwa, M. Nile perch and the hungry of Lake Victoria: Gender, status and food in an East African fishery. Food Policy 2008, 33, 85–98. [Google Scholar] [CrossRef]
  26. Medard, M. Relations between people, relations about things: Gendered investment and the case of the Lake Victoria fishery, Tanzania. Signs J. Women Cult. Soc. 2012, 37, 555–567. [Google Scholar] [CrossRef]
  27. Mpomwenda, V.; Kristófersson, D.M.; Taabu-Munyaho, A.; Tómasson, T.; Pétursson, J.G. Fisheries management on Lake Victoria at a cross-roads: Assessing fishers’ perceptions on future management options in Uganda. Fish. Manag. Ecol. 2021, 2, 1–16. [Google Scholar] [CrossRef]
  28. Nunan, F. The political economy of fisheries co-management: Challenging the potential for success on Lake Victoria. Glob. Environ. Chang. 2020, 63, 102101. [Google Scholar] [CrossRef]
  29. Kantel, A.J. Fishing for Power: Incursions of the Ugandan Authoritarian State. Ann. Am. Assoc. Geogr. 2019, 109, 443–455. [Google Scholar] [CrossRef]
  30. Béné, C.; Belal, E.; Baba, M.O.; Ovie, S.; Raji, A.; Malasha, I.; Njaya, F.; Andi, M.N.; Russell, A.; Neiland, A. Power Struggle, Dispute and Alliance Over Local Resources: Analyzing ‘Democratic’ Decentralization of Natural Resources through the Lenses of Africa Inland Fisheries. World Dev. 2009, 37, 1935–1950. [Google Scholar] [CrossRef]
  31. Sadik-Zada, E.R.; Loewenstein, W.; Hasanli, Y. Commodity revenues, agricultural sector and the magnitude of deindustrialization: A novel multisector perspective. Economies 2019, 7, 113. [Google Scholar] [CrossRef]
  32. Kudhongania, D.B.R.; Chitamwebwa, A.W. Impact of environmental change, species introductions and ecological interactions on the fish stocks in Lake Victoria. In The Impact of Species Changes in African Lakes; Pitcher, T.J., Hart, P.J.B., Eds.; Springer: Berlin/Heidelberg, Germany, 1995; pp. 19–32. [Google Scholar]
  33. Fryer, G. Concerning the proposed introduction of Nile perch into Lake Victoria. East Afr. Agric. J. 1960, 25, 267–270. [Google Scholar] [CrossRef]
  34. Ogutu-Ohwayo, R.; Wandera, S.B.; Kamanyi, I.R. Fishing gear selectivity for Lates niloticus L., Oreochromis niloticus L. and Rastrineobola argentea P. in Lakes Victoria, Kyoga and Nabugabo. Conserv. Biol. 1998, 7, 3–38. [Google Scholar]
  35. Allan, J.D.; Abell, R.; Hogan, Z.E.B.; Revenga, C.; Taylor, B.W.; Welcomme, R.L.; Winemiller, K. Overfishing of Inland Waters. Bioscience 2005, 55, 1041–1051. [Google Scholar] [CrossRef]
  36. Taabu-Munyaho, A. Anthropogenic and Environmental Impacts on the Abundance and Distribution of Commercial Fish Stocks of Lake Victoria, East Africa; Faculty of Life and Environment sciences, University of Iceland: Reykjavik, Iceland, 2014. [Google Scholar]
  37. Beuving, J.J. Playing Pool Along the Shores of Lake Victoria: Fishermen, Careers and Capital Accumulation in the Ugandan Nile Perch Business. Africa 2010, 80, 224–248. [Google Scholar] [CrossRef]
  38. Beuving, J. Chequered fortunes in global exports: The sociogenesis of African entrepreneurship in the Nile Perch business at Lake Victoria, Uganda. Eur. J. Dev. Res. 2013, 25, 501–517. [Google Scholar] [CrossRef]
  39. Cepić, D.; Nunan, F. Justifying non-compliance: The morality of illegalities in small scale-fisheries of Lake Victoria, East Africa. Mar. Policy 2017, 86, 104–110. [Google Scholar] [CrossRef]
  40. Okeyo, D.O. Artisanal and commercial fishing gear and practices in the Lake Victoria basin drainage systems of Kenya: A photodiagrammatic verification. Lakes Reserv. Res. Manag. 2014, 19, 192–205. [Google Scholar] [CrossRef]
  41. Muhoozi, L. Exploitation and Management of the Artisanal Fisheries in the Ugandan Waters of Lake Victoria; University of Hull: Hull, UK, 2002. [Google Scholar]
  42. Hansson, S. A simple vertical gill net system for variable current conditions. Hydrobiologia 1988, 160, 107–110. [Google Scholar] [CrossRef]
  43. Mkumbo, O.C.; Mlaponi, E. Impact of the baited hook fishery on the recovering endemic fish species in Lake Victoria. Aquat. Ecosyst. Health Manag. 2007, 10, 458–466. [Google Scholar] [CrossRef]
  44. LVFO. Regional Catch Assessment Survey Synthesis Report June 2005 to November/December 2015; Lake Victoria Fisheries Organisation: Jinja, Uganda, 2016. [Google Scholar]
  45. LVFO. Standard Operating Procedures (SOPs) for Catch Assessment Surveys on Lake Victoria; LVFO Standard Operating Procedures: Jinja, Uganda, 2007. [Google Scholar]
  46. Lorenzen, K.; Cowx, I.G.; Entsua-Mensah, R.E.M.; Lester, N.P.; Koehn, J.D.; Randall, R.G.; So, N.; Bonar, S.A.; Bunnell, D.B.; Venturelli, P. Stock assessment in inland fisheries: A foundation for sustainable use and conservation. Rev. Fish Biol. Fish. 2016, 26, 405–440. [Google Scholar] [CrossRef]
  47. Gerdeaux, D.; Janjua, M.Y. Contribution of obligatory and voluntary fisheries statistics to the knowledge of whitefish population in Lake Annecy (France). Fish. Res. 2009, 96, 6–10. [Google Scholar] [CrossRef]
  48. RStudio Team. RStudio: Integrated Development Environment for R; RStudio: Boston, MA, USA, 2020. [Google Scholar]
  49. Daw, T.M.; Cinner, J.E.; McClanahan, T.R.; Brown, K.; Stead, S.M.; Graham, N.A.; Maina, J. To Fish or not to Fish: Factors at multiple scales affecting artisanal fishers’ readiness to exit a declining fishery. PLoS ONE 2012, 7, e31460. [Google Scholar] [CrossRef] [PubMed]
  50. Funge-Smith, S.; Bennett, A. A fresh look at inland fisheries and their role in food security and livelihoods. Fish Fish. 2019, 20, 1176–1195. [Google Scholar] [CrossRef]
  51. Njiru, M.; Kazungu, J.; Ngugi, C.C.; Gichuki, J.; Muhoozi, L. An overview of the current status of Lake Victoria fishery: Opportunities, challenges and management strategies. Lakes Reserv. Res. Manag. 2008, 13, 1–12. [Google Scholar] [CrossRef]
  52. Mkumbo, O.C.; Marshall, B.E. The Nile perch fishery of Lake Victoria: Current status and management challenges. Fish. Manag. Ecol. 2015, 22, 56–63. [Google Scholar] [CrossRef]
  53. Kayanda, R.; Taabu, A.M.; Tumwebaze, R.; Muhoozi, L.; Jembe, T.; Mlaponi, E.; Nzungi, P. Status of the Major Commercial Fish Stocks and Proposed Species-specific Management Plans for Lake Victoria. Afr. J. Hydrobiol. Fish. 2009, 12, 15–21. [Google Scholar] [CrossRef]
  54. Kolding, J.; van Zwieten, P.A.M. The Tragedy of Our Legacy: How do Global Management Discourses Affect Small Scale Fisheries in the South? Forum Dev. Stud. 2011, 38, 267–297. [Google Scholar] [CrossRef]
  55. LVFO. Report of the Lake Wide Hydro-Acoustic and Environmental Survey for Lake Victoria; Lake Victoria Fisheries Organisation: Jinja, Uganda, 2017. [Google Scholar]
  56. Taabu-Munyaho, A.; Kayanda, R.J.; Everson, I.; Grabowski, T.B.; Marteinsdóttir, G. Distribution and exploitation of Nile perch Lates niloticus in relation to stratification in Lake Victoria, East Africa. J. Great Lakes Res. 2013, 39, 466–475. [Google Scholar] [CrossRef]
  57. Nunan, F.; Cepić, D.; Yongo, E.; Salehe, M.; Mbilingi, B.; Odongkara, K.; Onyango, P.; Mlahagwa, E.; Owili, M. Compliance, corruption and co-management: How corruption fuels illegalities and undermines the legitimacy of fisheries co-management. Int. J. Commons 2018, 12, 58–79. [Google Scholar] [CrossRef]
  58. Fulgencio, K. Globalisation of the Nile perch: Assessing the socio-cultural implications of the Lake Victoria fishery in Uganda. Afr. J. Political Sci. Int. Relat. 2009, 3, 433–442. [Google Scholar]
  59. Beuving, J. Spatial diversity in small scale fishing: A socio-cultural interpretation of the Nile perch sector on Lake Victoria, Uganda. Anthropol. Cult. Caos. Dev. Stud. Van. Thomas 2015, 106, 1–16. [Google Scholar] [CrossRef]
  60. Branch, T.A.; Hilborn, R.; Haynie, A.C.; Fay, G.; Flynn, L.; Griffiths, J.; Marshall, K.N.; Randall, J.K.; Scheuerell, J.M.; Ward, E.J.; et al. Fleet dynamics and fishermen behavior: Lessons for fisheries managers. Can. J. Fish. Aquat. Sci. 2006, 63, 1647–1668. [Google Scholar] [CrossRef]
  61. Cornelissen, I.J.M.; van Zwieten, P.A.M.; Peter, H.K.; Nagelkerke, L.A.J. Nile perch distribution in south-east Lake Victoria is more strongly driven by abiotic factors, than by prey densities. Hydrobiologia 2015, 755, 239–255. [Google Scholar] [CrossRef]
  62. LVFO. Report of the Lake-Wide Hydroacoustic and Environmental Survey; Lake Victoria Fisheries Organisation: Jinja, Uganda, 2015. [Google Scholar]
  63. Kjær, A.M.; Muhumuza, F.; Mwebaze, T.; Katusiimeh, M. The Political Economy of the Fisheries Sector in Uganda: Ruling Elites, Implementation Costs and Industry Interests; DIIS Working Paper: Copenhagen, Denmark, 2012. [Google Scholar]
  64. Yongo, E.; Outa, N.; Kito, K.; Matsushita, Y. Some aspects of the biology of Nile perch, Lates niloticus, in the open waters of Lake Victoria, Kenya. Lakes Reserv. Res. Manag. 2017, 22, 262–266. [Google Scholar] [CrossRef]
  65. Bagumire, A.; Muyanja, C.K.; Kiboneka, F.W. Report for The Value Chain Analysis of Nile perch Maw Trade in East Africa. In The Responsible Fisheries Business Chains Project of Deutsche Gesellschaft für Internationale Zusammenarbeit (GIZ) under Contract No. 83285575; Lake Victoria Fisheries Organisation: Jinja, Uganda, 2018; pp. 1–52. [Google Scholar]
  66. Zeller, D.; Vianna, G.; Ansell, M.; Coulter, A.; Derrick, B.; Greer, K.; Noël, S.L.; Palomares, M.L.D.; Zhu, A.; Pauly, D. Fishing effort and associated catch per unit effort for small-scale fisheries in the Mozambique Channel region: 1950–2016. Front. Mar. Sci. 2021, 8, 1048. [Google Scholar] [CrossRef]
  67. Herrón, P.; Kluger, L.C.; Castellanos-Galindo, G.A.; Wolff, M.; Glaser, M. Understanding gear choices and identifying leverage points for sustainable tropical small-scale marine fisheries. Ocean Coast. Manag. 2020, 188, 105074. [Google Scholar] [CrossRef]
  68. Sadovy, Y. Trouble on the reef: The imperative for managing vulnerable and valuable fisheries. Fish Fish. 2005, 6, 167–185. [Google Scholar] [CrossRef]
  69. Silvano, R.A.M.; Hallwass, G.; Juras, A.A.; Lopes, P.F.M. Assessment of efficiency and impacts of gillnets on fish conservation in a tropical freshwater fishery. Aquat. Conserv. Mar. Freshw. Ecosyst. 2017, 27, 521–533. [Google Scholar] [CrossRef]
  70. Asche, F.; Garlock, T.M.; Akpalu, W.; Amaechina, E.C.; Botta, R.; Chukwuone, N.A.; Eggert, H.; Hutchings, K.; Lokina, R.; Tibesigwa, B.; et al. Fisheries performance in Africa: An analysis based on data from 14 countries. Mar. Policy 2021, 125, 104263. [Google Scholar] [CrossRef]
Figure 1. Schematic illustration of a gillnet assemblage. Illustrated from descriptions in [40,41,42].
Sustainability 14 02376 g001
Figure 2. Distribution and number of gillnet vessels targeting Nile perch at landing sites included in catch assessment surveys on Lake Victoria, Uganda. Data from LVFO Catch assessment survey.
Sustainability 14 02376 g002
Figure 3. Fishing vessel characteristics (a) total count of vessels on Lake Victoria Uganda grouped by mode of propulsion; (b) vessel count by mode of propulsion per target species (data only available from 2010 onwards). LVFO Frame survey data.
Sustainability 14 02376 g003
Figure 4. Gillnet meshes size distribution between motorized and paddled vessels over the study period. LVFO Catch assessment survey data.
Sustainability 14 02376 g004
Figure 5. (a) Average number of panels per gillnet, irrespective of either vertical or horizontal joining (b) modal distribution of gillnet panel vertical joining for the motorized and paddled vessels. The latter is specified in the CAS survey data. LVFO Catch assessment survey data.
Sustainability 14 02376 g005
Figure 6. Relationship between the number of gillnet panels and mesh sizes. Mean difference between gillnet panels and mesh size tested using ANOVA significant level at p < 0.05.
Sustainability 14 02376 g006
Figure 7. Fish catches (a) the average fish size (kg specimen−1) per mesh size, comparison of mean size of fish between mesh sizes performed using Analysis of Variance (ANOVA) and (b) fish catch (kg trip−1) in the different mesh sizes indicated with mean catch and ± standard error.
Sustainability 14 02376 g007
Figure 8. Relationship between gillnet panel and fish size. Mean difference between gillnet panels and fish size tested using ANOVA, significant level at p < 0.05.
Sustainability 14 02376 g008
Figure 9. Frequency distribution of the estimated average size of Nile perch in commercial catches between (a) Motorized fishing vessels and (b) paddled fishing vessels in the survey period.
Sustainability 14 02376 g009
Figure 10. Fish catch in terms of (a) kg per trip and (b) kg per hour fished in motorized and paddled vessels for the study period 2005–2006; 2010–2011 and 2014–2015. Mean catches per vessel are represented as mean and standard error.
Sustainability 14 02376 g010
Figure 11. CPUE per panel hours fished (a) measured as the catch per panel and (b) number of fish per panel.
Sustainability 14 02376 g011
Publisher’s Note: MDPI stays neutral with regard to jurisdictional claims in published maps and institutional affiliations.

